aquaculture, fisheries and the environmentoregonstate.edu/dept/iifet/naafe/hawaiiasche.pdf ·...
TRANSCRIPT
Aquaculture, Fisheries and the EnvironmentEnvironment
Frank Asche
NAAFE, 2011The Economics of Conflict and Co-existence in an
Increasingly Crowded Ocean"Increasingly Crowded Ocean

We like to think of fishing as traditional and romantictraditional and romantic,

..but there have always been conflictsconflicts…

even before the big guys showed up..even before the big guys showed up…

…and before one had to pay attention to these guysto these guys…

and these guys…and these guys…
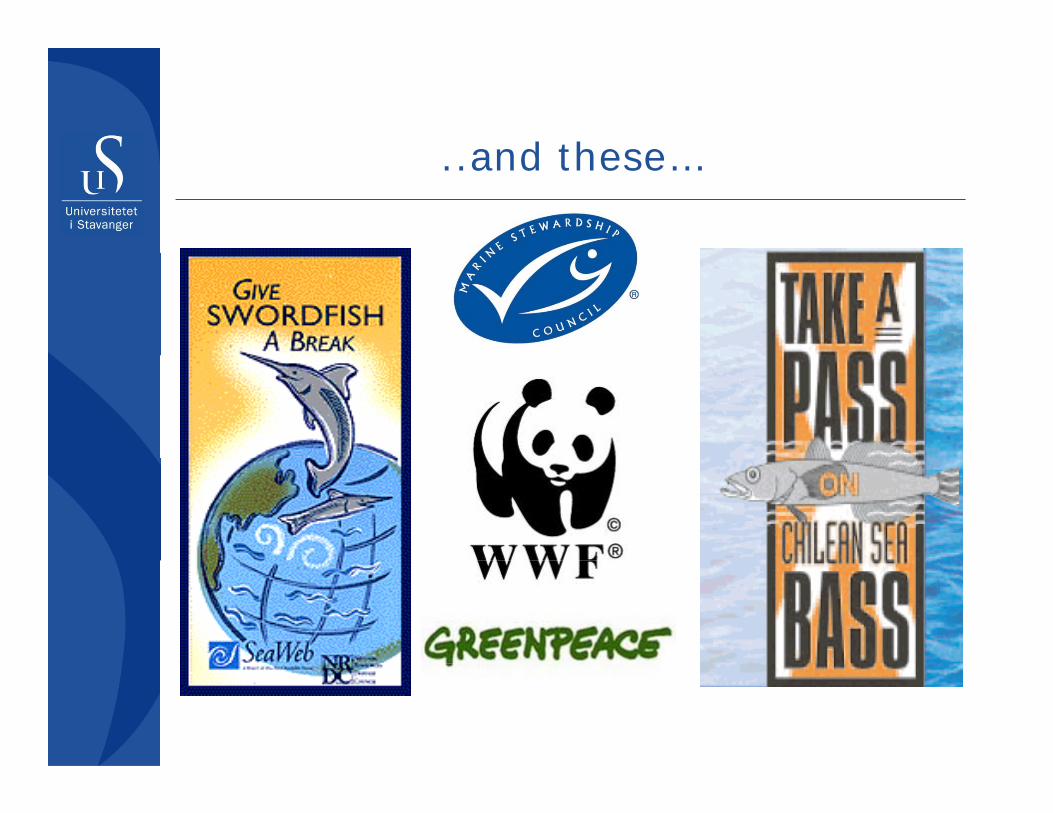
and these..and these…

The world’s oceans cover 2/3 of the planetplanet…

.. and is an under utilized resourceunder-utilized resource
• But pressure is increasingp g1. Because an increasing and wealthier global
population requires more resources
2. Because more people and companies realize the opportunities in the ocean and innovate to exploit themthem• The power block, Offshore drilling, Aquaculture,
Tourism• Globalization
3. The competition creates use conflicts, and these are exacerbated by groups of people who think we are exacerbated by groups of people who think we should not utilize the oceans harder

More people More people care!care!

Is the growth in aquaculture production good?production good?

Different perspectives on ocean useDifferent perspectives on ocean use
• Conflict arises because there is no Conflict arises because there is no general agreement about how the ocean’s resources should be used and to whose benefit
• More specifically, these conflicts are manifested through competing user
l d ( )interests, including no (new) use – i.e. conservationism

Hilborn: Pauly:
Kjell Bjordal’s examples of different perspectives:
Hilborn: Pauly:
• The state of the world’s fish stocks is better than it has been for decades
The world’s fish stocks are overfishedWe started out by fishing out the large
• We do not know any fish species driven to extinction by human activity
y g gvaluable species an will end up fishing jellyfish
80% of the Barent’s Sea stocks have
• The situation in the Barent’s Sea is better than for generations: International
80% of the Barent s Sea stocks have collapsed or a severely overfished
In 2010 we drove 1000-2000 ocean generations: International success story in fisheries management
species to extinction
Trawling kills eco-systems and everything within them
->There is a tremendous potential for increased aquaculture production
eve y g w e
Aquaculture production should be significantly reduced

Different perspectives on ocean useDifferent perspectives on ocean use
• There will always be a mechanism that There will always be a mechanism that balances the different interests– Different outcomes are possible depending on
h i d i i i d mechanism design, incentives and governance structure
• The tragedy of the commonsSh l d• Shrimp aquaculture and mangroves
• Economists can analyze the outcomes • Economists can analyze the outcomes of different structures– National measures– International organizations
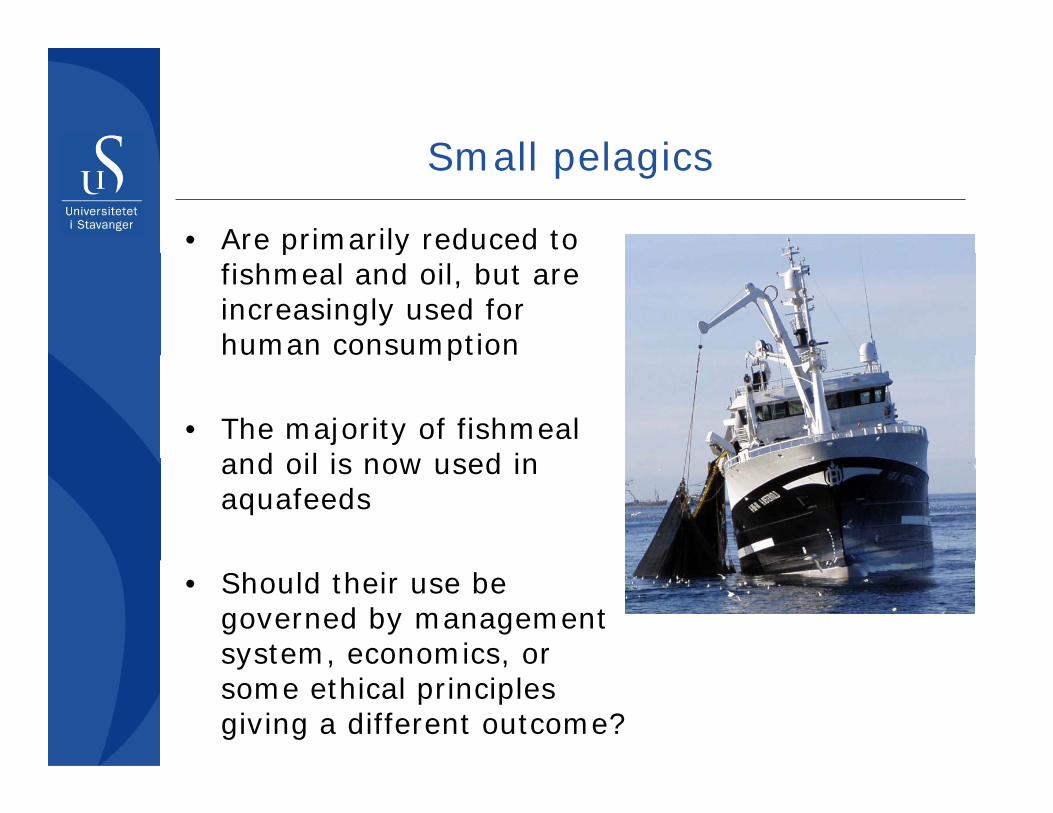
Small pelagicsSmall pelagics
• Are primarily reduced to p yfishmeal and oil, but are increasingly used for human consumptionp
• The majority of fishmeal and oil is now used in and oil is now used in aquafeeds
• Should their use be governed by management system, economics, or system, economics, or some ethical principles giving a different outcome?
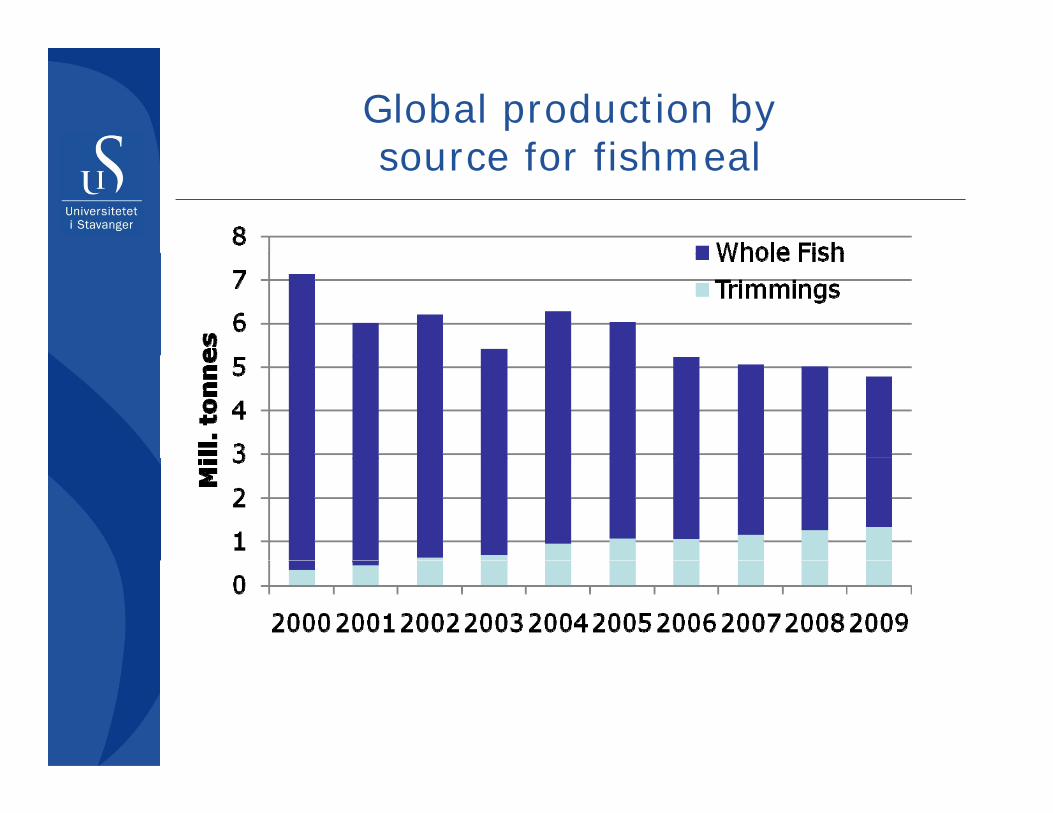
Global production bysource for fishmealsource for fishmeal

Total Norwegian landings and share used for reduction to fishmeal/oilused for reduction to fishmeal/oil

Norwegian landings and prices by use for spring spawning herringfor spring spawning herring
12004
800
10003
3,5Landings
Price, meal
Pririce, Human
600
800
1 5
2
2,5
000 tonn
es
NO
K/
kg
200
400
0,5
1
1,5 1,0N
00
,
19891991199319951997199920012003200520072009
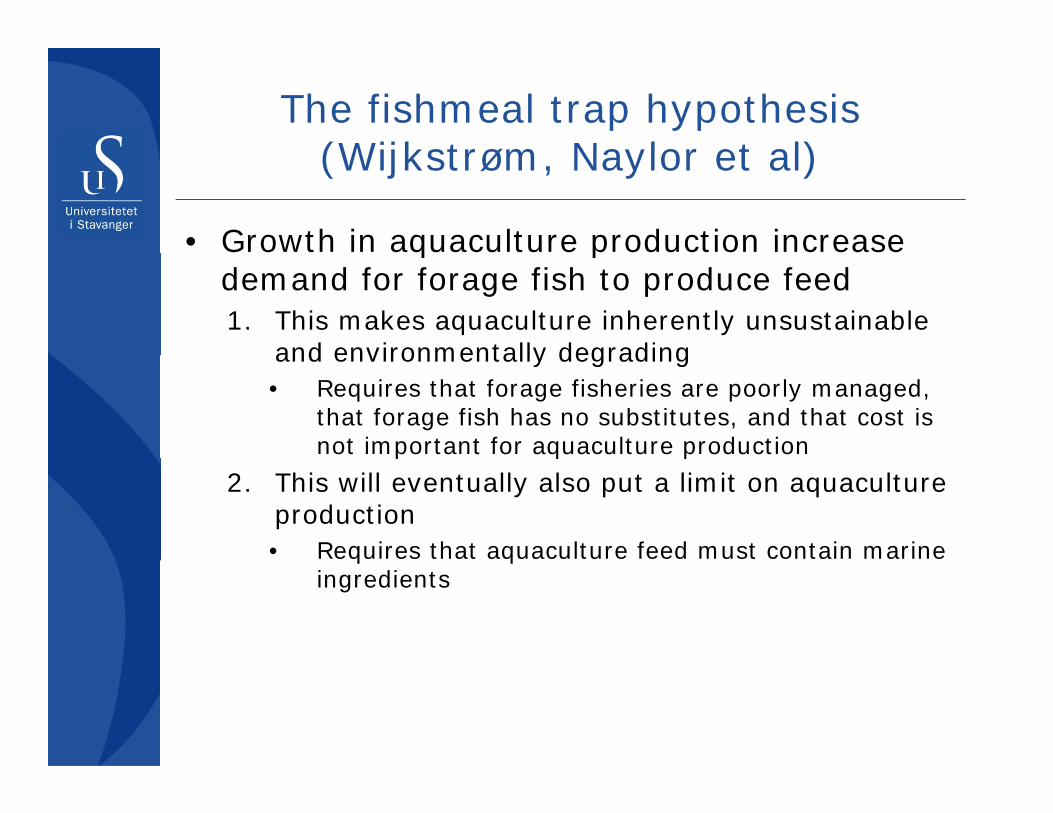
The fishmeal trap hypothesis (Wijkstrøm Naylor et al)(Wijkstrøm, Naylor et al)
• Growth in aquaculture production increase q pdemand for forage fish to produce feed 1. This makes aquaculture inherently unsustainable
and environmentally degradingand environmentally degrading• Requires that forage fisheries are poorly managed,
that forage fish has no substitutes, and that cost is not important for aquaculture productionp q p
2. This will eventually also put a limit on aquaculture production• Requires that aquaculture feed must contain marine q q
ingredients

Global aquaculture and fishmeal productionfishmeal production
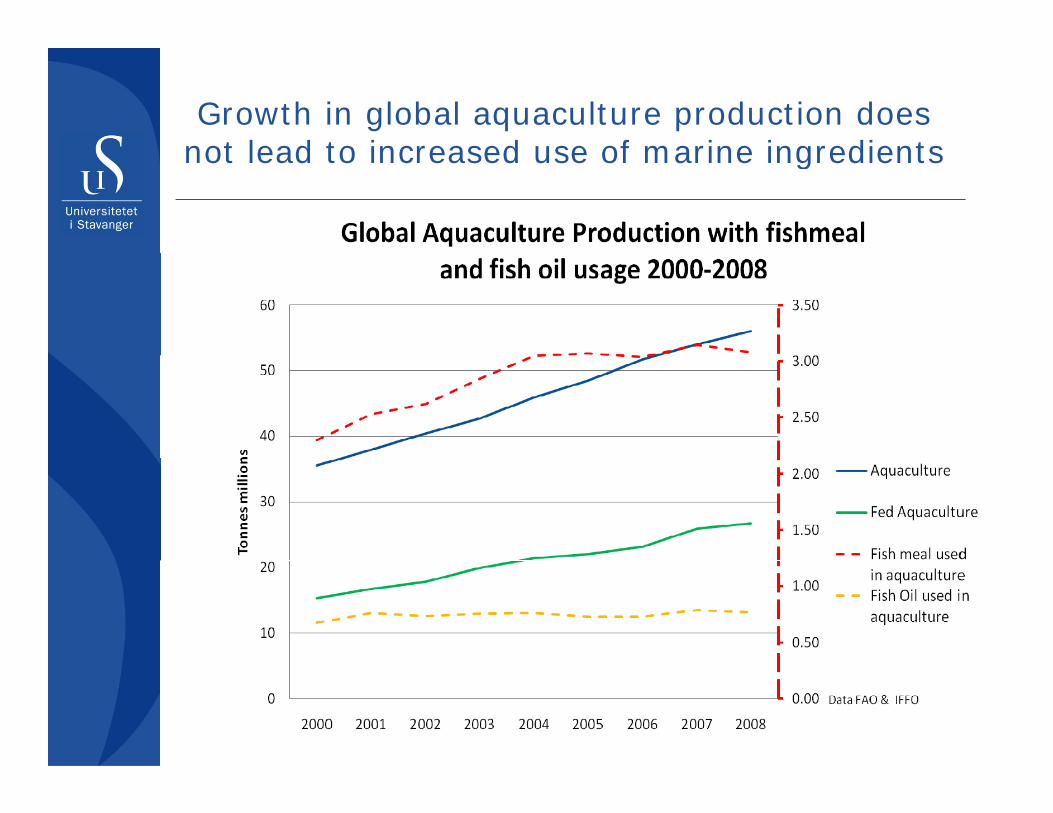
Growth in global aquaculture production does not lead to increased use of marine ingredientsnot lead to increased use of marine ingredients

Inclusion levels of fish meal and oil in salmon feed
Inclusion levels of marine ingredients in
salmon feed
35,0
Inclusion levels of marine ingredients in Salmonid diets
25,0
30,0
n
15,0
20,0
Dietary In
clusion
Fishmeal %
Fish OIl%
5,0
10,0
% D
0,0
2000 2001 2002 2003 2004 2005 2006 2007 2008

The fishmeal trap is a good story, but does
not hold up against the not hold up against the datadata
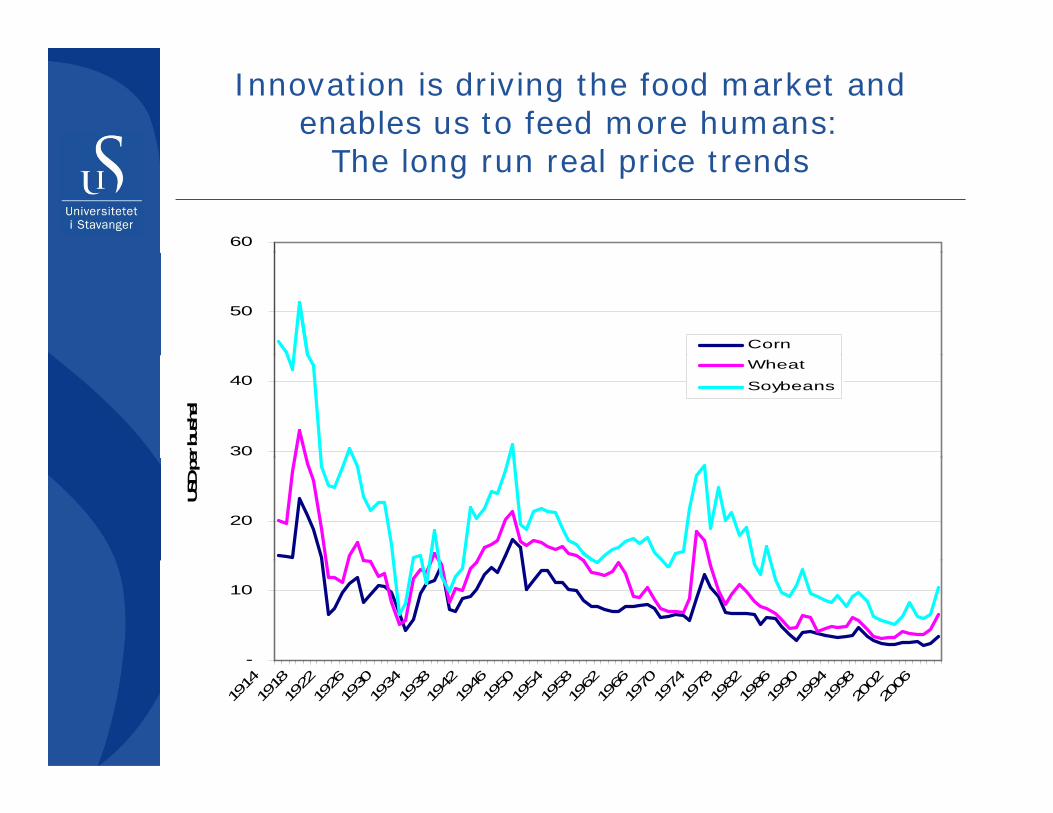
Innovation is driving the food market and enables us to feed more humans:
Th l l i t dThe long run real price trends
60
50
Corn
30
40
er b
ushe
l
Wheat
Soybeans
20
USD p
e
-
10
1914
1918
1922
1926
1930
1934
1938
1942
1946
1950
1954
1958
1962
1966
1970
1974
1978
1982
1986
1990
1994
1998
2002
2006

Real U S broiler pricesReal U.S. broiler prices
3 5
2 5
3
3,5
2
2,5
SD/lb
1
1,5U
0
0,5
947
950
953
956
959
962
965
968
971
974
977
980
983
986
989
992
995
998
001
004
1 1 1 1 1 1 1 1 1 1 1 1 1 1 1 1 1 1 2 2
25
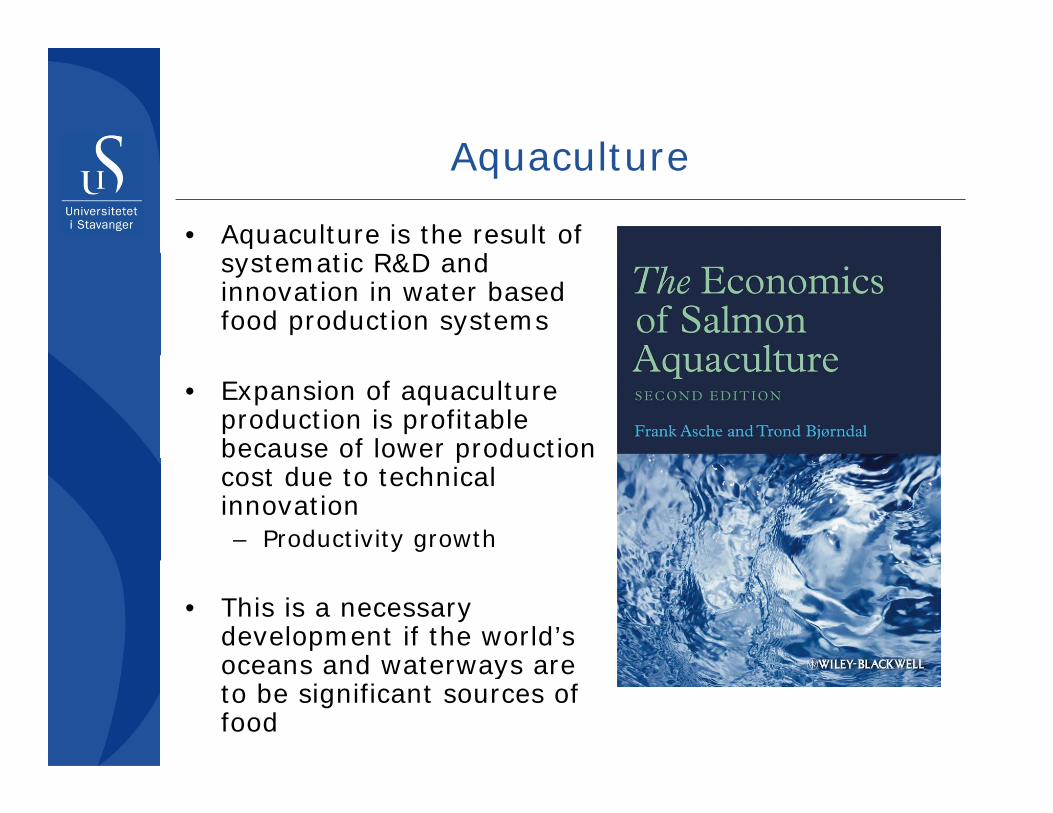
AquacultureAquaculture
• Aquaculture is the result of i R&D d systematic R&D and
innovation in water based food production systems
• Expansion of aquaculture production is profitable because of lower production pcost due to technical innovation– Productivity growth
• This is a necessary development if the world’s oceans and waterways are oceans and waterways are to be significant sources of food
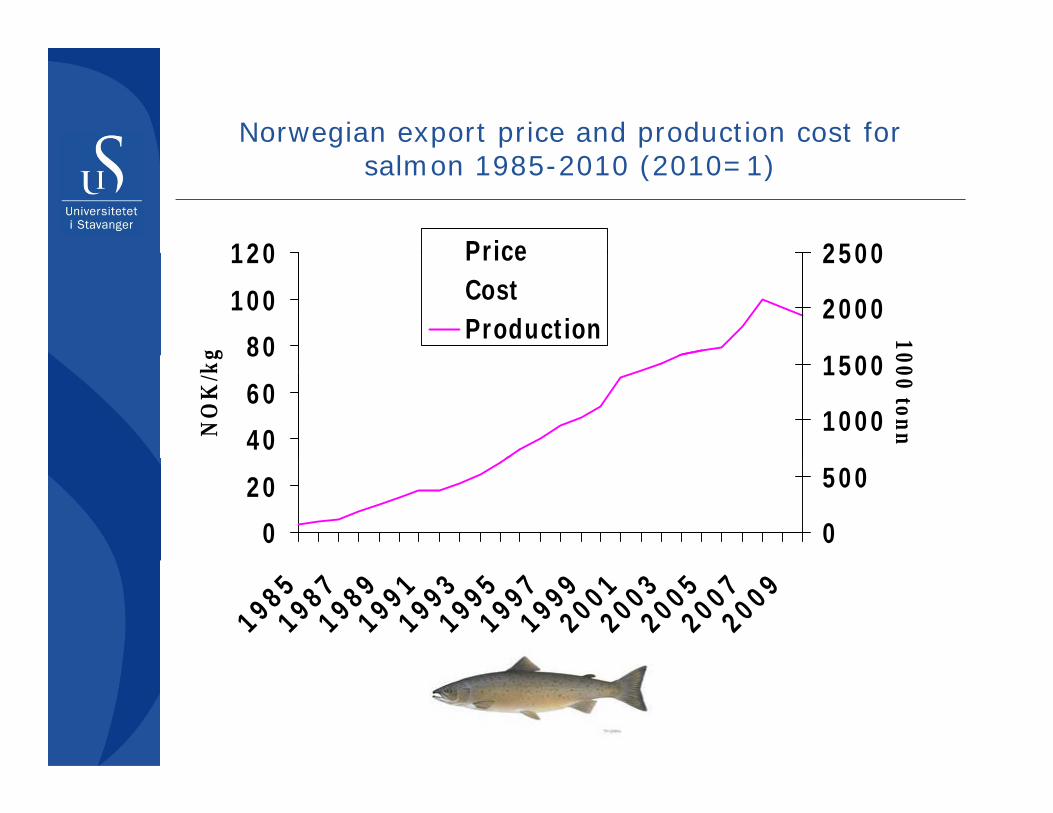
Norwegian export price and production cost for salmon 1985-2010 (2010=1)
120 2500Price
80
100
120
g 1500
2000
2500
10
PriceCostProduction
40
60
80
NO
K/k
g
1000
1500
000 tonn
0
20
0
500
1985198719891991199319951997199920012003200520072009

Norwegian export price and production cost for salmon 1985-2010 (2010=1)
120 2500Price
80
100
120
g 1500
2000
2500
10
PriceCostProduction
40
60
80
NO
K/k
g
1000
1500
000 tonn
0
20
0
500
1985198719891991199319951997199920012003200520072009

Norwegian export price and production cost for salmon 1985-2010 (2010=1)
120 2500Price
80
100
120
g 1500
2000
2500
10
PriceCostProduction
40
60
80
NO
K/k
g
1000
1500
000 tonn
0
20
0
500
1985198719891991199319951997199920012003200520072009
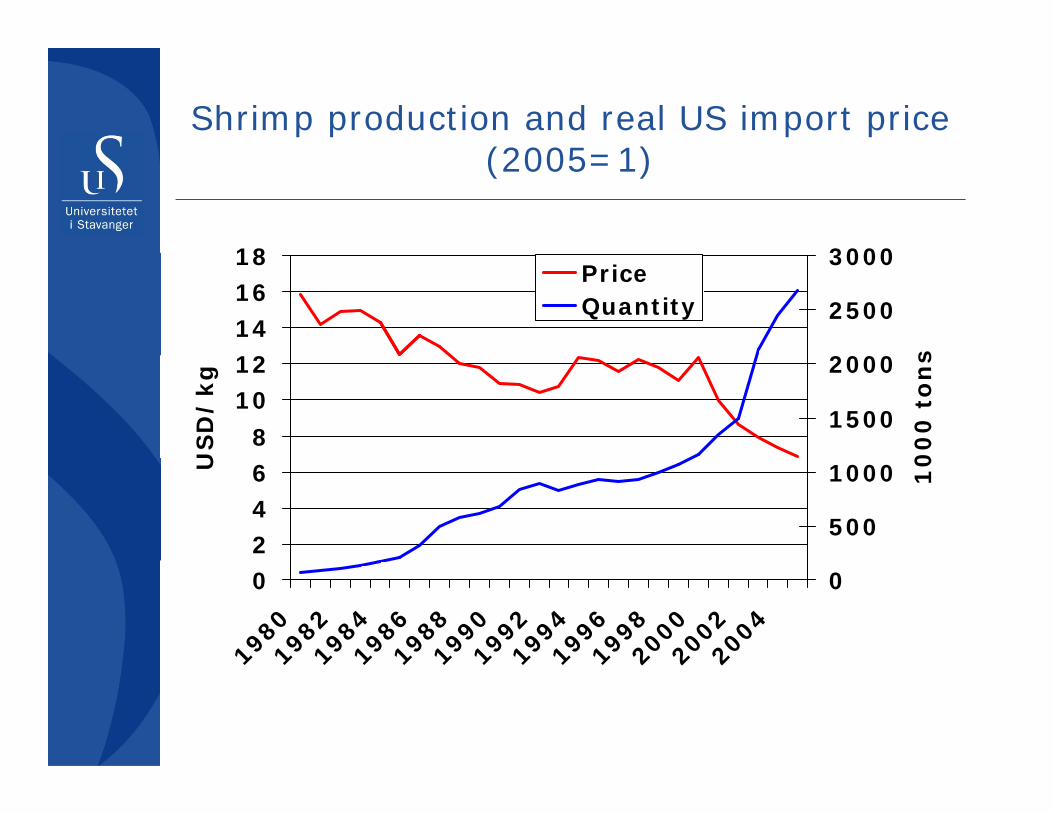
Shrimp production and real US import price (2005 1)(2005=1)
18 3000
12141618
2000
2500
3000
s
PriceQuantity
8
1012
US
D/
kg
1500
2000
00
0 t
on
s
246U
500
1000 10
0
1980
1982
1984
1986
1988
1990
1992
1994
1996
1998
2000
2002
2004
0
1 1 1 1 1 1 1 1 1 1 2 2 2
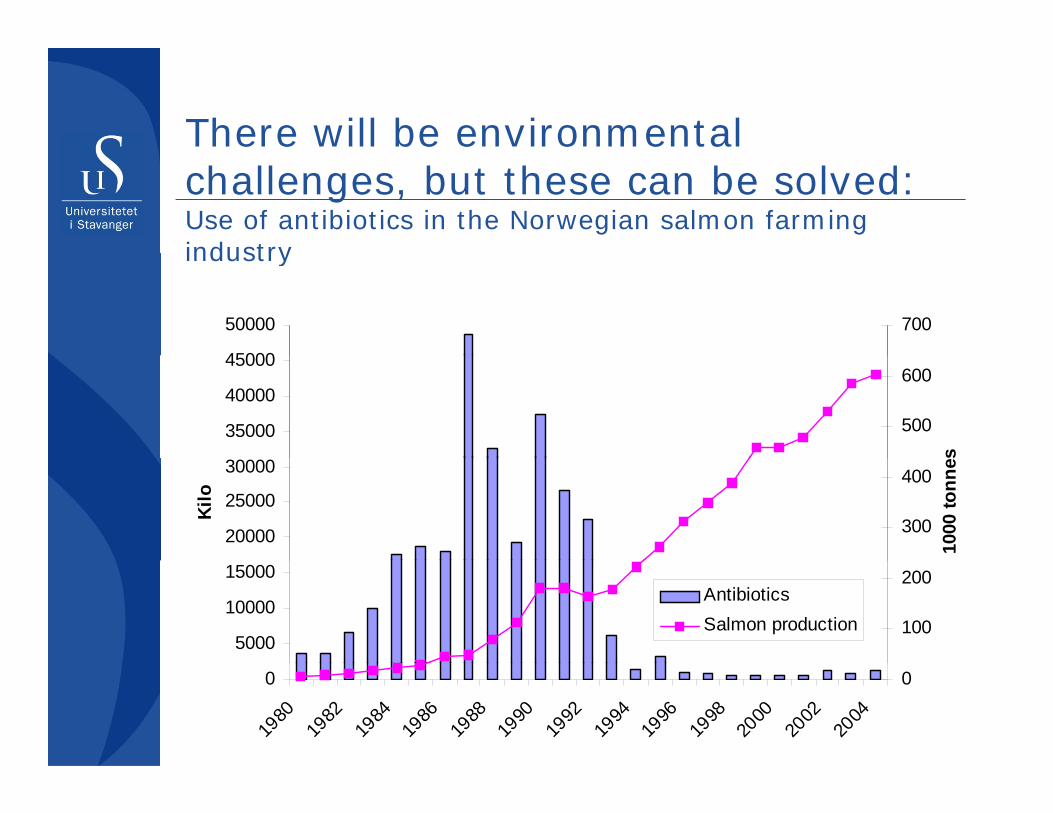
There will be environmental challenges, but these can be solved:Use of antibiotics in the Norwegian salmon farming industryindustry
45000
50000 700
35000
40000
45000
500
600
s
20000
25000
30000
Kilo
300
400
1000
tonn
es
5000
10000
15000
100
200AntibioticsSalmon production
0
1980
1982
1984
1986
1988
1990
1992
1994
1996
1998
2000
2002
2004
0
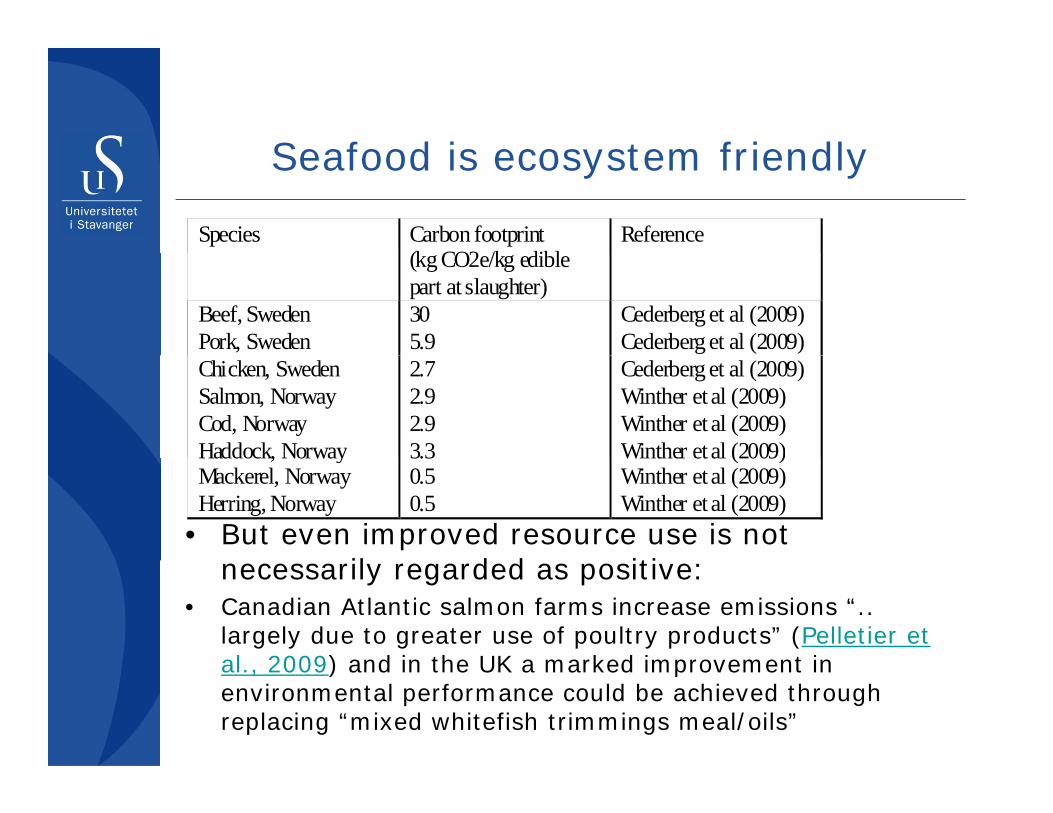
Seafood is ecosystem friendlySeafood is ecosystem friendly
Species Carbon footprint (k CO2 /k dibl
Reference (kg CO2e/kg edible part at slaughter)
Beef, Sweden Pork, Sweden
30 5.9
Cederberg et al (2009) Cederberg et al (2009)
Chicken, Sweden Salmon, Norway Cod, Norway Haddock, Norway
2.7 2.9 2.9 3.3
Cederberg et al (2009) Winther et al (2009) Winther et al (2009) Winther etal (2009)
• But even improved resource use is not il d d iti
Haddock, NorwayMackerel, Norway Herring, Norway
3.30.5 0.5
Winther et al (2009)Winther et al (2009) Winther et al (2009)
necessarily regarded as positive:
• Canadian Atlantic salmon farms increase emissions “.. largely due to greater use of poultry products” (Pelletier et al 2009) and in the UK a marked improvement in al., 2009) and in the UK a marked improvement in environmental performance could be achieved through replacing “mixed whitefish trimmings meal/oils”

Although some question our whole food production systemfood production system
T i l Museum of zoology – mutants’ roomToxic salmonBird flu
Stinky pig Mad cow

Trade and aquaculture change the market:New species in the whitefish marketp
ca 2005ca 2000ca 1995ca 1990ca 1900 - 1985
Until 1985Cod,
haddock, ith t
1990:Alaska Pollock
2005:Pangasius
2000:New warmwater species as
1995:HakeHoki
saithe, etc.Catfish
species as tilapia and Nile Perch

US imports of frozen whitefish, 1990-20082008(tonnes product weight)
350
400450
s
PangasiusRedfishSoleCod
200
250300
0 t
onne Cod
TilapiaPollockOrange roughyHaddock
50
100150
100 Whiting
HakeCatfishFlounders
050
1990
1992
1994
1996
1998
2000
2002
2004
2006
2008
Other
19 19 19 19 19 20 20 20 20 20

Competition from new species influence asset l d i i i ll ivalues and participation as well as prices
Bristol Bay sockeye (drift gillnet) from Valderrama and Andersony y ( g )
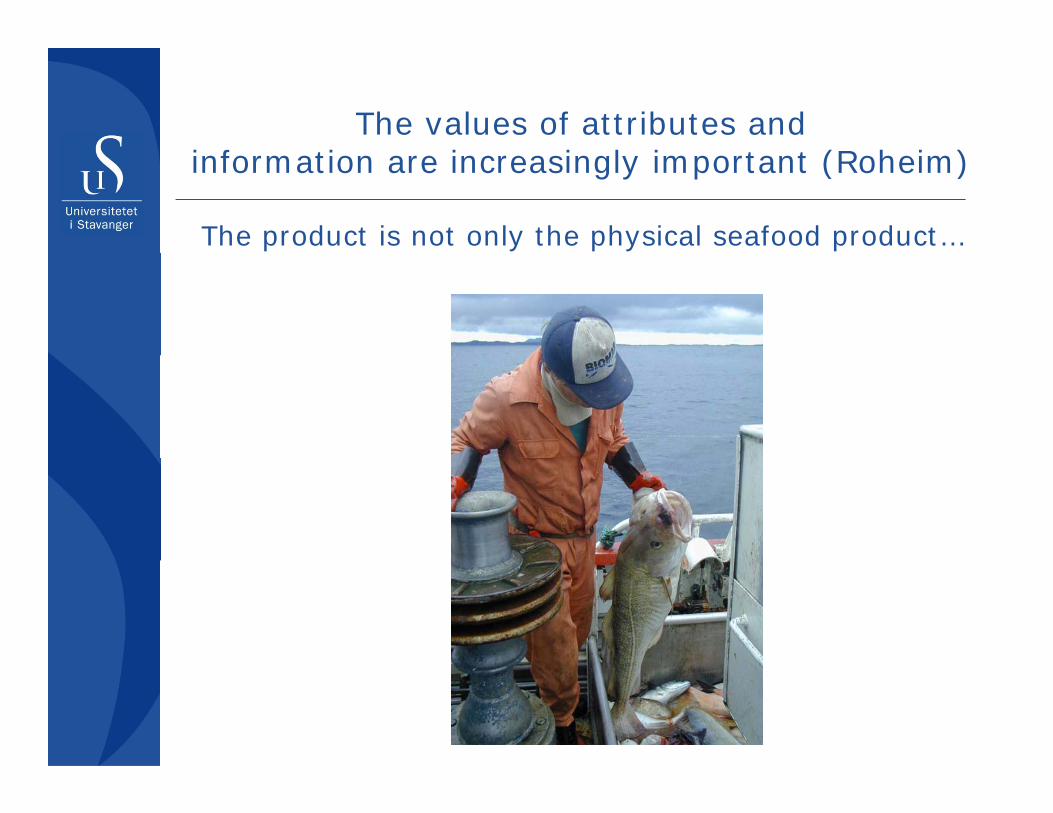
The values of attributes and i f i i i l i (R h i )information are increasingly important (Roheim)
The product is not only the physical seafood product…

b t l t f i l t d t…but also a set of services related to:
• Volume• Timing and frequency• Flexibility
C t ffi i i di t ib ti• Cost efficiency in distribution• Food safety• Harvesting technologyHarvesting technology• Ecolabel• etc.

b t l t f i l t d t…but also a set of services related to:
• Volume• Timing and frequency• Flexibility
C t ffi i i di t ib ti• Cost efficiency in distribution• Food safety• Harvesting technologyHarvesting technology• Ecolabel• etc.
• And each attribute creates a new potential line of • And each attribute creates a new potential line of conflict at the market place, in the supply chain and in the production or harvesting process

Governance (Smith et al 2010)Governance (Smith et al, 2010)• Not only the government, but also the industry
itself is responsible for good governanceitself is responsible for good governance
• The influence of other stakeholders on governance has increased over time– Competing economic interests, environmental concerns,
food safety concerns
• In a successful industry, governance cannot be too light not too heavy handedtoo light, not too heavy handed
• Governance should recognize structural changes in the industry
A d t t i ti d t i bl – And not prevent innovations and sustainable technological developments

It can take time to find a good governance system:fNorwegian landings of mackerel
1000
700
800
900
es
400
500
600
700
00
to
nn
e
100
200
300
400
1,0
0
0
100
1940
1944
1948
1952
1956
1960
1964
1968
1972
1976
1980
1984
1988
1992
1996
2000
2004
2008
1 1 1 1 1 1 1 1 1 1 1 1 1 1 1 2 2 2

It can take time to find a good governance system: Shrimp production, Thailand
600
400
500
nes
300
400
00
0 t
on
n
100
200
1,0
0
Source: FAO

One may never get there because governance is lax:Shrimp production, Taiwan
100
708090
nes
405060
00
0 t
on
n
1020301
,0
0

Or because governance prevents innovation and new technologies:
Salmon production, USA
25
20
nes
10
15
00
0 t
on
n
5
1,0
0

ConclusionsConclusions
• Conflicts in relation to the use of oceans are lik l t ti d i b th likely to continue and increase, because there are so many visions with respect to sustainable use– The importance of the oceans is likely to increase
as pressure on marginal lands continue to increase– No governance is likely to lead to the worst
outcome, e.g. open access
• A fundamental question is whether innovation and human ingenuity are to be allowed to play and human ingenuity are to be allowed to play their part
• Better and sustainable outcomes require analyses and trade-offs
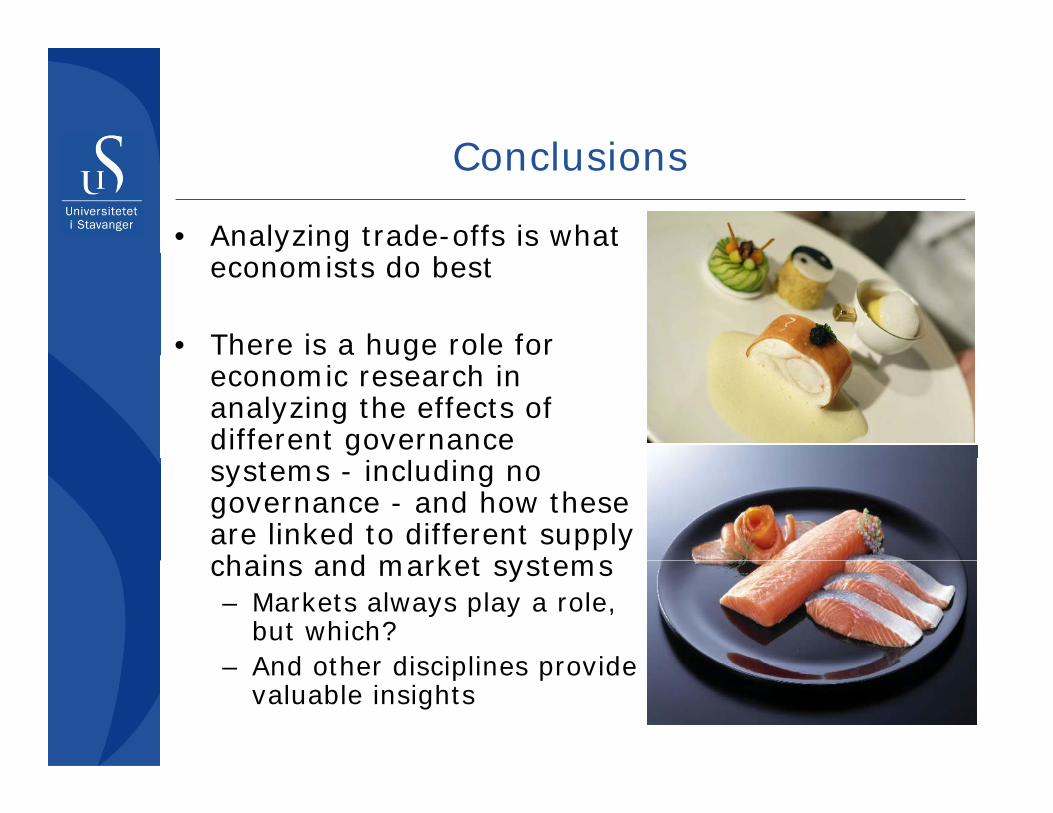
ConclusionsConclusions
• Analyzing trade-offs is what economists do best
• There is a huge role for geconomic research in analyzing the effects of different governance systems - including no governance - and how these are linked to different supply chains and market systemschains and market systems– Markets always play a role,
but which?And other disciplines provide – And other disciplines provide valuable insights
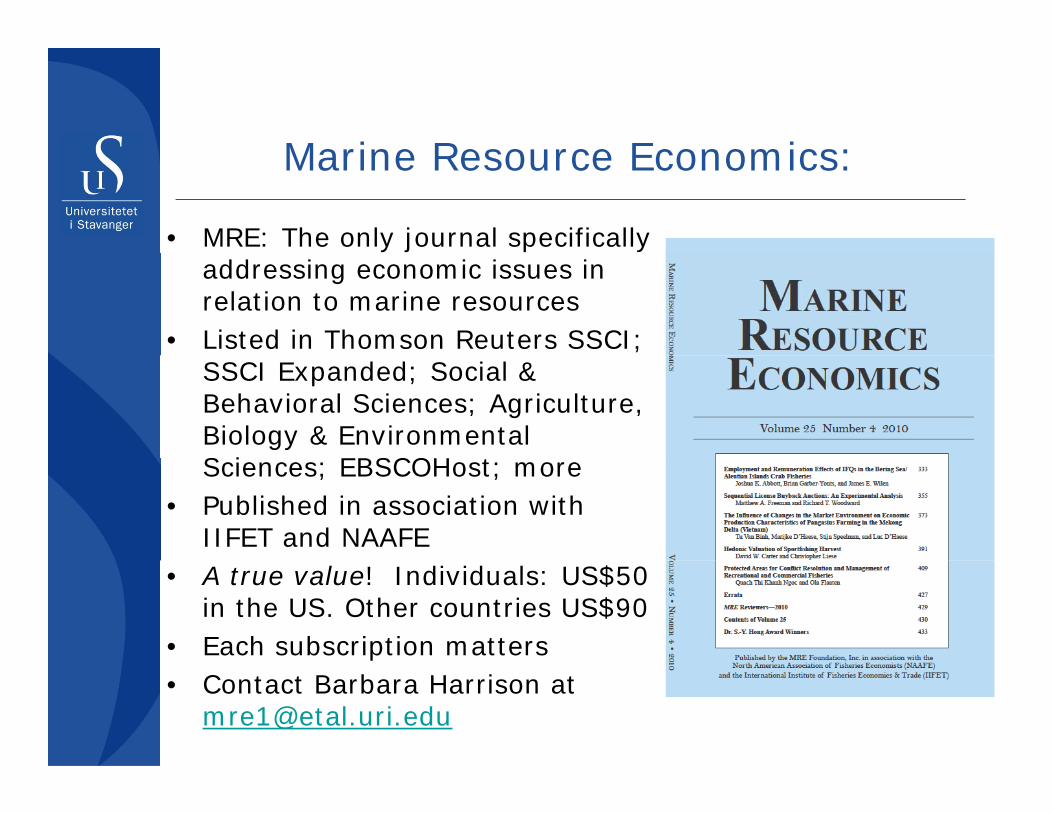
Marine Resource Economics:Marine Resource Economics:
• MRE: The only journal specifically addressing economic issues in relation to marine resources
• Listed in Thomson Reuters SSCI; SSCI Expanded; Social & Behavioral Sciences; Agriculture, Biology & Environmental S i EBSCOH t Sciences; EBSCOHost; more
• Published in association with IIFET and NAAFE
• A true value! Individuals: US$50 in the US. Other countries US$90
• Each subscription matters• Contact Barbara Harrison at