aqms-phase1
TRANSCRIPT

8/13/2019 aqms-phase1
http://slidepdf.com/reader/full/aqms-phase1 1/16
Autonomous Gas Monitoring System
Subject: Atmospheric Sciences
Duration in Months: 9 months(Sept'09-june'10)
Total Cost: Rs.2,65,000
Foreign Origin: Sensors
Project Category: Applied Research (Sensor technology,wireless data transfer, micro
controller)
Principal Inv.: Kunal Anand
Designation: btech student
Department: Electrical engineering
Institute Name: Indian Institute of Technology, Kanpur
Date of Birth: 25-7-1990 Sex (M/F): M
Telephone: 9616242124
E-mail Id: [email protected]
Address: H-313,hall-9
Secondary Inv: 1. Vivek Goel (ce)
2. Himanshu Malaiya(chm)
3. Arpit Sahu(phy)
4. Rohit Kumar(ee)
5. Vipul Niranjan(ee)
6. Himanshu Agarwal(chm)
7. Ankur Gautam(ee)
Project Summary:
Abstract: Proposal describes the design of Ambient air quality monitoring system that can continuouslytrack certain environmental parameters.

8/13/2019 aqms-phase1
http://slidepdf.com/reader/full/aqms-phase1 2/16
Aspects:
Power consumption: Successful autonomous system must have low power consumption balanced by its capability to scavenge energy from its immediate environment.
Power consumption: 5 sensors( 5*400 mW)+ 5 micro controller or micro processors(5*5V*10mA=250 mW)+ motor for sampling tube(1 W) =3.25 WPower provided by solar cell = 20 watts under winter time solar light
Display unit and other units power will be supplied through power unit nearby.
Robustness: The system will need to be resistant to the elements through encapsulation in arugged casing that will ensure the system is resistant to shattering, water and vandals.
Data input-output: At the location of sensor, the Gas sensors will measure the concentration ofGas at that point. MCU over there will process the voltage output and return a string containingthe information about the concentration of different gases. In the initial phase of our project, wewill send this data to base station by using the most useful feature of GSM protocol i.e. ShortMessage services (SMS) at regular interval. Server will store this data.
Sampling: Samples must be representative and the sampling ideally should not disturb the lastsample. High sampling rate results in high consumption of power while low sampling rate canresult in missing of event of interest. So ideally 3-4 samples a day can save us from thiscompromising situation.
Working module:Work divided into two important phases
Phase 1:
1. Development of sensors monitoring unit and the display unit in laboratory. Following features ofsensors used to be taken into account:
1. High sensitivity to the applied gas or environment parameter.2. Stable and long life.3. Dimension: Dimension must be small to keep the size of unit under control (gas sensor:diameter~16 mm, hieght~ 10 mm, pressure and humptemp sensor: hieght~ 10mm, length and
breadth~ 10 mm)
Features of sensors we are using:
OZONE DETECTING SENSOR
For ozone detection we are using MQ -131 sensor
USEFUL LINK
http://www.futurlec.com/Ozone_Gas_Sensor.shtml

8/13/2019 aqms-phase1
http://slidepdf.com/reader/full/aqms-phase1 3/16
This will directly be attached to atmega-32 microcontoller whose base program will be written onCVAVAR using C++ for coding purpose.
AtMEGA-32 datasheet
ALOGORITHM
8/13/2019 aqms-phase1
http://slidepdf.com/reader/full/aqms-phase1 4/16
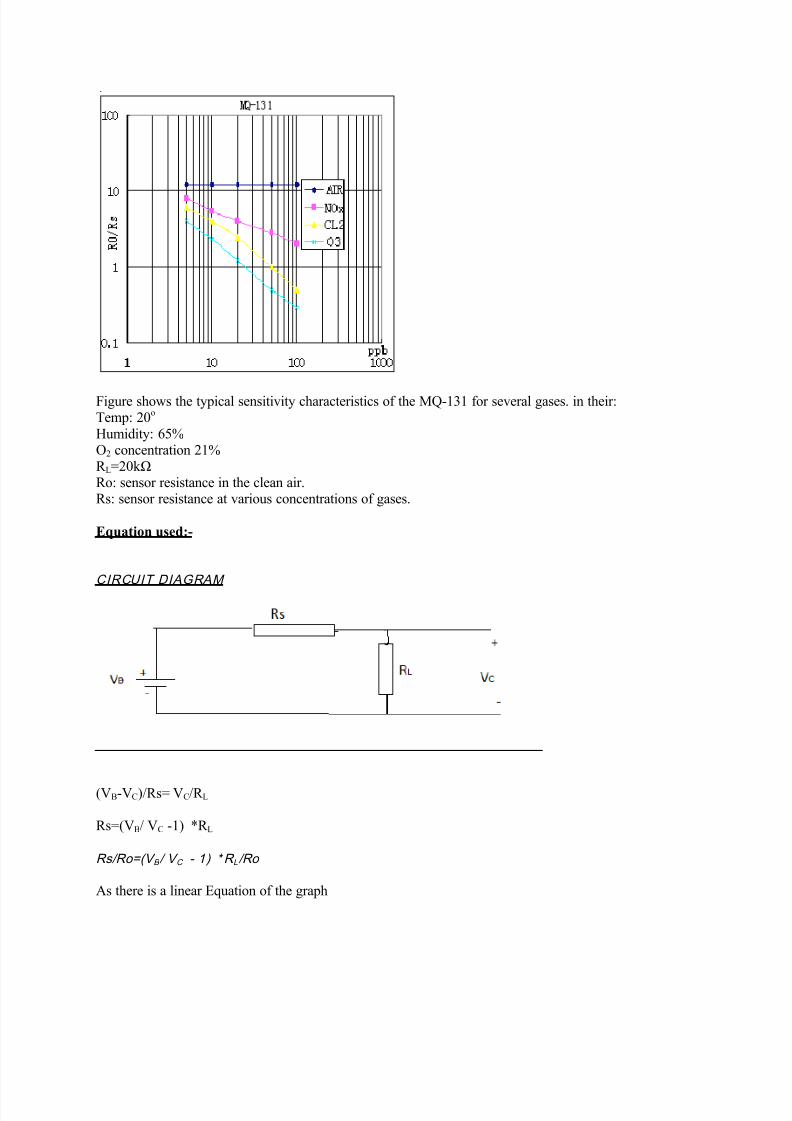
Figure shows the typical sensitivity characteristics of the MQ-131 for several gases. in their:Temp: 20 o
Humidity: 65%O2 concentration 21%R L=20kΩ Ro: sensor resistance in the clean air.
Rs: sensor resistance at various concentrations of gases.
Equation used:-
CIRCUIT DIAGRAM
(V B-VC)/Rs= V C/R L
Rs=(V B/ V C -1) *R L
Rs/Ro=(V B / V C - 1) * R L /Ro
As there is a linear Equation of the graph

8/13/2019 aqms-phase1
http://slidepdf.com/reader/full/aqms-phase1 5/16

8/13/2019 aqms-phase1
http://slidepdf.com/reader/full/aqms-phase1 6/16
In the figure we will connect ‘Vout’ to input of adc into the microcontroller where we will keep the adcinto free running whre it will take the input continuously according to its frequency. We can monitoroutput of 8 gas sensors using a single mcu (Atmega 16).
Algorithm (
Variable a;
a=read_adc (pin x); // if we are using a 8 bit microcontroller a will be a value between 1 to 256depending upon Vref
Voltage ‘v’= (a/256)*Vref;
According to this data of ‘v’ we will calculate the value of gas concentration using relation of electrolyticoxidation/reduction.
We will take average of such values during an hour maybe.
Then this average value of gas concentration will be transmitted for further analysis using wirelesstransmitter.
)
Note: here adc will take approximate values of the voltage (according to its least count) which mightresult in variation in actual results but we will average out the error. Also I am thinking to use somethingelse for reading the analog value of voltage directly and using it for much accurate results.
For such a large averaging time we might have to use microprocessor, we will see it later.
3. Data Transmission: As for our plan, we will be installing the gas sensors at suitable locations, but will have a single base station with a server to collect data, process and store them and accordinglysend appropriate command to a particular unit if needed. To accomplish this, here comes the role of Datacommunication. In this section we will be mainly using two modules: GSM Modem and Transceivers.
0BGSM MODEM
GSM (Global System for Mobile Communications ) is the most popular standard for mobiletelephone systems in the world. 80% of the global mobile market uses GSM standard. GSM also
pioneered low-cost implementation of the short message services (SMS), also called text messaging,which has since been supported on other mobile phone standards as well. We will be using this feature ofGSM protocol to transfer the data to and fro from sensor location to the server.
At the location of sensor, the Gas sensors will measure the concentration of Gas at that point. MCUover there will process the voltage output and return a string containing the information about theconcentration of different gases. In the initial phase of our project, we will send this data to base station
by using the most useful feature of GSM protocol i.e. Short Message services (SMS) at regular interval.Server will store this data.

8/13/2019 aqms-phase1
http://slidepdf.com/reader/full/aqms-phase1 7/16
This service can also be used by server to command any one of the unit to do work, other than theirnormal work. In general there is not much fluctuation in the concentration of the air at anyplace, unlesssomething goes wrong in the surrounding. So, in normal condition we will take the sample of gas at largerintervals to save the energy used. In case the server finds a large change in concentration of the gas fromthe normal value, it can send overriding command to the sensor to take samples at lower interval of time.
We will also provide the facility of providing this valuable information to the general public, sothat they can be aware of degrading environment and take step to minimize the pollution at their level. Alittle contribution from all can help in improving the current or the more worst coming environmentalcondition. For this they need to send a SMS to a particular number in a particular format, defining thelocation for which they want the data. Server will look for the data at that location and send back the SMScontaining the information about the Gas condition over there.
1BTRANSCEIVER
In India, there are still places where there is no GSM connectivity. Other than those remotelyinaccessible villages, we may also want to install the Gas sensor in the areas such as mining locations.How to transfer data at these places? For this we have thought of using Transceiver. A Transceiver has atransmit side (Tx) and a receive side (Rx), which are connected to the antenna. This operates on afrequency of 2.4 Ghz. One of the transceiver will be located at the sensor site and the other on the nearestsite, where there is a good GSM network signal strength (let’s call it sub -station). This will constitute itsown network. Instead of SMS now data from the MCU can be sent through this pair of Transreceivers.Depending upon the distance between the sub-station and the Gas sensor; and the range of transreceiverused there may be a chance of deporting additional transceiver. Transceiver used by us is: 24XStream,50mW transceiver, w/MMCX, 19200 bps part number X24-019NMC. Now at sub-station, we will alsohave a GSM modem. Data received through transceiver will be sent to server through SMS by GSMmodem. Rest all will be the same. In this fashion we can cover the whole terrain.
2BWhy GSM is preferred over Transreceiver
This is entirely to reduce the project cost. In GSM system we are using the already network ofGSM service provider, in lieu of a very small charge. If we use the transreceiver, whole the way, we willhave a very large establishment cost and also we will have to incur maintenance cost.
4. Display Unit: Following factors to be kept in mind while with LED display:- Outdoor display- The placement of the led display will affect the minimum and mega mum viewing distance.- Contents on the display in running mode and the type of content to be displayed, in our case itsmostly text or numerical type.
Specification of display unit given below:

8/13/2019 aqms-phase1
http://slidepdf.com/reader/full/aqms-phase1 8/16
LED DISPLAY (DOT-MATRIX DISPLAY)
A dot matrix display is a display device used to display information on machines, clocks, railwaydeparture indicators and many and other devices requiring a simple display device of limited resolution.The display consists of a matrix of lights or mechanical indicators arranged in a rectangular configuration(other shapes are also possible, although not common) such that by switching on or off selected lights,text or graphics can be displayed. A dot matrix controller converts instructions from a processor intosignals which turns on or off lights in the matrix so that the required display is produced. We are usingDot-matrix display to display the current composition of gases, day's max & min content of certain gasesand certain informative texts.
We are using 120*8 matrix display.
One or more dot matrix display is multiplexed to form a display panel. A set of hex values define a
character which are send to the dot matrix display. To minimize the pin usage led matrix is formed having
certain number of rows and columns. The concept is to refresh each display unit with a frequency at
which human eye cannot perceive changes.
Dot matrix displays are available with common cathodes as the columns and common anodes as the
columns. The led ’s may be single color, bi-color or RGB.
Example of how dot matrix circuit looks like
Here we are interfacing 5x7 dot matrix display with common cathode columns and having bright red
led’s. The cathodes are shorted along the column and anodes shorted along the row.5x7 dot matrix display
needs 7 Row drivers and 5 Column drivers.

8/13/2019 aqms-phase1
http://slidepdf.com/reader/full/aqms-phase1 9/16

8/13/2019 aqms-phase1
http://slidepdf.com/reader/full/aqms-phase1 10/16
The transistors are turned on by the TTL voltages applied by the Port 2 of MCU to their bases through 1-kilo ohm resistors. To make any led segment glow just make the respective row and column bits on. Wesend the hex value of character to be displayed in first column to Port2 and send columns selection byte toPort1.Then we send another hex value to row and select the respective column. This process is done veryfast and it seems that the whole character is displayed at the same time.
We are making a 120*8 resolution dot matrix, so it is impossible to build such display with havingaddress to each LED individually, which would be near impossible for a display with more than just a fewLEDs. One of the first ways we might have thought of to do this is to put enough shift registers on displayto hold a bit for every LED. Then, connect the cathodes to the appropriate bit of the right register, andalso connect all the anodes to positive voltage. To display something on dot-matrix display, we'd just shiftin the data one bit at a time for the entire sign.

8/13/2019 aqms-phase1
http://slidepdf.com/reader/full/aqms-phase1 11/16
This would work, and it might even do a decent job at it. But there are a few problems with it. First, itrequires a chip for every four or eight LEDs. Second, it probably won't be very bright since our registermight only be able to sink of few mA of current per pin.
The solution to both of these problems is quite simple. We can take advantage of "persistence of vision,"which means that if you display several things very quickly, your eye will act as if they all were displayedsimultaneously. This is how televisions appear to be displaying an entire picture when it's really only anelectron beam displaying a single point at a time.
Instead of every row always displaying its data, we can display the data only for a single row at a time, but cycle through all the rows very quickly. We connect a single shift register output to all the cathodes ina column. Then, to display the row we want, only one row is connected to +5V at any time. We canaccomplish this with a ring counter, so that only one row is logic "1" at any given time.
We've made a simple schematic for running an 8x8 grid of LEDs using a de-multiplexer, some inverters,and a shift register. The two input lines to the de-multiplexer decide which row will be illuminated. Then,we use the clock and shift register input to move your data into the shift register. The transistors allowmore brightness, and they also invert the shift register outputs.
Phase 2:
1. Sensor fixed at certain location inside the campus.
2. Data retrieved from sensor unit will be transferred to the main server through gsm ortransreceiver.

8/13/2019 aqms-phase1
http://slidepdf.com/reader/full/aqms-phase1 12/16
3. Server will analyze and archive the data and would relay the processed data back to the respectivedisplays.
4. Archived data would be processed to keep record of the maximum and minimum amount of thevarious gas parameters and will display it.
Design:
System consists of three parts:
1. Sensing chamber : It consist of :I. Sampling Cell: Basically it will be plastic tube connected to a motor which will take the air
sample in it and it will be closed at both ends with a valve which will open only while taking thesamples. Sample will be taken such that two consecutive samples will not disturb the reading ofeach other. We will take each sample after one or two hour and will turn off the motor so it willnot affect next reading. In the figure 2 is sampling tube and 3 is the motor driving it.
II. Sensors: Electrochemical sensors detect gases by producing a chemical reaction between the gas being measured and oxygen contained in the sensor. This reaction produces a small current,which is proportional or substantially proportional to the concentration of the polluting gas
present. The sensor is, in effect, a type of fuel cell. In our design sensors will be embedded in thesampling tube. In figure, 1 and 4 are sensors and there electrical units. Parameters for the gases to
be detected are taken according to the recommendation of CPCB:Parameters Least count of Instruments(in ppm)CO 10SO2 5
NOx 10 NH3 10Pressure 300-1100hpa
III. Integrated Chip’s : These are designed to convert output from sensor(i.e, in the form of thecurrent produce on the electrodes of the sensors which will be collected by the IC’s ) to someform(such as digital signal) that is easy to transfer through transmitter.
IV. Battery: Batteries are used for the working of the sensors. We will use solar cell to charge the batteries. We are using 20V batteries and one 20W solar panels for a single unit.
V. GSM OR Transreciever: It can transfer data at 1kbps within range of 10 km for transreceiver andanywhere with network connection through GSM. Transmitter will transfer the data after eachsampling to the display unit where it will be received by the receiver antenna and will bedisplayed on the board.
VI. Box: The above all part will be tightly packed in a box which is water resistant thermal resistanceto some extent. All the above procedure is automated.

8/13/2019 aqms-phase1
http://slidepdf.com/reader/full/aqms-phase1 13/16

8/13/2019 aqms-phase1
http://slidepdf.com/reader/full/aqms-phase1 14/16
Objectives1. To develop device able to monitor certain atmospheric components and transfer the
datas continuously for the display.2. To determine status and trends of ambient air quality.3. We can share certain details with agencies like Town and Country Planning Department,
Kanpur Development Authority etc engaged in pollution control in Kanpur.
Review of status of Research and Development in the subject:
National Status
In Kanpur, monitoring of PM10 is being conducted with the objective to determine statusof PM in ambient air of Kanpur and to assess the content of sulphate in PM under the World Bank AssistedProgram.The monitoring was started at 6 locations in Kanpur in July 2000 by CPCB and in September2000 by the National Environmental Engineering Research Institute (NEERI) at three locations.
Many companies and research laboratories giving latest development in the field of gasmonitoring and sensing. eg- Pollution protection systems Mumbai Pvt.Ltd.,India BigPatent etc.
Central Pollution Control Board is executing a nation-wide program of ambient air qualitymonitoring known as National Air Quality Monitoring Programme (NAMP). The networkconsist of 342 operating stations covering 127 cities/towns in 26 States and 4 Union Territories of thecountry.
International Status 1. Safegas is the favored human machine interface for mine gas monitoring systems in Australia
and New Zealand because it provides a user friendly, Windows based front end that iscompatible with a range of tube bundle and real-time telemetric hardware and is scalable tocater for future system expansion. Features include alarms raised on gas values, explosibility,gas ratios, rates of change and hardware faults. The Safegas system has various security levels,audit trails, automated calibration and is highly user customizable.
2. Monitoring landfill gas migration. Landfill gas monitoring is the process by which gases thatare released from by decomposition of biodegradable waste in anaerobic environment areelectronically monitored.
3. Dr.R Kumar of University of Cambridge intended to develop a solid state electrolyte usingsoftware with fuzy logic and neural network properties such that the system capable of learninggas profiles & overcome problems of cross sensitivity.
4. Uni. of California: Developing mass spectrometer for gas monitoring.
5. World Academy of Science: Development of autonomous gas monitoring system with thehelp of GSM and Blue tooth services. Infrared sensing technology is being used for monitor ofgreenhouse gases like CH4 and CO2 at point sources.
Importance of the proposed project in the context of current status:
. India lagging far behind in gas monitoring technologies. Municipalities and Govt. authorities notworking as par as expectation, making people aware might pressurized them to work.

8/13/2019 aqms-phase1
http://slidepdf.com/reader/full/aqms-phase1 15/16
. Providing such a device at affordable prices so that factories, municipals, researchers etc caneasily have access to certain datas of their interest.. "The UK Government's chief scientist now says climate change is a far worse danger than international
terrorism" (BBC News, 10 Jan 04). Environmental phenomena are a major scientific and societal concern:
– Pollution – Water – Climate
. Information technology, communications and sensing are enabling technologies
. Due to current technological changes, there will be a watershed phenomenon in – Ability to monitor – Price point – Infrastructure – Data processing
Future Prospects: Gas sensing and Monitoring device may be available in the market at affordable prices so that
factories, municipals, researchers etc can easily have access to certain datas of their interest.
Can be developed for monitoring of Landfill Gas Monitoring with a very little advancement. Can be developed for volcanic prediction using gas chemistry in a safer way by modifying thedesign and robustness of device.
Wireless sensor networks can be used to measure and monitor the water levels within all groundwells in the landfill site and monitor leachate accumulation and removal. A wireless device andsubmersible pressure transmitter monitors the leachate level.
Using wireless sensor networks within the agricultural industry is increasingly common. Gravityfed water systems can be monitored using pressure transmitters to monitor water tank levels,
pumps can be controlled using wireless I/O devices, and water use can be measured andwirelessly transmitted back to a central control center for billing.
Cost Analysis(a single device):
Projected cost including :
sensors(8 pieces: 5 gas sensors + 3 other sensors) ~ Rs 6,000
microcontroller unit + transmitter-receiver system ~ Rs15,000
+ solar cell +sampling chamber + 2 batteries
server ~ Rs 20,000
LED display ~ Rs 5,000
Total cost ~ Rs 46,000
Problems to be tackled: Working of sampling tube: For each sample to be representative valve should be automatically
working and pump should be working all time.

8/13/2019 aqms-phase1
http://slidepdf.com/reader/full/aqms-phase1 16/16
Data transmission: difficulty will rise in transmission of data if transmitter put inside the sealed box.
Data losses: Information losses might occur during transmission ; can be corrected by putting amicrochip of certain which can store data and transmit it a while later.
Sampling chamber: polycarbonate chamber can be used for our requirement
Progress in the project:1. Purchasing has been done for one unit of the device2. Data transmission working and solar cell working has been checked.3. One display unit board has been in progress.4. Trying to apply for Tepp funding for our project5. Programs have already been written for few of the sensors.