april 28th, 2010 grupo antena 3 1q10 results. 2 antena 3 – 1q10 results highlights spanish tv ad...
TRANSCRIPT

April 28th, 2010
GRUPO ANTENA 31Q10 RESULTS
2 Antena 3 – 1Q10 Results
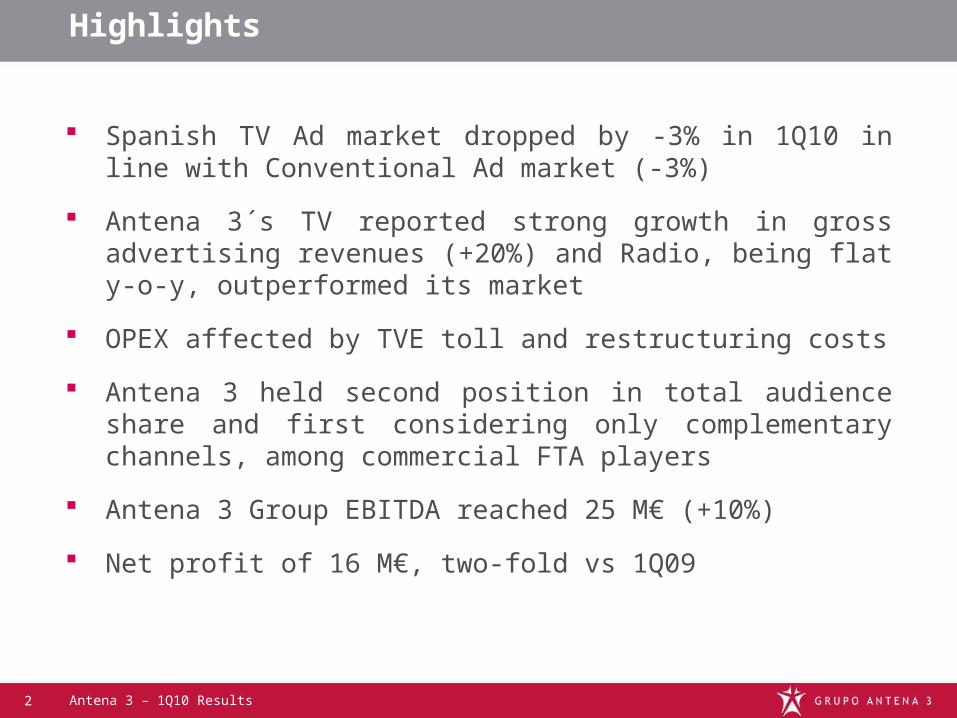
Highlights
Spanish TV Ad market dropped by -3% in 1Q10 in line with Conventional Ad market (-3%)
Antena 3´s TV reported strong growth in gross advertising revenues (+20%) and Radio, being flat y-o-y, outperformed its market
OPEX affected by TVE toll and restructuring costs
Antena 3 held second position in total audience share and first considering only complementary channels, among commercial FTA players
Antena 3 Group EBITDA reached 25 M€ (+10%)
Net profit of 16 M€, two-fold vs 1Q09

3 Antena 3 – 1Q10 Results
1Q10 FINANCIAL SUMMARY

4 Antena 3 – 1Q10 Results
TV advertising dropped by 2.6% in line with total advertising market and with full year estimates
Source: Infoadex. 2010e= Arce Media (1Q10)
mill. €
TV Advertising
Advertising market in Spain
2,1722,317
2,670
2,951
3,188
3,467
3,082
2,368
2002 2003 2004 2005 2006 2007 2008 2009 2010e
(-2,1%)
TV
-2.6%
Radio
-1.9%
Advertising Market1Q10 vs. 1Q09
Source: Arce Media
Press
-3.9%
Internet+11.4%
Cinema+5.4%
Sunday suppl.+9.5%
Magazines
-6.2%
Outdoor
-5.4%
Total
-2.6%

5 Antena 3 – 1Q10 Results
Net Revenues 192.9 174.9
EBITDA 25.0 22.8
Net profit 15.9 8.1
1Q10 1Q09
+10.3%
+10.0%
YoY
+95.8%
OPEX 167.9 152.2 +10.3%
Consolidated Group (IFRS)
1Q10 Results in € mill.
EBITDA Margin 13.0% 13.0%
Net profit Margin 8.2% 4.6%

6 Antena 3 – 1Q10 Results
Strong results in TV (+14%) Radio, slightly positive, performed better than the market Others affected by lack of box office revenues vs 1Q09
Antena 3 Group: Net revenues by segment
175 193
1Q09 1Q10
NET REVENUES
+10.3%
147 167
1Q09 1Q10
+14.0%
20 20
1Q09 1Q10
+0.8%
8 5
1Q09 1Q10
-33.9%
TV
Radio
Others
87%
10%
3%

7 Antena 3 – 1Q10 Results
Costs increased in 16 M€, mainly due to new TVE toll and restructuring costs
Antena 3 Group: OPEX
Programming Costs &Other consumptions
Personnel Costs
Other Costs+22.7%
+28.8%
-3.9 %
168+10.3%
78 76
34 43
4049
152
1Q10 OPEX breakdown (M€)
1Q101Q09
+ TVE toll+ Cost of sales
+ Restructuring costs

8 Antena 3 – 1Q10 Results
Antena 3 Group: Restructuring costs
Changes in the industrial area of the business
2009 1Q10
Production services
Make-up &Hairdressing
News Cameras
Storage
Scenography
Align the organisation to maximize resources
• Flexibility in the use of the resources• Adapting costs to market standards
Programming
Contentpurchase
Product definition
Service externalization ( 400 employees)
TV businesstoday
Archives
Programming
Contentpurchase
Product definition
TV businesstomorrow
Production
140 employees
Others...
250 employees
9 Antena 3 – 1Q10 Results
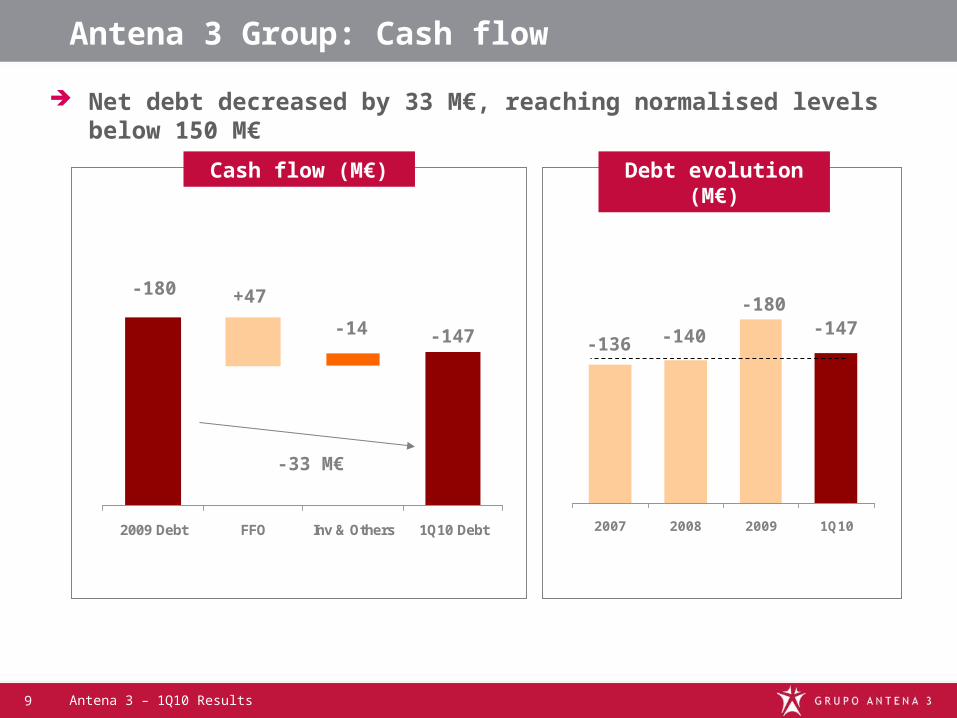
Antena 3 Group: Cash flow
Net debt decreased by 33 M€, reaching normalised levels below 150 M€
2009 Debt FFO Inv & Others 1Q10 Debt 2007 2008 2009 1Q10
-180 +47
-14 -147 -140
-180-147
-33 M€
Cash flow (M€)
-136
Debt evolution (M€)

10 Antena 3 – 1Q10 Results
TV Advertising market in Spain
Best quarter in last two years, mainly activated by automotive
Source: Infoadex and Internal estimates A3
TV Advertising by quarter
-3%-6%
-17%
-23%-27%
-34%
-19%
-3%
-11%
1Q08 2Q08 3Q08 4Q08 1Q09 2Q09 3Q09 4Q09 1Q10e
Sector Share
Beauty 18%
Automotive 14%
Food 15%
Telecom&Internet 10%
6%
Retail distribution 10%
TV Advertising Market by sector
1Q10e vs 1Q09
Source: Internal Estimates A3
Finance 8%
Total 100%
YoYe
+1%
+22%
+0%
-8%
-11%
-4%
+3%
+0%
Others 19% +2%
FY08= -11%
FY09=-23%
Culture
Share
+0 pp
+3 pp
+0 pp
-1 pp
-1 pp
0 pp
0 pp
-1 pp

11 Antena 3 – 1Q10 Results
Net Revenues 169.2 149.6
EBITDA 24.3 19.4
Net profit 14.0 7.8
1Q10 1Q09
+13.1%
+25.0%
YoY
+80.4%
OPEX 144.9 130.2 +11.3%
Television (IFRS)
1Q10 Results in € mill.
EBITDA Margin 14.3% 13.0%
Net profit Margin 8.3% 5.2%

12 Antena 3 – 1Q10 Results
Gross Ad. sales
167.9 139.6
Net Ad. sales
160.0 134.6
Other net revenues
9.2 15.0
1Q10 1Q09
+20.3%
+18.9%
YoY
-38.8%
Discounts -7.8 -4.9 +59.0%
Television (IFRS)
1Q10 Results in € mill.
Total Net Revenues
169.2 149.6 +13.1%

13 Antena 3 – 1Q10 Results
Programming Costs
71.5 74.1
Personnel Costs
30.4 22.0
1Q10 1Q09
-3.5%
+38.4%
YoY
Television (IFRS)
1Q10 Results in € mill.
Total OPEX 144.9 130.2 +11.3%
Other Costs 43.0 34.1 +26.1%

14 Antena 3 – 1Q10 Results
Net Revenues 21.6 21.7
EBITDA 5.2 4.5
Net profit 3.1 2.6
1Q10 1Q09
-0.2%
+15.8%
YoY
+19.2%
OPEX 16.5 17.2 -4.3%
Radio (IFRS)
1Q10 Results in € mill.
EBITDA Margin 23.9% 20.6%
Net profit Margin 14.2% 11.9%

15 Antena 3 – 1Q10 Results
Financials (IFRS)
Contribution to consolidated groupMainly represents the business lines Movierecord, Antena 3 Films, Antena 3 Editorial (Música Aparte) and Antena 3 Eventos
Other Subsidiaries’ contribution
Net Revenues 5.2
EBITDA -2.6
1Q10 1Q09€ mill
Source: Antena 3
7.9
-0.3
Movier.
14%
A3
Eventos
23%
Others
37%
A3 films
26%
Net revenues split

16 Antena 3 – 1Q10 Results
Antena 3: Market share & power ratio
Source: Internal Estimates A3 (quarterly data)
Market share
New market structure without TVE boosted market share and power ratio
55.070.8
24.7
29.220.3
0
A 3 T 5
+15.8pc+15.8pc
1Q101Q09
OTHERS
+4.5pc
+4.5pc
1.47
1.94
1Q09
1Q10
+32%+32%
Power ratio

17 Antena 3 – 1Q10 Results
Antena 3:TV Advertising revenues breakdown
-10.1%
14.4%
3.5%13.0%
6.4%
Audience InventoryConsumption
GRPs Prices
Ad. Revenues+20%
1Q10 Key factors
GRPs

18 Antena 3 – 1Q10 Results
1Q10 BUSINESS SUMMARY

19 Antena 3 – 1Q10 Results
Audience Share 1Q10 Total Individuals
A3TV TL5 Forta Cuatro OthersSexta Net TV
Source: Kantar MediaAudience share 24h, Total Individuals: 4+
Veo TV Pay TV
Complementary channelsMain channel
25.2
12.215.1
16.7
7.56.5
2.71.1
7.2
Commercial TV Players No advertising
5.8
-1.6-1.6 +0.9
+0.9
TVE
+2.5
+2.5-1.6-1.6 -0.2-0.2-2.2-2.2 +0.
8+0.8
+1.6
+1.6 -0.3-0.3+0.
1+0.1
YoY
YoY
Audience share 1Q10: 24h
Antena 3, second position among commercial FTA players

20 Antena 3 – 1Q10 Results
Audience Share 1Q10 Commercial Target
A3TV TL5 Forta Cuatro OthersSexta Net TV
Source: Kantar MediaAudience share 24h, Total Individuals: 4+
Veo TV Pay TV
21.3
8.9
16.017.8
9.88.3
2.01.0
8.8
Commercial TV Players No advertising
6.1
TVE
YoY
YoY
Audience share 1Q10
-1.9-1.9 +1.6
+1.6
+2.9
+2.9-2.2-2.2 -0.2-0.2-2.0-2.0 +0.
6+0.6
+1.1
+1.1 -0.6-0.6+0.
7+0.7
Antena 3, 16% audience share in Commercial Target
Complementary channelsMain channel

21 Antena 3 – 1Q10 Results
FTA commercial players’ audience share: 24h
Source: Kantar MediaTotal individuals: 4+Commercial Target: 16-54 yrs. Up to 10,000 inhabitants
7.56.5
15.1
16.8 16.7
15.8
14.5
12.2
9.2
6.8
1Q09 2Q09 3Q09 4Q09 1Q10
In % In %
+0.9-1.7
Total individuals Commercial Target
9.8
8.3
16.0
17.9 17.8
16.2
10.9
8.9
12
8.5
1Q09 2Q09 3Q09 4Q09 1Q10
-2.3 -1.7 -0.3 +1.6-1.9 -2.0 -2.0 -0.2
Fragmentation has eroded audience share of most players

22 Antena 3 – 1Q10 Results
Source: Kantar MediaPrime Time: From 20:30 to 24:00hCommercial Target: 16-54 yrs. Up to 10,000 inhabitants
FTA commercial players’ audience share: Prime Time
15.115.316.3
18.1
14.512.9
7.2
9.5
7.27.7
1Q09 2Q09 3Q09 4Q09 1Q10
In % In %
-1.8-0.2
Total individuals Commercial Target
9.68.6
16.116.9 16.818.5
11.29.9
12.3
8.8
1Q09 2Q09 3Q09 4Q09 1Q10
-1.6 -1.3 -0.5 -1.7-0.8 -1.3 -2.7 -0.2
Antena 3, less affected than others by strong competition in Prime Time

23 Antena 3 – 1Q10 Results
DTT Penetration in Spain
DTT penetration reaches 90% and near 70% in audience Total analogue switch off on 2nd April 2010
Penetration & Audience by distribution
1Q10 Antena 3’s audience
by distribution
Source : Kantar Media
% households
Penetration Audience share DTT/Total TV
27.3
67.5
11.8
51.8
20.9 20.7
89.3
70.0
77.4
50.7
61.5
Mar-09 J un-09 Sep-09 Dec-09 Mar-10
Penetration: 1.8x
Audience: 2.5x
Others (cable, sat,..)
Analogue
Digital
21.8%
17.0%
61.2%
10.3%
15.116.1%
16.5%
Others
Analogue
Digital
TOTAL

24 Antena 3 – 1Q10 Results
Source: Kantar MediaPrime Time: From 20:30 to 24:00hTotal individuals: 4+Commercial Target: 16-54 yrs. Up to 10,000 inhabitants
Clear growing trend in every target for complementary channels (Neox & Nova)
Complementary channels’ audience share evolution
2.5
1.4
3.1
1.8
1Q09 2Q09 3Q09 4Q09 1Q10
In % In %
24h Prime Time
Commercial Target: 1.7x
Total Individuals: 1.8x
2.9
1.5
3.4
1.7
1Q09 2Q09 3Q09 4Q09 1Q10
Total Individuals: 1.9x
Commercial Target: 2.0x

25 Antena 3 – 1Q10 Results
A3 Group keeps leading complementary channels’ offer in Commercial Target
Complementary channels overview
1Q10 Audience Share in Complementary Channels 24h
2.5
3.9
2.7
1.2
0.8
A3 TVENet TV T5 Veo TV Cuatro
Source: Kantar Media24h, Total Individuals: 4+, Commercial Target: 16-54 yrs. Up to 10,000 inhabitants
3.1
3.7
2.0 1.92.2
1.00.8
Total Individuals
Commercial Target
In %
No advertising

26 Antena 3 – 1Q10 Results
Radio audience share
Radio business increased listeners by 6% in the last 12 months
Onda Cero consolidates its second position among radio stations
2,195 2,151 2,183 2,205
922 1,000 1,059 1,072
39 50 41 57
1st 09 2nd 09 3rd 09 1st 10
Source: EGM Surveys Monday to Friday (.000) (moving average)
3,156 3,201 3,2834,753
2,205
1,636
1,276
566
478
468
372
Listeners evolution
Position by listeners
+5.6%3,334

27 Antena 3 – 1Q10 Results
New Audiovisual Law:
Changes in regulation: Audiovisual Law
Current regulation
No Council
New Audiovisual Law
Creation of a Council for Audiovisual Media (CEMA)
Obligation to invest 5% of annual TV revenues in European Films, TV movies and others (at least, 60% in spanish language)
Obligation to invest 5% of annual TV revenues in European Films, TV Movies and TV Series. Two conditions: * Minimum 60% in spanish language * TV Movies and Series, no more than 2%
One channel per player 50% of channels per player
12 min/hour (spot + teleshopping) plus 5 min/h (autopromotion + telepromotion) plus sponsorship
Timing: Into force on 1st May 2010
Main issues:
Regulator
European production
DTT Pay TV
Advertisingtime
TV licences
10 years15 years + automatic renewal under certain conditions
12 min/hour (spot+ teleshopping) plus 3 min/h (telepromotion) plus 5 min/h (autopromotion) plus product placement

28 Antena 3 – 1Q10 Results
Legal Notice
The information contained in this presentation has not been independently verified and is, in any case, subject to negotiation, changes and modifications.
None of the Company, its shareholders or any of their respective affiliates shall be liable for the accuracy or completeness of the information or statements included in this presentation, and in no event may its content be construed as any type of explicit or implicit representation or warranty made by the Company, its shareholders or any other such person. Likewise, none of the Company, its shareholders or any of their respective affiliates shall be liable in any respect whatsoever (whether in negligence or otherwise) for any loss or damage that may arise from the use of this presentation or of any content therein or otherwise arising in connection with the information contained in this presentation. You may not copy or distribute this presentation to any person.
The Company does not undertake to publish any possible modifications or revisions of the information, data or statements contained herein should there be any change in the strategy or intentions of the Company, or occurrence of unforeseeable facts or events that affect the Company’s strategy or intentions.
This presentation may contain forward‑looking statements with respect to the business, investments, financial condition, results of operations, dividends, strategy, plans and objectives of the Company. By their nature, forward‑looking statements involve risk and uncertainty because they reflect the Company’s current expectations and assumptions as to future events and circumstances that may not prove accurate. A number of factors, including political, economic and regulatory developments in Spain and the European Union, could cause actual results and developments to differ materially from those expressed or implied in any forward‑looking statements contained herein.
The information contained in this presentation does not constitute an offer or invitation to purchase or subscribe for any ordinary shares, and neither it nor any part of it shall form the basis of or be relied upon in connection with any contract or commitment whatsoever.