april, 2016 to june, 2016 (q1 of fy ending march 31,...
TRANSCRIPT

Business ReportApril, 2016 to June, 2016
(Q1 of FY ending March 31, 2017)
Wacom Co., Ltd.
(TSE Sec.1 6727)

All Rights Reserved. Copyright © 2016 Wacom Co., Ltd. 2
Contents Index3-4 Q1 FY 03/17 (Apr. to Jun. 2016) Results Overview5-6 Consolidated P/L, Operating Expenses Comparison7-8 Consolidated Sales/Profit Comparison9-10 Business Segment Sales/Profit Comparison 11-18 Business Highlights19-21 Sales by Product Line22-24 Sales by Region, Sales Changes for Local Currencies25-26 Consolidated B/S, C/F27-29 FY 03/2017 Business Strategies30-46 FY 03/2017 Financial Forecast47-49 Shareholders Return Policy for FY 03/201750-53 Review of Wacom Strategic Business Plan SBP-201954-56 Our Branding57 Disclaimer

All Rights Reserved. Copyright © 2016 Wacom Co., Ltd. 3
Q1 FY 03/17 (Apr. to Jun. 2016) Results OverviewOperating environment The recovery of global economy plateaued driven by growing uncertainties such as the slowdowns
in Europe and China, a sluggish Japanese recovery, and UK’s exit from the EU.
Japanese Yen’s appreciation against US Dollar and euro from the end of last year further accelerated from this April. Yen strengthened against emerging currencies such as Renminbi.
In addition to the penetration of mobile products, cloud computing and SNS, the emergence of new fields such as IoT and VR in the IT industry is causing major changes in our business environment.
Performance overview Consolidated net sales fell below the previous comparable fiscal period, due to the strong Yen and
decreased sales in the Brand Business segment during product lifecycle transitions. We posted operating and net Losses due to higher R&D expenses for new products, and depreciation of global IT infrastructure.
Sales in the Brand Business segment fell below the previous comparable fiscal period. Creative Business shipment increased in unit base but overall sales decreased due to the strong Yen, product mix change, and the transitions to new models. Consumer Business and Business Solution also struggled by foreign exchange rates and changes in the market environment.
Sales in Technology Solution Business declined mainly due to the strong yen and the reduced tablet demand for Turkish government project even though the sales in smartphone category increased.

All Rights Reserved. Copyright © 2016 Wacom Co., Ltd. 4
Q1 FY 03/17 (Apr. to Jun. 2016) Results Overview
Average Forex rate Q1 FY 03/17 YOY Change
1 USD 109.07 JPY -10.1% (Strong JPY)
1 EUR 122.47 JPY -8.5% (Strong JPY)
Business Performance Q1 FY 03/17 YOY Change
Net Sales 13,261 mil -12.4%
Operating Income -1,447 mil -- ( Prev. 1Q: 29 mil )
Ordinary Income -1,481 mil -- ( 26 mil )
Net Profit aft. Tax -1,147 mil -- ( -235 mil )
Financial Indices Q1 FY 03/17 1Q FY 03/2016
EPS -6.97 JPY -1.41 JPY
BPS (Book Value per Share) 153 JPY 181 JPY
Financial Summary (JPY)
(For reference)
(Note) Net Profit is equivalent to net profit attributable to shareholders of Wacom Co., Ltd.
All Rights Reserved. Copyright © 2016 Wacom Co., Ltd. 5
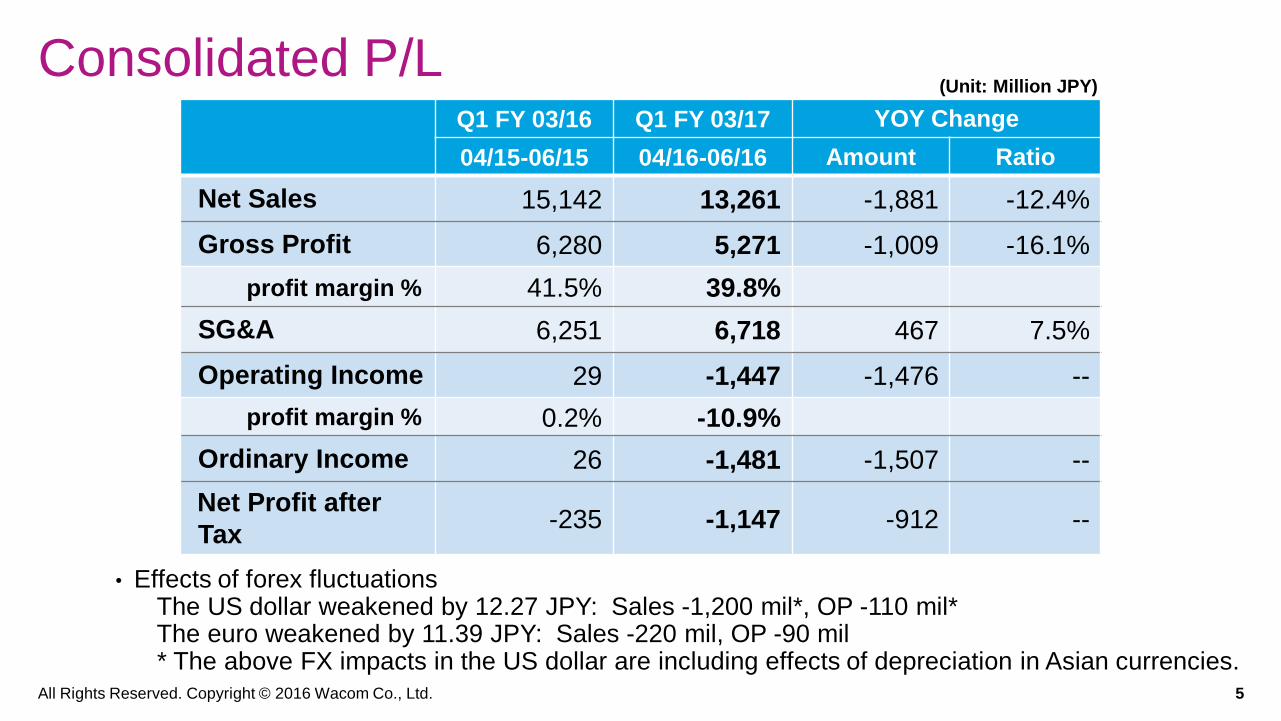
Consolidated P/L Q1 FY 03/16 Q1 FY 03/17 YOY Change
04/15-06/15 04/16-06/16 Amount Ratio
Net Sales 15,142 13,261 -1,881 -12.4%
Gross Profit 6,280 5,271 -1,009 -16.1%
profit margin % 41.5% 39.8%
SG&A 6,251 6,718 467 7.5%
Operating Income 29 -1,447 -1,476 --
profit margin % 0.2% -10.9%
Ordinary Income 26 -1,481 -1,507 --
Net Profit after
Tax-235 -1,147 -912 --
(Unit: Million JPY)
• Effects of forex fluctuationsThe US dollar weakened by 12.27 JPY: Sales -1,200 mil*, OP -110 mil*The euro weakened by 11.39 JPY: Sales -220 mil, OP -90 mil* The above FX impacts in the US dollar are including effects of depreciation in Asian currencies.

All Rights Reserved. Copyright © 2016 Wacom Co., Ltd. 6
Key changes in SG&A
Increase of depreciation(+190 mil) and subcontractor expenses(+190 mil)* in Others and personnel expense* for global IT infrastructure development.
* SG&A including the above global IT infrastructure development decreased by 450 mil due to the stronger yen for expenses incurred at subsidiaries.
Operating Expenses ComparisonQ1 FY 03/16 Q1 FY 03/17 YOY Change
04/15-06/15 04/16-06/16 Amount Ratio
Personnel 2,363 2,412 49 2.1%
R&D 1,019 1,062 43 4.2%
Ad. & Promo. 714 592 -122 -17.0%
Others 2,154 2,652 498 23.1%
Total 6,251 6,718 467 7.5%
SG&A ratio % 41.3% 50.7%
(Unit: Million JPY)

All Rights Reserved. Copyright © 2016 Wacom Co., Ltd. 7
Consolidated Sales Comparison
10,7609,263
4,241
3,828
141
170
0
5,000
10,000
15,000
Q1 FY 03/16 Q1 FY 03/17
Brand biz Tech. Solution biz Other biz
+20.2%
-13.9%
-9.7%
-12.4%15,142
13,261
(Unit: Million JPY)
Change
Ratio
All Rights Reserved. Copyright © 2016 Wacom Co., Ltd. 8
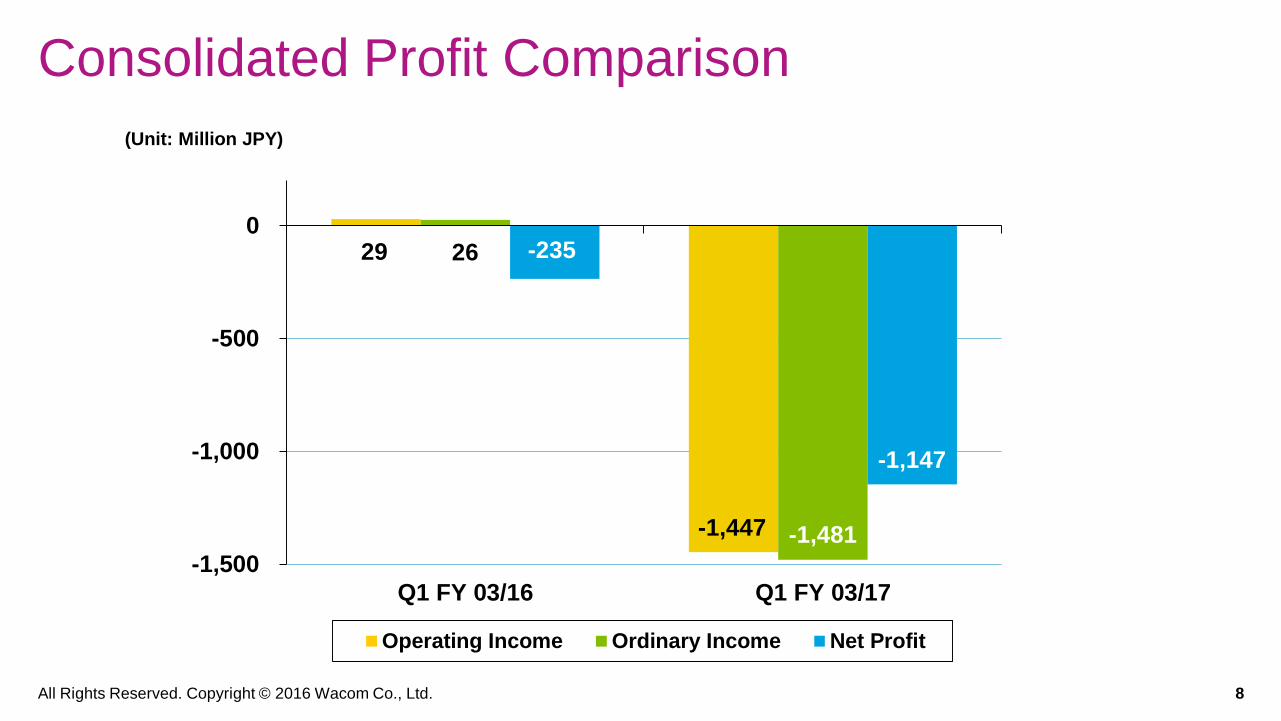
Consolidated Profit Comparison
29
-1,447
26
-1,481
-235
-1,147
-1,500
-1,000
-500
0
Q1 FY 03/16 Q1 FY 03/17
Operating Income Ordinary Income Net Profit
(Unit: Million JPY)

All Rights Reserved. Copyright © 2016 Wacom Co., Ltd. 9
Business Segment & Business Unit
Technology Solution Business Pen sensor systems for Smartphones and Tablets EMR, AES pen components & modules (feelTM)
Other Business Engineering Solution・ECAD dio
Consumer Business Makes daily lives more creative and enjoyable
Product Lines: Digital Stationery, etc.
Business Solution Serves society by providing innovative solutions
Product lines: Display, Signature Tablet, etc.
Creative Business Serves the passion of professional and consumer creativity
Product Lines: Pen Tablet, Mobile, Display
Bra
nd
Bu
sin
es
s
Platform &applications
Provides
technology,
apps and
platforms
Cloud Apps
& Services
WILL (digital
Ink solution)

All Rights Reserved. Copyright © 2016 Wacom Co., Ltd. 10
Consolidated P/L by Business Segment
Q1 FY 03/16 Q1 FY 03/17 YOY Change
04/15-06/15 04/16-06/16 Amount Ratio
Net Sales 15,142 13,261 -1,881 -12.4%
Brand Business 10,760 9,263 -1,497 -13.9%
Tech. Solution Biz. 4,241 3,828 -413 -9.7%
Other Business 141 170 29 20.2%
Operating Income 29 -1,447 -1,476 --
Brand Business 1,651 987 -664 -40.2%
Tech. Solution Biz 216 -96 -312 --
Other Business 3 7 3 96.0%
Corp. and others -1,841 -2,345 -504 27.3%
profit margin % 0.2% -10.9%
(Unit: Million JPY)
All Rights Reserved. Copyright © 2016 Wacom Co., Ltd. 11
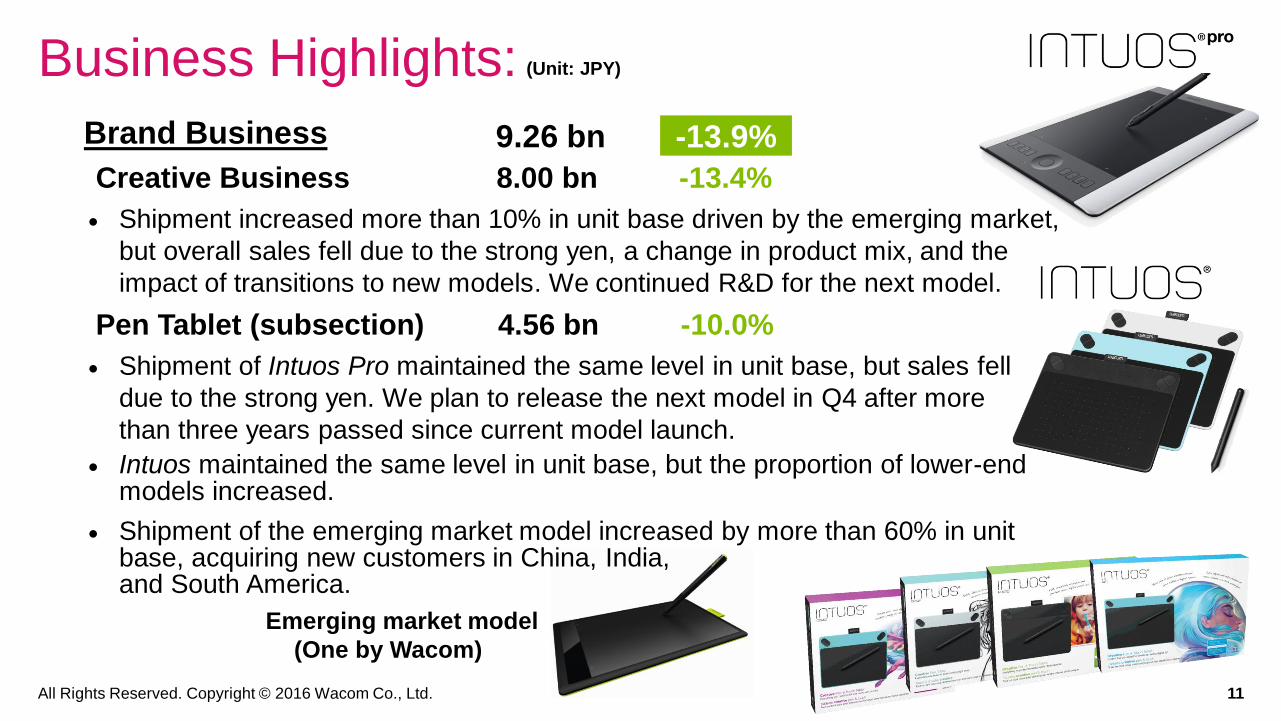
Business Highlights:
Brand Business
Creative Business 8.00 bn -13.4%
Shipment increased more than 10% in unit base driven by the emerging market,
but overall sales fell due to the strong yen, a change in product mix, and the
impact of transitions to new models. We continued R&D for the next model.
Pen Tablet (subsection) 4.56 bn -10.0%
Shipment of Intuos Pro maintained the same level in unit base, but sales fell
due to the strong yen. We plan to release the next model in Q4 after more
than three years passed since current model launch.
Intuos maintained the same level in unit base, but the proportion of lower-end models increased.
Shipment of the emerging market model increased by more than 60% in unit base, acquiring new customers in China, India, and South America.
9.26 bn -13.9%
Emerging market model
(One by Wacom)
(Unit: JPY)

All Rights Reserved. Copyright © 2016 Wacom Co., Ltd. 12
Brand Business
Creative Business
Mobile (subsection) 0.75 bn -45.3%
Creative users got more choices on tablet devices due to
changes in competitive environment driven by an increase in
digital pen-adopted devices. Demand for highly-functional
creative tablets supporting user’s workflow continued.
Demand for Cintiq Companion 2 slowed due to product life cycle
transitions and the impact of the strong yen.
We plan to launch new models in Q3, adding features such as
next generation pen technology, and advanced 3D and color
management functions in order to solidify our global market
leadership and realize growth recovery.
Business Highlights: (Unit: JPY)
companion 2

All Rights Reserved. Copyright © 2016 Wacom Co., Ltd. 13
Brand Business
Creative Business
Display (subsection) 2.70 bn -3.8%
Shipment of Display products expanded more than 10% in unit base.
Sales of Cintiq 27 QHD decreased due to strong yen and the impact from large sales in the previous quarter following its launch.
Sales of Cintiq 22HD decreased, having been on the market for four years.
Shipment of Cintiq 13HD increased, particularly in Asian countries.
We continued R&D for the next model, and plan to launch the next model of all product lines in Q3 and Q4.
13HD
Business Highlights:
27 QHD touch
22HD touch
13HD touch
27 QHD
(Unit: JPY)
All Rights Reserved. Copyright © 2016 Wacom Co., Ltd. 14
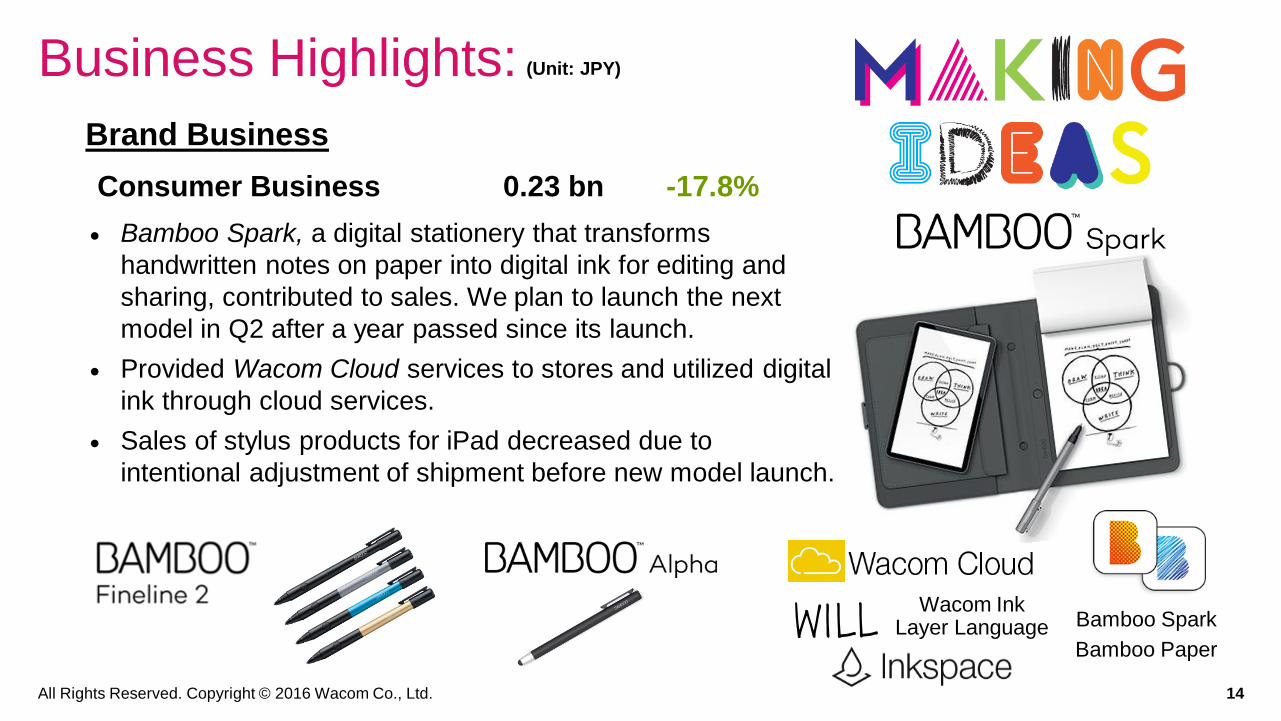
Brand Business
Consumer Business 0.23 bn -17.8%
Bamboo Spark, a digital stationery that transforms
handwritten notes on paper into digital ink for editing and
sharing, contributed to sales. We plan to launch the next
model in Q2 after a year passed since its launch.
Provided Wacom Cloud services to stores and utilized digital
ink through cloud services.
Sales of stylus products for iPad decreased due to
intentional adjustment of shipment before new model launch.
Business Highlights: (Unit: JPY)
Wacom InkLayer Language Bamboo Spark
Bamboo Paper

All Rights Reserved. Copyright © 2016 Wacom Co., Ltd. 15
Business Highlights: (Unit: JPY)
Brand Business
Business Solution 1.03 bn -17.0%
Sales dropped in the Eurozone due to prolonged investment
projects in the midst of economy uncertainties.
STU series expanded in sales and shipment, owing to increased
demand for digital signature at domestic retailers and public
services in India, and for credit card transactions and over-the-
counter services.
LCD signature tablets, the DTU series, expanded widely in sales
for over-the-counter use in the finance field, with DTU-1141
adopted by Citi Bank Korea.
All Rights Reserved. Copyright © 2016 Wacom Co., Ltd.
DTU-1031DTU-1141 DTH-2242
STU series
STU-530/430

All Rights Reserved. Copyright © 2016 Wacom Co., Ltd. 16
Business Highlights:
Tech. Solution Business
Pen Sensor System
for Smartphones 1.26 bn +12.2%
Mass production of Samsung’s next gen. model, Galaxy
Note7 partially started from Q1. As a result, sales increased
despite the strong yen.
Sales of existing models such as Galaxy Note5 remained
stable.
Focused on development and automated production of new
cartridge type digital pen
Active development of new customer base.
3.83 bn -9.7%
(Unit: JPY)
Smartphone models
All Rights Reserved. Copyright © 2016 Wacom Co., Ltd. 17
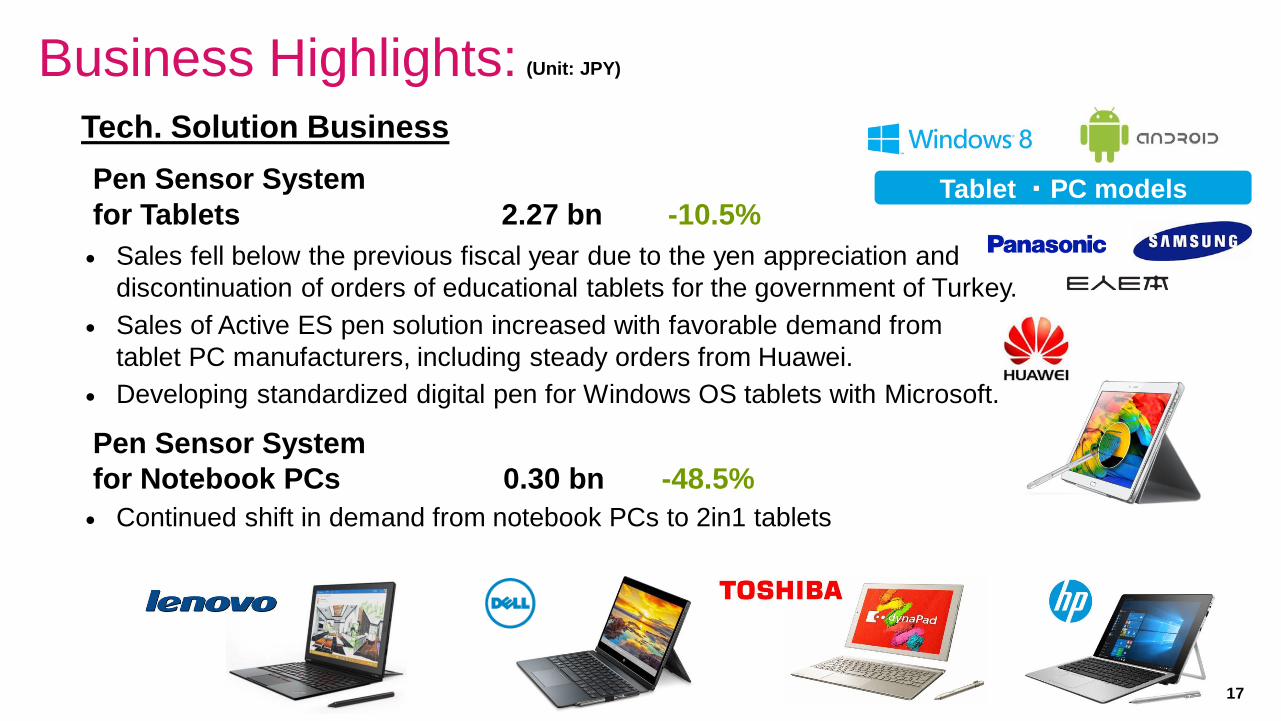
Business Highlights:Tech. Solution Business
Pen Sensor System
for Tablets 2.27 bn -10.5%
Sales fell below the previous fiscal year due to the yen appreciation and
discontinuation of orders of educational tablets for the government of Turkey.
Sales of Active ES pen solution increased with favorable demand from
tablet PC manufacturers, including steady orders from Huawei.
Developing standardized digital pen for Windows OS tablets with Microsoft.
Pen Sensor System
for Notebook PCs 0.30 bn -48.5%
Continued shift in demand from notebook PCs to 2in1 tablets
(Unit: JPY)
Tablet ・PC models

All Rights Reserved. Copyright © 2016 Wacom Co., Ltd. 18
Business Highlights:
Other Business
CAD software and others 0.17 bn +20.2%
Increased demand of ECAD dio 2016 for replacements.
0.17 bn
(Unit: JPY)
+20.2%
F&A (Corporate)
Continued to invest in business infrastructure for growth and operational efficiency. Major projects include new SCM system for e-commerce and IT infrastructure for global integrated operations.
Promoted WILL (Wacom Ink Layer Language) under our open partnership policy as a new framework to standardize digital ink and engaged in activities for partnership development.
Made preparations for the establishment of Digital Stationery Consortium, by holding Wacom Connected Ink events in Las Vegas and Shanghai in January and May 2016 for digital ink experience.

All Rights Reserved. Copyright © 2016 Wacom Co., Ltd. 19
Sales by Product Line in Brand Business
5,060 4,555
1,377
753
2,804
2,696
283
233
1,236
1,026
0
2,000
4,000
6,000
8,000
10,000
Q1 FY 03/16 Q1 FY 03/17
Creative・Pen tablet Creative・Mobile Creative・DisplayConsumer Business Solution
-45.3%
-10.0%
-3.8%
-17.0%
8,004
9,241-13.9%
-17.8%
(Unit: Million JPY)
Change
Ratio
Creative
biz
9,241
Creative
biz
8,004
-13.4%
All Rights Reserved. Copyright © 2016 Wacom Co., Ltd. 20
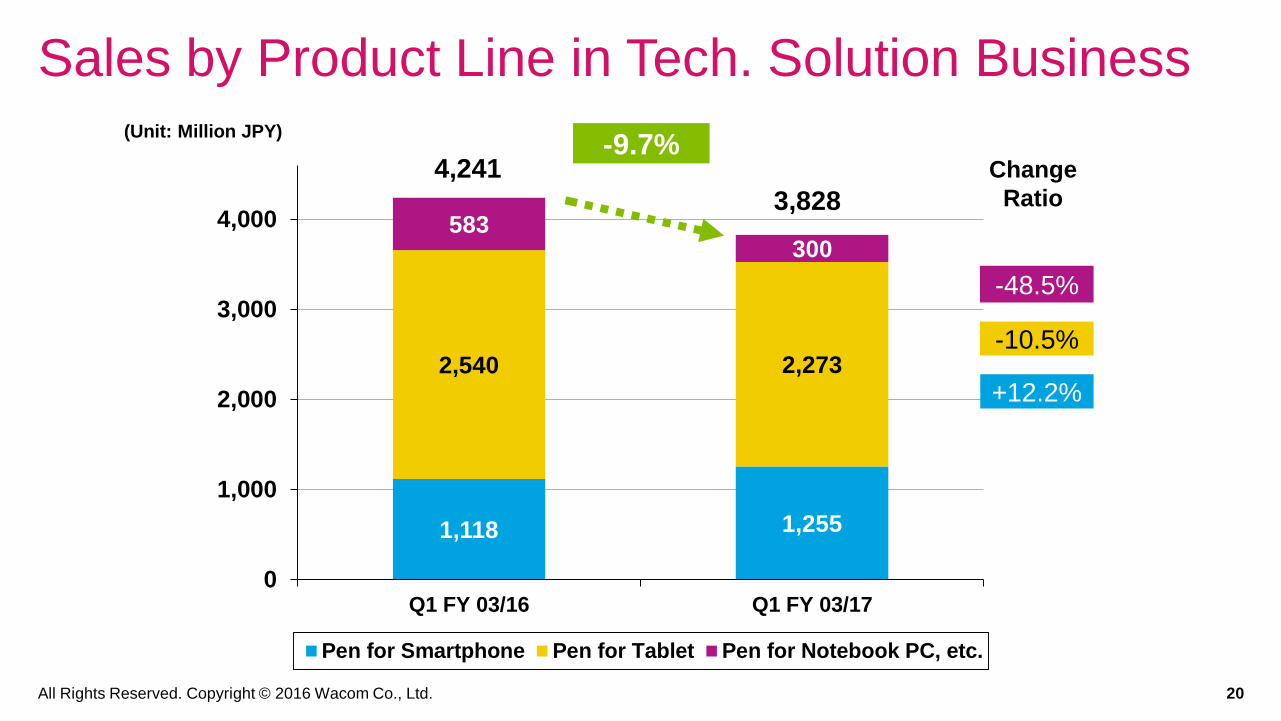
Sales by Product Line in Tech. Solution Business
1,118 1,255
2,540 2,273
583300
0
1,000
2,000
3,000
4,000
Q1 FY 03/16 Q1 FY 03/17
Pen for Smartphone Pen for Tablet Pen for Notebook PC, etc.
-48.5%
-10.5%
+12.2%
3,828
4,241-9.7%
(Unit: Million JPY)
Change
Ratio

All Rights Reserved. Copyright © 2016 Wacom Co., Ltd. 21
0
5000
10000
15000
20000
25000
13/7-9 13/10-12 14/1-3 14/4-6 14/7-9 14/10-12 15/1-3 15/4-6 15/7-9 15/10-12 16/1-3 16/4-6
Creative Consumer(Stylus, etc.) Business(VM) Tech. Solution CAD, etc.
Quarterly Trend by Product Line
19,026
23,389
20,786
13,669
18,342
24,954
17,592
15,142
23,814
21,936
16,676
13,261
(Unit: Million JPY)

All Rights Reserved. Copyright © 2016 Wacom Co., Ltd. 22
Sales by Region
4,241 3,828
1,6801,565
3,7392,774
2,717
2,321
2,765
2,773
0
2,000
4,000
6,000
8,000
10,000
12,000
14,000
16,000
Q1 FY 03/16 Q1 FY 03/17
Tech. Solution Japan U.S. Germany Asia Oceania
(-17.5%)
(-6.6%)
+0.3%
-25.8%
-6.9%
-9.7%
-14.6%
15,142
13,261
-12.4%
※1,296
※1,369 (※+11.3%)
(Unit: Million JPY)Change
Ratio※Sales in China
of Asia Oceania
(※% growth based
on local currency)
( ) % growth based
on local currency
(Note) There are no regional segments in the Tech. Solution Biz.

All Rights Reserved. Copyright © 2016 Wacom Co., Ltd. 23
(For reference) Sales Changes in Local Currency Base
Region CurrencyYOY
Change Ratio
Japan(excluding Tech. Solution biz)
JPY -6.9%
U.S. USD -17.5%
Europe EUR -6.6%
China CNY +11.3%
Korea KRW +22.5%
Australia AUD +9.2%
Singapore USD +21.9%
Hong Kong USD -34.2%
Taiwan NTD +19.8%
India INR +139.8%
All Rights Reserved. Copyright © 2016 Wacom Co., Ltd. 24
0
5,000
10,000
15,000
20,000
25,000
13/7-9 13/10-12 14/1-3 14/4-6 14/7-9 14/10-12 15/1-3 15/4-6 15/7-9 15/10-12 16/1-3 16/4-6
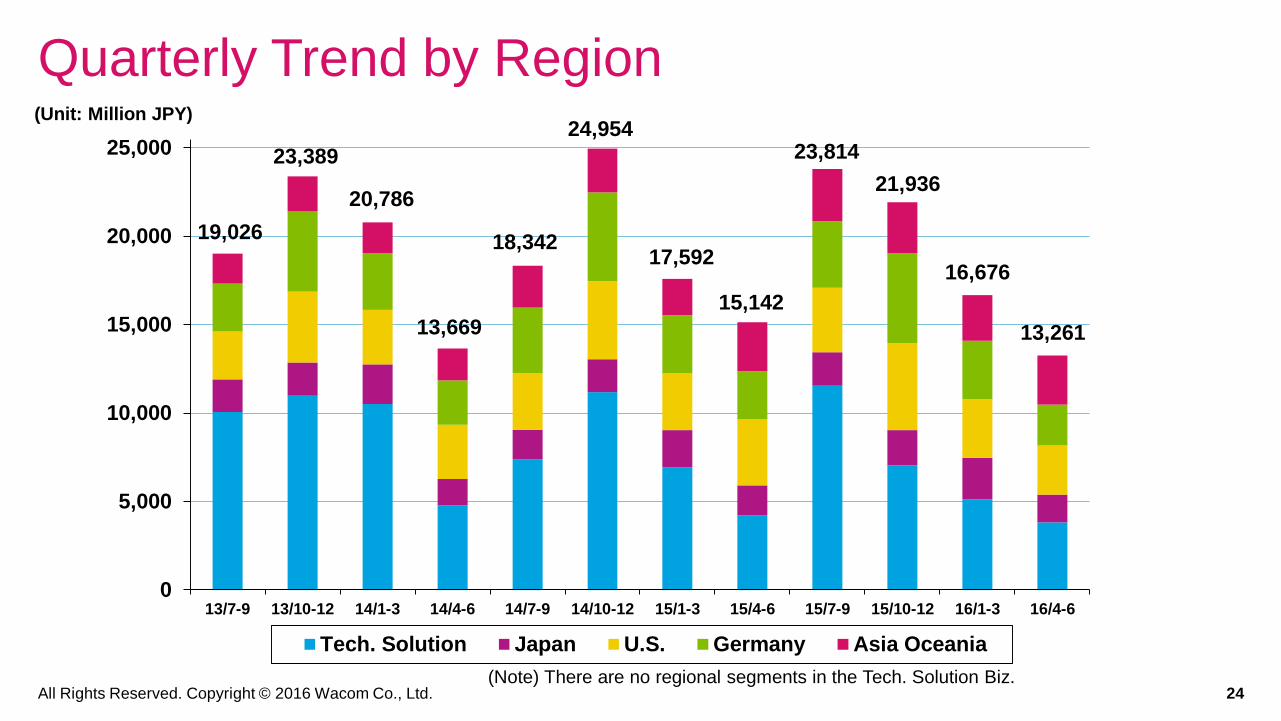
Tech. Solution Japan U.S. Germany Asia Oceania
Quarterly Trend by Region
19,026
23,389
20,786
13,669
18,342
24,954
17,592
15,142
23,814
21,936
16,676
13,261
(Unit: Million JPY)
(Note) There are no regional segments in the Tech. Solution Biz.

All Rights Reserved. Copyright © 2016 Wacom Co., Ltd. 25
Consolidated B/SKey Changes
Assets
・ Decrease in notes and accounts receivable
-1,575・ Decrease in cash and cash equivalents
-1,428Liabilities
・ Increase in long-term loans 3,000
・ Decrease in notes and accounts payable
-575
Net Assets
・ Decrease in shareholders’ equity -4,400(decrease with dividends paid, etc.)
End of Mar. 2016
End of Jun. 2016
Change
Current Assets 37,874 34,733 -3,141
Noncurrent Assets 13,693 13,225 -468
Total Assets 51,567 47,958 -3,609
Current Liabilities 16,479 15,838 -641
Noncurrent Liabilities 3,992 6,878 2,886
Total Liabilities 20,470 22,717 2,247
Minority Interest in
Subsidiaries0 0 0
Net Assets 31,096 25,242 -5,854
Total Liabilities and Net Assets 51,567 47,958 -3,609
Equity Ratio 60.0% 52.3% -7.7%
(Unit: Million JPY)
All Rights Reserved. Copyright © 2016 Wacom Co., Ltd. 26
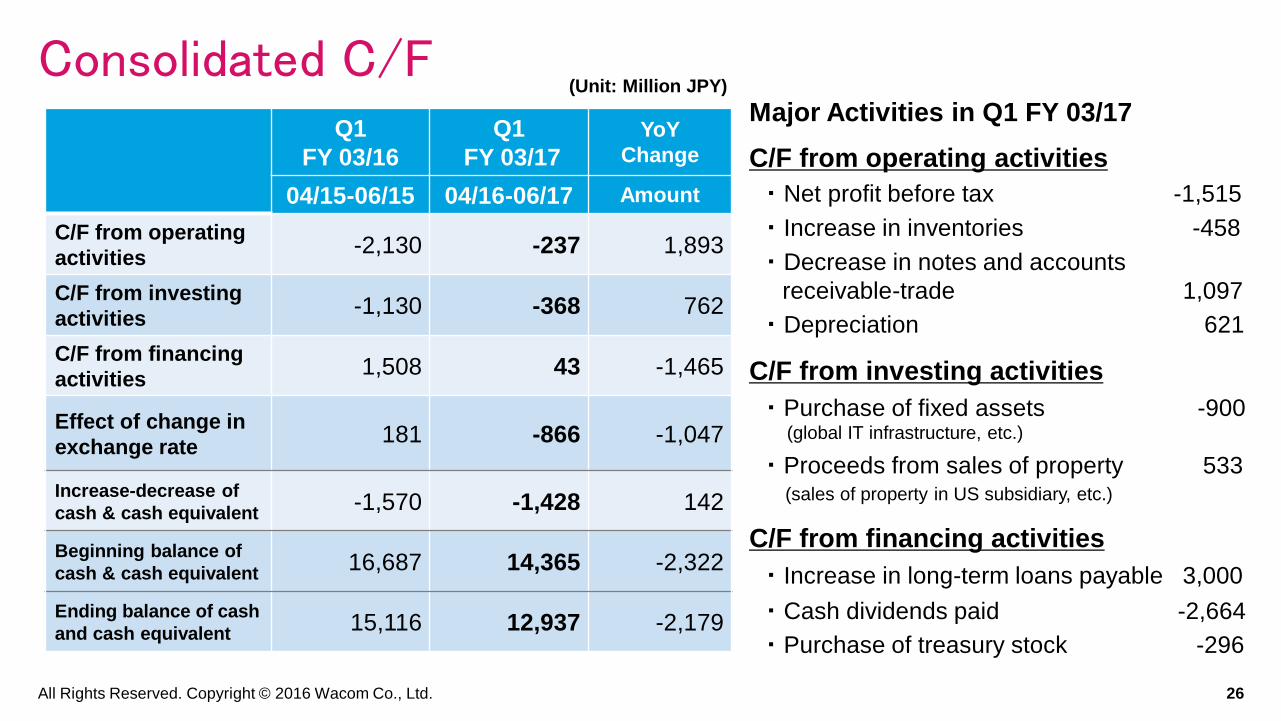
Consolidated C/FMajor Activities in Q1 FY 03/17
C/F from operating activities
・ Net profit before tax -1,515
・ Increase in inventories -458
・ Decrease in notes and accounts
receivable-trade 1,097
・ Depreciation 621
C/F from investing activities
・ Purchase of fixed assets -900(global IT infrastructure, etc.)
・ Proceeds from sales of property 533 (sales of property in US subsidiary, etc.)
C/F from financing activities
・ Increase in long-term loans payable 3,000
・ Cash dividends paid -2,664
・ Purchase of treasury stock -296
Q1
FY 03/16
Q1
FY 03/17
YoY
Change
04/15-06/15 04/16-06/17 Amount
C/F from operating
activities-2,130 -237 1,893
C/F from investing
activities-1,130 -368 762
C/F from financing
activities1,508 43 -1,465
Effect of change in
exchange rate 181 -866 -1,047
Increase-decrease of
cash & cash equivalent-1,570 -1,428 142
Beginning balance of
cash & cash equivalent16,687 14,365 -2,322
Ending balance of cash
and cash equivalent15,116 12,937 -2,179
(Unit: Million JPY)

FY 03/2017
Basic Strategies and
Business Focus

All Rights Reserved. Copyright © 2016 Wacom Co., Ltd. 28
Initial Assumptions of Business Environment for FY 03/17Global Economy
• Modest growth trends will be supported by financial policies in each country.
• Destabilizing factors are increasing such as refugees in Europe, low oil prices and economic slowdowns in U.S. and China.
• Rapid appreciation of the Japanese Yen and the impact from the Kumamoto earthquake in April are concerns for the Japanese economic recovery.
IT industry and our business environment
• 3D market growth accelerates triggered by 3D design, VR and 3D printing.
• Creative markets in emerging countries continue to expand in both professional and consumers segments.
• 2in1 tablet market starts to grow as the smartphone market at standstill.
• Tablet market for educational and enterprise sectors expand.
• Digital stationery creates new value through integration with Apps and Cloud services.
• Digital signature expands by improving workflow and security.

All Rights Reserved. Copyright © 2016 Wacom Co., Ltd. 29
Basic Strategies and Initiatives Expand Creative Business and enhance the market leadership.
Extend 3D design and color management functions with the next generation of product lines.
Accelerate the growth of Creative Business in emerging markets
Establish a new consumer segment by integrating digital stationery and Cloud
services.
Promote standardization of digital ink by WILL (Wacom Ink Layer Language).
Enhance paperless workflow and security business with digital signature.
Promote standardization of digital pen and expand Technology Solution Business.
Enhance the collaboration among global organizations and improve business efficiency by
leveraging the new global IT infrastructure.
Enhance corporate governance and processes for improving corporate value.
All Rights Reserved. Copyright © 2016 Wacom Co., Ltd. 30
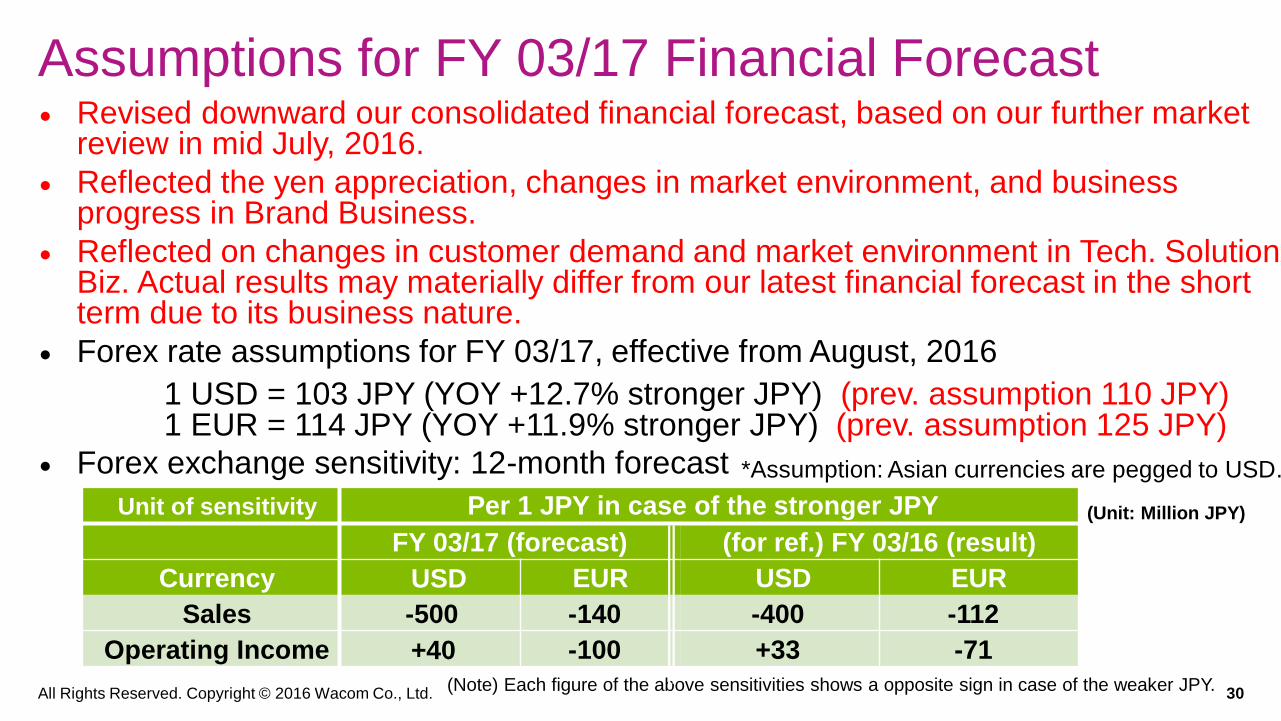
Assumptions for FY 03/17 Financial Forecast
(Note) Each figure of the above sensitivities shows a opposite sign in case of the weaker JPY.
(Unit: Million JPY)
Revised downward our consolidated financial forecast, based on our further market review in mid July, 2016.
Reflected the yen appreciation, changes in market environment, and business progress in Brand Business.
Reflected on changes in customer demand and market environment in Tech. Solution Biz. Actual results may materially differ from our latest financial forecast in the short term due to its business nature.
Forex rate assumptions for FY 03/17, effective from August, 2016
1 USD = 103 JPY (YOY +12.7% stronger JPY) (prev. assumption 110 JPY)1 EUR = 114 JPY (YOY +11.9% stronger JPY) (prev. assumption 125 JPY)
Forex exchange sensitivity: 12-month forecast
Unit of sensitivity Per 1 JPY in case of the stronger JPY
FY 03/17 (forecast) (for ref.) FY 03/16 (result)
Currency USD EUR USD EUR
Sales -500 -140 -400 -112
Operating Income +40 -100 +33 -71
*Assumption: Asian currencies are pegged to USD.

All Rights Reserved. Copyright © 2016 Wacom Co., Ltd. 31
Summary for FY 03/17 Forecast
FY 03/17 (prev.) FY 03/17 (rev.) Prev. vs.
Rev.
04/16-03/17 04/16-03/17 Change
Sales 82,000 77,900 -5.0%
Operating Income 4,200 5.1% 2,400 3.1% -42.9%
Ordinary Income 4,140 5.0% 2,300 3.0% -44.4%
Net Profit aft. tax 3,000 3.7% 1,620 2.1% -46.0%
FY 03/16 (rslt.) FY 03/17 (rev.) YOY
04/15-03/16 04/16-03/17 Growth rate
Sales 77,568 77,900 0.4%
Operating Income 3,664 4.7% 2,400 3.1% -34.5%
Ordinary Income 3,777 4.9% 2,300 3.0% -39.1%
Net Profit aft. tax 2,310 3.0% 1,620 2.1% -29.9%
ROE 7.1% 5.5% -1.6%
(Unit: Million JPY)
(forecast comparison and YOY)

All Rights Reserved. Copyright © 2016 Wacom Co., Ltd. 32
(Note) Due to risks and uncertainties involved in the forecast of customer demand and market in Technology Solution Business,
actual results may materially differ from forward-looking statements in the short term.
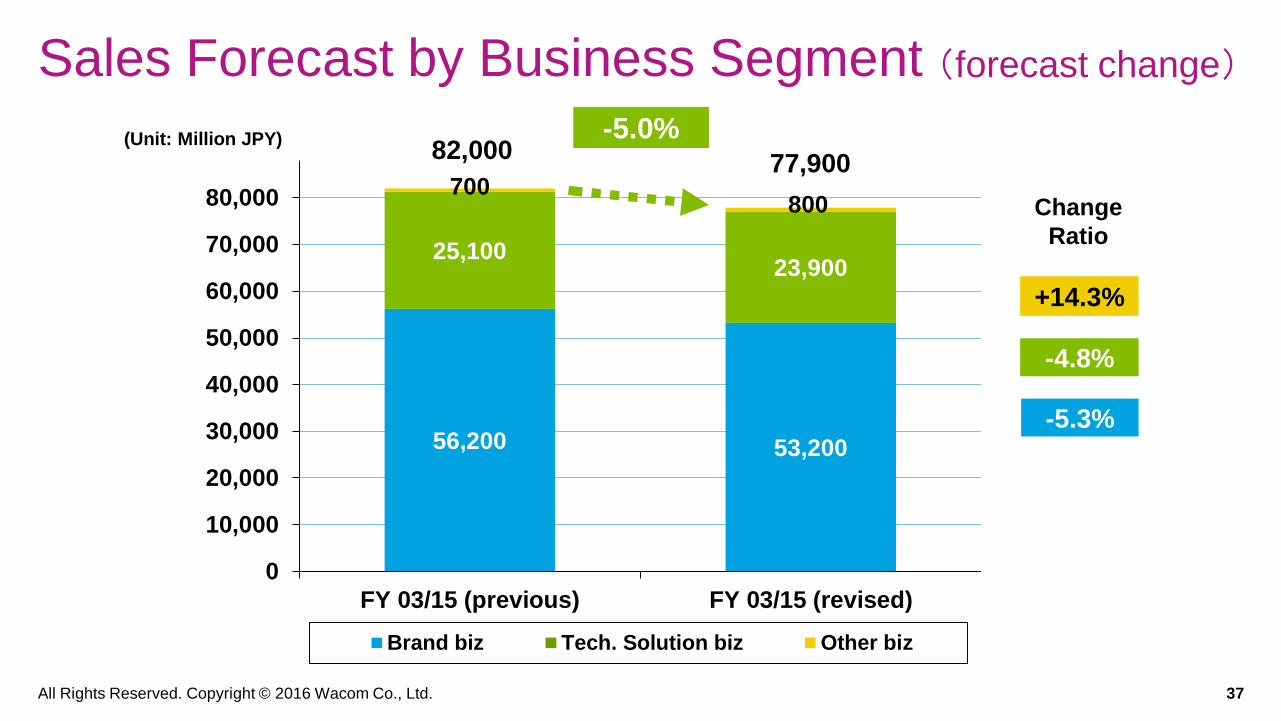
Forecast by Business Segment
FY 03/17 (prev.) FY 03/17 (rev.) Prev. vs. Rev.
04/16-03/17 04/16-03/17 Amount Change
Net Sales 82,000 77,900 -4,100 -5.0%
Brand biz 56,200 53,200 -3,000 -5.3%
Tech. Solution biz 25,100 23,900 -1,200 -4.8%
Other biz 700 800 100 14.3%
Operating Income 4,200 2,400 -1,800 -42.9%
Brand biz 11,400 9,660 -1,740 -15.3%
Tech. Solution biz 1,600 1,390 -210 -13.1%
Other biz 50 190 140 3.8倍
Corp. and others -8,850 -8,840 10 -0.1%
profit margin % 5.1% 3.1%
(Unit: Mil JPY)
(forecast comparison)
All Rights Reserved. Copyright © 2016 Wacom Co., Ltd. 33
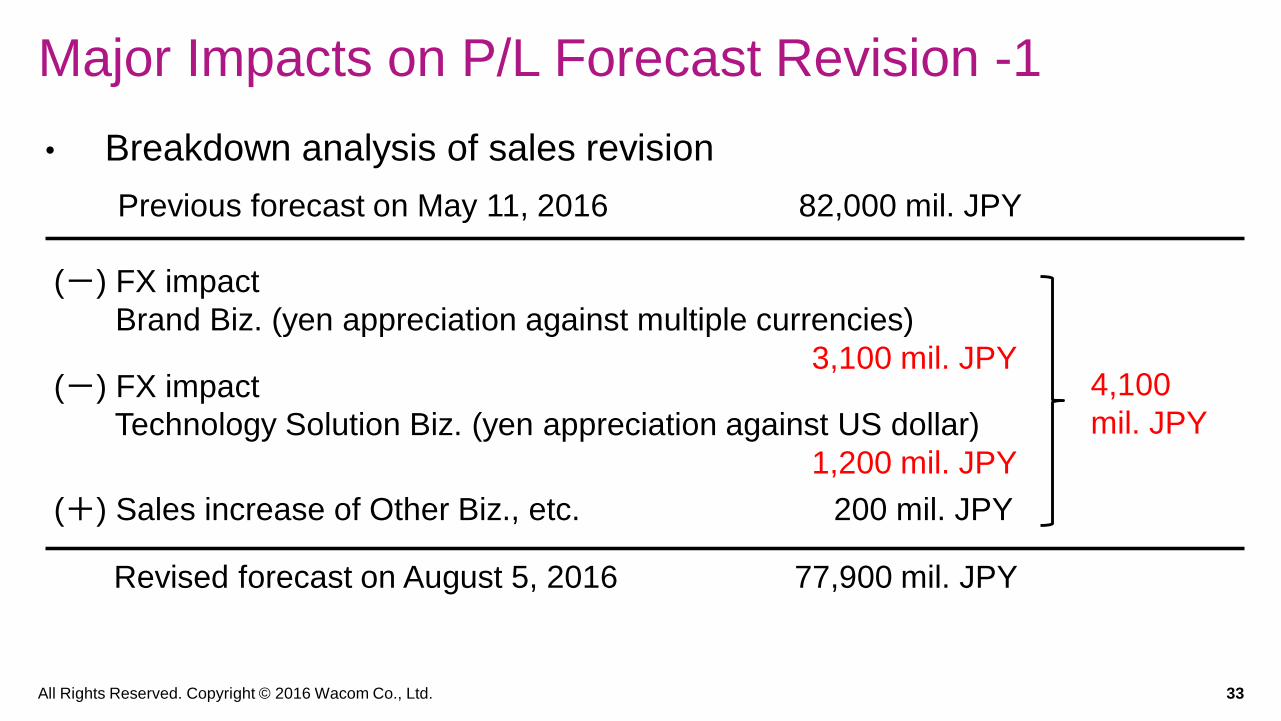
Major Impacts on P/L Forecast Revision -1
• Breakdown analysis of sales revision
Previous forecast on May 11, 2016 82,000 mil. JPY
(-) FX impact
Brand Biz. (yen appreciation against multiple currencies)
3,100 mil. JPY(-) FX impact
Technology Solution Biz. (yen appreciation against US dollar)
1,200 mil. JPY
(+) Sales increase of Other Biz., etc. 200 mil. JPY
Revised forecast on August 5, 2016 77,900 mil. JPY
4,100
mil. JPY

All Rights Reserved. Copyright © 2016 Wacom Co., Ltd. 34
• Breakdown analysis of sales revision
Previous forecast on May 11, 2016 4,200 mil. JPY
(-) FX impact
Brand Biz. (yen appreciation against euro and Asian currencies)
1,000 mil. JPY(-) FX impact
Technology Solution Biz. (yen appreciation against US dollar)
200 mil. JPY(-) FX impact COGS increase due to FX impact on inventory valueby time lag between purchase and sales(yen appreciation against multiple currencies) 400 mil. JPY
(-) Product mix change in sales, etc. 200 mil. JPY
Revised forecast on August 5, 2016 2,400 mil. JPY
Major Impacts on P/L Forecast Revision -1
1,800
mil. JPY

All Rights Reserved. Copyright © 2016 Wacom Co., Ltd. 35
Forecast of Results by Business Segment
• Brand Business
• Sales and profit were revised downward, mainly due to yen appreciation. However, sales and
profit are expected to increase from prior fiscal year owing to new product launches in major
product lines and cost efficiency improvement in Creative Business.
• As for pen tablets, next model for professionals are scheduled to launch in Q4. Meantime,
middle and lower price model of pen tablets for emerging market are expected to
contribute to overall sales until Q3 (foreseeing temporally lower ASP).• As for mobile and display products, next models are scheduled to launch from Q3, adding
features such as next generation pen technology, advanced functions of 3D and color
management, to lift up competitive edge.
• As for Consumer Business, enhancement of line-up of digital stationery product and
expansion of sales channels are expected in place. At the same time, we will pursue to
stabilize customer demand for existing stylus products by sales and marketing effort.
• As for Business Solution, wider extension of workflow and security solutions utilizing digital
signature is a key for recovery. While Asian market is expanding, we should take account
of European market slowdown under economy uncertainties.
(All comparisons are with the same period of the previous fiscal year unless otherwise stated )

All Rights Reserved. Copyright © 2016 Wacom Co., Ltd. 36
Forecast of Results by Business Segment
• Technology Solution Business
• Technology Solution Business is expected to decrease in both sales and operating income
from prior fiscal year due to the yen appreciation.
• Sales for Galaxy Note 7, a new smartphone model, are expected to remain the same level
of the previous forecast, owing to full mass production, offsetting foreign exchange impact.
• As for tablets, customer base for Active ES pen solutions is expected to expand. However,
sales are expected to decrease due to the yen appreciation and delay of shift to tablets
from notebook PCs by a certain customer.
• Contribution from standardized pen for Windows tablets to financial results in this fiscal
year is limited.
• Sales of educational tablet for Turkey government accounted in prior fiscal year are not
expected in this fiscal year.
• Corporate and others
• An increase of depreciation expense is expected from prior fiscal year due to implementation
of global IT infrastructure system.
(All comparisons are with the same period of the previous fiscal year unless otherwise stated )
All Rights Reserved. Copyright © 2016 Wacom Co., Ltd. 37
Sales Forecast by Business Segment
56,200 53,200
25,10023,900
700800
0
10,000
20,000
30,000
40,000
50,000
60,000
70,000
80,000
FY 03/15 (previous) FY 03/15 (revised)
Brand biz Tech. Solution biz Other biz
+14.3%
-5.3%
-4.8%
-5.0%82,000
77,900(Unit: Million JPY)
Change
Ratio
(forecast change)

All Rights Reserved. Copyright © 2016 Wacom Co., Ltd. 38
Sales Forecast by Product line in Brand Product
25,700 23,800
5,9005,800
14,70014,600
3,3002,500
6,6006,500
0
10,000
20,000
30,000
40,000
50,000
FY 03/15 (previous) FY 03/15 (revised)
Creative・Pen tablet Creative・Mobile Creative・DisplayConsumer Business Solution
-24.2%
-1.7%
-7.4%
-0.7%
-1.5%
53,20056,200-5.3%
Creative
biz
46,300
Creative
biz
44,200
-4.5%
(Unit: Million JPY)
Change
Ratio
(forecast change)
All Rights Reserved. Copyright © 2016 Wacom Co., Ltd. 39
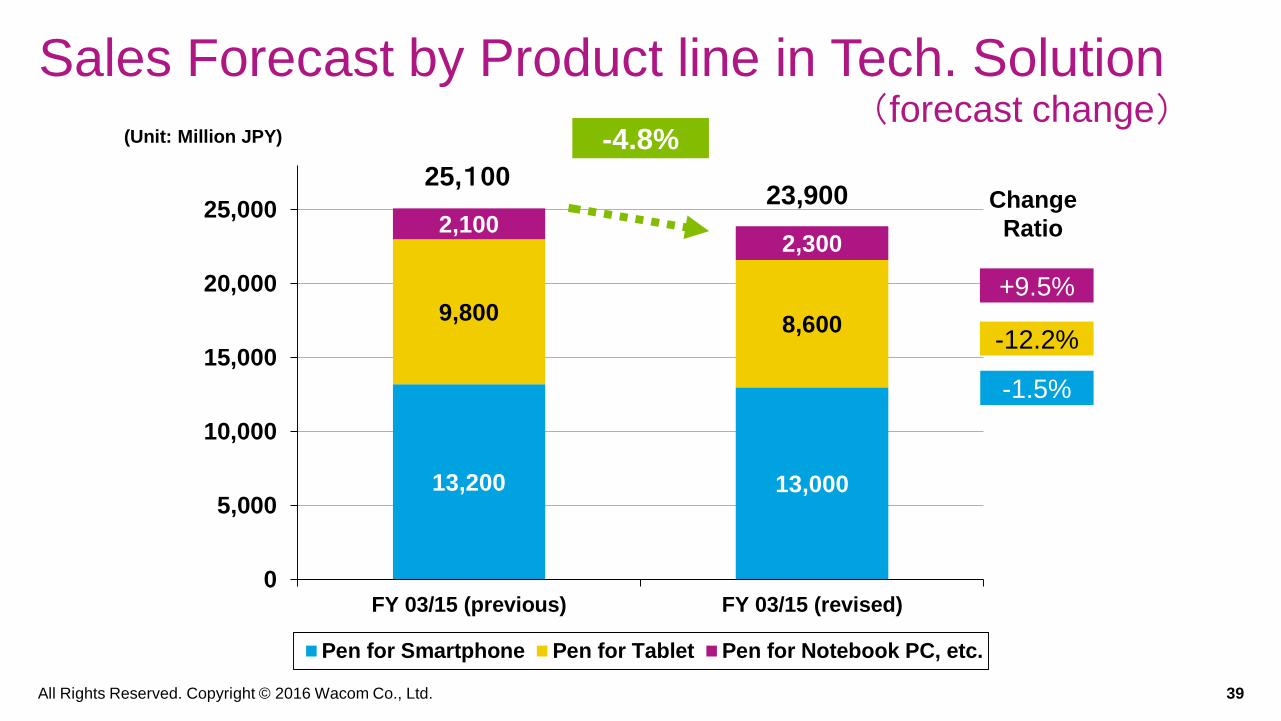
Sales Forecast by Product line in Tech. Solution
13,200 13,000
9,8008,600
2,1002,300
0
5,000
10,000
15,000
20,000
25,000
FY 03/15 (previous) FY 03/15 (revised)
Pen for Smartphone Pen for Tablet Pen for Notebook PC, etc.
+9.5%
-12.2%
-1.5%
23,90025,100
-4.8%(Unit: Million JPY)
Change
Ratio
(forecast change)

All Rights Reserved. Copyright © 2016 Wacom Co., Ltd. 40
Sales Forecast by Region
25,100 23,900
9,080 9,310
17,410 16,010
17,17016,190
13,24012,490
0
10,000
20,000
30,000
40,000
50,000
60,000
70,000
80,000
FY 03/15 (previous) FY 03/15 (revised)
Tech. Solution Japan U.S. Germany Asia Oceania
-5.7%
-8.0%
+2.5%
-4.8%
-5.7%
82,000-5.0%
77,900
(Unit: Million JPY)Change
Ratio
(forecast change)
(Note) There are no regional segments in the Tech. Solution Biz.
All Rights Reserved. Copyright © 2016 Wacom Co., Ltd. 41
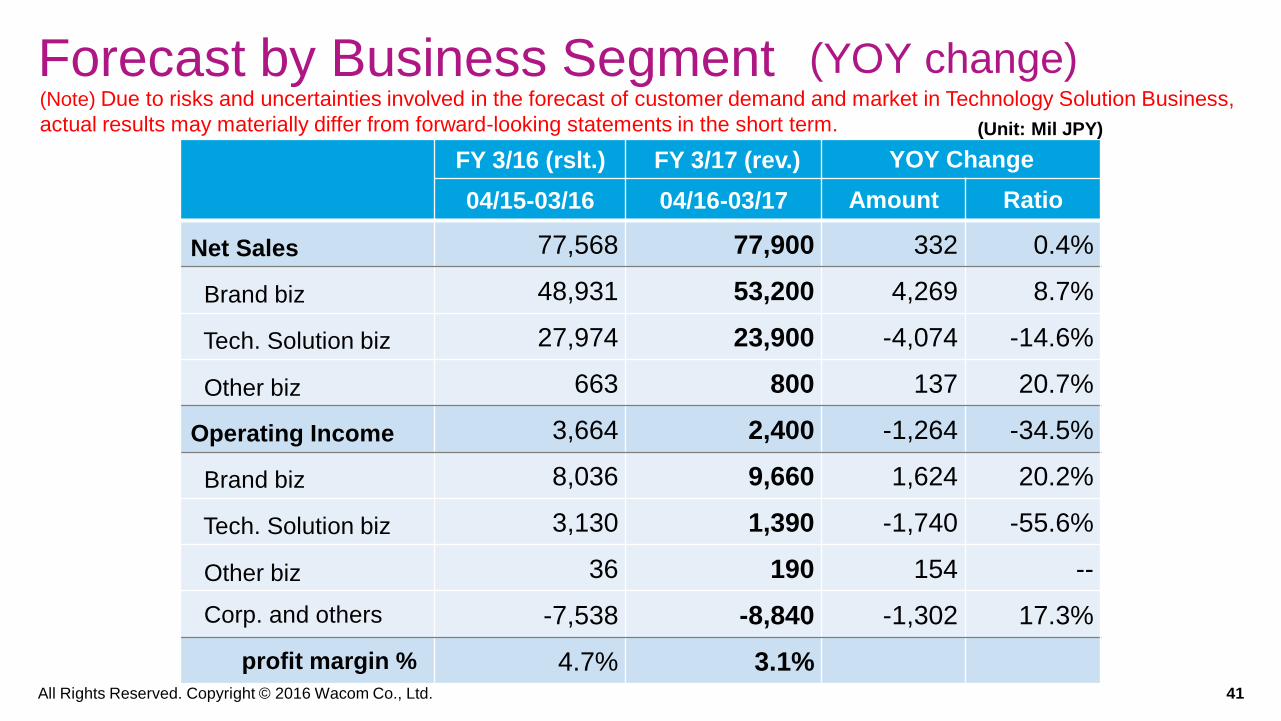
(Note) Due to risks and uncertainties involved in the forecast of customer demand and market in Technology Solution Business,
actual results may materially differ from forward-looking statements in the short term.
Forecast by Business Segment
FY 3/16 (rslt.) FY 3/17 (rev.) YOY Change
04/15-03/16 04/16-03/17 Amount Ratio
Net Sales 77,568 77,900 332 0.4%
Brand biz 48,931 53,200 4,269 8.7%
Tech. Solution biz 27,974 23,900 -4,074 -14.6%
Other biz 663 800 137 20.7%
Operating Income 3,664 2,400 -1,264 -34.5%
Brand biz 8,036 9,660 1,624 20.2%
Tech. Solution biz 3,130 1,390 -1,740 -55.6%
Other biz 36 190 154 --
Corp. and others -7,538 -8,840 -1,302 17.3%
profit margin % 4.7% 3.1%
(Unit: Mil JPY)
(YOY change)

All Rights Reserved. Copyright © 2016 Wacom Co., Ltd. 42
Sales Forecast by Business Segment
48,931 53,200
27,974 23,900
663 800
0
10,000
20,000
30,000
40,000
50,000
60,000
70,000
80,000
FY 03/16 (result) FY 03/17 (forecast)
Brand biz Tech. Solution biz Other biz
+20.7%
+8.7%
-14.6%
+0.4%
77,568 77,900
(YOY change)
(Unit: Million JPY)
Change
Ratio

All Rights Reserved. Copyright © 2016 Wacom Co., Ltd. 43
Sales Forecast by Product line in Brand Product
24,148 23,800
4,453 5,800
13,22314,600
2,1492,5004,9586,500
0
10,000
20,000
30,000
40,000
50,000
FY 03/16 (result) FY 03/17 (forecast)
Creative・Pen tablet Creative・Mobile Creative・DisplayConsumer Business Solution
+16.3%
+30.3%
-1.4%
+10.4%
+31.1%
53,200
48,931
+8.7%
Creative
biz
41,824
Creative
biz
44,200
+5.7%
(Unit: Million JPY)
Change
Ratio
(YOY change)
All Rights Reserved. Copyright © 2016 Wacom Co., Ltd. 44
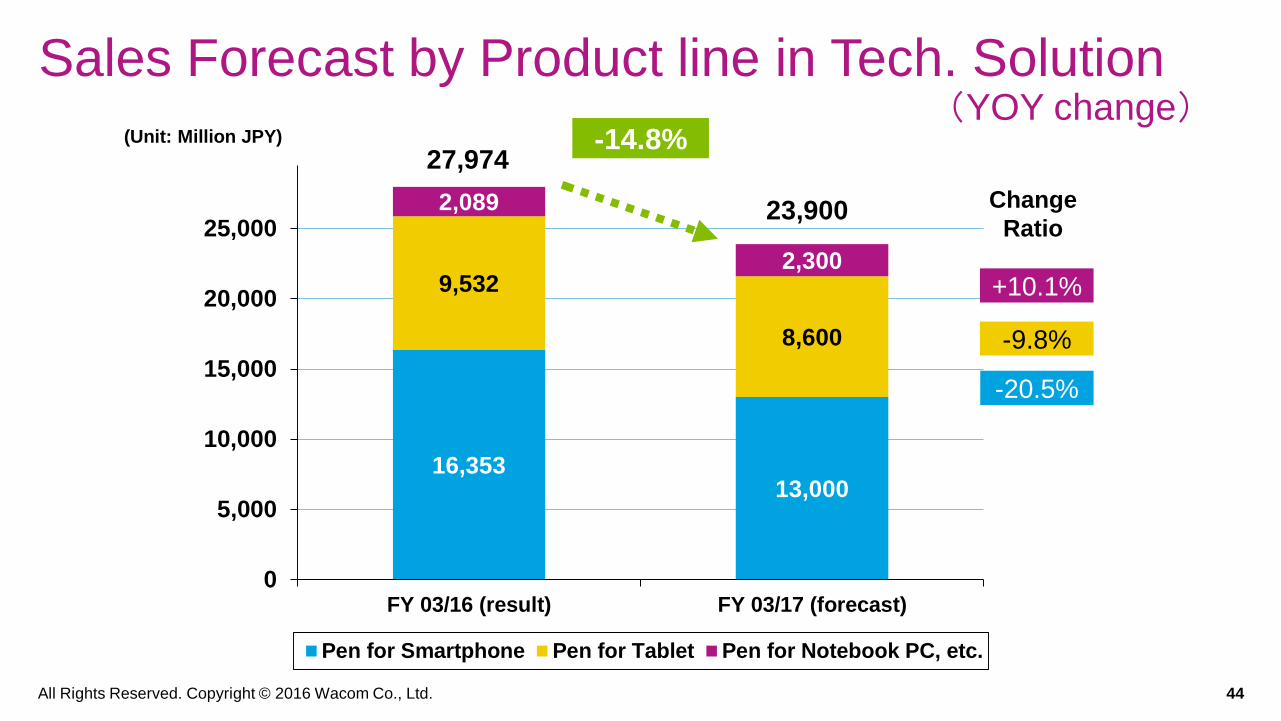
Sales Forecast by Product line in Tech. Solution
16,35313,000
9,532
8,600
2,089
2,300
0
5,000
10,000
15,000
20,000
25,000
FY 03/16 (result) FY 03/17 (forecast)
Pen for Smartphone Pen for Tablet Pen for Notebook PC, etc.
+10.1%
-9.8%
-20.5%
23,900
27,974-14.8%
(YOY change)(Unit: Million JPY)
Change
Ratio

All Rights Reserved. Copyright © 2016 Wacom Co., Ltd. 45
Sales Forecast by Region
27,974 23,900
7,9149,310
15,63116,010
14,845 16,190
11,204 12,490
0
10,000
20,000
30,000
40,000
50,000
60,000
70,000
80,000
FY 03/16 (result) FY 03/17 (forecast)
Tech. Solution Japan U.S. Germany Asia Oceania
+11.5%
+2.4%
+17.6%
-14.6%
+9.1%
77,568
+0.4%77,900
(YOY change)
(Unit: Million JPY)Change
Ratio
(Note) There are no regional segments in the Tech. Solution Biz.

All Rights Reserved. Copyright © 2016 Wacom Co., Ltd. 46
Investment, depreciation and R&D
Capital expenditure
4.00 bn JPY (YOY -17.7%) (no revision)
• Key items: Mold for new products and global IT systems (mainly ERP), etc.
Depreciation
2.80 bn JPY (YOY +39.7%) (previous forecast: 3.20 bn JPY)
・ Key items: Depreciation of new global IT systems, etc.
R&D expense
4.60 bn JPY (YOY + 5.9%) (previous forecast: 4.70 bn JPY)
• Key items: New products development in Brand Business,next generation ICs and basic technology research, etc.

All Rights Reserved. Copyright © 2016 Wacom Co., Ltd. 47
Shareholders Return Policy for FY 03/2017Acquisition of own shares and Cancellation of treasury stock
Acquire its own shares for the purpose of enhancing return to shareholders, improving capital efficiency, and ensuring a flexible capital policy management in response to changes in the Company’s business environment. Execute cancellation of certain treasury stocks in accordance with acquisition.
Acquisition of own shares
• Total number of shares to be acquired: Up to 5,000,000 shares
(equivalent of 3.04% of outstanding shares)
• Total acquisition cost: Up to 2.0 bn JPY
• Acquisition period: From May 12, 2016 to March 31, 2017 (the extension of acquisition
period was resolved on August 5)
Cancellation of treasury stock• Total number of shares cancelled: 2,500,000 shares (equivalent of 1.48% of outstanding
shares)
• Date of cancellation: May 25, 2016

All Rights Reserved. Copyright © 2016 Wacom Co., Ltd. 48
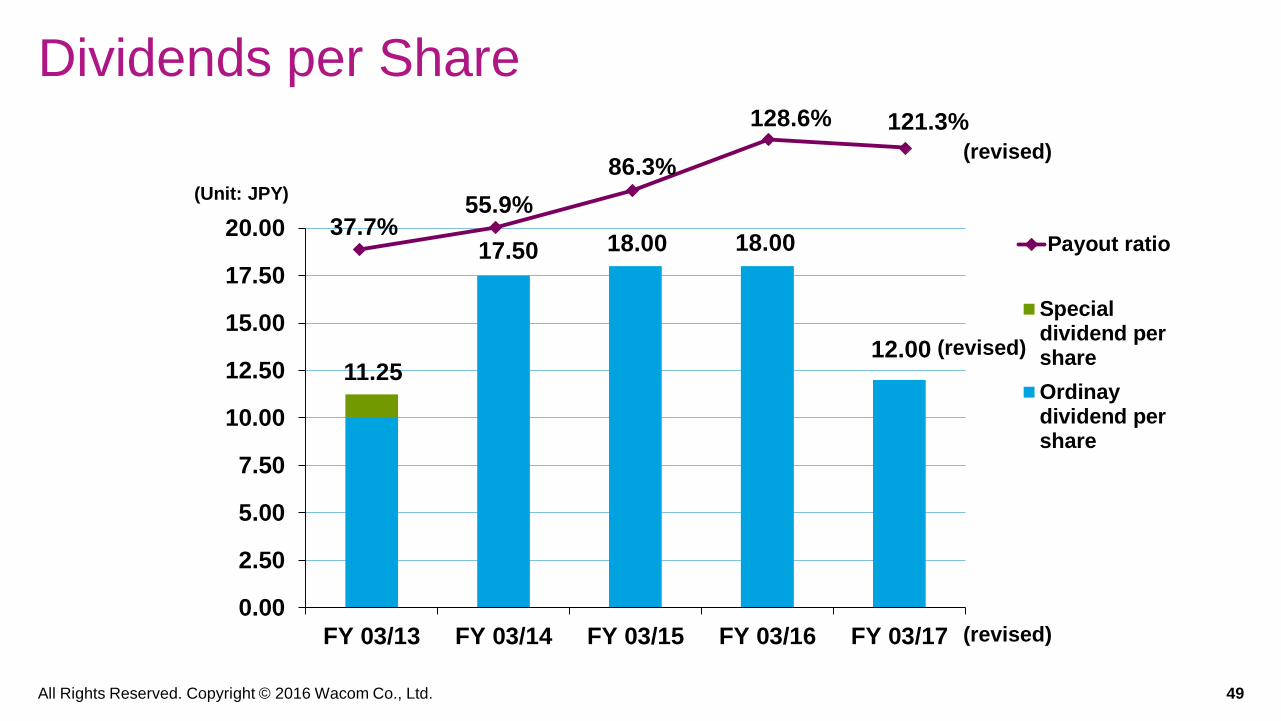
Shareholders Return Policy for FY 03/2017
Dividend policy
• Continue steady dividend payout to shareholders while maintaining a stable financial base necessary for future business development.
• Target payout ratio maintains approximately 40% or more to attract global investment.
• Revised downward dividend forecast for FY3/17 to reflect our revised business forecast, and maintain sound financial base.
Dividend per share
• 12.00 JPY per share for FY 03/2017 (18.00 JPY for FY 03/2016) (previous forecast: 18.00 JPY )
• Payout ratio 121.3% (128.6% for FY 03/2016) (previous estimation: 98.7%)
Total return ratio for shareholders
• Total return ratio: 244.8% (FY 03/2017 forecast) (previous estimation: 165.4%)
(details) Payment of shareholders’ dividends 1.97 bn JPY (forecast)Acquisition of own shares Up to 2.00 bn JPY
All Rights Reserved. Copyright © 2016 Wacom Co., Ltd. 49
Dividends per Share
0.00
2.50
5.00
7.50
10.00
12.50
15.00
17.50
20.00
FY 03/13 FY 03/14 FY 03/15 FY 03/16 FY 03/17
Specialdividend pershare
Ordinaydividend pershare
37.7%55.9%
86.3%
128.6% 121.3%
Payout ratio
11.25
18.0017.50 18.00
(Unit: JPY)
(revised)
(revised)
(revised)12.00

Wacom Strategic Business Plan
SBP-2019Evolve the business model toward mobile and
Cloud for reaching new customers as well as
expanding existing business. In addition, improve
the speed and profitability by leveraging our global
business infrastructure.
Financial Goals by FY ending March, 2019
• Consolidated sales: 120 billion JPY
• Consolidated operating profit margin: 12%
• Consolidated ROE: 20% or higher

All Rights Reserved. Copyright © 2016 Wacom Co., Ltd. 51
43,625 48,931 53,200
75,300
3,100 30,277
27,974 23,900
43,700
1,200655
663
800
1,000
0
20,000
40,000
60,000
80,000
100,000
120,000
FY 03/15 FY 03/16 FY 03/17 FY 03/18 FY 03/19
Impact by FX changes
Other biz
Tech. Solution biz
Brand biz
(sales excluding negative
impact of FX changes)
Consolidated Sales
74,55777,568
82,100
120,000
104,000
The target for FY 03/19 is maintained as we expect Brand Business to exceed the original plan excluding negative impact by FX changes, hedging risks of the underperformance of Tech. Solution Biz.
CAGR
(Unit: Million JPY)
Consolidated
Sales
13%
10%
15%
(revised
forecast)
(plan) (plan)(result) (result)

All Rights Reserved. Copyright © 2016 Wacom Co., Ltd. 52
6,143
3,664
2,400
10,400
14,400
3,473
2,310
1,620
7,070
9,800
0
5,000
10,000
15,000
FY 03/15 FY 03/16 FY 03/17 FY 03/18 FY 03/19
Consolidated Profits
30%
24%
(単位: 百万円)
4,000
1,6001,120
2,740
Raise profitability by significant improvement of
operational efficiency and quick decision-making
through leveraging global IT Infrastructure.
(plan) (plan)(result) (result) (revised
forecast)
(profits excluding negative
impact of FX changes)
CAGR

All Rights Reserved. Copyright © 2016 Wacom Co., Ltd. 53
SBP-2019 Basic Strategy
Evolve the business toward mobile, Cloud and ecosystems.
Accelerate the growth with a new global business organization and enhanced global integration.
Accelerate creative business with mobile product line expansion, 3D penetration and emerging market investment.
Reach new consumer users with Digital Stationery and Cloud.
Expand the Technology Solution Business with AES and WILL (Wacom Ink Layer Language).
Enhance business workflow and security solutions by leveraging WILL and digital signature solutions.
Leverage global business system for efficiency, speed and profitability.

All Rights Reserved. Copyright © 2016 Wacom Co., Ltd. 54
our vision

All Rights Reserved. Copyright © 2016 Wacom Co., Ltd. 55our mission

All Rights Reserved. Copyright © 2016 Wacom Co., Ltd. 56
our brand

DisclaimerForward-looking statements regarding future events and
performance contained in this presentation are based on currently
available information and involve risks and uncertainties, including
macroeconomic conditions, trends of the industry in which the
company is engaged and progress in new technologies. Please
note that actual results could materially differ from those expressed
or implied by the forward-looking statements in this presentation
due to these risks and uncertainties.
Investor Relations Inquiries
TEL: +81-3-5337-6502 FAX: +81-3-5337-6519
Wacom Co., Ltd.
Sumitomo Fudosan Shinjuku Grand Tower 31F,
8-17-1 Nishi-Shinjuku, Shinjuku-ku, Tokyo
160-6131, Japan
Wacom Co., Ltd.
http://www.wacom.com