april, 2005 investor presentation
TRANSCRIPT
April, 2005 WWW.CENTERTELECOM.RU
Investor presentation

WWW.CENTERTELECOM.RU
This presentation contains forward-looking statements. Such statements are not statements of historical fact, and reflect the beliefs and expectations of the Company's management. The words "anticipates," "believes," "estimates," "expects," "forecasts," "intends," "plans," "predicts," "projects" and "targets" and similar words are intended to identify these statements, which necessarily involve known and unknown risks and uncertainties. Accordingly, the actual results of operations of the Company may be different from the Company's current expectations, and the reader should not place undue reliance on these forward-looking statements. Forward-looking statements speak only as of the date they are made, and the Company does not undertake any obligation to update them in light of new information or future developments.
April, 2005

WWW.CENTERTELECOM.RU
Tver
YaroslavlKostroma
Ivanovo
Vladimir
SmolenskKaluga
Ryazan
Tula
BryanskOrel
Lipetsk Tambov
VoronezhKursk
Belgorod
Moscow
Central District: 17 Subjects of the Federation of the Central part of Russia
covers 3.8% of Russia’s territory 26.2% of total population of 38 mln
people (most densely populated) 12.8% of GDP of RUR 1,703 bln
One of the highest monthly income per
capita in Russia - RUR 6450
Fixed-line penetration level is 23.7%
Digitalization level is 48%
6.8 mln lines installed by end of 2004
Borders with Ukraine and Byelorussia
ATTRACTIVE REGION
April, 2005

WWW.CENTERTELECOM.RU
SHAREHOLDER STRUCTURE
38,02
20,91
10,11
8,83
9,717,19 4,36
0,88
Svyazinvest
Other nominalshareholders
Brunswick UBS(nominal)
ABN AMRO(nominal)
Individuals
Federal PropertyFund
Foreign legalentities
Russian legalentities
Share capital – USD 225 mn
Number of shares – 2.103.999.655 of which:
ordinary – 75%, preferred – 25%
Free float shares – 55%
April, 2005
WWW.CENTERTELECOM.RU
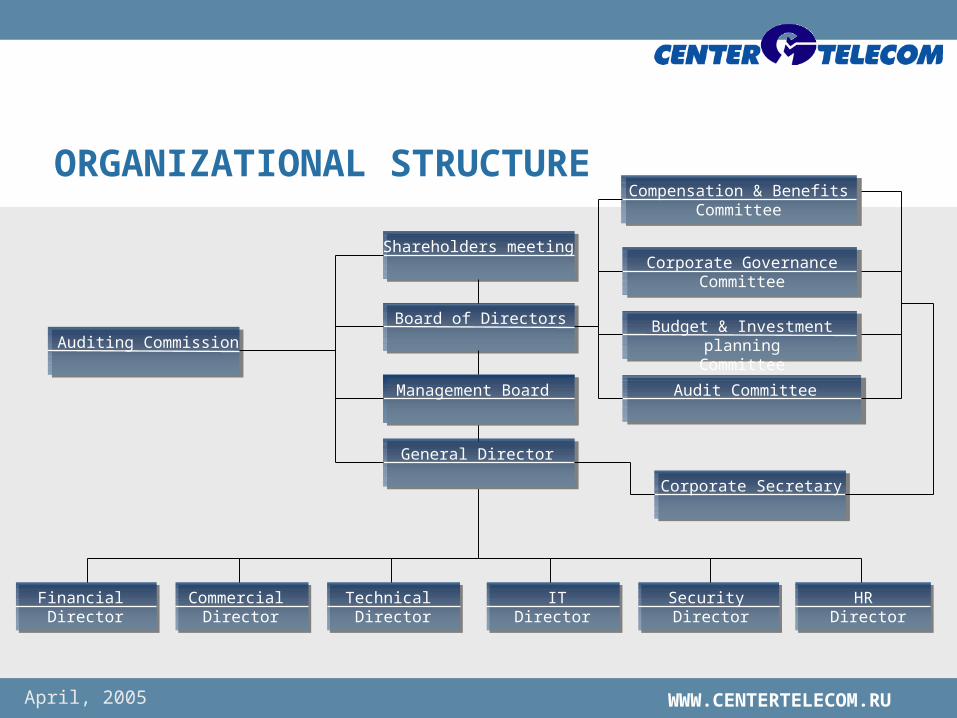
ORGANIZATIONAL STRUCTURE
PRESIDENT
Carla Cico
PRESIDENT
Carla Cico
Financial Director
PRESIDENT
Carla Cico
Shareholders meeting
PRESIDENT
Carla Cico
Board of Directors
PRESIDENT
Carla Cico
PRESIDENT
Carla Cico
PRESIDENT
Carla Cico
PRESIDENT
Carla Cico
PRESIDENT
Carla Cico
Board of Directors
Compensation & Benefits Committee
Corporate GovernanceCommittee
Budget & Investment planning
Committee
Audit Committee
PRESIDENT
Carla Cico
PRESIDENT
Carla Cico
PRESIDENT
Carla Cico
PRESIDENT
Carla Cico
Commercial Director
Technical Director
ITDirector
Security Director
HR Director
PRESIDENT
Carla Cico
General Director
PRESIDENT
Carla Cico
Management Board
PRESIDENT
Carla Cico
Auditing Commission
PRESIDENT
Carla Cico
Corporate Secretary
April, 2005

WWW.CENTERTELECOM.RU
KEY PRODUCTION INDICATORS
• 6,8 mln access lines installed• 26 long distance connection stations• 3,0 mln wire broadcasting points• 15 cable television networks in big cities• 112 thousand mobile subscribers• more than 50 thousand cable television subscribers•
April, 2005

WWW.CENTERTELECOM.RU
MARKET SHARE IN MAJOR SEGMENTS
85%
91%
57%
2,90%
64%
0% 10% 20% 30% 40% 50% 60% 70% 80% 90% 100%
Long-distance
Local
Documentary
Mobile
New services (based on IP,VPN, INS, ISDN)
April, 2005

WWW.CENTERTELECOM.RU
KEY FINANCIALS (RAS) (RUR, mln)
2002 2003 2004
Revenues 16,4 20,89 24,963
Operating expenses 12,132 15,649 19,702
EBITDA 3,337 4,853 5,377
Net profit 1,084 1,503 0,398
CAPEX 4,701 7,563 9,409
RUR Mln
April, 2005

WWW.CENTERTELECOM.RU
KEY FINANCIALS
Major income components (RUR, bn)
10,6
9,6
2,56
2,2
Local
Long-distance and internationalcommunication services
Other
Income generated by service providers
April, 2005

WWW.CENTERTELECOM.RU
REVENUEIn 2004 gross revenue reached RUR 24,963 mln, 19.5% growth to 2003
Traffic transition9%
Pay phone1,1%
Wire broadcast2,6%
Wireless communication1,3%
City telephone communicatiom
37,6%
Long-distance telephone communication
38,3%
Documentary telecommunication
1,7%
Broadcasting, television0,2%
Country telephone communication
5,4%
New services (Internet, ISDN, IP-telephony,
Intelligent networks, other )3,0%
April, 2005

WWW.CENTERTELECOM.RU
OPERATING COSTS AND EXPENSES
In 2004 operating costs and expenses totaled RUR 19,702 mln, 25.9% increase 2003
Property insurance payments1%
Wages32%
Social tax10%
Amortisation13%
Materials & spare parts 7%
Energy3%
Repair work4%
Rostelecom service payment16%
Leasing2%
Other costs9%
Other telecommunication service payment
3%
April, 2005

WWW.CENTERTELECOM.RU
KEY OPERATING HIGHLIGHTS
Total number of lines installed for the2004 grew to 6 798 128, including 619 291 lines commissioned in 2003
Long-distance traffic increased 104.2% to 2.8 bnminutes compared to the last year
Long-distance (international) traffic increased 106.7% to 197.8 m minutes compared to 2003
April, 2005

WWW.CENTERTELECOM.RU
CAPEX DYNAMICS
0
1
2
3
4
5
6
7
8
9
10
2002 2003 2004 2005E
RUR Bln
forecast
4.8
7.6
9.4
3.8
36%
64%
71%
29%
73%
27%68%
32%
Equity capital
Debt capital Volume Placed, RUR mln
Placement Date
YTM PeriodCouponsNimber
600 23.11.2001 18,89 2 3/4 years 62000 17.09.2003 12,73 3 years 65 623 31.08.2004 14,27 5 years 10
Bonded loans
April, 2005

WWW.CENTERTELECOM.RU
CAPITAL INVESTMENTS
In 2004 RUR 9.4 bln were invested (23% growth to 2003)
61,80%
3,59%
0,55%
4,12%
1,77%
22,37%
5,35% 0,46%
Traditional telephony
New services
Infrastructure units
Purchase, construction andreconstruction
IT Investments
Transmission lines
Other infrastructure
Special investments
April, 2005

WWW.CENTERTELECOM.RU
STRATEGY. Main directions
Increase of overall performance in highly remunerative segments of the market
Orientation to highly remunerative client segments
Development of services with the high added value
Expansion of services spectrum Investments in new technologies
Operational expenses reduction
Affiliated business restructuring Management structure optimization
(association of branches - reduction of its quantity from 17 to to 6-8)
Personnel number optimization (5% annual reduction)
Outsourcing of auxiliary and not profile business-functions
April, 2005

WWW.CENTERTELECOM.RU
STRATEGY
Increase share of value-added services in profit structure
Achieve revenue market share in telecommunication services in Central region of 62% by 2006
Average annual income growth of 25%
Increase non-regulated services market share to 75%
Achieve share of non-regulated services in profits of at least 30%
Increase profit share from corporate sector to 52%
April, 2005

WWW.CENTERTELECOM.RU
STRATEGY. Affiliated business restructuring
2004
Liquidation of non profile and non efficient businesses
Merging to ROSNET 5 companies – leaders in non regulated services in its regions
Acquisition of ROSNET
2005
AS A RESULT
Effective investment structure Management structure optimization Growth of competitiveness Cutting down operational costs Optimization of cash flow structure
Large corporate client base, including Central Bank of Russia 2004 Revenue - $30 mn Licenses for data services in 51 region
April, 2005

WWW.CENTERTELECOM.RU
CenterTelecom – Potential of growth
Prospects of telecommunication sector growth as a
whole
Regions of Company’s operation – the most
attractive in Russia
Advanced Company’s infrastructure network
High potential of growth in highly remunerative
telecommunication services
Experienced management team
High corporate governance level April, 2005

WWW.CENTERTELECOM.RU
CONTACTS
Andrey KalinchenkoInvestor relations managerTel: +7 095 793 23 40Fax: +7 095 209 58 15E-mail: [email protected]
Elena RomskayaDirector, Securities and Corporate Governance DepartmentTel: +7 095 793 23 19Fax: +7 095 209 28 29E-mail: [email protected]
April, 2005