april 17, 2019 i industry research indian readymade ... · industry research i indian apparel...
TRANSCRIPT

Overview
The Indian Textiles and Apparels (T&A) industry accounts for
approximately 4% of the global T&A market. The T&A industry is
one of the largest and the most important sectors for the Indian
economy in terms of output, foreign exchange earnings and
employment. The industry contributes approximately 7% to
industrial output in value terms, 2% to the GDP and 15% to the
country’s export earnings. It also provides direct employment to
over 45 million people and is the second largest provider of
employment after agriculture. As per the WTO in its World Trade
Statistical Review 2018, India is ranked as 5th largest exporter of
RMG in the world.
Indian readymade garments/apparels (RMG) industry is the
largest segment of the Indian T&A Industry accounting for
approximately 50% of the total industry. The domestic RMG sector
accounts for approximately three-fourths of the total Indian RMG
industry. Given that RMG manufacturing units can be viable at all
size levels, particularly because of low cost of plant and
machinery, the units range from small to large. Consequently, the
RMG sector continues to be dominated by unorganized players.
However, the branded apparel market has made steady inroads in
the past few years.
The decentralized power looms and knitting sector forms the
largest section of the textile sector. The major sub-sectors that
comprise the textile sector include the organized
cotton/manmade fiber textile mill industry, the manmade
fiber/filament yarn industry, the wool & woollen textile industry,
the sericulture and silk textiles industry, handlooms, the jute &
jute textiles industry and textiles exports. The government has
introduced policies like TUFS, SITP, high import tariffs (to
discourage imports) and NTP for the development of the textile
sector.
A growing economy, rising disposable income and the growing
aspirations of Indian consumers is expected to drive growth in the
Indian T&A industry.
The textile value chain comprises of spinning, weaving, knitting
and garmenting. Also, it uses different materials such as cotton,
jute, and wool, silk, man-made and synthetic fibres.
April 17, 2019 I Industry Research Indian Readymade
Garments (Apparel)
Industry Overview
Contact: Madan Sabnavis Chief Economist [email protected] +91-22- 6837 4433
Saurabh Bhalerao Associate Director – Industry Research [email protected] +91-22-6837 4425
Mradul Mishra (Media Contact) [email protected] +91-22-6837 4424
Disclaimer: This report is prepared by CARE Ratings Ltd. CARE Ratings has taken utmost care to ensure accuracy and objectivity while developing this report based on information available in public domain. However, neither the accuracy nor completeness of information contained in this report is guaranteed. CARE Ratings is not responsible for any errors or omissions in analysis/inferences/views or for results obtained from the use of information contained in this report and especially states that CARE Ratings has no financial liability whatsoever to the user of this report
Industry Research I Indian Apparel Industry Overview
2
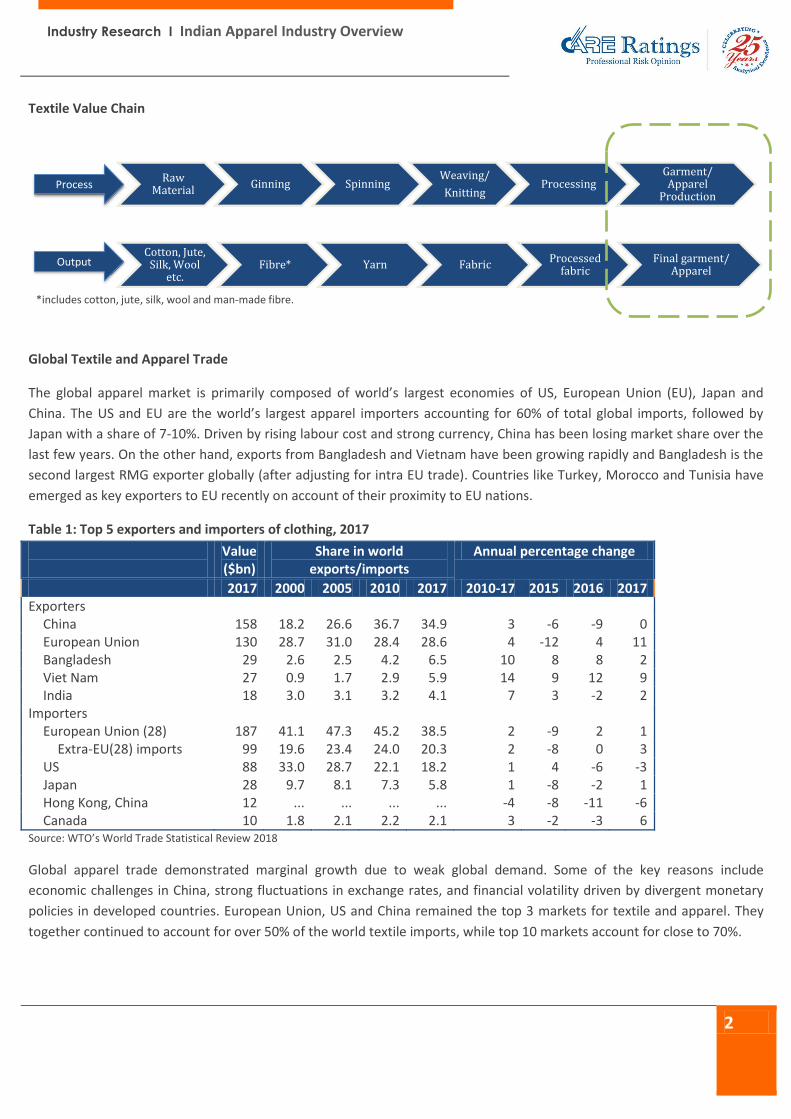
Textile Value Chain
Global Textile and Apparel Trade
The global apparel market is primarily composed of world’s largest economies of US, European Union (EU), Japan and
China. The US and EU are the world’s largest apparel importers accounting for 60% of total global imports, followed by
Japan with a share of 7-10%. Driven by rising labour cost and strong currency, China has been losing market share over the
last few years. On the other hand, exports from Bangladesh and Vietnam have been growing rapidly and Bangladesh is the
second largest RMG exporter globally (after adjusting for intra EU trade). Countries like Turkey, Morocco and Tunisia have
emerged as key exporters to EU recently on account of their proximity to EU nations.
Table 1: Top 5 exporters and importers of clothing, 2017
Value ($bn)
Share in world exports/imports
Annual percentage change
2017 2000 2005 2010 2017 2010-17 2015 2016 2017 Exporters
China 158 18.2 26.6 36.7 34.9 3 -6 -9 0 European Union 130 28.7 31.0 28.4 28.6 4 -12 4 11 Bangladesh 29 2.6 2.5 4.2 6.5 10 8 8 2 Viet Nam 27 0.9 1.7 2.9 5.9 14 9 12 9 India 18 3.0 3.1 3.2 4.1 7 3 -2 2
Importers European Union (28) 187 41.1 47.3 45.2 38.5 2 -9 2 1
Extra-EU(28) imports 99 19.6 23.4 24.0 20.3 2 -8 0 3 US 88 33.0 28.7 22.1 18.2 1 4 -6 -3 Japan 28 9.7 8.1 7.3 5.8 1 -8 -2 1 Hong Kong, China 12 ... ... ... ... -4 -8 -11 -6 Canada 10 1.8 2.1 2.2 2.1 3 -2 -3 6
Source: WTO’s World Trade Statistical Review 2018
Global apparel trade demonstrated marginal growth due to weak global demand. Some of the key reasons include
economic challenges in China, strong fluctuations in exchange rates, and financial volatility driven by divergent monetary
policies in developed countries. European Union, US and China remained the top 3 markets for textile and apparel. They
together continued to account for over 50% of the world textile imports, while top 10 markets account for close to 70%.
Raw Material
Ginning SpinningWeaving/
KnittingProcessing
Garment/ Apparel
Production
Cotton, Jute, Silk, Wool
etc.Fibre* Yarn Fabric
Processed fabric
Final garment/ Apparel
Process
Output
*includes cotton, jute, silk, wool and man-made fibre.

Industry Research I Indian Apparel Industry Overview
3
Indian Apparel Market Size
The apparel industry has two primary segments namely, consumption within the nation and exports from the country.
Export numbers of the Apparel industry are readily available; however, market size of the domestic market from a supply
side is not readily available (as the size would mean combining the sales revenue of several types of entities, which do not
report revenue and the data collection of the same is an inherently daunting and logistically challenging). Hence a suitable
proxy from the consumption size has been utilised i.e. value of the private final consumption expenditure (PFCE) on
clothing. Consequently the total market size is a combination of export value of apparel products from India and value of
PFCE on clothing in India.
Chart 1: Growth in Total Apparel Market (Rs bn)
Note: PFCE Clothing at current price considered as a proxy for domestic market Source: CMIE
The apparel industry (domestic + exports) in India grew at a CAGR of 13% from Rs. 2,432 bn in FY10 to Rs. 6,484 bn in FY18.
The export market grew at a slightly slower CAGR of 9.8% from Rs. 508 bn in FY10 to Rs. 1,076 bn in FY18.
The domestic apparel industry in India grew at a CAGR of 13.8% from Rs.1,924 bn in FY10 to Rs. 5,408 bn in FY18.
The growth can be attributed to 1) rising per capita disposable income, 2) changing fashion trends, 3) growing consumer
class, 4) rising urbanization, 5) increasing retail penetration, 6) growing service class and 7) increasing share of the designer
wear. Due to the low investments required for setting up a garment unit, many small players have entered the industry
making it highly fragmented. Apparel production is dominated by eight clusters, i.e., Tirupur, Ludhiana, Bangalore, Delhi
NCR, Mumbai, Kolkata, Jaipur, and Indore. While Tirupur, Ludhiana and Kolkata are major centres for knitwear; Bangalore,
NCR, Mumbai, Jaipur, and Indore are major centres for woven garments. Other key cities include Surat.
Domestic Market Segmentation
The domestic Indian apparel market can be broadly classified into men’s wear, women’s wear and kids wear. Currently,
men’s wear holds the largest share in the apparel market. It accounts for 41% of the market. Women’s wear contributes
almost 38%, while kids wear contributes the balance 21% of the market.
1,924 2,256 2,504
2,926
3,803 4,003 4,506
4,863 5,408
508 529
656
703
907 1,029
1,110 1,165
1,076
-
1,000
2,000
3,000
4,000
5,000
6,000
7,000
FY10 FY11 FY12 FY13 FY14 FY15 FY16 FY17 FY18
Domestic Market Exports

Industry Research I Indian Apparel Industry Overview
4
Domestic Market Breakdown
Note: PFCE Clothing at current price considered as a proxy for domestic market Source: CMIE, Industry, CARE Ratings
The domestic apparel market can also be broadly divided by price into super premium, premium, medium, economy, and
value segments. The medium price segment holds majority of the share among apparel segment followed by economy
segment. The price sensitive rural population forms a major part of the value and economy price segments of apparel
market. Further, driven by the twin trends of premiumisation and value consciousness, the mid-market segment is being
squeezed on both sides by the value and the premium segments.
Demand for various apparel categories varies substantially across the country. The urban metro market comprising cities
such as Delhi NCR, Mumbai, Bengaluru, Chennai, etc., is the biggest market for apparel in India and contributes over 20% to
the Indian apparel market. Considering that less than 20% of India’s population lives in these cities indicate the higher
purchasing power in urban areas and frequency of purchases. The metros also witness huge penetration of women’s
western wear as compared to Tier -I or Tier -II cities of the country.
High real estate costs, competition among branded players and saturation in metro cities of the country have driven big
brands to move towards the smaller cities. The increasing purchasing capacity and awareness of fashion and trend in small
cities has also resulted in providing a huge market to the organised players of the country. The rural apparel market in India
is still primarily catered by unbranded and unorganised local players. Need based clothing and price sensitivity among
people of rural India does not make it a lucrative market for branded players.
Men’s wear (41%)
•Largest segment in the Indian apparel market
•Comprises of shirts, trousers, suits, t-shirts, fitness wear, undergarments and others
•Shirts is the largest sub-segment
•Shirts and trousers account for more than half the value
•Denim and fitness wear were the fastest growing sub-segments
Women’s wear (38%)
•Ethnic is the largest sub-segment, while denim is the fastest growing sub-segment
•The robust growth in this segment can be attributed to the rising income levels, rising number of
working women and more college going females.
•Also, the changing consumer preference and easy availability of RTW apparel in various colors, size
and patterns, were the other drivers of demand in this segment.
Kids wear
(21%)
•Smallest yet the fastest growing segment
•Boyswear slightly larger compared to girlswear
•Uniform is the largest sub-segment
•Denim is expected to be the fastest growing segment albeit on a smaller base

Industry Research I Indian Apparel Industry Overview
5
Trade
Exports
India’s apparel exports grew at a CAGR of 5.7% from $10.7bn in FY10 to $16.7 bn in FY18. The growth in exports can be
attributed to shifting of the apparel manufacturing base from the developed countries like the US and the EU to the low-
cost countries such as China, Vietnam, India, Bangladesh and others. Multi Fibre Agreement phase-out at the end of 2004
also helped India to increase its exports. After witnessing a marginal growth of 2.4% in FY17, RMG exports reported a
negative growth rate of 3.8% during FY18 due to decrease in competitiveness of Indian players after implementation of
GST. In FY18, India’s garment exports also reduced primarily due to competition from countries like Bangladesh, Sri Lanka
etc. which have low production cost and enjoy preferential duty access in key markets.
Chart 2: Trend in Apparel Exports ($bn)
Source: CMIE
The exports for the eleven months for FY15-FY17 were fairly stable; however, the exports declined by 2.2% in FY18 and the
exports have continued this decline in FY19 and worsening by 5.2% primarily due to depressed economic conditions-led
lower demand and growth.
Chart 3: India’s Apparel Exports (Apr- Feb period) ($ bn)
Source: CMIE
10.7 11.6
13.7 12.9
15.0
16.8 17.0 17.4 16.7 54%
48%
49%
47%45% 48%
50%51%
49%
40%
42%
44%
46%
48%
50%
52%
54%
56%
0
2
4
6
8
10
12
14
16
18
20
FY10 FY11 FY12 FY13 FY14 FY15 FY16 FY17 FY18
Apparel Exports ($bn) (LHS) Apparel Exports as a % of Total Textile Exports (RHS)
8.4 8.3 7.7 7.7 7.8
3.6 3.8 4.5 4.4 3.4
3.2 3.4 3.4 3.1 3.2
0
2
4
6
8
10
12
14
16
18
FY15 FY16 FY17 FY18 FY19
Cotton MMF Others

Industry Research I Indian Apparel Industry Overview
6
Chart 4: Export breakdown – by Geography ($bn)
Source: CMIE
The US and EU together constitute for approximately, 60% of the total apparel exports from India in value terms. Out of
these, the US is the single largest importer, while the European Union is the largest regional importer. The US
disengagement from several multinational partnerships coupled with the Indian government's measures to boost exports
will help Indian exporters gain market share in the US in the long run. On the other hand, India is projected to lose market
share to Bangladesh and Vietnam for RMG exports to the EU, because of lower competitiveness as Bangladesh has duty
free access to the EU and Vietnam Is expected to gain such access in a longer period. However, apparel manufacturers are
now focusing on diversifying their markets; thereby the apparel exports to countries such as Japan, Israel, South Africa and
Hong Kong are growing at a very fast rate. The following table details the top textile export destinations from India:
Table 2: List of top 10 export destination for domestic textiles:
Market FY18 ($mn) % Share USA 3,881 17% EU 3,318 15% Bangladesh 2,268 10% China 1,281 6% Pakistan 687 3% UAE 604 3% Vietnam 554 2% Sri Lanka 518 2% Brazil 411 2% South Korea 339 2% Source: DGCI&S
Indian textile industry, predominantly being a cotton-based industry, its apparel exports are also skewed towards cotton
which contributed approximately 51% of the overall apparel exports in FY18. Man-made fibre forms the second-largest
segment contributing about 28% to the overall apparel exports from India. MMF has steadily cannibalised the share of
cotton apparels, mainly due to the price differential and the cotton availability. However, for the eleven months of FY19,
cotton has increased its share to 54%, while MMF share has reduced to 24%. Additionally, to remain competitive in the
global market, India needs to diversify its fibre base, as global consumption is diversified and MMF holds a much larger
share as compared to cotton.
2.7 3.0 3.2 3.1 3.4 3.6 3.9 3.7 3.9
5.4 5.6 6.5
5.7 6.5 6.9 6.5 6.3 6.6
1.0 1.1
1.3 1.4
1.7 2.7 3.4 3.9 2.8
1.7 1.9
2.7 2.7
3.4
3.7 3.2 3.4 3.4
0
2
4
6
8
10
12
14
16
18
FY10 FY11 FY12 FY13 FY14 FY15 FY16 FY17 FY18
USA Europe UAE Others

Industry Research I Indian Apparel Industry Overview
7
Chart 5: Fibre-wise India’s Apparel Exports (Value-terms)
Source: CMIE
Chart 6: Apparel Imports by the US ($ bn)
Note: YTD: April to November Source: CMIE
Chart 7: Apparel Imports by the US (bn sqm.)
Note: YTD: April to November Source: CMIE
77%
11%
3%5% 4%
51%
28%
1% 1%
19%
54%
24%
1% 1%
20%
0%
10%
20%
30%
40%
50%
60%
70%
80%
90%
Cotton MMF Silk Wool Others
FY05 FY18 11mFY19
24.2 28.4 29.6 29.4 29.8 30.1 30.2 27.6 27.1 19.5 19.7
5.2 6.1 6.8 7.3 8.4 9.5 10.7 11.0 11.6
8.0 8.5
3.4 4.2 4.6 4.5 4.9 4.9 5.5 5.2 5.1
3.4 3.7 3.9
4.6 5.1 5.0 4.9 4.8 4.9
4.7 4.5
3.0 3.0 2.8
3.2 3.3 3.0 3.3 3.5 3.7
3.6 3.7
2.4 2.5
24.0
26.9 28.9 28.1
29.1 29.7 29.8 28.3 28.6
19.5 20.3
0%
1%
2%
3%
4%
5%
0
10
20
30
40
50
60
70
80
90
FY10 FY11 FY12 FY13 FY14 FY15 FY16 FY17 FY18 YTD FY18 YTD FY19
China Vietnam Bangladesh Indonesia India Others India's Share of US Imports
9.1 10.4 9.7 10.1 10.4 11.0 11.3 11.2 11.4 8.2 8.3
1.7 2.0 2.0 2.2 2.5
2.8 3.2 3.4 3.6
2.4 2.6 1.4
1.7 1.5 1.6 1.7 1.6
1.9 1.9 1.9
1.2 1.3 1.1
1.3 1.3 1.3 1.3
1.2 1.3 1.3 1.2
0.8 0.8 0.9
1.0 0.9 0.8 0.9
1.0 1.0 1.0 1.1
0.7 0.7
7.7
8.8 8.2 8.1 8.2
8.3 8.5 8.2 8.0
5.4 5.6
0.0%
0.5%
1.0%
1.5%
2.0%
2.5%
3.0%
3.5%
4.0%
4.5%
0
5
10
15
20
25
30
FY10 FY11 FY12 FY13 FY14 FY15 FY16 FY17 FY18 YTD FY18 YTD FY19
China Vietnam Bangladesh Indonesia India Others India's Share of US Imports

Industry Research I Indian Apparel Industry Overview
8
Apparel imports by the US have remained flat for the last several years (imports have declined marginally in value terms,
while remaining fairly steady in volume terms). India accounts for a small segment of US imports, and at roughly 4% has
remained roughly steady for the past several years.
Imports
India is a major textile and apparel exporting nation and has a trade surplus with quite a few nations. Bulk of the textile
imports are for meeting the industry’s raw material requirements.
Chart 8: Trend in Apparel Imports ($bn)
Note: YTD: April to February period Source: CMIE
Traditionally India’s apparel exports have been significantly higher compared to imports both in absolute as well as a share
in the textiles pie. However, even as exports outpace imports by a significant margin, the rise in imports of finished apparel
rather than raw material indicates that a bulk of the value addition is being done overseas, impacting domestic
manufacturers negatively. Not only has the apparel imports grown significantly (CAGR of 28% for the FY10 – FY18 period)
and as can be seen from the above chart, YTDFY19 imports have already crossed the full year FY18 import numbers. The
increase in imports can be attributed to China and Bangladesh which accounted for over 60% of the total apparel imports
in FY18. These countries have increased their share from 37% in FY10 to 64% in FY18. Zero rated duty of imports from
Bangladesh has opened gates for big value imports of apparel and other textile products into India
Demand Drivers for the Textiles and Apparel industry:
The demand for textiles and apparel is being primarily driven by 1) rise in disposable income which increases ability to
consume, 2) increased usage of plastic money leading to impulsive buying among the Indian consumers, 3) intensifying
urbanization leading to demand of varied goods and services, 4) positive demographic dividend along with changing
consumer preference (ready to stitch), 5) increased organized retail which increases availability and the rise of private
labels coupled with increase in (Ready to wear) RTW rather than RTS (Ready to Stitch), and 6) growth of internet
penetration and rise of e-commerce as a viable alternative sales channel.
0.1 0.2
0.3 0.3 0.4
0.5 0.6 0.6 0.8
0.7
1.0
4%
6%8% 8%
11%12%
13%15%
16%16%
20%
0%
5%
10%
15%
20%
25%
0.0
0.2
0.4
0.6
0.8
1.0
1.2
FY10 FY11 FY12 FY13 FY14 FY15 FY16 FY17 FY18 YTDFY18
YTDFY19
RMG ($ bn) (LHS) RMG as a % of total textile imports (RHS)

Industry Research I Indian Apparel Industry Overview
9
Additionally, effective implementation of several regulatory measures such as Technology Up-gradation Fund Scheme
(TUFS), Refund of State Levies (RoSL), and integrated textile parks, the rising mall culture and the multiple international and
home-grown premium and super premium brands are also expected to drive the market size of the Indian apparel industry.
Furthermore, a low per capita fiber consumption as compared to other nations coupled with factors like growing
differentiation of apparels into party-wear, office-wear and semi-formals coupled with increasing share of ethnic wear and
designer wear are expected to drive the growth of the apparel industry. Additionally, tapping newer export markets
enables exporters to offset both saturation and increased competition in the traditional export markets. Sustainable/ eco-
friendly manufacturing is also expected to increase the share of natural fabrics in the industry e.g. Wills Lifestyle stating
that it would utilise only natural fabrics. The industry is also undertaking significant investments in technology/ digital to 1)
ramp up online presence/ ecommerce activities either in partnership or on a standalone basis, 2) modernize supply chain
to increase efficiencies and reduce costs, 3) mass customization to drive demand and increase per capita consumption, and
4) increase marketing, enhance customer loyalty and repeat purchases. However, the recent wave of discounts (both
online as well as offline), uncertainty due to the upcoming general elections and rise of protectionist measures/ rhetoric
overseas could hamper industry realizations.
Chart 9: Trends in Demand Drivers
Note: Urban population as a percentage of the total population Source: CMIE, United Nations Statistics, IBEF
Rising Internet Penetration in India (%)
Changing Demographics Growing organised retail ($bn) Growing Use of Cards (Debit + Credit)
Rise in Disposable Income (Rs lakh) (GNDI) % of population residing in Urban Areas
15,500
18,666
22,052
25,315
29,386 30,203
38,133
5.7
6.4
7.4
8.4
10.0
12.1
13.3
0
2
4
6
8
10
12
14
-
5,000
10,000
15,000
20,000
25,000
30,000
35,000
40,000
45,000
FY12 FY13 FY14 FY15 FY16 FY17 FY18
Card Transactions (Rs bn) (RHS) Card Transactions (# bn) (LHS)
0
5
10
15
20
25
30
35
40
19
50
19
53
19
56
19
59
19
62
19
65
19
68
19
71
19
74
19
77
19
80
19
83
19
86
19
89
19
92
19
95
19
98
20
01
20
04
20
07
20
10
20
13
20
16
12.6%
15.1%
18.0%
27.0%
34.8% 34.4%
39.3%
0%
5%
10%
15%
20%
25%
30%
35%
40%
45%
2012 2013 2014 2015 2016 2017 2018
0.7
0.8
0.9
1.0
1.1
1.2
1.3
1.4
0.0
0.2
0.4
0.6
0.8
1.0
1.2
1.4
1.6
FY12 FY13 FY14 FY15 FY16 FY17 FY18 FY19
518490
534
600641
680
1,245
0
200
400
600
800
1,000
1,200
1,400
2012 2013 2014 2015 2016 2017 2018E
2% 2% 3% 3%4% 6% 6% 7%9%
16% 15% 16%
43%
46% 45%46%
44%
32% 31% 28%
0%
20%
40%
60%
80%
100%
2005 2016 2017 2018
Elite Affluent Aspirers Next billion Strugglers

Industry Research I Indian Apparel Industry Overview
10
Challenges
The growth story of the apparel industry in India is confronted by challenges such as Changing consumer behaviour,
proposed withdrawal of GSP norms by US which could adversely affect some of the smaller players, comparatively higher
trade barriers, locational disadvantages and comparatively lower infrastructure ranking. These challenges require
concerted government intervention at various levels to be appropriately resolved.
Higher trade barriers: Indian textile companies face higher trade barriers compared to other competing countries like
Bangladesh, Vietnam and Pakistan in key markets such as the USA and EU. Average tariff on textile products faced by India
vis-à-vis competing countries in EU and USA are as follows:
Table 3: Country-wise comparison of average tariff rates:
EU US
India 5.9% 6.2%
Bangladesh 0.0% 3.9%
Vietnam 6.1% 5.5%
Pakistan 0.0% 5.3% Source: ITC Trademap, Parliament Q&A
Poor infrastructure facilities: India suffers from a geographical disadvantage as it is located far away from major global
fibre-consuming markets like America and Europe compared to its global counterparts - Turkey and China. As a result, India
has to bear higher shipment cost with longer lead times thereby impacting exports. According to the World
Competitiveness Report 2018, India ranked 63rd among 140 countries in terms of competitiveness in quality of
infrastructure. India also lags behind its global counterparts in terms of transportation infrastructure facilities, leading to
high transaction cost and longer lead time. For instance, shipping a container of garments from India to the US is costlier
and longer as compared with China. Wider geographical spread coupled with the high inland transportation cost has also
affected the growth of export oriented textile and related industries in India.
Table 4: Country-wise comparison of infrastructure
Country Infrastructure Quality (Rank)
China 29 Turkey 50 India 63 Sri Lanka 65 Source: WEF - World Competitiveness Report 2018
India needs to diversify its fibre-base: Indian textile industry is predominantly a cotton based industry. Approximately, 74
per cent of the apparels exported from India are made up of cotton. However, the global apparel consumption is well
diversified across fibres. Therefore, to remain competitive in the global apparel industry, India needs to increase the share
of MMF based apparels in its overall apparel export portfolio.

Industry Research I Indian Apparel Industry Overview
11
Government Regulations
In order to increase exports of textiles including readymade garments (RMG), Government has undertaken several
measures, which include:
In March 2019, the Central government approved a scheme to rebate State and Central Embedded Taxes for
apparels and made-ups exports.
Interest Equalization Scheme (IES) provides interest subsidy at 5% per annum on pre and post shipment export
credit. Market Access Initiative (MAI) Scheme provides assistance to exporters to participate in various
international events and invite buyers to domestic events. IGST has been exempted on import under Advance
Authorisation and Export Promotion Capital Goods Scheme (EPCG) for apparel products.
The Directorate General of Foreign Trade (DGFT) has revised rates for incentives under the Merchandise Exports
from India Scheme (MEIS) for Readymade garments and Made ups - from 2% to 4%.
The Government of India has increased the basic custom duty to 20% from 10% on over 500 textile products, to
boost indigenous production and the Make in India program.
The Government of India announced a Special Package to boost exports by US$ 31 billion, create one crore job
opportunity and attract investments worth Rs 80,000 crore during 2018-2020.
The Amended Technology Up-gradation Fund Scheme (A-TUFS), scheme is estimated to create employment for 35
lakh people and enable investments worth Rs 95,000 crore by 2022.
The Integrated Wool Development Programme (IWDP) has been approved to support the entire wool sector value
chain to enhance the quality and increase the production during the 2017-18 - 2019-20 period.
The Government of India has approved a skill development scheme named 'Scheme for Capacity Building in Textile
Sector (SCBTS)' with an outlay of Rs 1,300 crore from 2017-18 to 2019-20.
The Union Ministry of Textiles, Government of India, along with Energy Efficiency Services Ltd (EESL), has launched
a technology upgradation scheme called SAATHI (Sustainable and Accelerated Adoption of Efficient Textile
Technologies to Help Small Industries) for reviving the powerloom sector of India.
Movement in Credit
Chart 10: Primary Market Debt Issuance
Source: CMIE
2.5 2.5 4.3
20.5
3.8 -
9.0
13.3
7.4
71%
21%44%
87% 88%
71%
78%
19%
0%
10%
20%
30%
40%
50%
60%
70%
80%
90%
100%
0
5
10
15
20
25
FY10 FY11 FY12 FY13 FY14 FY15 FY16 FY17 FY18
Apparel debt Issuance (Rs bn) (LHS) Apparel Debt Issued as a % of Textiles Debt Issued (RHS)

Industry Research I Indian Apparel Industry Overview
12
The Apparel sector has traditionally issued debt paper for capacity expansion and has generally accounted for a significant
proportion of the textile industry. Since FY10, y-o-y growth in bank credit exposure to the sector was consistently lower
than the y-o-y growth in overall bank credit to industries, the last year i.e. FY18 being an exception.
Chart 11: Trend in Growth in Credit Exposure of Banks to Textiles Sector vis-à-vis Overall Industries
Source: RBI
Share of the textile sector in the total credit exposure of banks to industries has been in the range of 7% to 12%. The share
was at its highest a decade ago in April 2007 and since then, has been steadily on a downward trajectory. Despite the
shrinking share in overall outstanding credit to the industries, outstanding credit to the textiles sector has been on an
upward trajectory in absolute terms from Rs. 963.98 bn at FY08-end to Rs. 2,022.13 bn at FY14-end, however the
outstanding credit exposure reduced at the end of the subsequent three years i.e. FY15 - FY17. The exposure rose
marginally at FY18 end and stood at Rs. 2,099.02 bn. Further in FY19, the outstanding credit exposure has continued its
descent despite increases in the months of November 2018 and December 2018. Additionally, the stressed asset ratio,
albeit on the higher side, for the industry has decreased over the last two years from 23.7% at September 2016 to 18.7% at
September 2018. The improvement in asset quality of industry sector was marked by a reduction in fresh slippages in
September 2018. Nevertheless, it remains to be seen whether the industry will continue to witness favourable dynamics.
Chart 12: Trend in Share of Textiles Sector in Total Outstanding Bank Credit to Industries
Source: RBI
18%20%
10%
15%
10%
-0.1%
2%
-5%
7%
24%22%
21%
15%13%
6%
3%
-2%
1%
-10%
-5%
0%
5%
10%
15%
20%
25%
30%
FY10 FY11 FY12 FY13 FY14 FY15 FY16 FY17 FY18
Y-o-Y Growth in Bank Credit to Textiles Sector Y-o-Y Growth in Total Bank Credit to Industries
0
500
1,000
1,500
2,000
2,500
6%
7%
8%
9%
10%
11%
12%
Ap
r-0
7
Sep
-07
Feb
-08
Jul-
08
De
c-0
8
May
-09
Oct
-09
Mar
-10
Au
g-1
0
Jan
-11
Jun
-11
No
v-1
1
Ap
r-1
2
Sep
-12
Feb
-13
Jul-
13
De
c-1
3
May
-14
Oct
-14
Mar
-15
Au
g-1
5
Jan
-16
Jun
-16
No
v-1
6
Ap
r-1
7
Sep
-17
Feb
-18
Jul-
18
De
c-1
8
Textiles (Rs bn) (RHS) Textiles as a % of Total Industries (LHS)
Industry Research I Indian Apparel Industry Overview
13
Financials
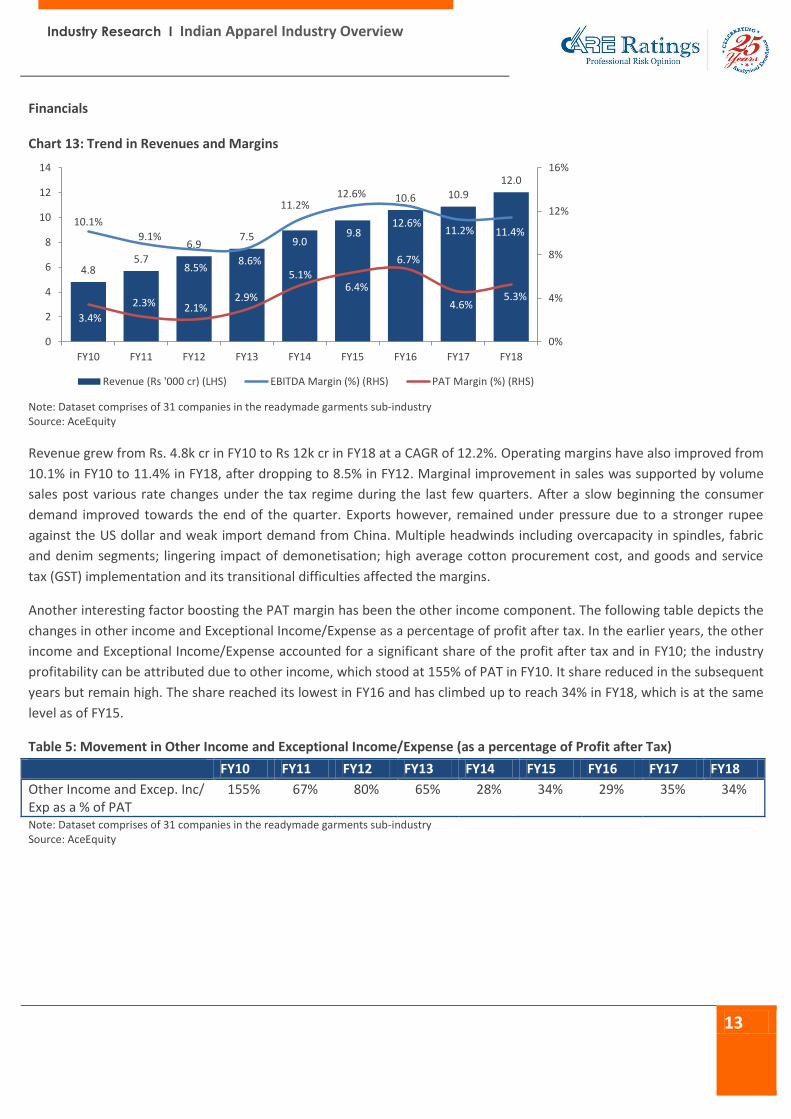
Chart 13: Trend in Revenues and Margins
Note: Dataset comprises of 31 companies in the readymade garments sub-industry Source: AceEquity
Revenue grew from Rs. 4.8k cr in FY10 to Rs 12k cr in FY18 at a CAGR of 12.2%. Operating margins have also improved from
10.1% in FY10 to 11.4% in FY18, after dropping to 8.5% in FY12. Marginal improvement in sales was supported by volume
sales post various rate changes under the tax regime during the last few quarters. After a slow beginning the consumer
demand improved towards the end of the quarter. Exports however, remained under pressure due to a stronger rupee
against the US dollar and weak import demand from China. Multiple headwinds including overcapacity in spindles, fabric
and denim segments; lingering impact of demonetisation; high average cotton procurement cost, and goods and service
tax (GST) implementation and its transitional difficulties affected the margins.
Another interesting factor boosting the PAT margin has been the other income component. The following table depicts the
changes in other income and Exceptional Income/Expense as a percentage of profit after tax. In the earlier years, the other
income and Exceptional Income/Expense accounted for a significant share of the profit after tax and in FY10; the industry
profitability can be attributed due to other income, which stood at 155% of PAT in FY10. It share reduced in the subsequent
years but remain high. The share reached its lowest in FY16 and has climbed up to reach 34% in FY18, which is at the same
level as of FY15.
Table 5: Movement in Other Income and Exceptional Income/Expense (as a percentage of Profit after Tax)
FY10 FY11 FY12 FY13 FY14 FY15 FY16 FY17 FY18
Other Income and Excep. Inc/ Exp as a % of PAT
155% 67% 80% 65% 28% 34% 29% 35% 34%
Note: Dataset comprises of 31 companies in the readymade garments sub-industry Source: AceEquity
4.85.7
6.97.5 9.0
9.8
10.6 10.912.0
10.1%
9.1%
8.5%8.6%
11.2%12.6%
12.6%11.2% 11.4%
3.4%
2.3% 2.1%2.9%
5.1%6.4%
6.7%
4.6%5.3%
0%
4%
8%
12%
16%
0
2
4
6
8
10
12
14
FY10 FY11 FY12 FY13 FY14 FY15 FY16 FY17 FY18
Revenue (Rs '000 cr) (LHS) EBITDA Margin (%) (RHS) PAT Margin (%) (RHS)

Industry Research I Indian Apparel Industry Overview
14
Operating Costs
Table 6: Movement in Key Costs (as a percentage of Revenue)
FY10 FY11 FY12 FY13 FY14 FY15 FY16 FY17 FY18
Raw Material 47% 45% 48% 48% 51% 50% 48% 48% 47%
Power & Fuel Cost 1% 1% 1% 1% 1% 1% 1% 1% 1%
Employee Cost 9% 9% 9% 9% 10% 11% 11% 12% 13%
Other Manufacturing Expenses 18% 15% 13% 12% 15% 16% 15% 17% 14%
SG&A Costs 23% 24% 23% 24% 14% 14% 14% 15% 15%
Depreciation 3% 2% 2% 2% 1% 2% 2% 2% 2%
Interest 3% 3% 3% 3% 2% 2% 2% 2% 2% Note: Dataset comprises of 31 companies in the readymade garments sub-industry Source: AceEquity
The Indian textile players mostly import refurbished looms (air jet, rapier, projectile, water jet) from abroad due to lower
costs. The production efficiency of these looms is much lower than the new ones. It also has a high maintenance and
operation costs. This also hampers the productivity of the apparel manufacturers in India. The RMG industry scores low on
the parameter of key inputs. At around 50% of the revenue, raw material constitutes the largest share of the overall
operating costs of apparel manufacturers. Most of the manufacturers in the industry are non- integrated with production
of fibre intermediates. The key raw material used by the garment manufacturers is cloth made from either cotton or man-
made fiber. As the availability of cotton in India is ample, India’s garment exports are skewed towards cotton. The cotton
prices are regulated to a certain extent (i.e. with specific reference to Government driven Minimum Sale Price (MSP) and
also move in tandem with the international prices.
Employee cost also forms substantial part in the overall cost structure as apparel industry is labour intensive. Employee
costs have witnessed a steady increase from 9% in FY10 to 13% in FY18. Due to high degree of dependence on labour, the
industry is plagued by unionization issues. Power & Fuel Cost, Depreciation and Interest costs have remained fairly stable
for the above period. On account of the low investment requirement and absence of stringent licenses for setting up a
garment unit, many small players have flocked into the industry making it highly fragmented and competitive thereby
constraining profitability margins and leading to intense competition.
Chart 14: Trend in Working Capital
Note: Dataset comprises of 31 companies in the readymade garments sub-industry Source: AceEquity
90
81 80 82 84 83
92 93
-
20
40
60
80
100
FY11 FY12 FY13 FY14 FY15 FY16 FY17 FY18
Cash Conversion Cycle (days) Receivable days Inventory days Payable days

Industry Research I Indian Apparel Industry Overview
15
The gross working capital cycle has increased marginally from 125 days to 145 days with the numbers coming in at the
highest in FY18. The payables days also increased; hence effect in the net working capital increase to 93 days in FY18 as
compared to 90 days in FY11 was subdued as compared to the rise in the gross working capital cycle. The industry observed
an increase in its debtor’s period from around 51 days in FY11 to around 64 days in FY18. The inventory holding period for
the industry decreased marginally to around 82 days in FY18, which was around 86 days during FY11.
Chart 15: Trend in Debt, Leverage and Interest Coverage
Note: Dataset comprises of 31 companies in the readymade garments sub-industry Source: AceEquity
The debt equity ratio for apparel manufacturers has generally been on a reducing trend from 0.77 times in FY10 to 0.49
times in FY18 on account of industry profitability and deleveraging. The borrowings dropped sharply in FY11 and increased
post FY12 on account expansion activities undertaken by major players. The increase in borrowing was supported by
growth in net profits that has led to a constant debt equity ratio. Further, post FY15, the industry has deleveraged further
with total borrowings reducing significantly.
1,482
584 499
556
830 950
451 417 372
-
200
400
600
800
1,000
1,200
1,400
1,600
0
1
2
3
4
5
6
7
FY10 FY11 FY12 FY13 FY14 FY15 FY16 FY17 FY18
Total Debt (Rs cr) (RHS) Interest Cover (x) (LHS) Total Debt/Equity (x) (LHS)

Industry Research I Indian Apparel Industry Overview
16
Outlook
As textile production is positively correlated to GDP, reduction in economic uncertainties to revive growth in medium to
long-term period. The apparel industry is largely consumption-driven and therefore, the economic cycles have a direct
impact on the performance of the industry. High growth in the GDP leads to higher per capita income which in turn
increases the purchasing power of the people. Higher purchasing power leads to increased spending, thereby driving the
demand for apparels and home textiles while during the economic slowdown, the spending power and in turn consumption
decreases.
Chart 16: Annual Growth Rate (in %): GDP at Current Prices vs Apparel Industry (Rs bn)
Source: CMIE, CARE Ratings
After successfully weathering the liquidity crises of FY08 and FY09, the economy again witnessed a slowdown beginning
FY12 because of spiralling inflation and high lending rates. The domestic apparel industry in India grew at a CAGR of 13.8%
from Rs.1,924 bn in FY10 to Rs. 5,408 bn in FY18. With the impending general elections, CARE expects short-term economic
uncertainties to be volatile. Growth would revive only post the elections as the newly elected government would be in a
better position to take decisions and take policy stands that would attract higher investment and fuel the rise in income
levels and consequential consumption levels.
With the industry now stabilizing post the demonetization and the implementation of the goods and service tax (GST)
regime, the demand from both domestic and international markets, has picked up in the last few months. Further, the
demand drivers like growing private final consumption expenditure, growing population and changing fashion trends, etc,
still make a compelling case for the healthy economic scenario in the future, subject to policy implementation and good
governance by the government. CARE expects the domestic apparel market to grow by 10% - 12% driven by the growth in
the Indian economy leading to the rise in disposable income, increased usage of plastic money leading to impulsive buying
among the Indian consumers. Also, the increasing percentage of the youth in the Indian economy, rising mall culture would
continue to drive growth of the apparel industry. Plethora of international and home-grown premium and super premium
brands has led to a sharp increase in the per unit realisation which is expected drive the market size of the Indian apparel
industry.
As a counterpoint to the growing domestic apparel industry, CARE estimates Indian apparel exports to remain subdued,
growing marginally in rupee terms, and declining in US dollar terms. Earlier, the export market grew at a CAGR of 9.8%
from Rs. 508 bn in FY10 to Rs. 1,076 bn in FY18; however FY18 exports were lower as compared to FY17. India continues to
0%
5%
10%
15%
20%
25%
30%
35%
FY06 FY07 FY08 FY09 FY10 FY11 FY12 FY13 FY14 FY15 FY16 FY17e FY18e
Current GDP Total Apparel Market

Industry Research I Indian Apparel Industry Overview
17
experience headwinds in the form of intense competitive pressures from nations having a cost advantage over India, which
seem to be constraining the overall momentum of the apparel export sector of India. Notwithstanding a depreciation in the
rupee vis-a-vis the US dollar (which could increase rupee realizations), apparel exports would increase marginally in rupee
terms and decline by 4%-5% in US dollar terms in FY19 and increase marginally in FY20.
Furthermore, given the fact that cotton and synthetic apparel exports comprise over 75% of apparel exports from India,
CARE expects cotton (a crop where India is quite cost competitive) and synthetic apparels to continue to drive the growth
in apparel exports. Additionally given the issues in the neighbouring countries coupled with abundant raw material
availability, a well-integrated textile industry and good designing skills, if leveraged appropriately, could help India to
consolidate and grow its position in the global apparel market. India needs to diversify its fibre base, currently dominated
by the cotton in line with the global apparel consumption, which is well diversified within the cotton and MMF based
apparels. To remain competitive and grow, India needs to increase its production of MMF based apparels. Going forward,
steps taken to address the above challenges would be crucial for a creating and sustaining a broad-based recovery across
the sector. This would also enable domestic apparel exporters to increase their share of the global apparel trade, and
defend market share against other countries such as Vietnam and Bangladesh.
CARE Ratings Limited (Formerly known as Credit Analysis & Research Ltd) Corporate Office: 4th Floor, Godrej Coliseum, Somaiya Hospital Road, Off Eastern Express Highway, Sion (East), Mumbai - 400 022. CIN: L67190MH1993PLC071691 Tel: +91-22-6754 3456 I Fax: +91-22-6754 3457 E-mail: [email protected] I Website: www.careratings.com
Follow us on /company/CARE Ratings
/company/CARE Ratings