apresentação do powerpoint · fibria delivers one of the highest ebitda/t and ... bekp net price...
TRANSCRIPT
Financial Highlights
Guilherme Cavalcanti - CFO
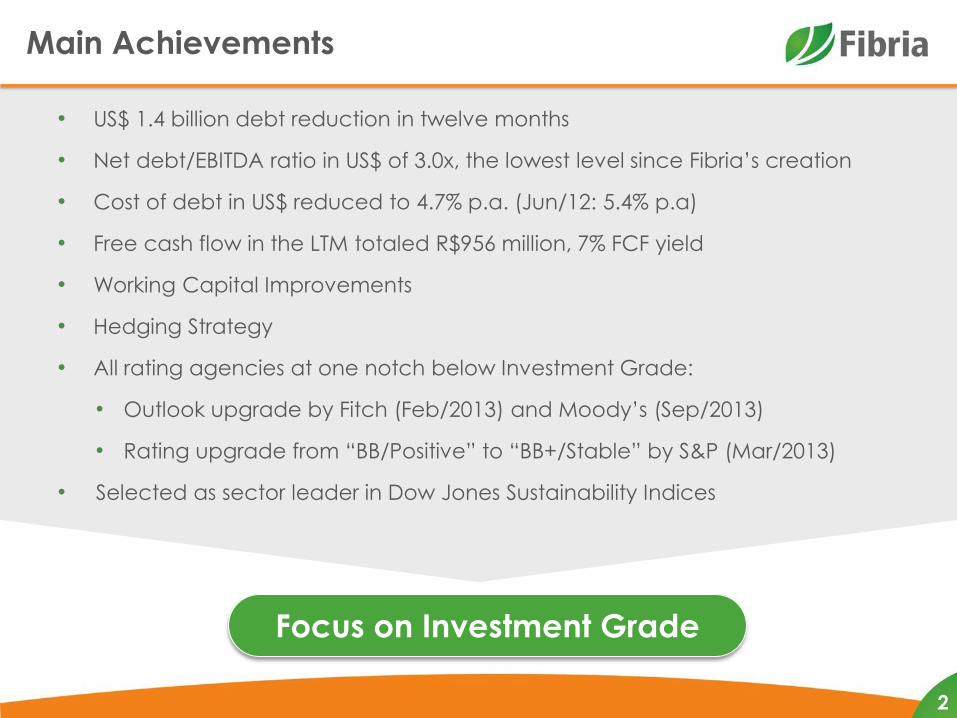
Focus on Investment Grade
Main Achievements
• US$ 1.4 billion debt reduction in twelve months
• Net debt/EBITDA ratio in US$ of 3.0x, the lowest level since Fibria’s creation
• Cost of debt in US$ reduced to 4.7% p.a. (Jun/12: 5.4% p.a)
• Free cash flow in the LTM totaled R$956 million, 7% FCF yield
• Working Capital Improvements
• Hedging Strategy
• All rating agencies at one notch below Investment Grade:
• Outlook upgrade by Fitch (Feb/2013) and Moody’s (Sep/2013)
• Rating upgrade from “BB/Positive” to “BB+/Stable” by S&P (Mar/2013)
• Selected as sector leader in Dow Jones Sustainability Indices
2
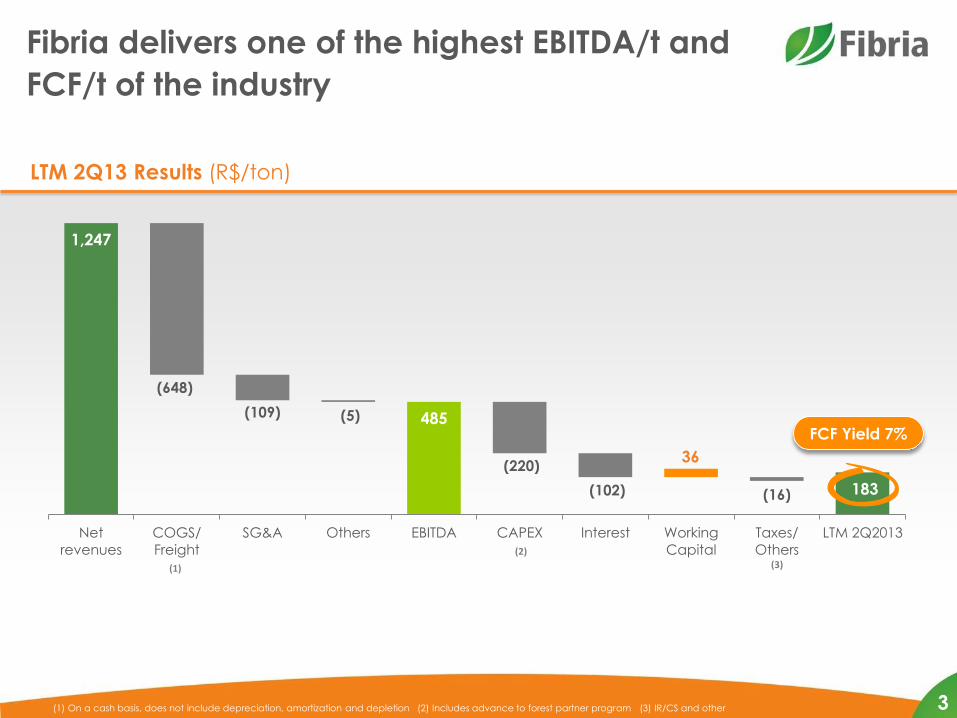
1,247
485
183
(648)
(109) (5)
(220)
(102)
36
(16)
Net
revenues
COGS/
Freight
SG&A Others EBITDA CAPEX Interest Working
Capital
Taxes/
Others
LTM 2Q2013
(1) On a cash basis, does not include depreciation, amortization and depletion (2) Includes advance to forest partner program (3) IR/CS and other
(2)
FCF Yield 7%
(1) (3)
LTM 2Q13 Results (R$/ton)
Fibria delivers one of the highest EBITDA/t and
FCF/t of the industry
3
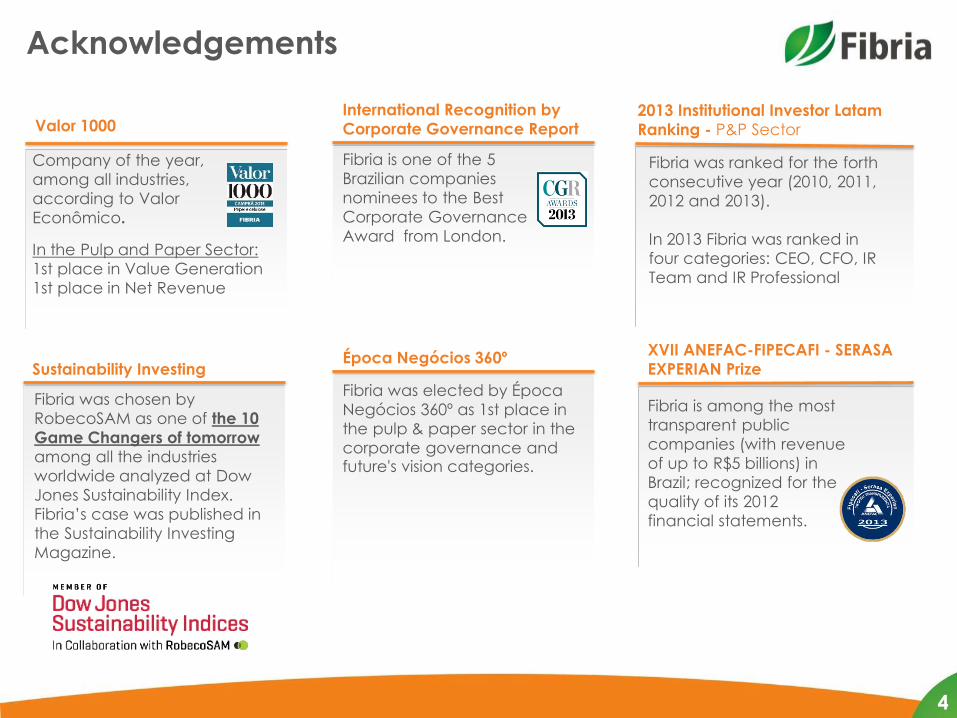
Acknowledgements
4
Company of the year,
among all industries,
according to Valor
Econômico.
In the Pulp and Paper Sector:
1st place in Value Generation
1st place in Net Revenue
Valor 1000
XVII ANEFAC-FIPECAFI - SERASA
EXPERIAN Prize
Fibria is among the most
transparent public
companies (with revenue
of up to R$5 billions) in
Brazil; recognized for the
quality of its 2012
financial statements.
Fibria was ranked for the forth
consecutive year (2010, 2011,
2012 and 2013).
In 2013 Fibria was ranked in
four categories: CEO, CFO, IR
Team and IR Professional
2013 Institutional Investor Latam
Ranking - P&P Sector
Fibria was chosen by
RobecoSAM as one of the 10
Game Changers of tomorrow
among all the industries
worldwide analyzed at Dow
Jones Sustainability Index.
Fibria’s case was published in
the Sustainability Investing
Magazine.
Sustainability Investing
Fibria was elected by Época
Negócios 360º as 1st place in
the pulp & paper sector in the
corporate governance and future's vision categories.
Época Negócios 360º
Fibria is one of the 5
Brazilian companies
nominees to the Best
Corporate Governance
Award from London.
International Recognition by
Corporate Governance Report
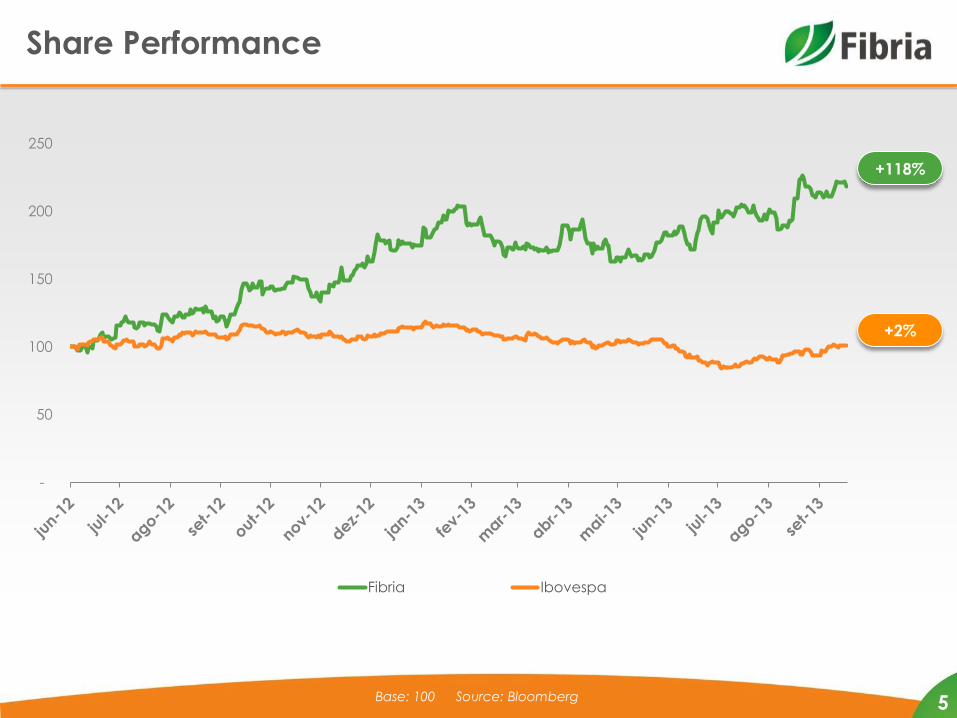
Share Performance
5
-
50
100
150
200
250
Fibria Ibovespa
Base: 100 Source: Bloomberg
+2%
+118%
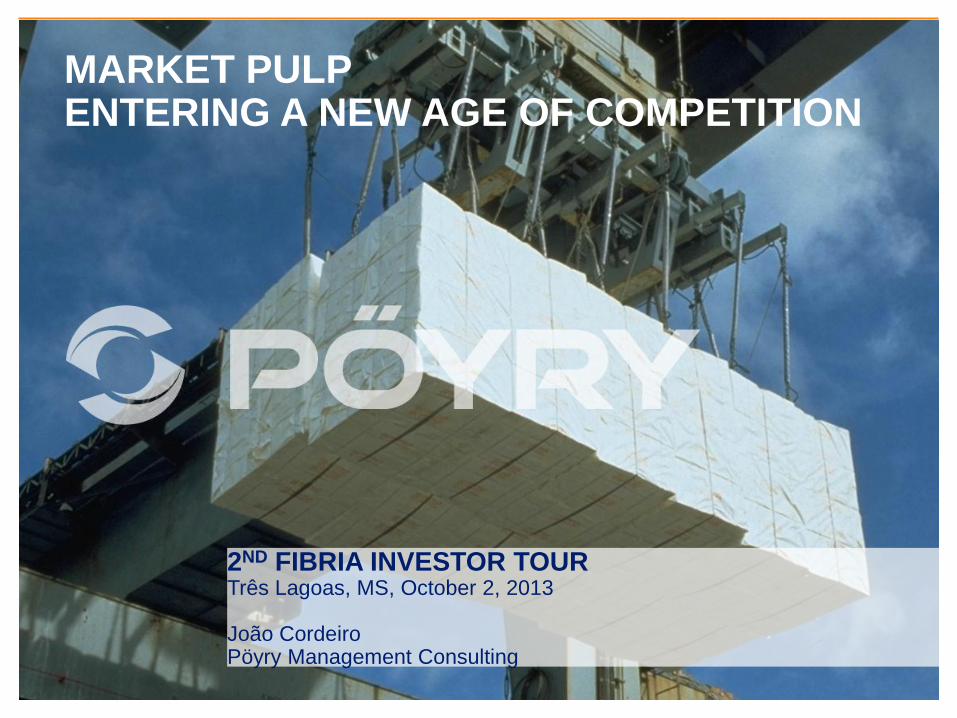
MARKET PULP ENTERING A NEW AGE OF COMPETITION
2ND FIBRIA INVESTOR TOUR Três Lagoas, MS, October 2, 2013 João Cordeiro Pöyry Management Consulting
COPYRIGHT©PÖYRY
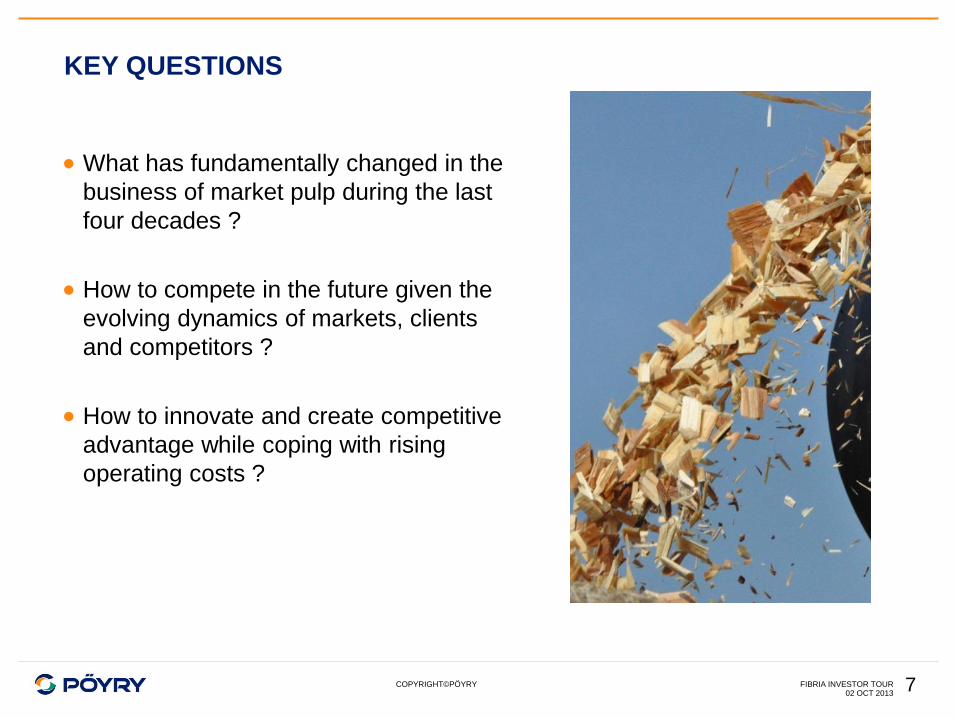
KEY QUESTIONS
02 OCT 2013
What has fundamentally changed in the
business of market pulp during the last
four decades ?
How to compete in the future given the
evolving dynamics of markets, clients
and competitors ?
How to innovate and create competitive
advantage while coping with rising
operating costs ?
FIBRIA INVESTOR TOUR 7
COPYRIGHT©PÖYRY
E-MEDIA KEVENNYS
02 OCT 2013 FIBRIA INVESTOR TOUR 8
COPYRIGHT©PÖYRY
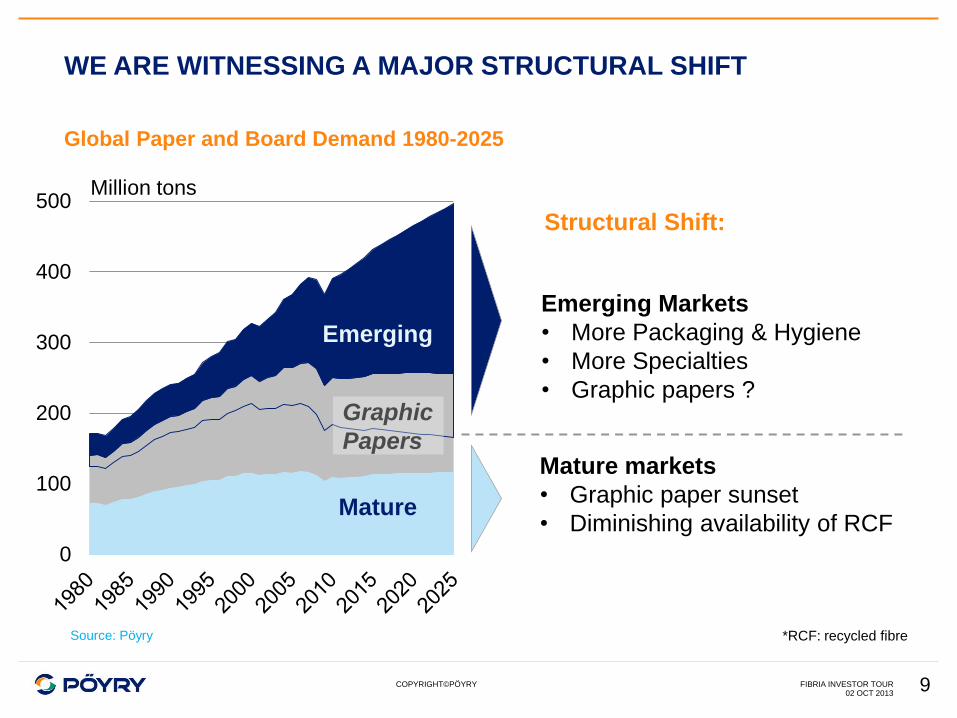
WE ARE WITNESSING A MAJOR STRUCTURAL SHIFT
0
100
200
300
400
500Million tons
Mature
Emerging
Structural Shift:
Mature markets
• Graphic paper sunset
• Diminishing availability of RCF
Emerging Markets
• More Packaging & Hygiene
• More Specialties
• Graphic papers ?
Global Paper and Board Demand 1980-2025
Graphic
Papers
*RCF: recycled fibre Source: Pöyry
02 OCT 2013 FIBRIA INVESTOR TOUR 9
COPYRIGHT©PÖYRY
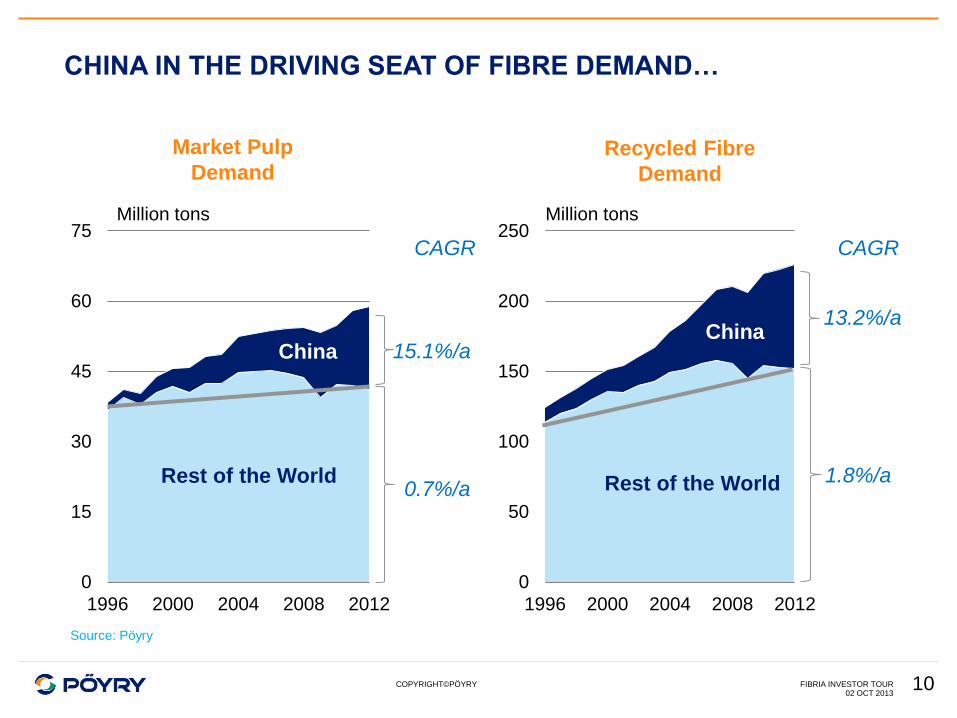
CHINA IN THE DRIVING SEAT OF FIBRE DEMAND…
0
50
100
150
200
250
1996 2000 2004 2008 2012
1.8%/a
13.2%/a China
0
15
30
45
60
75
1996 2000 2004 2008 2012
0.7%/a
15.1%/a
Recycled Fibre
Demand
China
Market Pulp
Demand
Rest of the World Rest of the World
CAGR CAGR
Million tons Million tons
Source: Pöyry
02 OCT 2013 FIBRIA INVESTOR TOUR 10
COPYRIGHT©PÖYRY
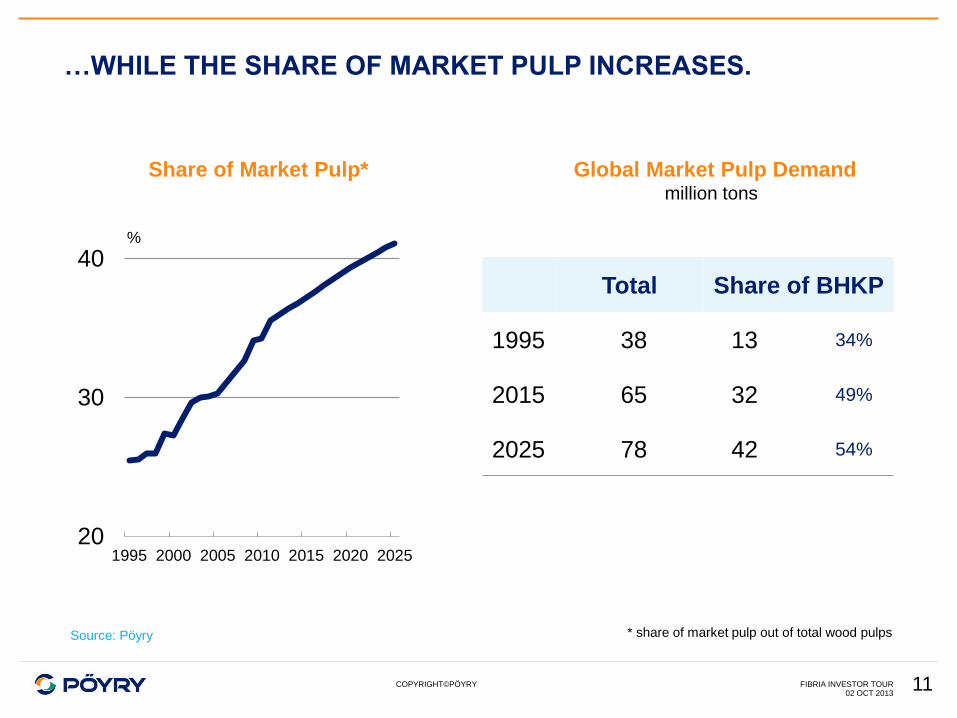
…WHILE THE SHARE OF MARKET PULP INCREASES.
02 OCT 2013 FIBRIA INVESTOR TOUR 11
20
30
40
1995 2000 2005 2010 2015 2020 2025
%
Share of Market Pulp*
* share of market pulp out of total wood pulps
Total Share of BHKP
1995 38 13 34%
2015 65 32 49%
2025 78 42 54%
Global Market Pulp Demand million tons
Source: Pöyry
COPYRIGHT©PÖYRY
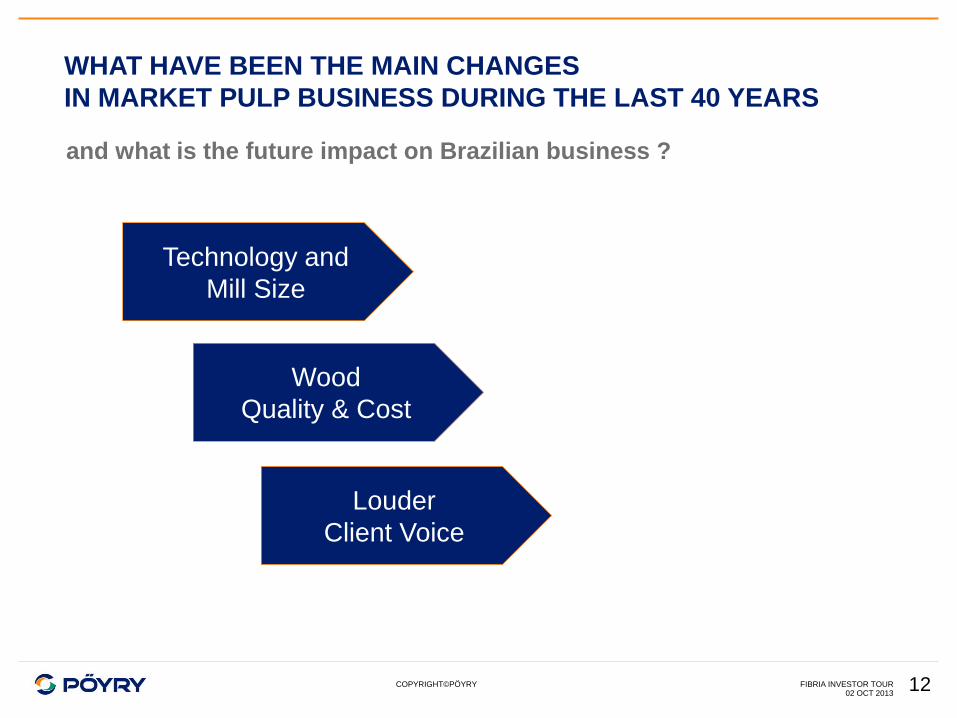
WHAT HAVE BEEN THE MAIN CHANGES
IN MARKET PULP BUSINESS DURING THE LAST 40 YEARS
02 OCT 2013 FIBRIA INVESTOR TOUR
Wood
Quality & Cost
Technology and
Mill Size
and what is the future impact on Brazilian business ?
Louder
Client Voice
12
COPYRIGHT©PÖYRY
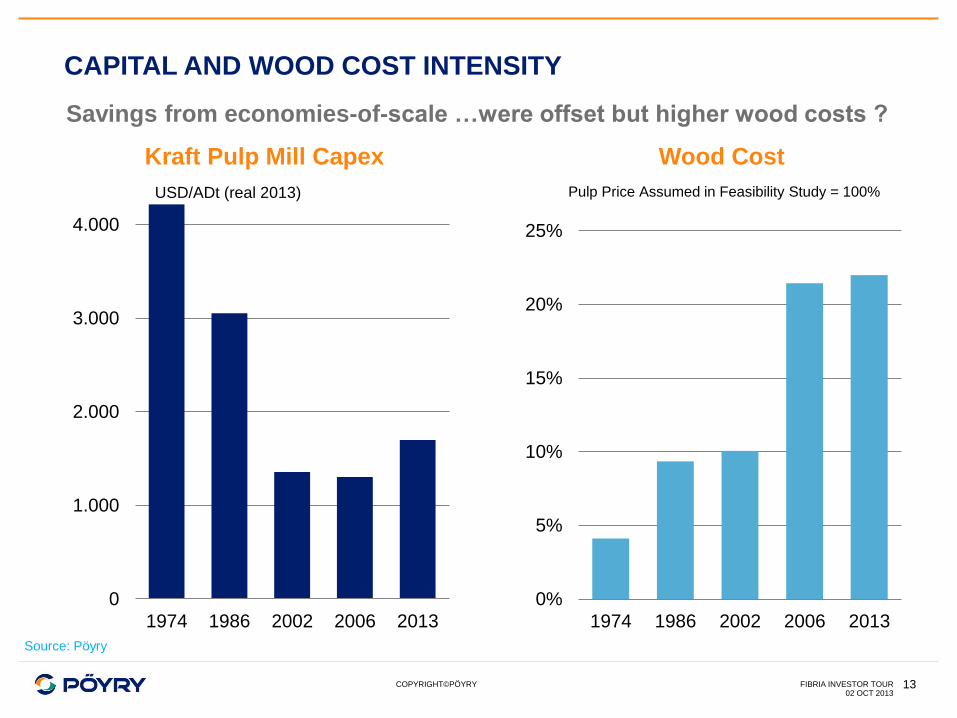
CAPITAL AND WOOD COST INTENSITY
02 OCT 2013 FIBRIA INVESTOR TOUR
Kraft Pulp Mill Capex Wood Cost
0%
5%
10%
15%
20%
25%
1974 1986 2002 2006 2013
Pulp Price Assumed in Feasibility Study = 100%
Savings from economies-of-scale …were offset but higher wood costs ?
Source: Pöyry
13
0
1.000
2.000
3.000
4.000
1974 1986 2002 2006 2013
USD/ADt (real 2013)
COPYRIGHT©PÖYRY
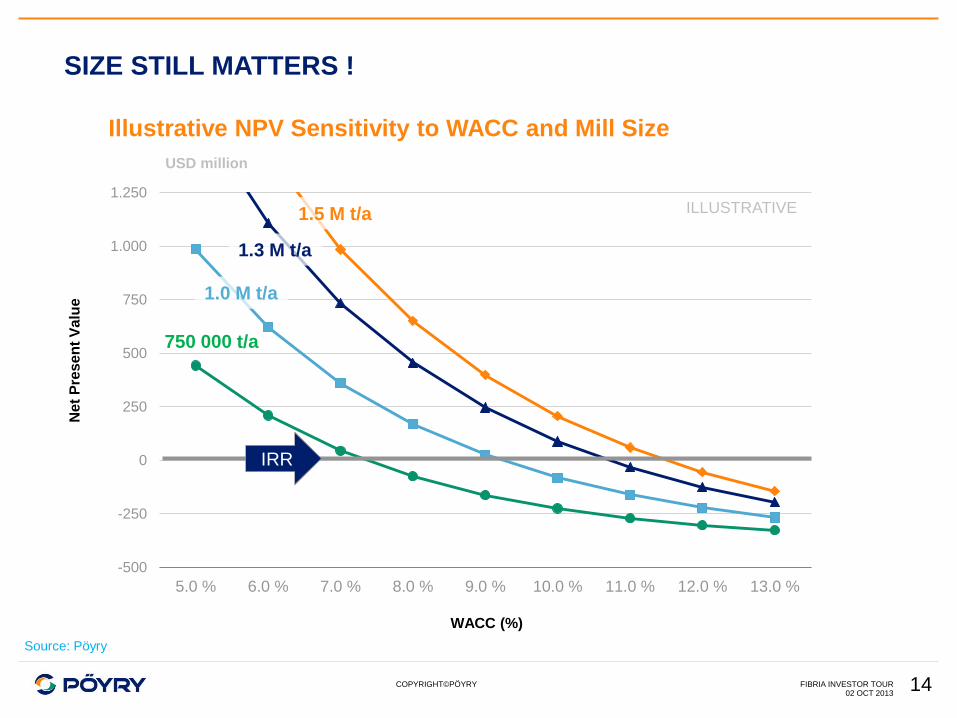
SIZE STILL MATTERS !
-500
-250
0
250
500
750
1.000
1.250
5.0 % 6.0 % 7.0 % 8.0 % 9.0 % 10.0 % 11.0 % 12.0 % 13.0 %
IRR
WACC (%)
Ne
t P
res
en
t V
alu
e
USD million
750 000 t/a
1.5 M t/a
1.3 M t/a
1.0 M t/a
ILLUSTRATIVE
02 OCT 2013 FIBRIA INVESTOR TOUR
Illustrative NPV Sensitivity to WACC and Mill Size
Source: Pöyry
14
COPYRIGHT©PÖYRY 02 OCT 2013
FIBRIA INVESTOR TOUR
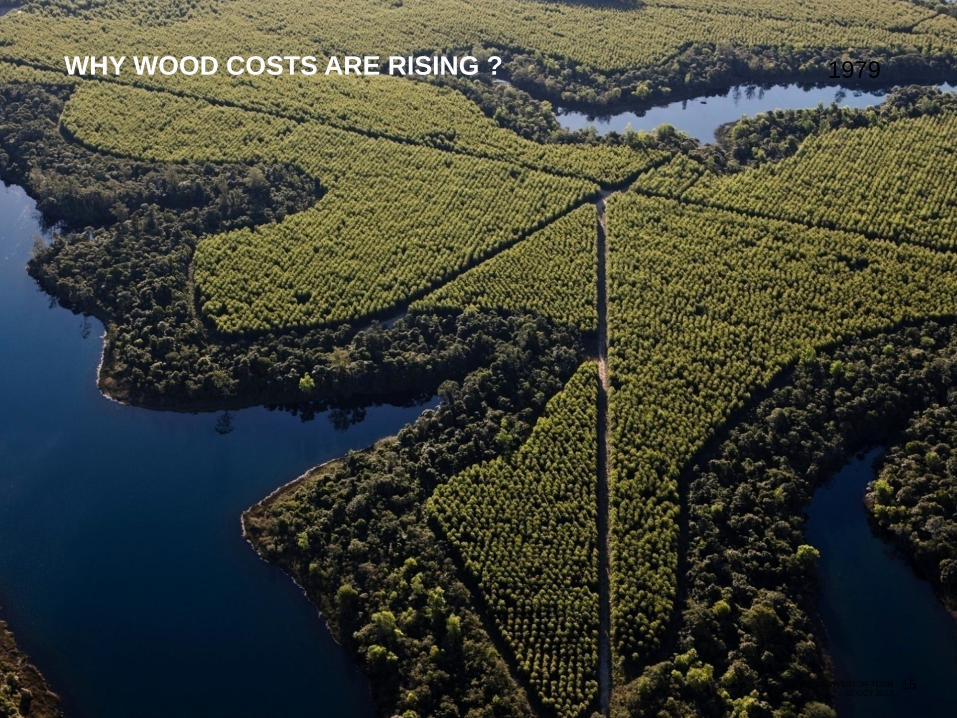
WHY WOOD COSTS ARE RISING ? 1979
15
COPYRIGHT©PÖYRY
10
20
30
40
50
60
70
80
90
100
110
120
02 OCT 2013 FIBRIA INVESTOR TOUR
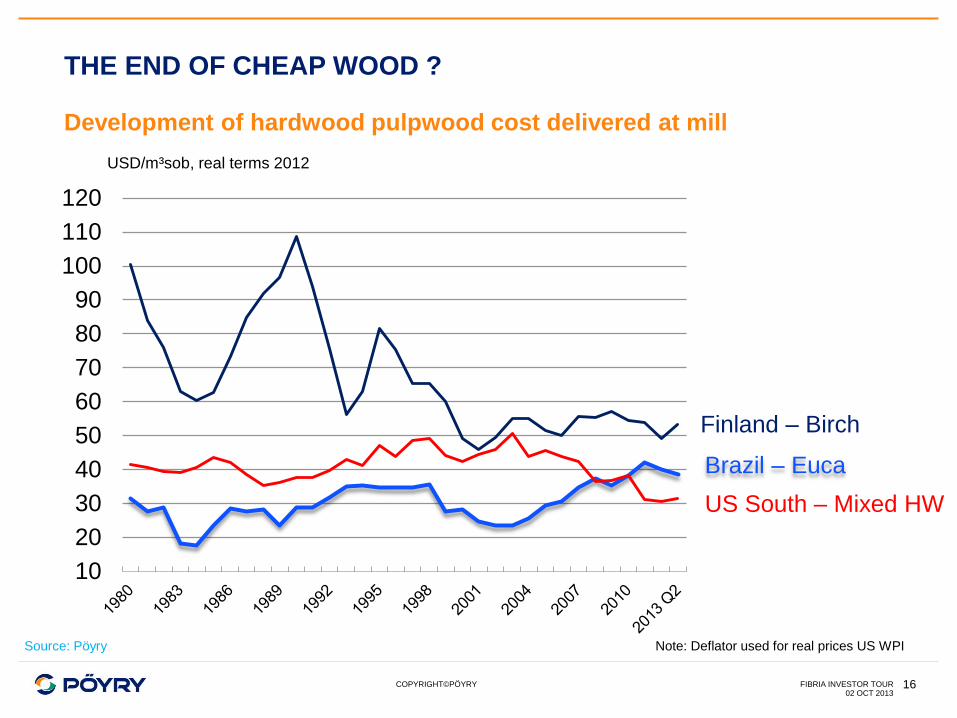
THE END OF CHEAP WOOD ?
Development of hardwood pulpwood cost delivered at mill
USD/m³sob, real terms 2012
Source: Pöyry
16
Finland – Birch
Brazil – Euca
US South – Mixed HW
Note: Deflator used for real prices US WPI
COPYRIGHT©PÖYRY
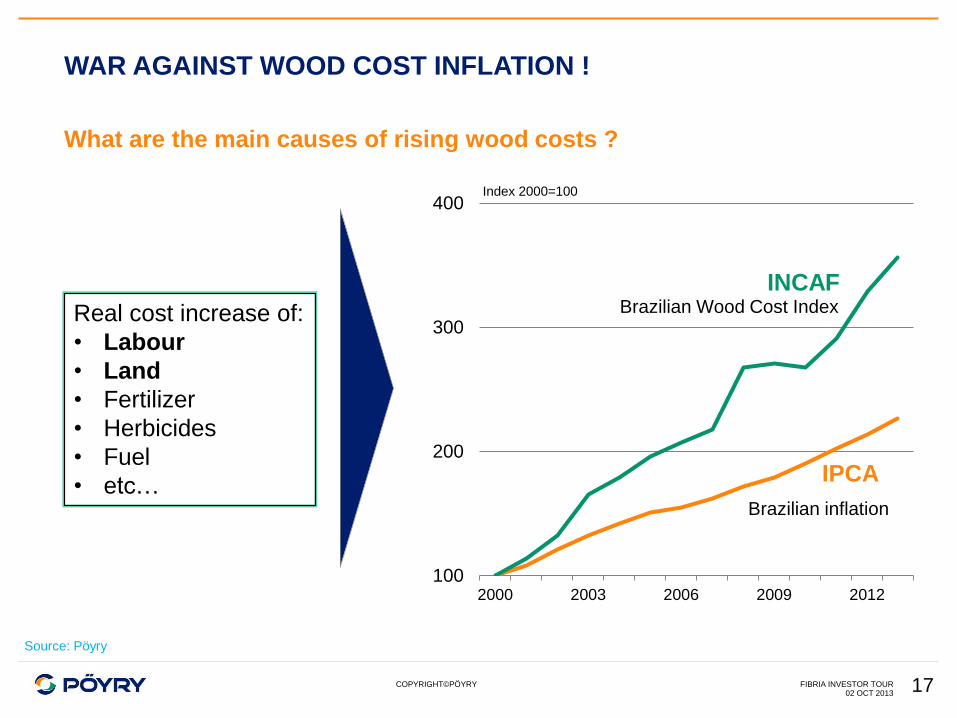
WAR AGAINST WOOD COST INFLATION !
02 OCT 2013 FIBRIA INVESTOR TOUR
Real cost increase of:
• Labour
• Land
• Fertilizer
• Herbicides
• Fuel
• etc…
What are the main causes of rising wood costs ?
Index 2000=100
100
200
300
400
2000 2003 2006 2009 2012
INCAF
IPCA
Brazilian Wood Cost Index
Brazilian inflation
Source: Pöyry
17
COPYRIGHT©PÖYRY
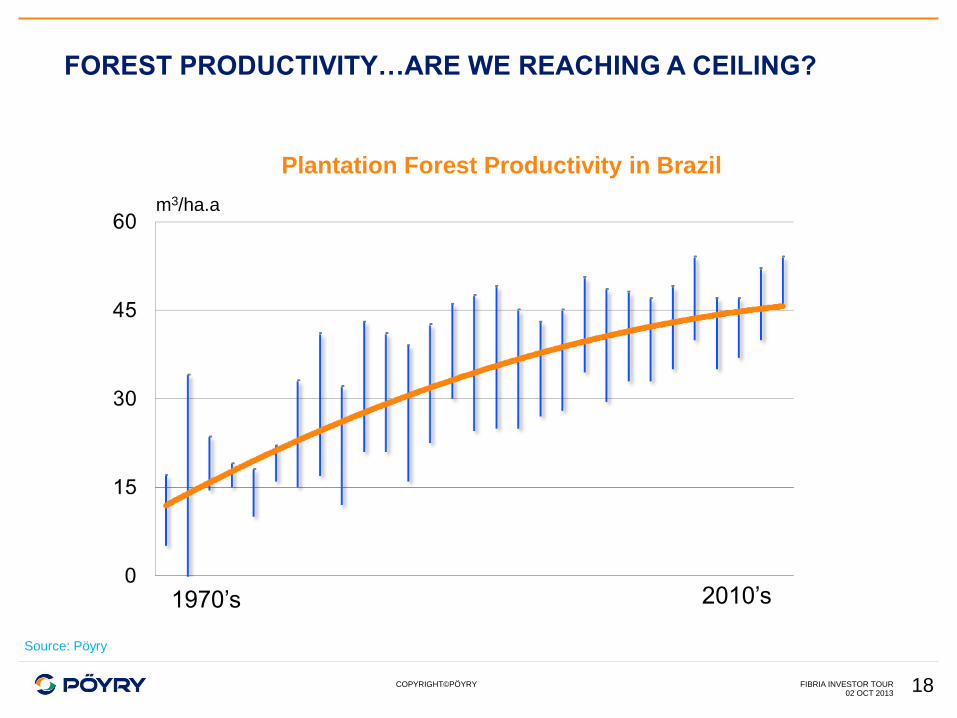
FOREST PRODUCTIVITY…ARE WE REACHING A CEILING?
02 OCT 2013 FIBRIA INVESTOR TOUR
1970’s 2010’s
m3/ha.a
Plantation Forest Productivity in Brazil
Source: Pöyry
18
COPYRIGHT©PÖYRY
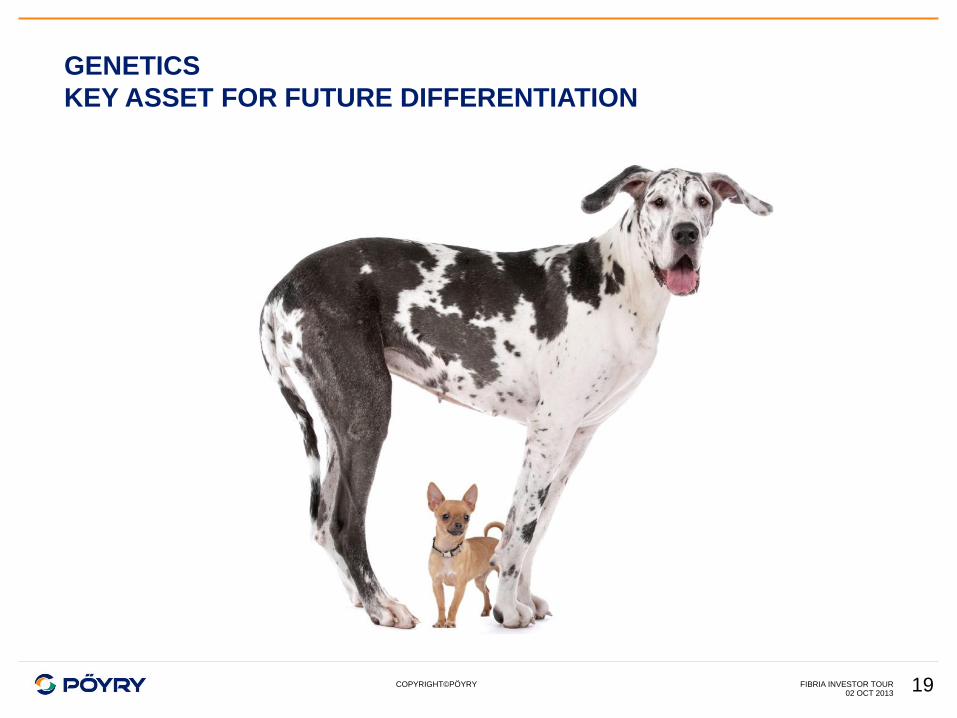
GENETICS
KEY ASSET FOR FUTURE DIFFERENTIATION
02 OCT 2013 FIBRIA INVESTOR TOUR 19
COPYRIGHT©PÖYRY 02 OCT 2013
FIBRIA INVESTOR TOUR 20
NEW COMPETITION ON ASIA?
COPYRIGHT©PÖYRY
0
200
400
600
800
1 000
1 200
1 400
1 600
0 2 4 6 8 10 12 14 16 18 20 22 24 26 28 30 32 34
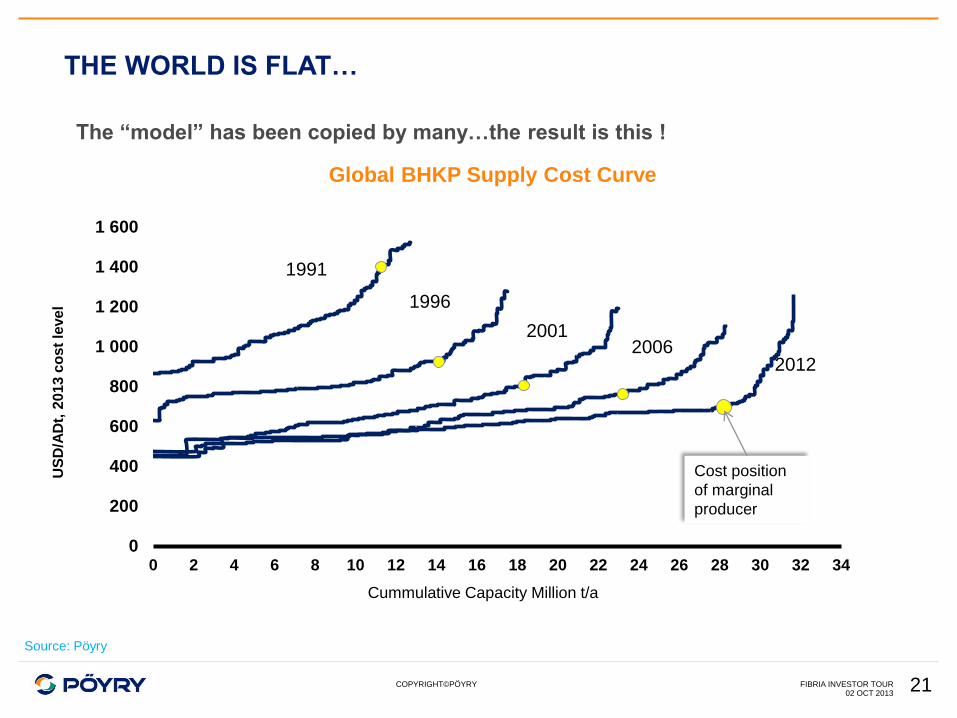
THE WORLD IS FLAT…
Global BHKP Supply Cost Curve
Cummulative Capacity Million t/a
1991
1996
2001 2006
2012
Cost position
of marginal
producer
The “model” has been copied by many…the result is this !
Source: Pöyry
02 OCT 2013 FIBRIA INVESTOR TOUR 21
US
D/A
Dt,
201
3 c
os
t le
ve
l
COPYRIGHT©PÖYRY
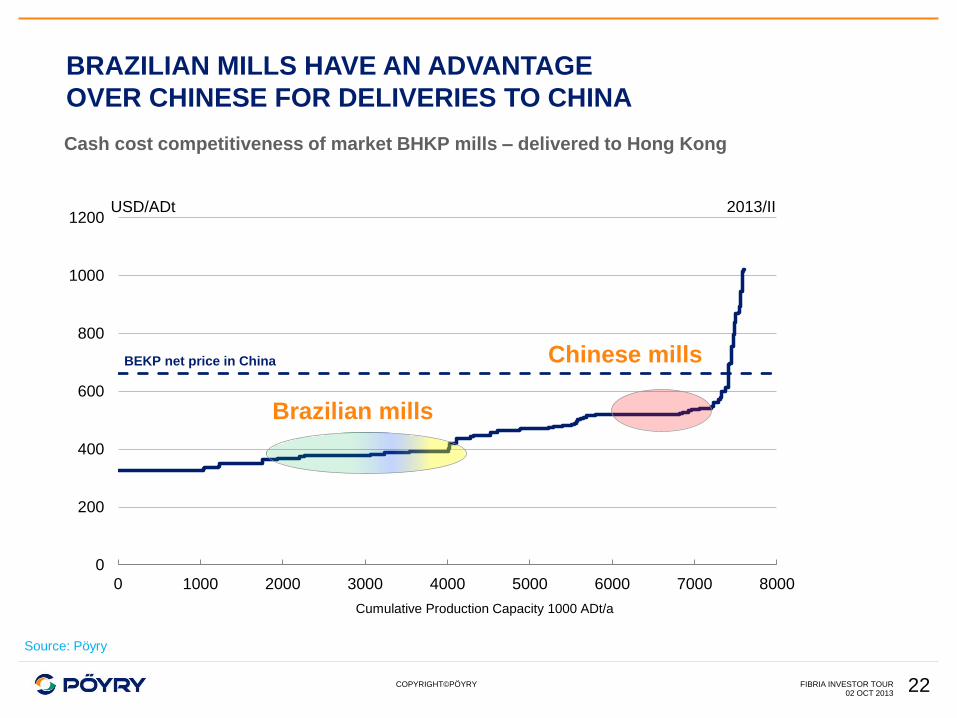
BRAZILIAN MILLS HAVE AN ADVANTAGE
OVER CHINESE FOR DELIVERIES TO CHINA
Cash cost competitiveness of market BHKP mills – delivered to Hong Kong
02 OCT 2013 FIBRIA INVESTOR TOUR
0
200
400
600
800
1000
1200
0 1000 2000 3000 4000 5000 6000 7000 8000
USD/ADt 2013/II
BEKP net price in China
Cumulative Production Capacity 1000 ADt/a
Brazilian mills
Chinese mills
Source: Pöyry
22
COPYRIGHT©PÖYRY
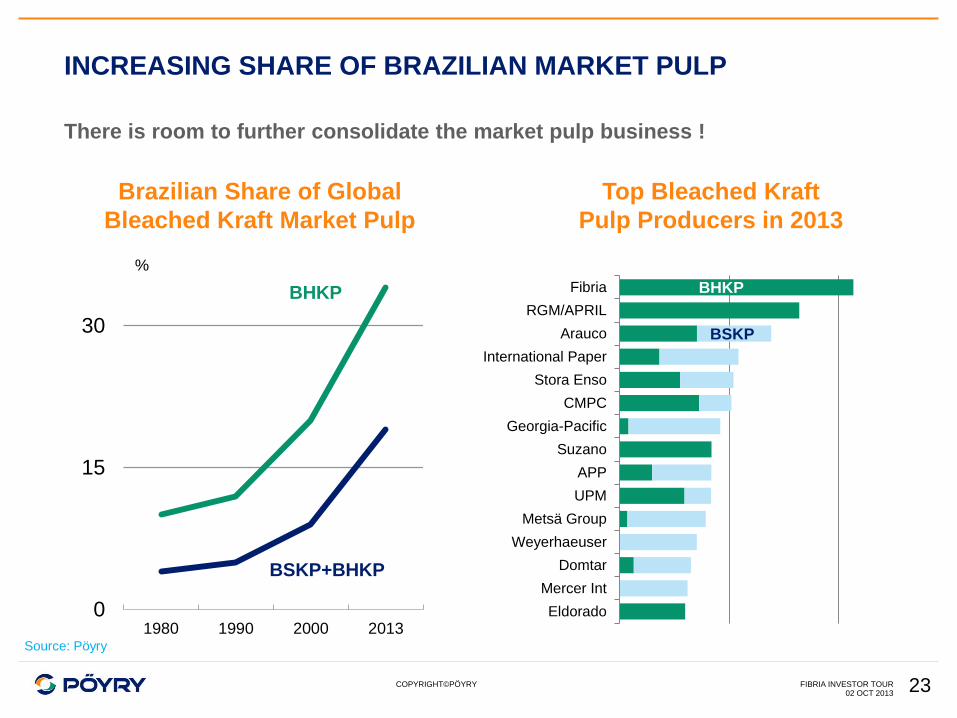
INCREASING SHARE OF BRAZILIAN MARKET PULP
02 OCT 2013 FIBRIA INVESTOR TOUR
There is room to further consolidate the market pulp business !
Eldorado
Mercer Int
Domtar
Weyerhaeuser
Metsä Group
UPM
APP
Suzano
Georgia-Pacific
CMPC
Stora Enso
International Paper
Arauco
RGM/APRIL
Fibria
Top Bleached Kraft
Pulp Producers in 2013
Brazilian Share of Global
Bleached Kraft Market Pulp
0
15
30
1980 1990 2000 2013
%
BHKP
BSKP+BHKP
BHKP
BSKP
Source: Pöyry
23
COPYRIGHT©PÖYRY
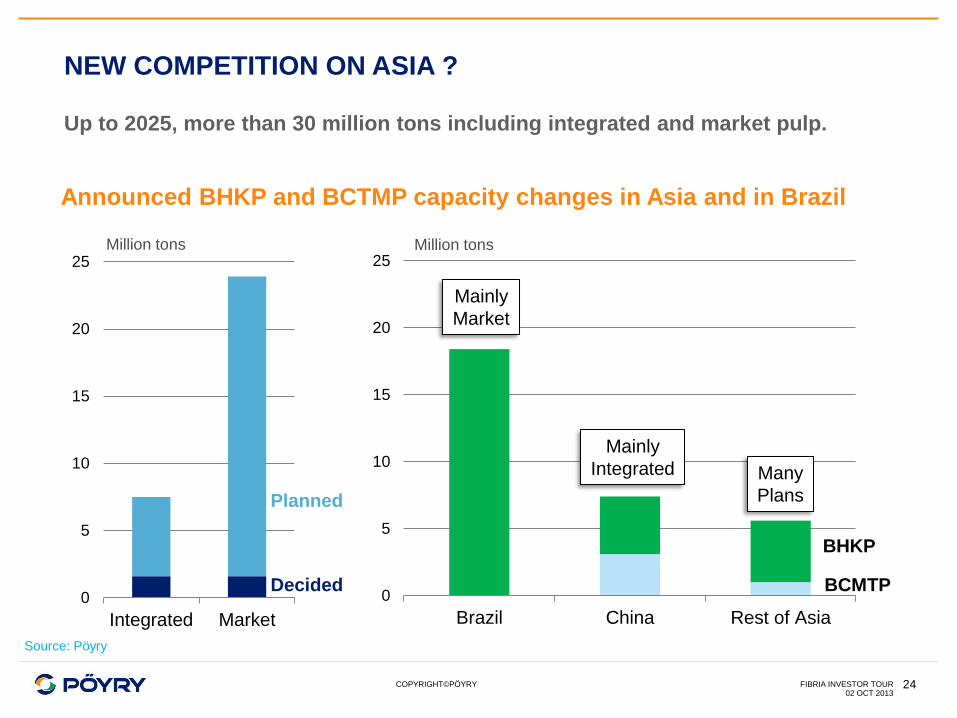
NEW COMPETITION ON ASIA ?
02 OCT 2013 FIBRIA INVESTOR TOUR
0
5
10
15
20
25
Integrated Market
Up to 2025, more than 30 million tons including integrated and market pulp.
0
5
10
15
20
25
Brazil China Rest of Asia
BHKP
BCMTP
Planned
Decided
Million tons Million tons
Mainly
Market
Mainly
Integrated Many
Plans
Source: Pöyry
Announced BHKP and BCTMP capacity changes in Asia and in Brazil
24
COPYRIGHT©PÖYRY
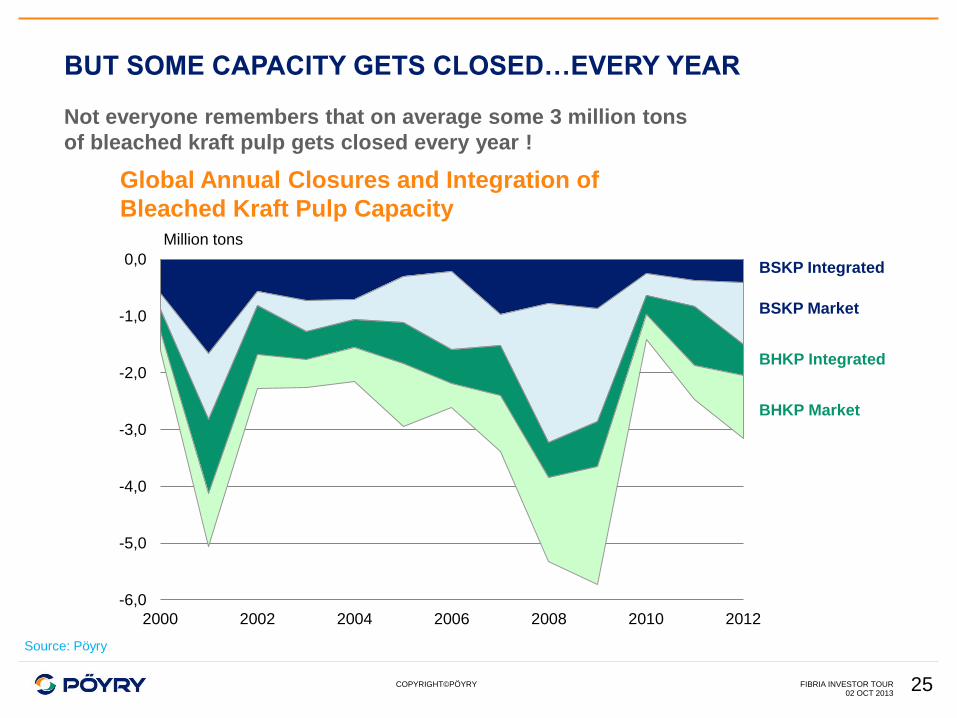
BUT SOME CAPACITY GETS CLOSED…EVERY YEAR
FIBRIA INVESTOR TOUR
Not everyone remembers that on average some 3 million tons
of bleached kraft pulp gets closed every year !
-6,0
-5,0
-4,0
-3,0
-2,0
-1,0
0,0
2000 2002 2004 2006 2008 2010 2012
Million tons
02 OCT 2013
Global Annual Closures and Integration of
Bleached Kraft Pulp Capacity
Source: Pöyry
BHKP Market
BHKP Integrated
BSKP Market
BSKP Integrated
25
COPYRIGHT©PÖYRY
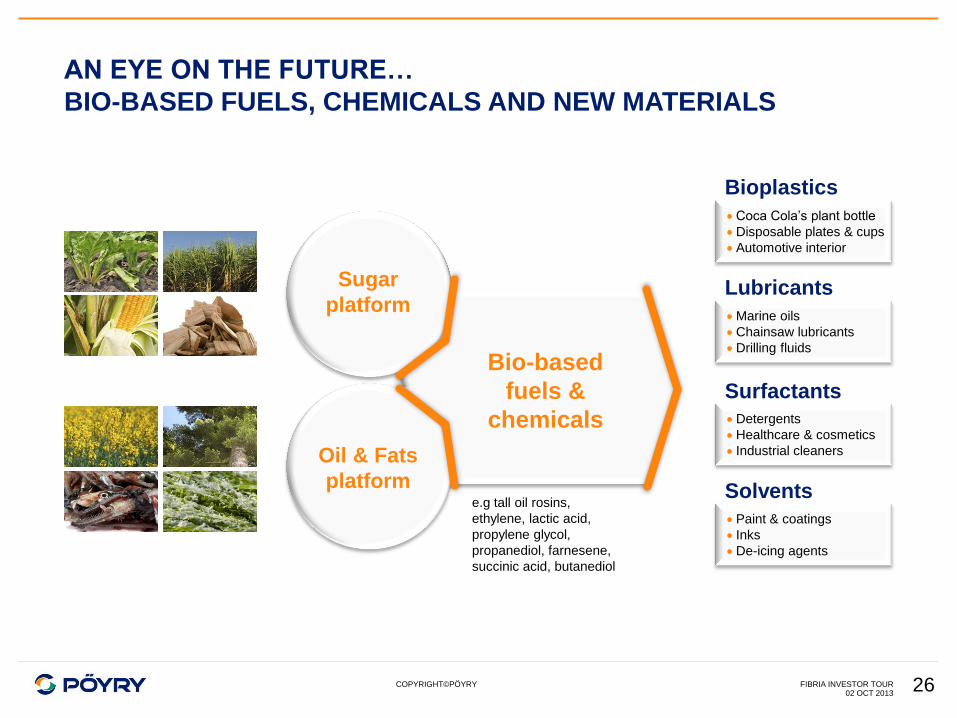
AN EYE ON THE FUTURE…
BIO-BASED FUELS, CHEMICALS AND NEW MATERIALS
02 OCT 2013 FIBRIA INVESTOR TOUR 26
Sugar
platform
Oil & Fats
platform
Bioplastics
Surfactants
Lubricants
Solvents
Bio-based
fuels &
chemicals
Coca Cola’s plant bottle
Disposable plates & cups
Automotive interior
Detergents
Healthcare & cosmetics
Industrial cleaners
Marine oils
Chainsaw lubricants
Drilling fluids
Paint & coatings
Inks
De-icing agents
e.g tall oil rosins,
ethylene, lactic acid,
propylene glycol,
propanediol, farnesene,
succinic acid, butanediol
COPYRIGHT©PÖYRY
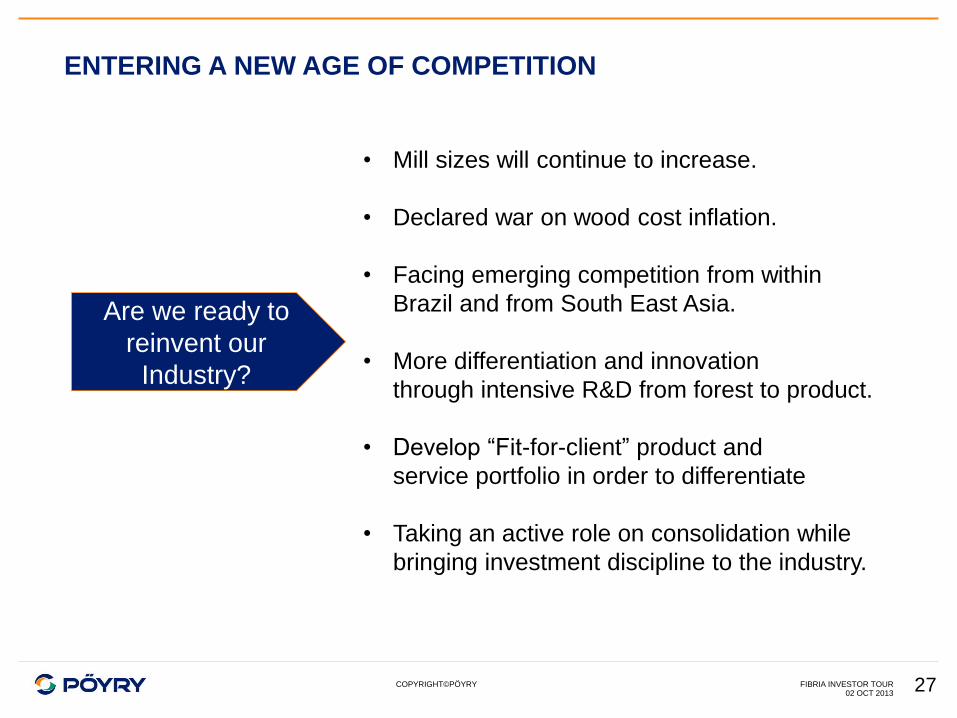
ENTERING A NEW AGE OF COMPETITION
02 OCT 2013 FIBRIA INVESTOR TOUR
Are we ready to
reinvent our
Industry?
• Mill sizes will continue to increase.
• Declared war on wood cost inflation.
• Facing emerging competition from within
Brazil and from South East Asia.
• More differentiation and innovation
through intensive R&D from forest to product.
• Develop “Fit-for-client” product and
service portfolio in order to differentiate
• Taking an active role on consolidation while
bringing investment discipline to the industry.
27
COPYRIGHT©PÖYRY 28 02 OCT 2013
FIBRIA INVESTOR TOUR
Questions ?
Mr. João Cordeiro
“It is not the strongest of the species that survives, nor the most
intelligent, but the one most responsive to change.”
― Charles Darwin
Competitive Strategy
Marcelo Castelli - CEO
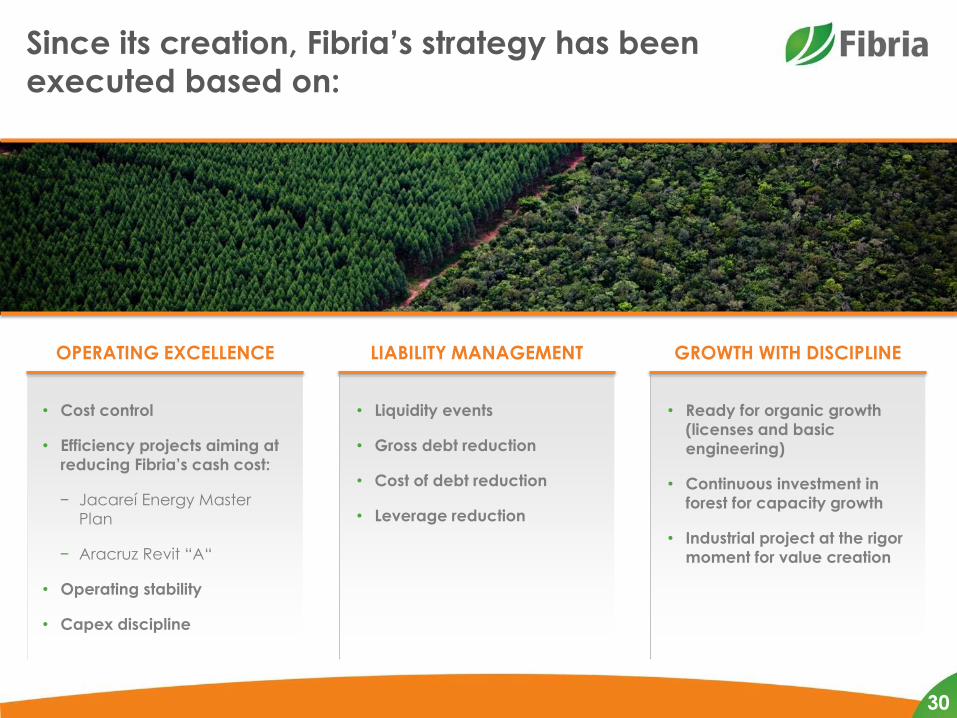
Since its creation, Fibria’s strategy has been
executed based on:
30
OPERATING EXCELLENCE LIABILITY MANAGEMENT GROWTH WITH DISCIPLINE
• Cost control
• Efficiency projects aiming at
reducing Fibria’s cash cost:
− Jacareí Energy Master
Plan
− Aracruz Revit “A“
• Operating stability
• Capex discipline
• Liquidity events
• Gross debt reduction
• Cost of debt reduction
• Leverage reduction
• Ready for organic growth
(licenses and basic
engineering)
• Continuous investment in
forest for capacity growth
• Industrial project at the rigor
moment for value creation
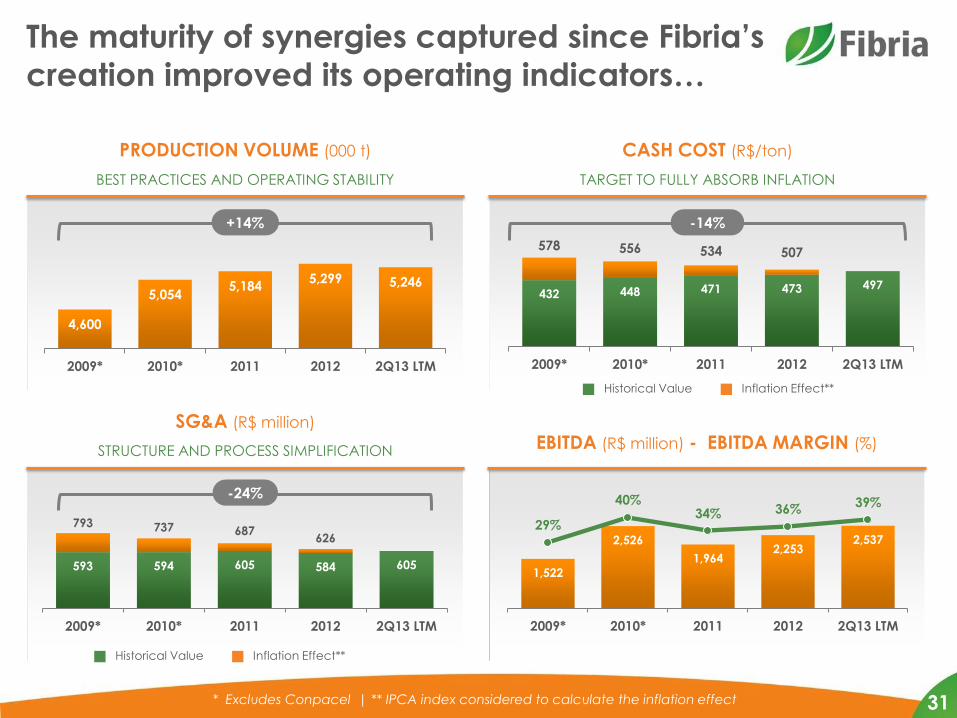
STRUCTURE AND PROCESS SIMPLIFICATION
SG&A (R$ million)
EBITDA (R$ million) - EBITDA MARGIN (%)
TARGET TO FULLY ABSORB INFLATION
CASH COST (R$/ton)
BEST PRACTICES AND OPERATING STABILITY
PRODUCTION VOLUME (000 t)
The maturity of synergies captured since Fibria’s
creation improved its operating indicators…
31
Historical Value Inflation Effect**
* Excludes Conpacel | ** IPCA index considered to calculate the inflation effect
4,600
5,054 5,184
5,299 5,246
2009* 2010* 2011 2012 2Q13 LTM
432 448 471 473 497
578 556 534 507
2009* 2010* 2011 2012 2Q13 LTM
+14% -14%
Historical Value Inflation Effect**
-24%
593 594 605 584 605
793 737 687 626
2009* 2010* 2011 2012 2Q13 LTM
1,522
2,526
1,964 2,253
2,537 29%
40% 34% 36%
39%
2009* 2010* 2011 2012 2Q13 LTM

* From June 30, 2012 on, net debt/EBITDA ratio for covenant purposes are calculated in US Dollars and the limit is 4.5x ** 2013 year end market consensus
… and reduced its debt.
6.5
3.6
4.8
3.4 3.1 3.3 2.7
7.1
3.8
4.2
3.3 3.1 3.0
Net Debt/EBITDA (x) R$
Net Debt/EBITDA (x) US$*
Market
Consensus
11.0
9.8 9.5
7.7 7.5
8.3
2009 2010 2011 2012 1Q13 2Q13 2013**
NET DEBT (R$ BILLION)
FX RATE (R$/US$)
1.67
1.76
1.74
2.00 Average LTM
End of Period 1.87
1.67
1.95
2.04
2.01
2.00
2.22
2.07
32
2.24
2.13
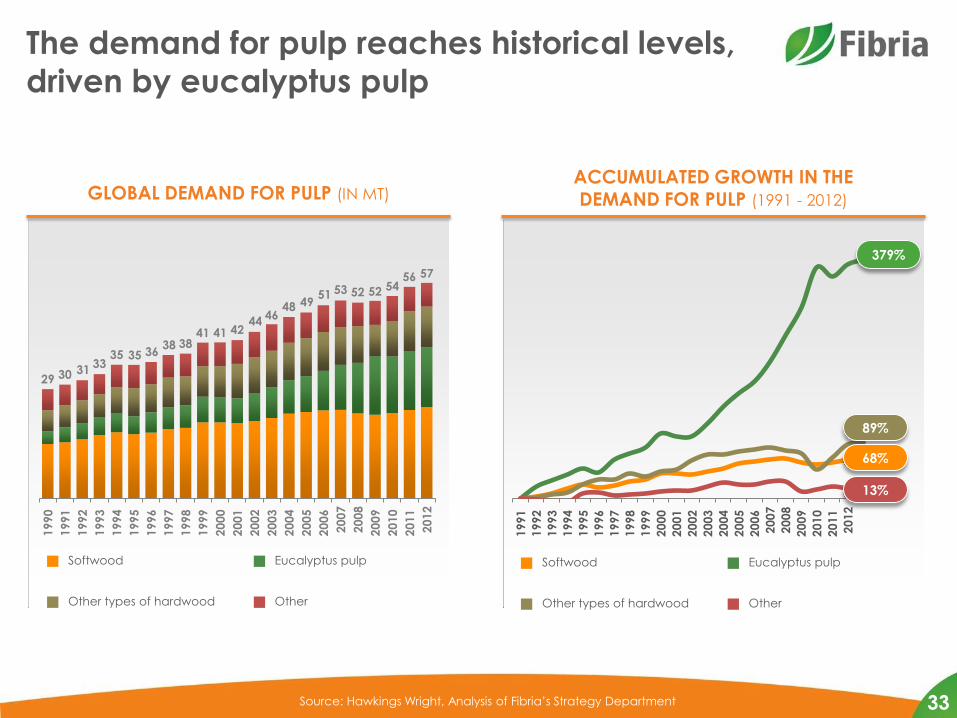
The demand for pulp reaches historical levels,
driven by eucalyptus pulp
33
GLOBAL DEMAND FOR PULP (IN MT) ACCUMULATED GROWTH IN THE DEMAND FOR PULP (1991 - 2012)
29 30 31 33
35 35 36 38 38
41 41 42 44
46 48 49
51 53 52 52 54 56 57
1990
1991
1992
1993
1994
1995
1996
1997
1998
1999
2000
2001
2002
2003
2004
2005
2006
2007
2008
2009
2010
2011
2012
Softwood Eucalyptus pulp
Other types of hardwood Other
68%
89%
13%
1991
1992
1993
1994
1995
1996
1997
1998
1999
2000
2001
2002
2003
2004
2005
2006
2007
2008
2009
2010
2011
2012
Softwood Eucalyptus pulp
Other types of hardwood Other
Source: Hawkings Wright, Analysis of Fibria’s Strategy Department
379%
89%
68%
13%
Source: RISI, LCA, Analysis of Fibria’s Strategy Department
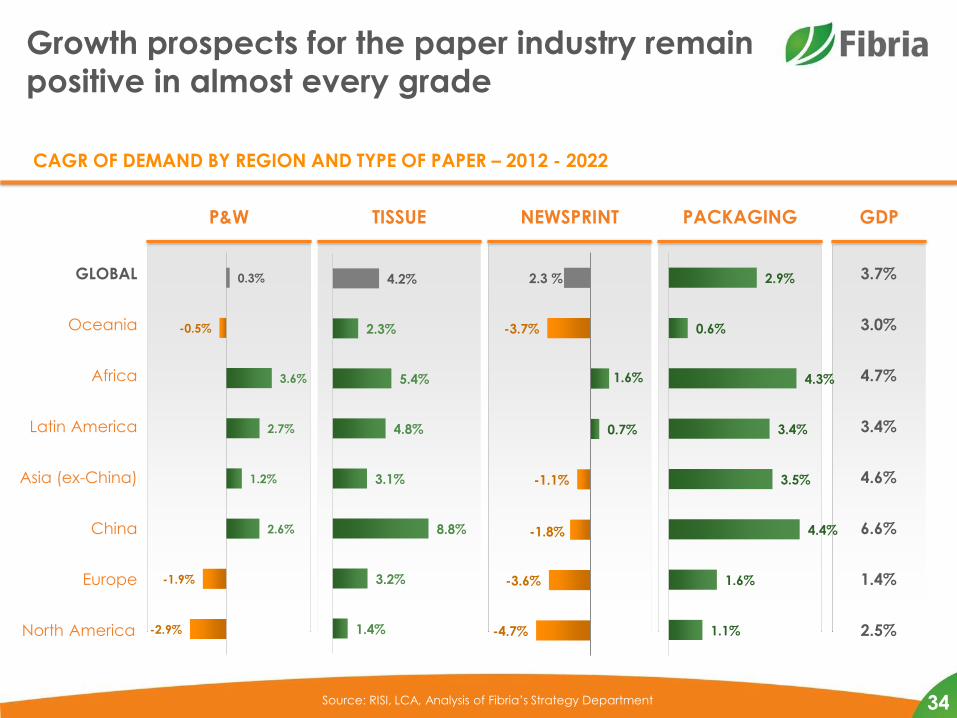
Growth prospects for the paper industry remain
positive in almost every grade
GDP TISSUE NEWSPRINT PACKAGING P&W
GLOBAL
Oceania
Africa
Latin America
Asia (ex-China)
China
Europe
North America -2.9%
-1.9%
2.6%
1.2%
2.7%
3.6%
-0.5%
0.3%
1.4%
3.2%
8.8%
3.1%
4.8%
5.4%
2.3%
4.2%
-4.7%
-3.6%
-1.8%
-1.1%
0.7%
1.6%
-3.7%
2.3 %
1.1%
1.6%
4.4%
3.5%
3.4%
4.3%
0.6%
2.9% 3.7%
4.7%
6.6%
4.6%
1.4%
3.4%
3.0%
2.5%
CAGR OF DEMAND BY REGION AND TYPE OF PAPER – 2012 - 2022
34
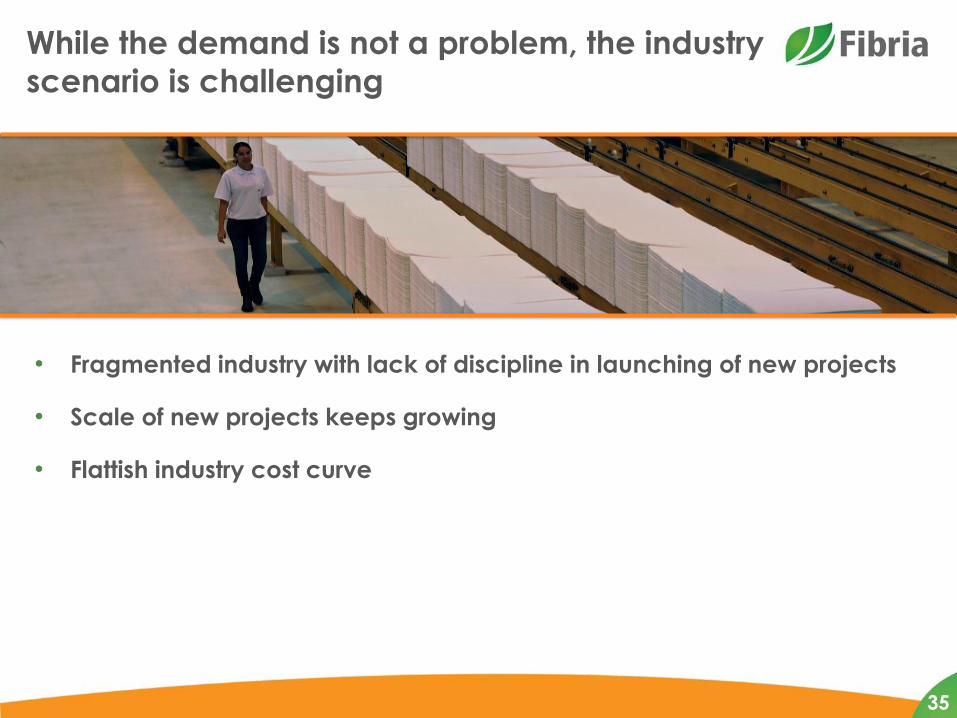
While the demand is not a problem, the industry
scenario is challenging
• Fragmented industry with lack of discipline in launching of new projects
• Scale of new projects keeps growing
• Flattish industry cost curve
35
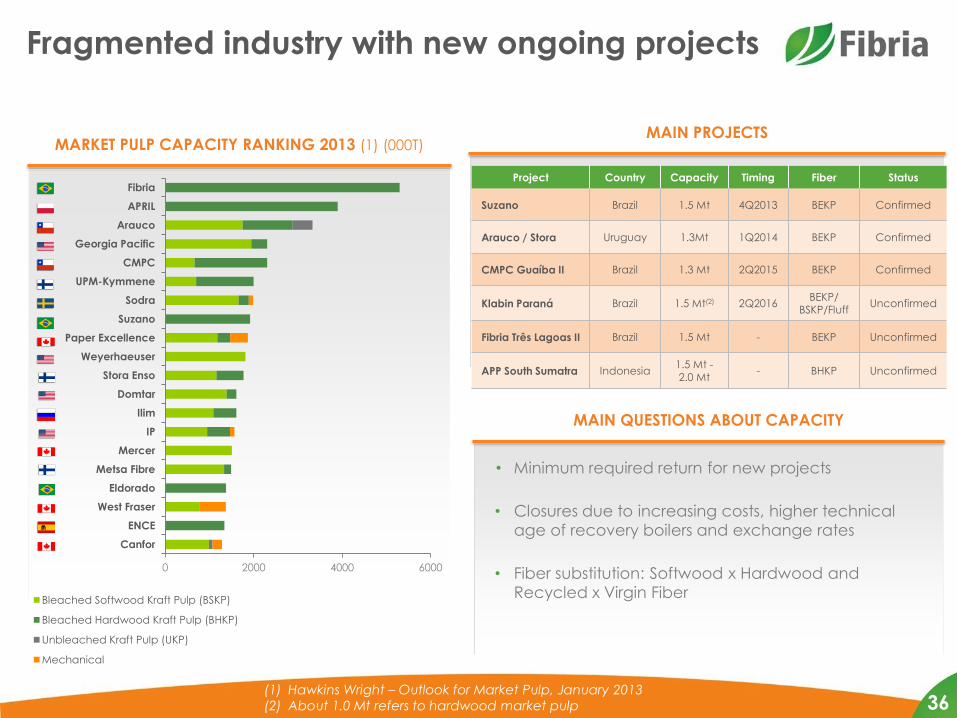
Fragmented industry with new ongoing projects
36
MARKET PULP CAPACITY RANKING 2013 (1) (000T) MAIN PROJECTS
0 2000 4000 6000
Canfor
ENCE
West Fraser
Eldorado
Metsa Fibre
Mercer
IP
Ilim
Domtar
Stora Enso
Weyerhaeuser
Paper Excellence
Suzano
Sodra
UPM-Kymmene
CMPC
Georgia Pacific
Arauco
APRIL
Fibria
Bleached Softwood Kraft Pulp (BSKP)
Bleached Hardwood Kraft Pulp (BHKP)
Unbleached Kraft Pulp (UKP)
Mechanical
Project Country Capacity Timing Fiber Status
Suzano Brazil 1.5 Mt 4Q2013 BEKP Confirmed
Arauco / Stora Uruguay 1.3Mt 1Q2014 BEKP Confirmed
CMPC Guaíba II Brazil 1.3 Mt 2Q2015 BEKP Confirmed
Klabin Paraná Brazil 1.5 Mt(2) 2Q2016 BEKP/
BSKP/Fluff Unconfirmed
Fibria Três Lagoas II Brazil 1.5 Mt - BEKP Unconfirmed
APP South Sumatra Indonesia 1.5 Mt -2.0 Mt
- BHKP Unconfirmed
MAIN QUESTIONS ABOUT CAPACITY
• Minimum required return for new projects
• Closures due to increasing costs, higher technical
age of recovery boilers and exchange rates
• Fiber substitution: Softwood x Hardwood and
Recycled x Virgin Fiber
(1) Hawkins Wright – Outlook for Market Pulp, January 2013
(2) About 1.0 Mt refers to hardwood market pulp
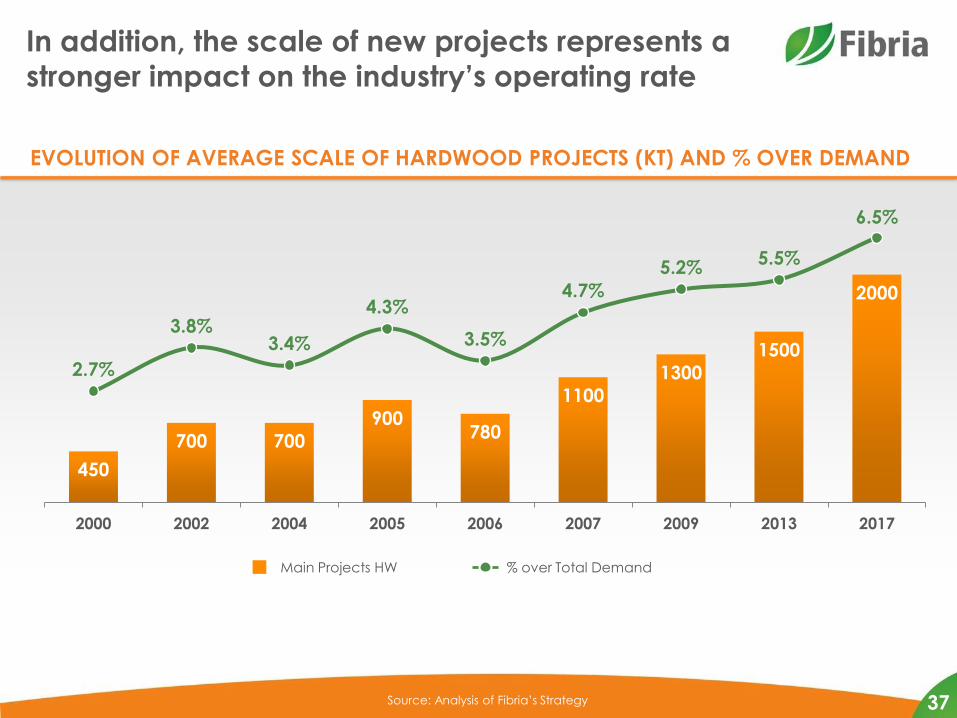
450
700 700
900 780
1100
1300
1500
2000
2.7%
3.8% 3.4%
4.3%
3.5%
4.7%
5.2% 5.5%
6.5%
2000 2002 2004 2005 2006 2007 2009 2013 2017
In addition, the scale of new projects represents a
stronger impact on the industry’s operating rate
37 Source: Analysis of Fibria’s Strategy
EVOLUTION OF AVERAGE SCALE OF HARDWOOD PROJECTS (KT) AND % OVER DEMAND
Main Projects HW % over Total Demand
Given the scenario, Fibria is diversifying its sources
of value creation.
• Drivers of continuous improvement and innovation
– Continuous search for operating excellence and cost control initiatives
– Forestry biotechnology
– Development of customized products - “fit for client”
– Actions to reduce employed capital
• Growth initiatives
• Complementary actions in the Value Chain
38
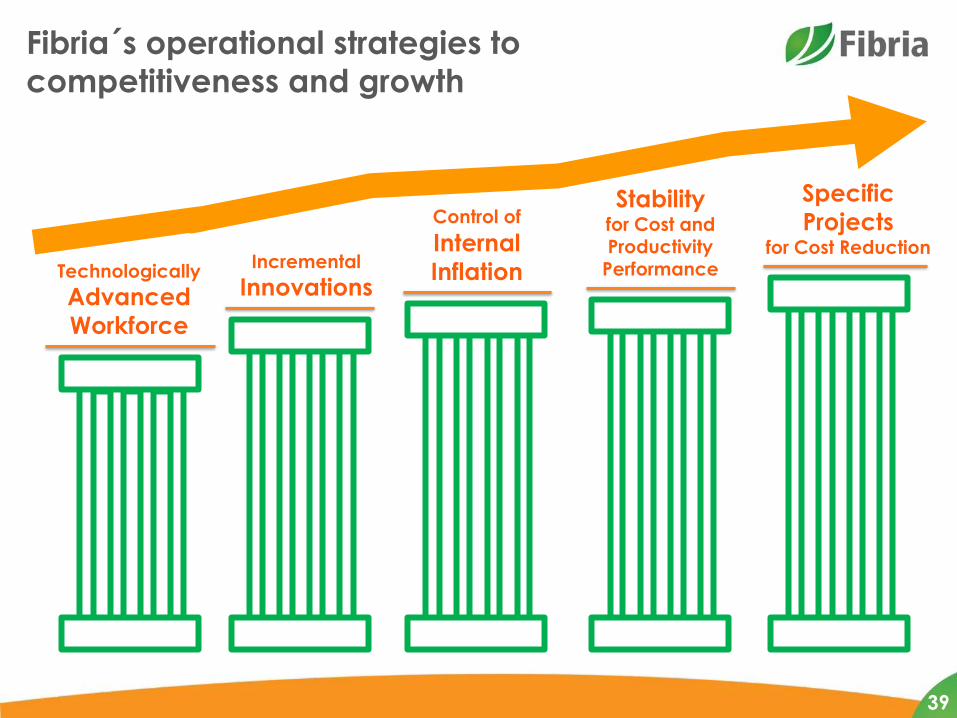
Fibria´s operational strategies to
competitiveness and growth
Incremental
Innovations Technologically
Advanced
Workforce
Control of
Internal
Inflation
Stability for Cost and Productivity
Performance
Specific
Projects for Cost Reduction
39
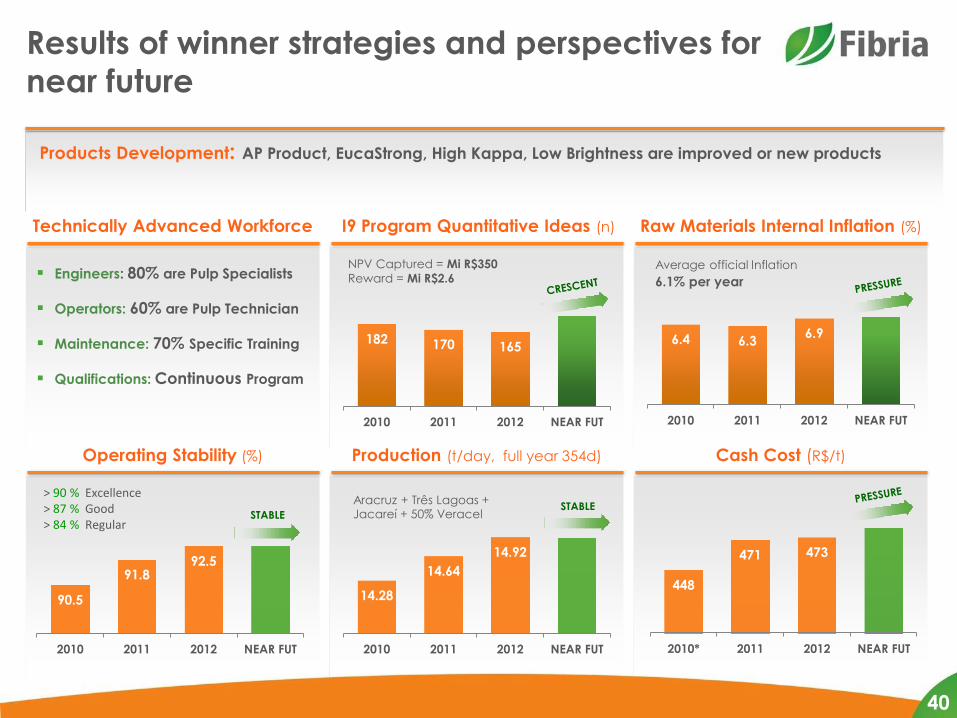
Results of winner strategies and perspectives for
near future
Technically Advanced Workforce I9 Program Quantitative Ideas (n) Raw Materials Internal Inflation (%)
Operating Stability (%) Production (t/day, full year 354d) Cash Cost (R$/t)
90.5
91.8 92.5
2010 2011 2012 NEAR FUT
14.28
14.64
14.92
2010 2011 2012 NEAR FUT
6.4 6.3 6.9
2010 2011 2012 NEAR FUT
448
471 473
2010* 2011 2012 NEAR FUT
182 170 165
2010 2011 2012 NEAR FUT
STABLE STABLE
NPV Captured = Mi R$350
Reward = Mi R$2.6 Engineers: 80% are Pulp Specialists
Operators: 60% are Pulp Technician
Maintenance: 70% Specific Training
Qualifications: Continuous Program
Products Development: AP Product, EucaStrong, High Kappa, Low Brightness are improved or new products
Aracruz + Três Lagoas + Jacareí + 50% Veracel
Average official Inflation
6.1% per year
> 90 % Excellence > 87 % Good > 84 % Regular
40

Jacareí Production t/d – Sep 2013
Operating Stability based on nonstop production
Bright September!!
Três Lagoas Production t/d – Sep 2013
41
Veracel Production t/d – Sep 2013 Aracruz Production t/d – Sep 2013
OS = 97,4 % OS = 97,5 %
OS = 96,4 % OS = 92,6 %
The biggest
Stability
&
Production
of the year
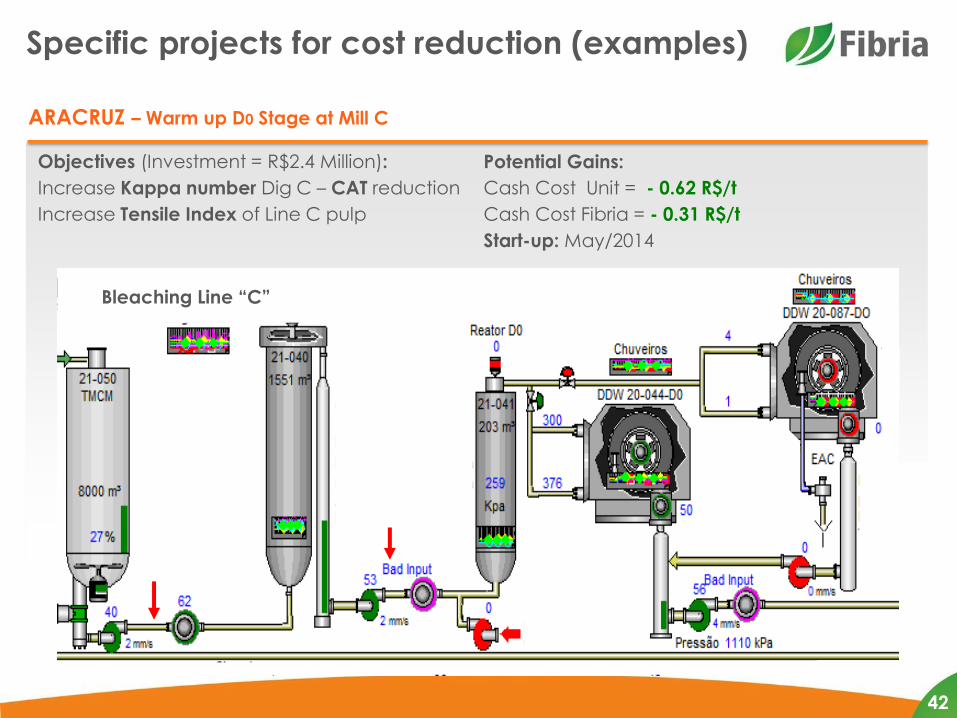
ARACRUZ – Warm up D0 Stage at Mill C
Specific projects for cost reduction (examples)
Objectives (Investment = R$2.4 Million):
Increase Kappa number Dig C – CAT reduction
Increase Tensile Index of Line C pulp
42
Potential Gains:
Cash Cost Unit = - 0.62 R$/t
Cash Cost Fibria = - 0.31 R$/t
Start-up: May/2014
Bleaching Line “C”
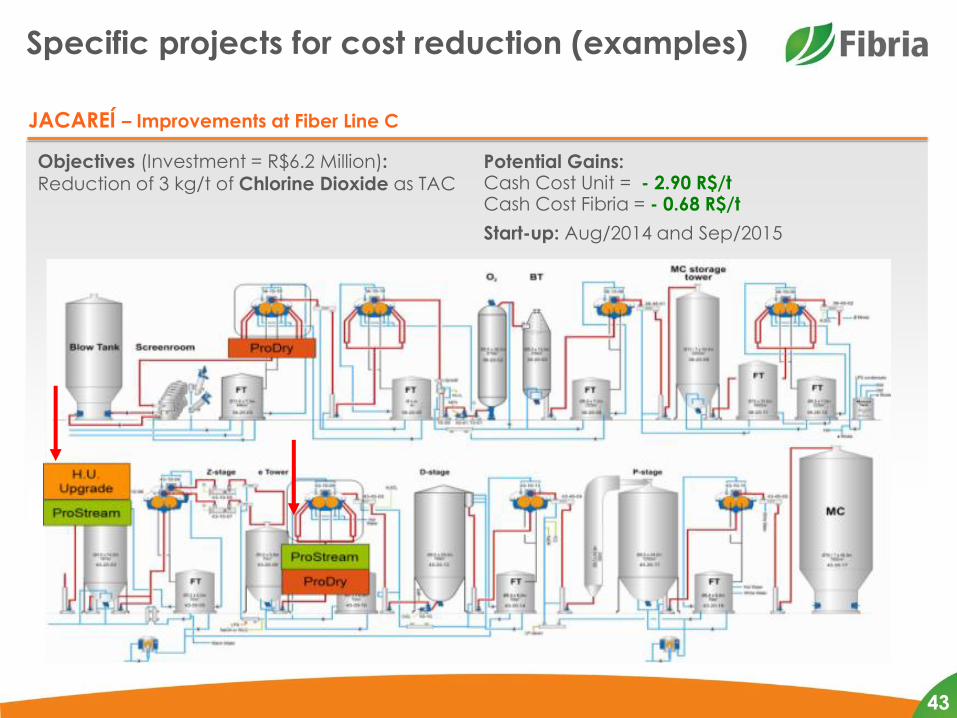
Specific projects for cost reduction (examples)
JACAREÍ – Improvements at Fiber Line C
Objectives (Investment = R$6.2 Million): Reduction of 3 kg/t of Chlorine Dioxide as TAC
43
Potential Gains: Cash Cost Unit = - 2.90 R$/t Cash Cost Fibria = - 0.68 R$/t
Start-up: Aug/2014 and Sep/2015
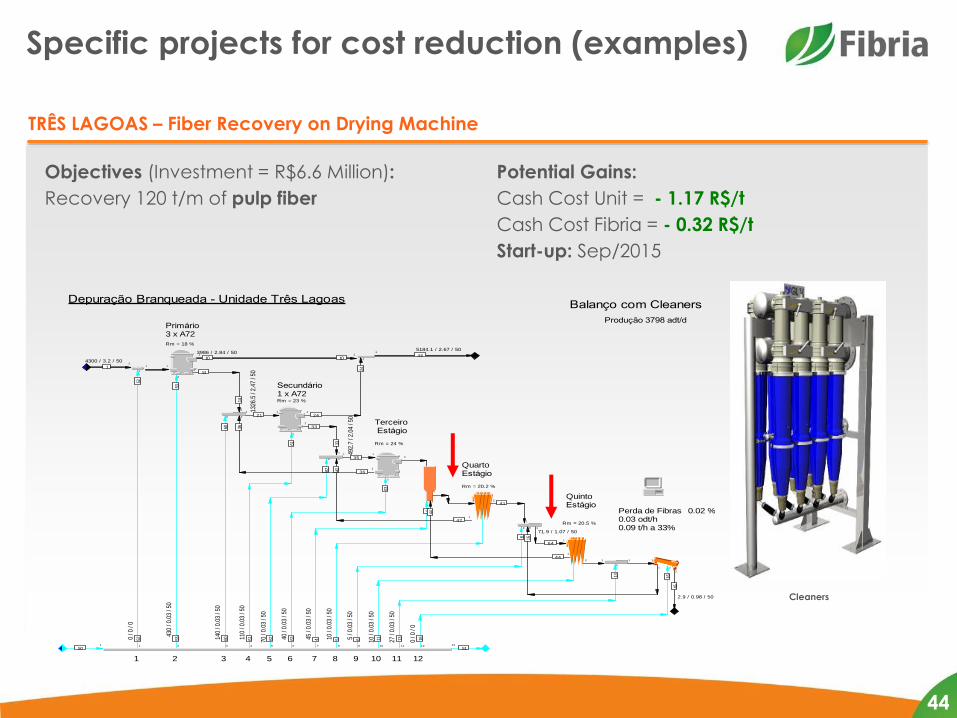
Specific projects for cost reduction (examples)
TRÊS LAGOAS – Fiber Recovery on Drying Machine
Objectives (Investment = R$6.6 Million):
Recovery 120 t/m of pulp fiber
Cleaners
1 1
2
2
53
5
3
430
/ 0.0
3 / 5
0
2
14
1
14
1 1
10 10
3986 / 2.84 / 50
1
50 13
51 12
16
2
16
0 / 0
/ 0
11
13
2
13
27 /
0.03
/ 50
10
11
2
10 /
0.03
/ 50
9
6
2
6
5 / 0
.03
/ 50
8
5
2
10 /
0.03
/ 50
7
4
2
4
45 /
0.03
/ 50
6
63
2
63
40 /
0.03
/ 50
5
62
3
62
70 /
0.03
/ 50
4
61
2
61
110
/ 0.0
3 / 5
0
3
3
60
6
0
140
/ 0.0
3 / 5
0
1
1
52
5
2
0 / 0
/ 0
1
42
2
42
2
33
1
33
1 1
35
492.
7 / 2
.04
/ 50
1
36
2
36
1 1
21
1326
.5 /
2.47
/ 50
1
24
2
24
1
46
5184.1 / 2.67 / 50
1
44
3
44
2
1
1
2 1 1 1
1
1
64
71.9 / 1.07 / 50
2
41
1
1
3 1
5
2
45
2.9 / 0.98 / 50
2
1
4300 / 3.2 / 50
12111098
Produção 3798 adt/d
0.02 %Perda de Fibras0.03 odt/h0.09 t/h a 33%
Rm = 20.5 %
Rm = 20.2 %
Rm = 24 %
Rm = 18 %
Rm = 23 %
7654321
Balanço com CleanersDepuração Branqueada - Unidade Três Lagoas
QuintoEstágio
QuartoEstágio
Terceiro Estágio
Secundário1 x A72
Primário3 x A72
44
Potential Gains:
Cash Cost Unit = - 1.17 R$/t
Cash Cost Fibria = - 0.32 R$/t
Start-up: Sep/2015
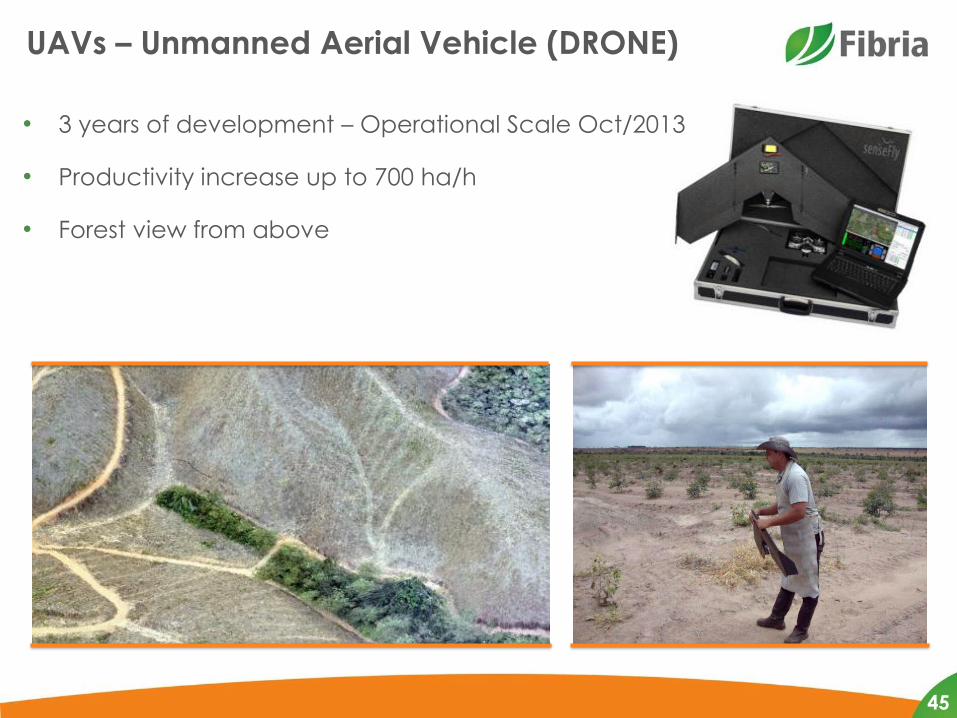
UAVs – Unmanned Aerial Vehicle (DRONE)
• 3 years of development – Operational Scale Oct/2013
• Productivity increase up to 700 ha/h
• Forest view from above
45
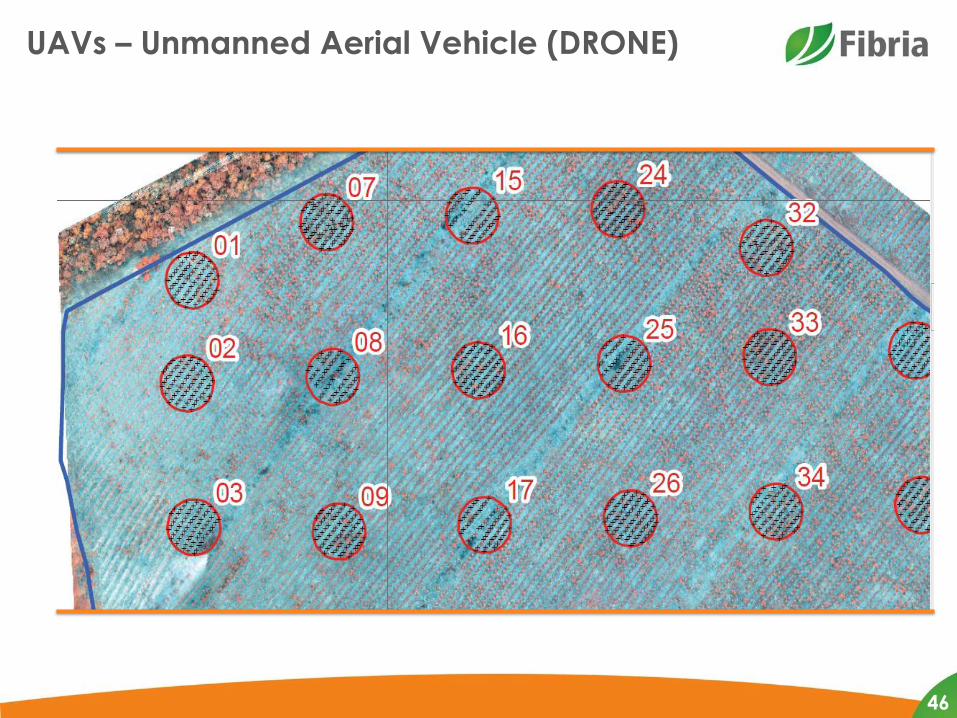
UAVs – Unmanned Aerial Vehicle (DRONE)
46
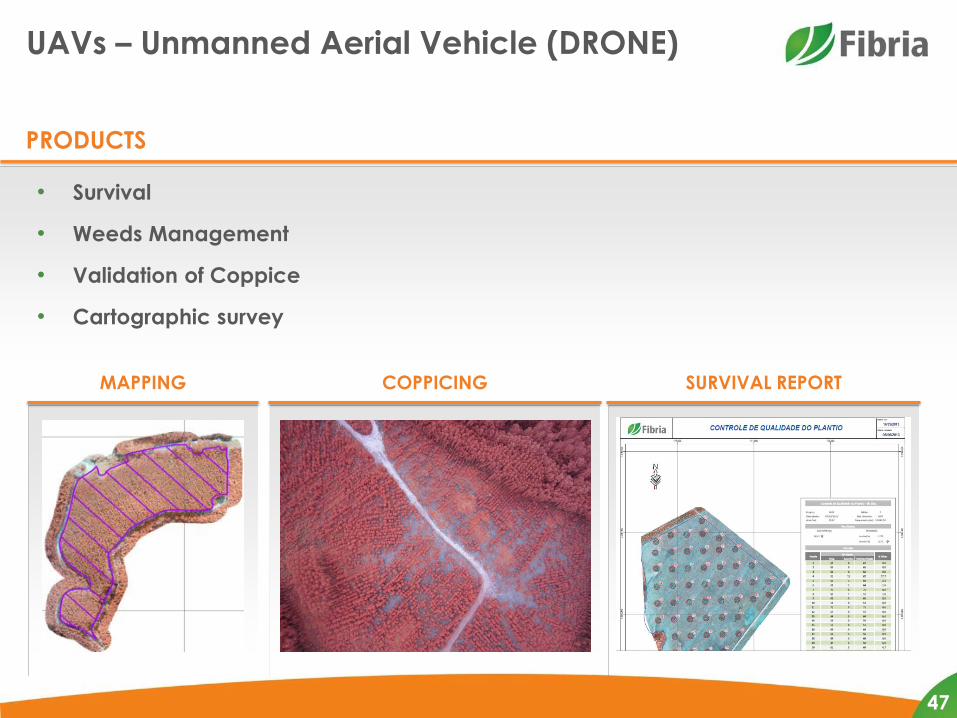
SURVIVAL REPORT COPPICING MAPPING
UAVs – Unmanned Aerial Vehicle (DRONE)
PRODUCTS
• Survival
• Weeds Management
• Validation of Coppice
• Cartographic survey
47
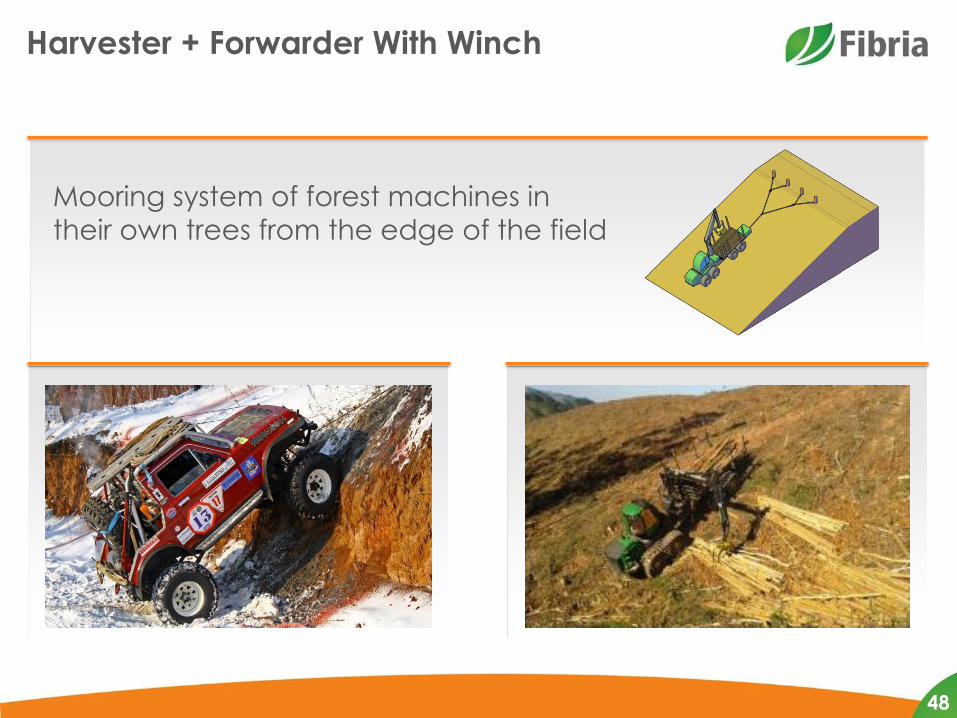
Harvester + Forwarder With Winch
Mooring system of forest machines in
their own trees from the edge of the field
48
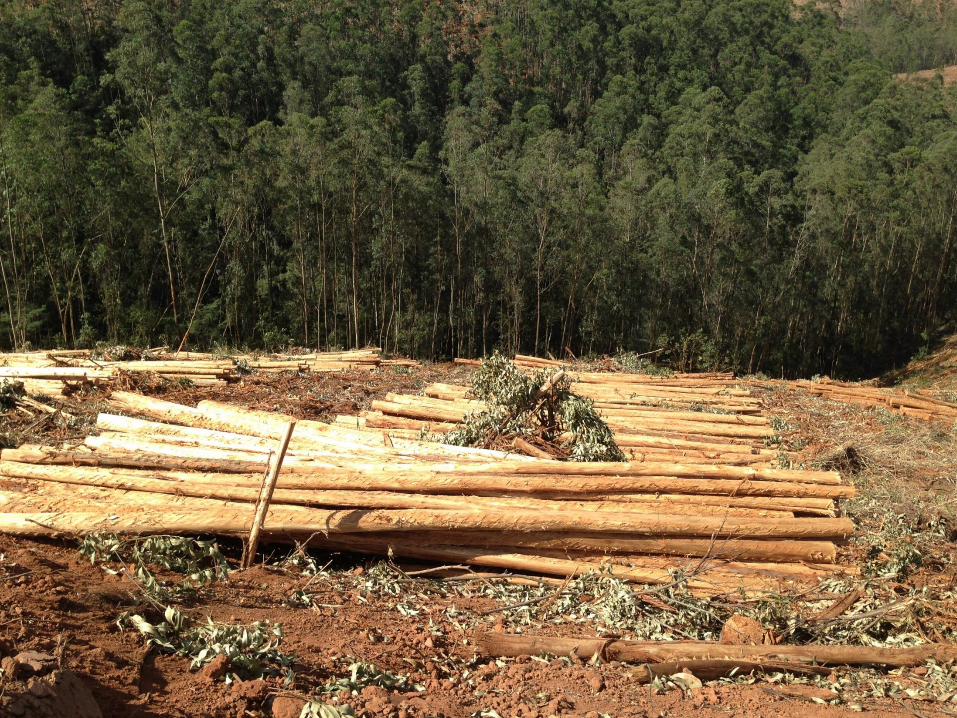
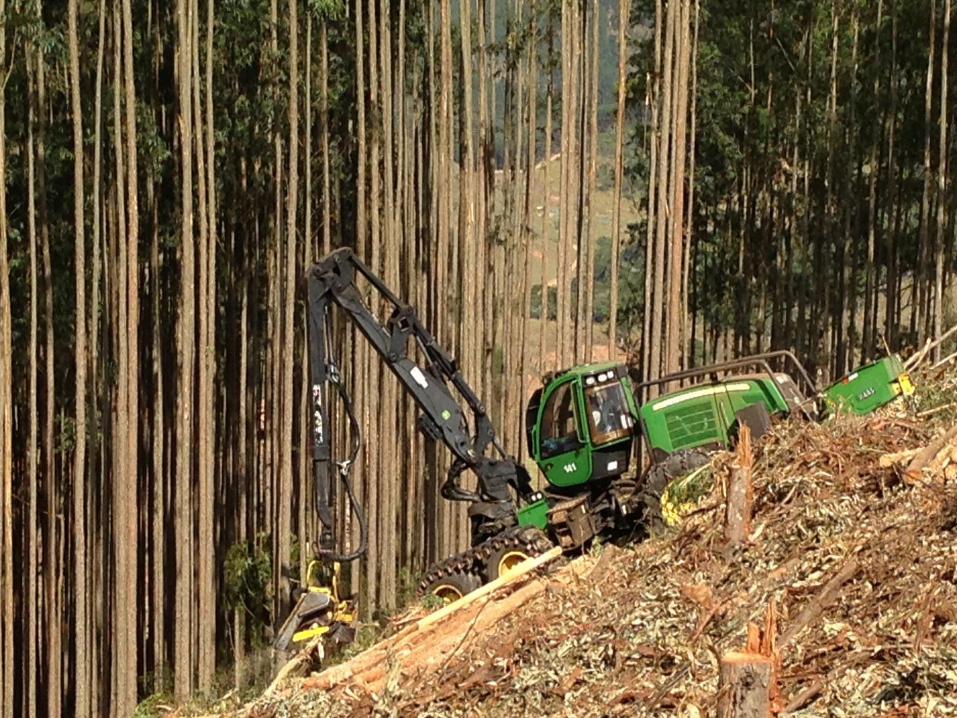
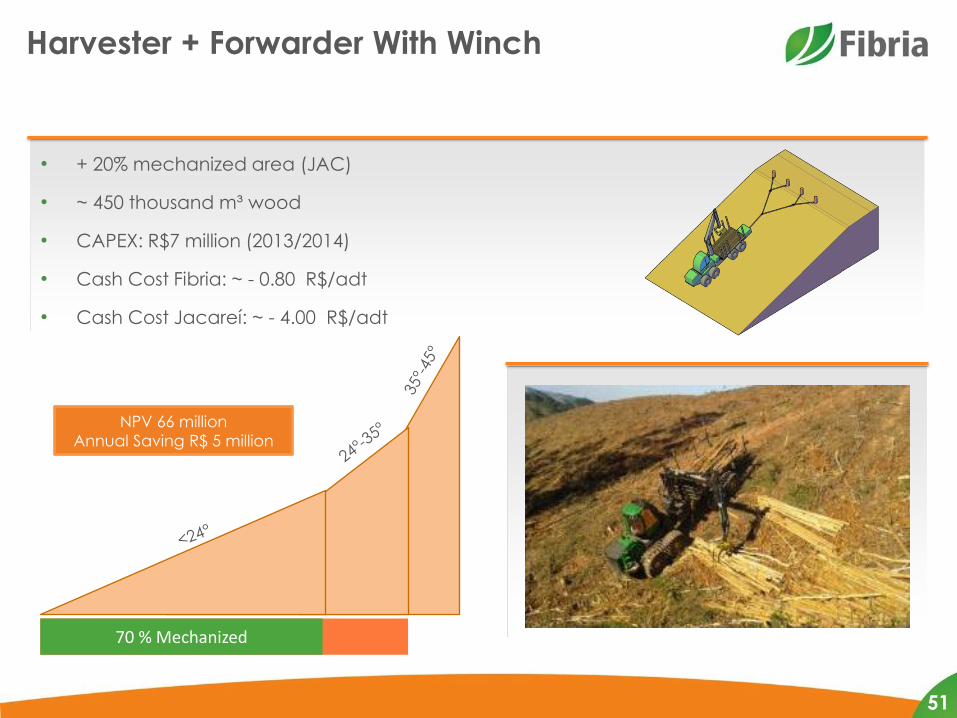
Harvester + Forwarder With Winch
• + 20% mechanized area (JAC)
• ~ 450 thousand m³ wood
• CAPEX: R$7 million (2013/2014)
• Cash Cost Fibria: ~ - 0.80 R$/adt
• Cash Cost Jacareí: ~ - 4.00 R$/adt
NPV 66 million
Annual Saving R$ 5 million
90 % Mechanized 70 % Mechanized
51
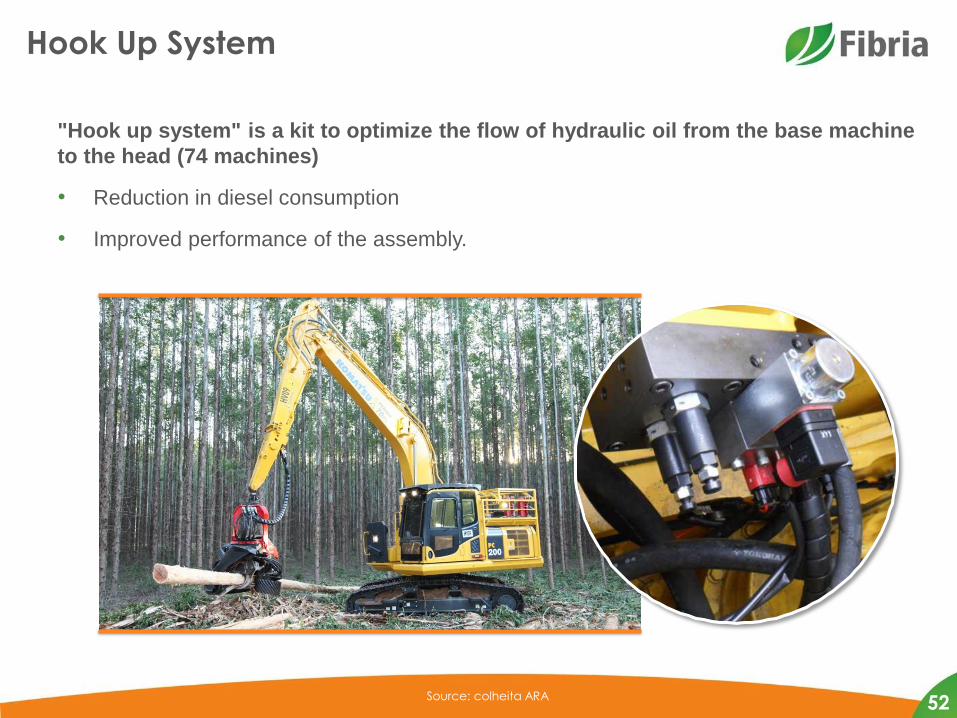
Hook Up System
"Hook up system" is a kit to optimize the flow of hydraulic oil from the base machine
to the head (74 machines)
• Reduction in diesel consumption
• Improved performance of the assembly.
Source: colheita ARA 52
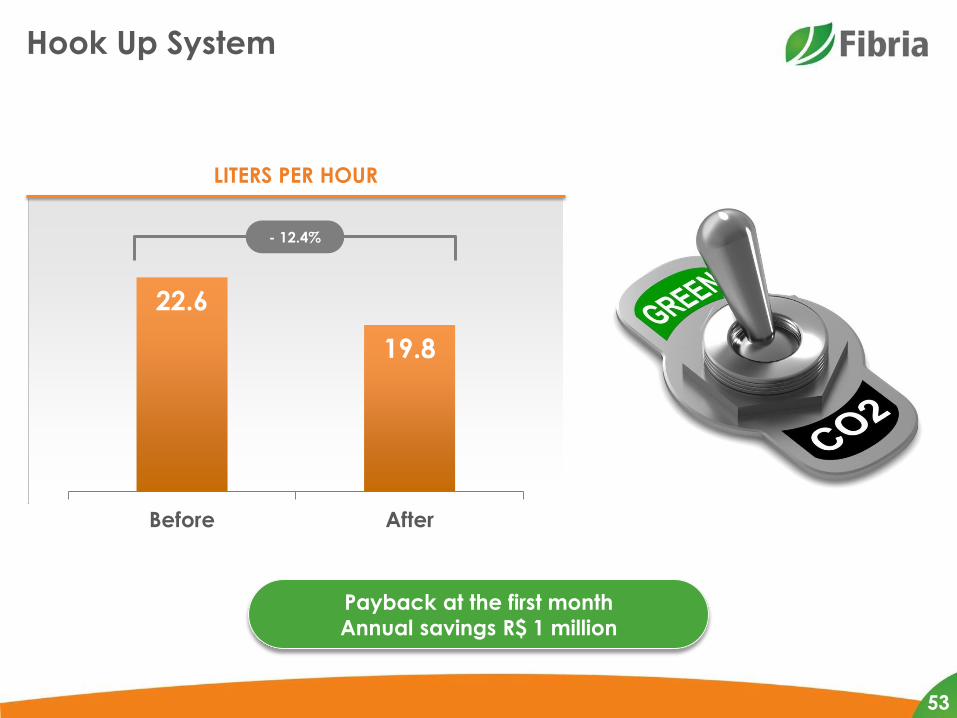
LITERS PER HOUR
Hook Up System
22.6
19.8
Before After
Payback at the first month
Annual savings R$ 1 million
- 12.4%
53
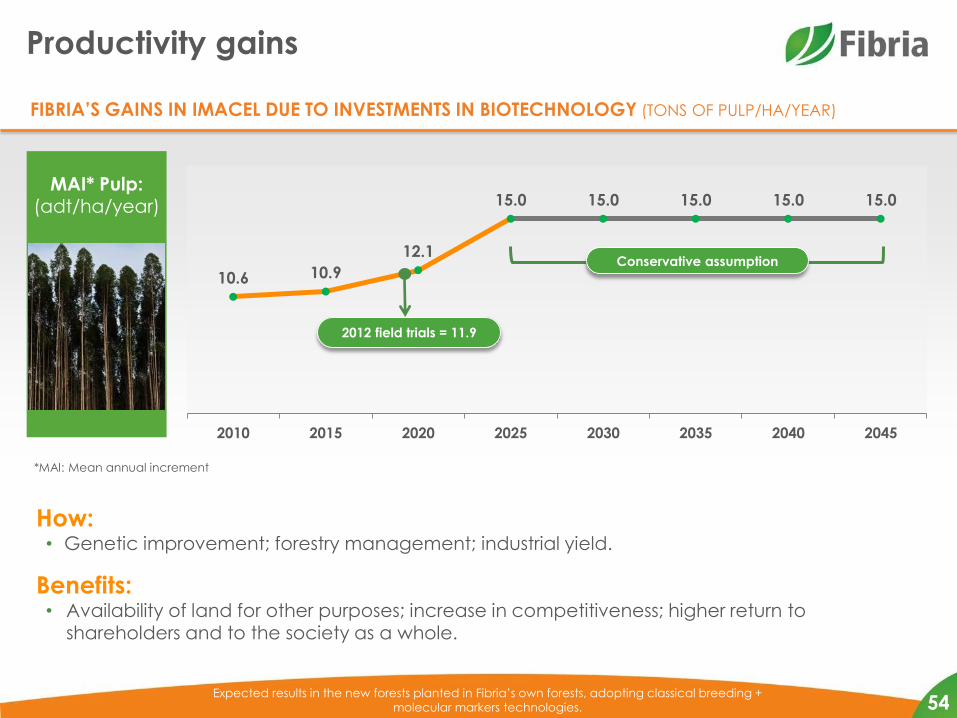
Productivity gains
MAI* Pulp: (adt/ha/year)
10.6 10.9
12.1
15.0 15.0 15.0 15.0 15.0
2010 2015 2020 2025 2030 2035 2040 2045
Expected results in the new forests planted in Fibria’s own forests, adopting classical breeding +
molecular markers technologies.
FIBRIA’S GAINS IN IMACEL DUE TO INVESTMENTS IN BIOTECHNOLOGY (TONS OF PULP/HA/YEAR)
2012 field trials = 11.9
Conservative assumption
*MAI: Mean annual increment
How: • Genetic improvement; forestry management; industrial yield.
Benefits: • Availability of land for other purposes; increase in competitiveness; higher return to
shareholders and to the society as a whole.
54
Innovation in the Core Business
The Technology Center (CT) operates within all company units and is directly involved with Fibria’s main operations, from the production of seedlings to the development of new products and
services.
The product portfolio is fully aligned with Fibria’s strategy and is managed by a system based on the “Stage and Gate” methodology.
In 2013, projects are distributed in the following dimensions:
• Operating excellence
• Differentiation through disruptive technologies
• Business sustainability (social and environmental development)
• New businesses
55
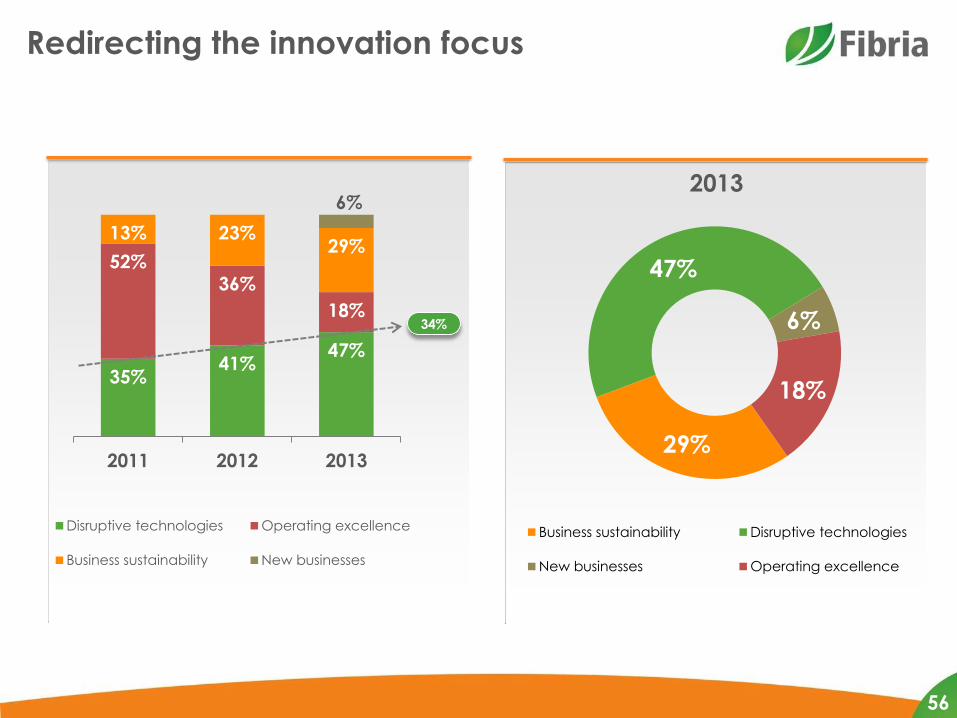
Redirecting the innovation focus
29%
47%
6%
18%
Business sustainability Disruptive technologies
New businesses Operating excellence
35% 41%
47%
52% 36%
18%
13% 23% 29%
6%
2011 2012 2013
Disruptive technologies Operating excellence
Business sustainability New businesses
34%
56
2013
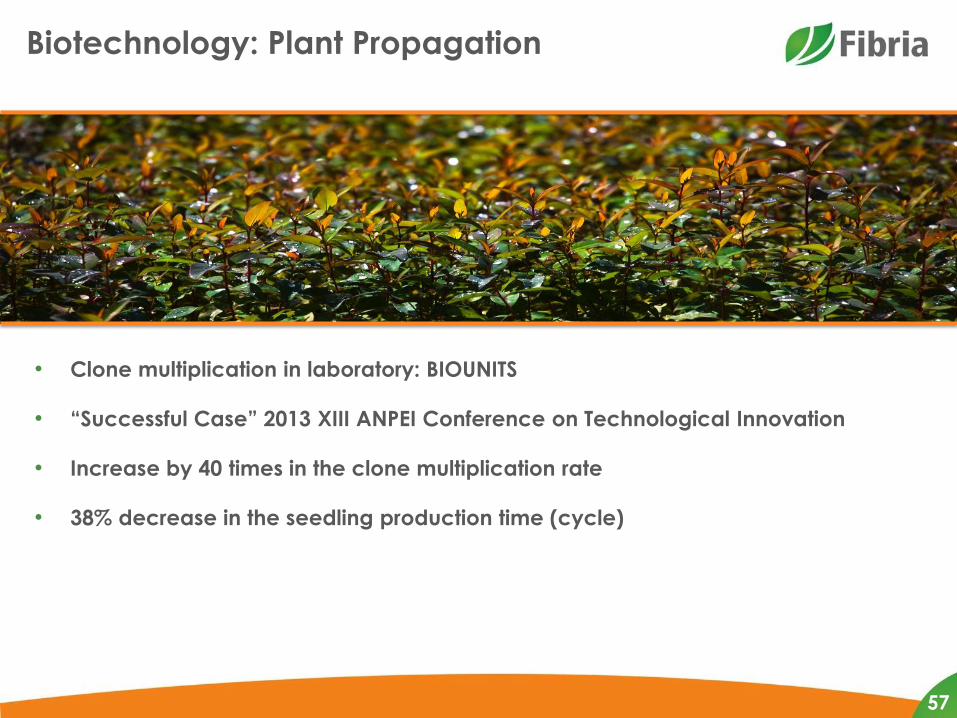
Biotechnology: Plant Propagation
• Clone multiplication in laboratory: BIOUNITS
• “Successful Case” 2013 XIII ANPEI Conference on Technological Innovation
• Increase by 40 times in the clone multiplication rate
• 38% decrease in the seedling production time (cycle)
57
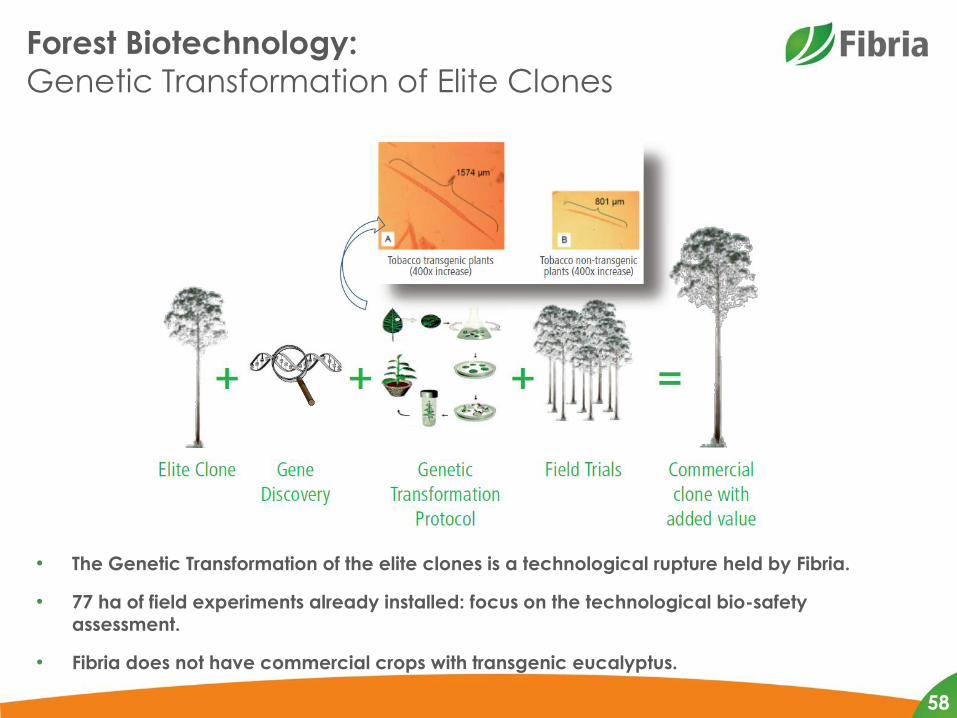
Forest Biotechnology:
Genetic Transformation of Elite Clones
• The Genetic Transformation of the elite clones is a technological rupture held by Fibria.
• 77 ha of field experiments already installed: focus on the technological bio-safety assessment.
• Fibria does not have commercial crops with transgenic eucalyptus.
58
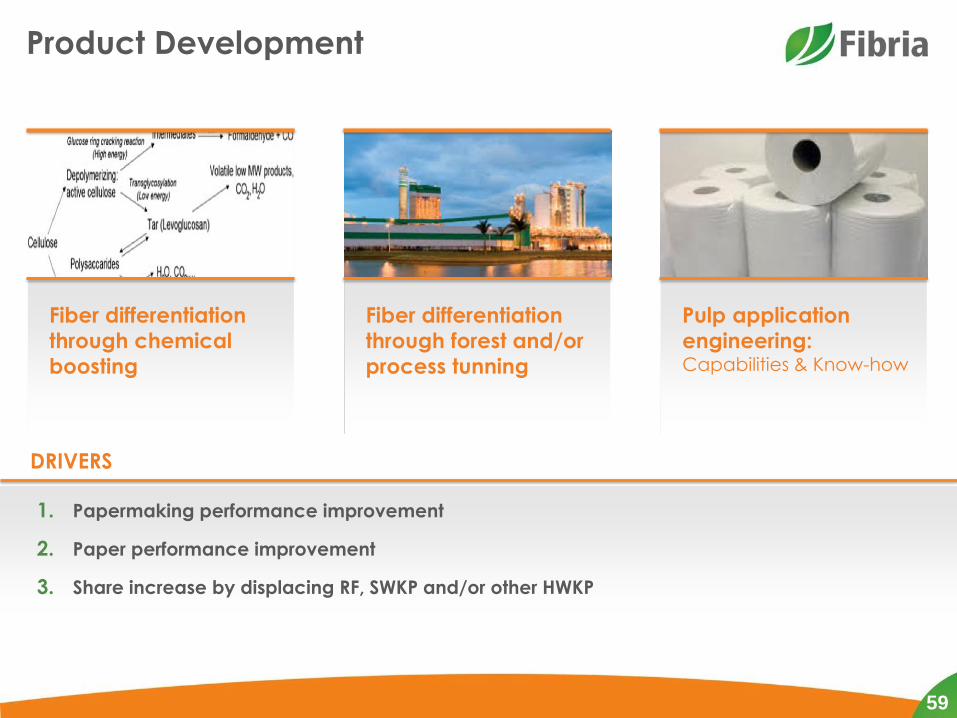
Product Development
59
Fiber differentiation
through chemical
boosting
Fiber differentiation
through forest and/or
process tunning
Pulp application
engineering: Capabilities & Know-how
DRIVERS
1. Papermaking performance improvement
2. Paper performance improvement
3. Share increase by displacing RF, SWKP and/or other HWKP
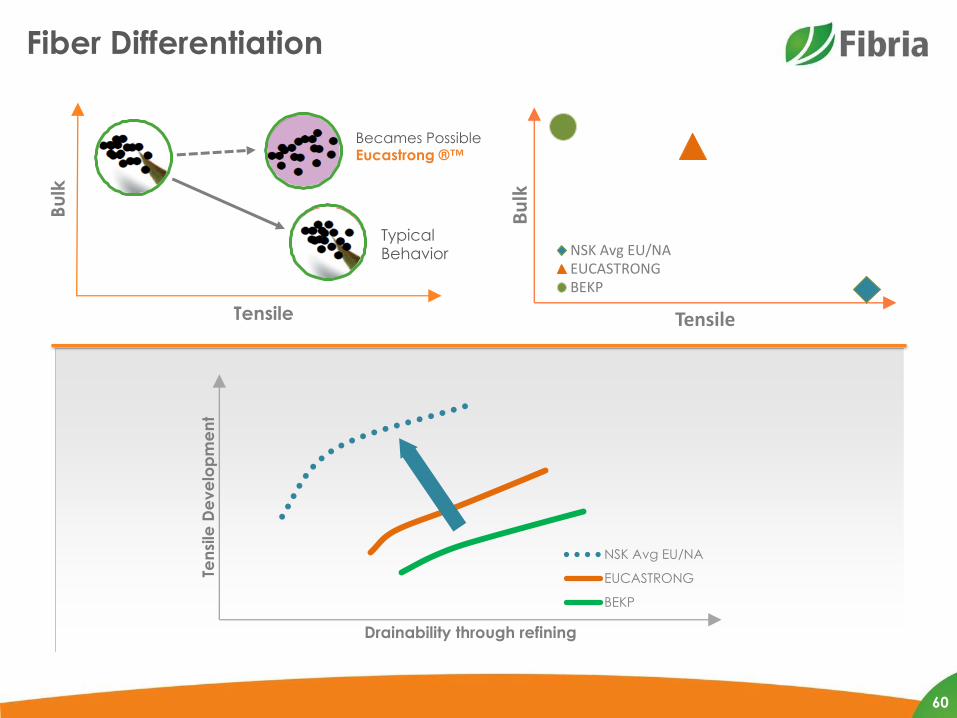
Fiber Differentiation
60
Ten
sile
De
ve
lop
me
nt
Drainability through refining
NSK Avg EU/NA
EUCASTRONG
BEKP
Bu
lk
Tensile
NSK Avg EU/NAEUCASTRONGBEKP
Bu
lk
Tensile
Becames Possible Eucastrong ®™
Typical Behavior
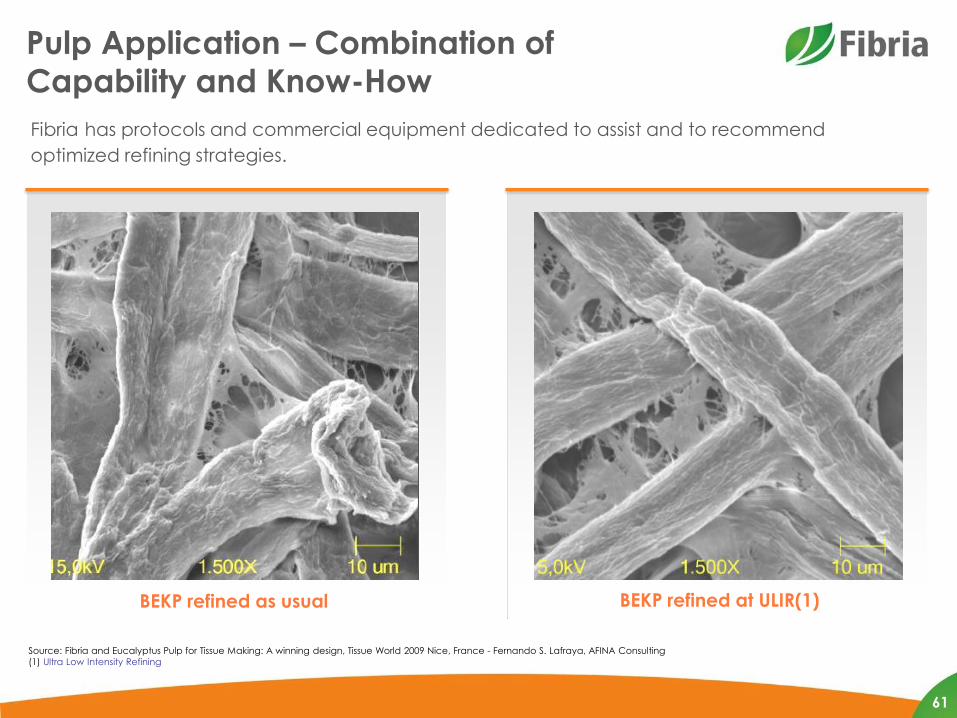
BEKP refined as usual
Pulp Application – Combination of
Capability and Know-How
61
Fibria has protocols and commercial equipment dedicated to assist and to recommend
optimized refining strategies.
BEKP refined at ULIR(1)
Source: Fibria and Eucalyptus Pulp for Tissue Making: A winning design, Tissue World 2009 Nice, France - Fernando S. Lafraya, AFINA Consulting
(1) Ultra Low Intensity Refining
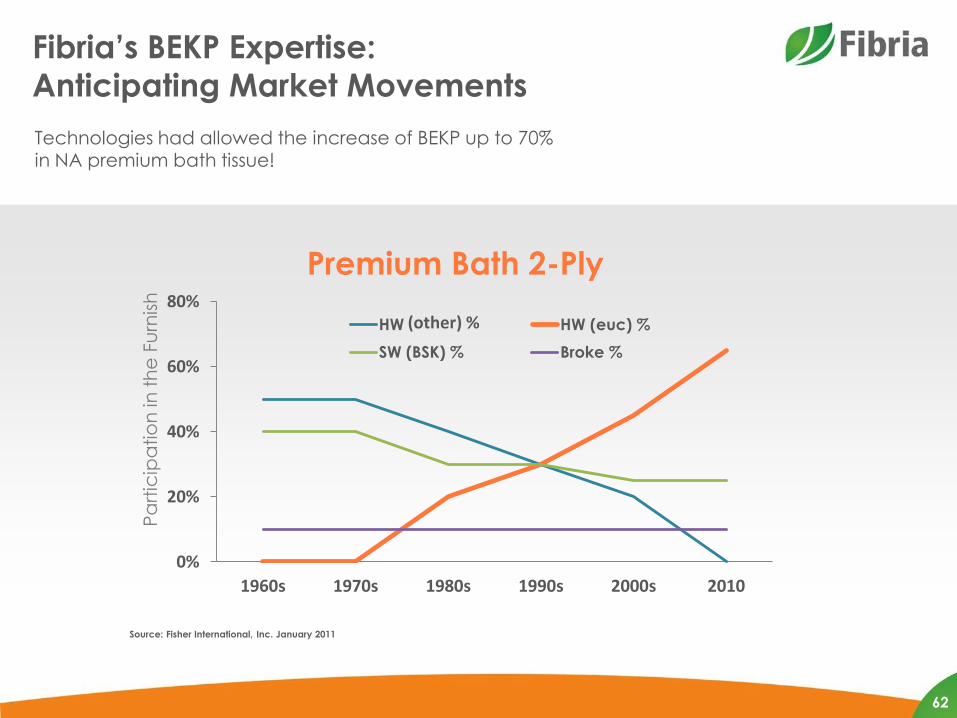
Fibria’s BEKP Expertise:
Anticipating Market Movements
62
Technologies had allowed the increase of BEKP up to 70% in NA premium bath tissue!
0%
20%
40%
60%
80%
1960s 1970s 1980s 1990s 2000s 2010
Pa
rtic
ipa
tio
n in
th
e F
urn
ish
Premium Bath 2-Ply
HW HW (euc) %
SW (BSK) % Broke %
Source: Fisher International, Inc. January 2011
(other) %
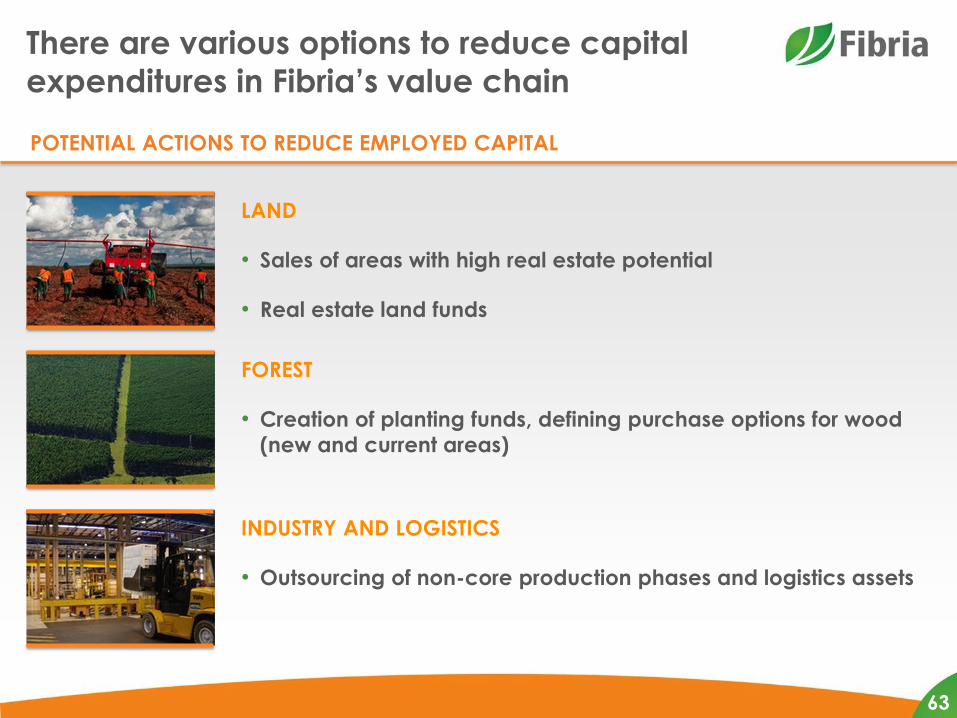
There are various options to reduce capital
expenditures in Fibria’s value chain
POTENTIAL ACTIONS TO REDUCE EMPLOYED CAPITAL
LAND
• Sales of areas with high real estate potential
• Real estate land funds
FOREST
• Creation of planting funds, defining purchase options for wood
(new and current areas)
INDUSTRY AND LOGISTICS
• Outsourcing of non-core production phases and logistics assets
63
Growth initiatives may take place through organic
expansion or consolidation
• Value drivers to improve on the current situation
• Growth Initiative
– Organic Expansion
– Consolidation
• Complementary actions in the Value Chain
64
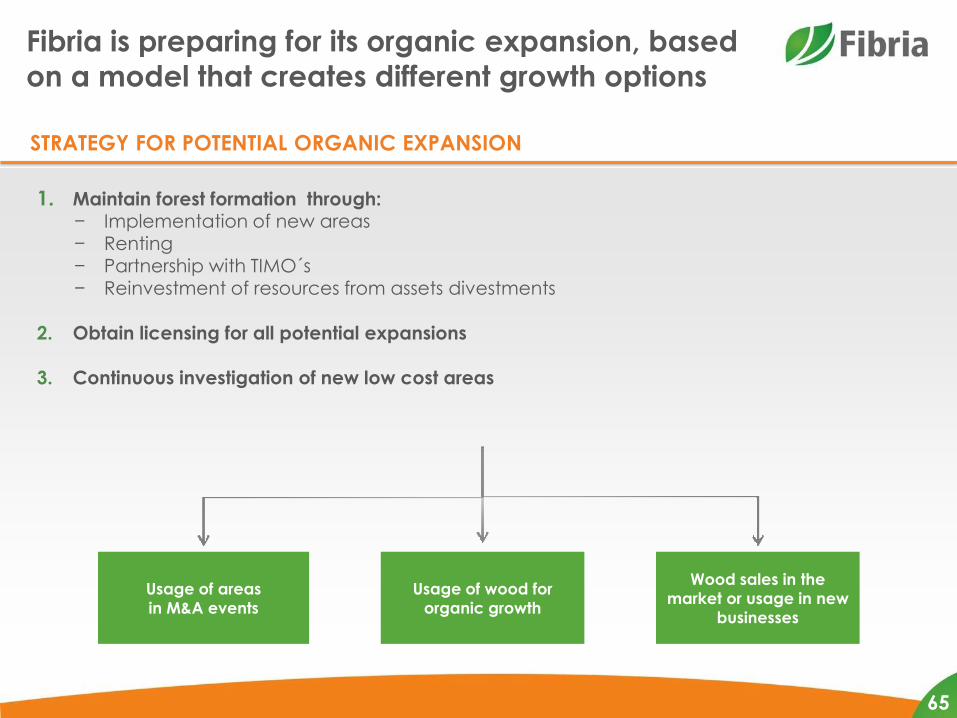
Fibria is preparing for its organic expansion, based
on a model that creates different growth options
STRATEGY FOR POTENTIAL ORGANIC EXPANSION
1. Maintain forest formation through: − Implementation of new areas − Renting − Partnership with TIMO´s − Reinvestment of resources from assets divestments
2. Obtain licensing for all potential expansions
3. Continuous investigation of new low cost areas
Usage of wood for
organic growth
Wood sales in the
market or usage in new
businesses
Usage of areas
in M&A events
65
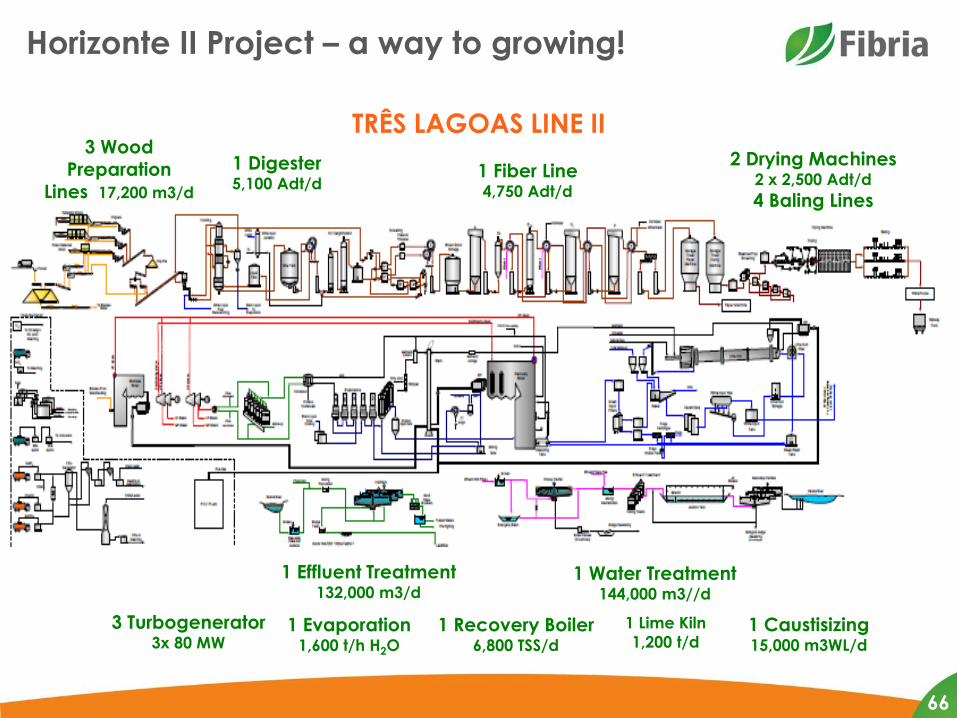
Horizonte II Project – a way to growing!
3 Wood
Preparation Lines 17,200 m3/d
1 Digester 5,100 Adt/d
1 Fiber Line 4,750 Adt/d
2 Drying Machines 2 x 2,500 Adt/d
4 Baling Lines
TRÊS LAGOAS LINE II
1 Effluent Treatment 132,000 m3/d
1 Water Treatment 144,000 m3//d
1 Recovery Boiler 6,800 TSS/d
3 Turbogenerator 3x 80 MW
1 Lime Kiln
1,200 t/d 1 Evaporation
1,600 t/h H2O
1 Caustisizing 15,000 m3WL/d
66
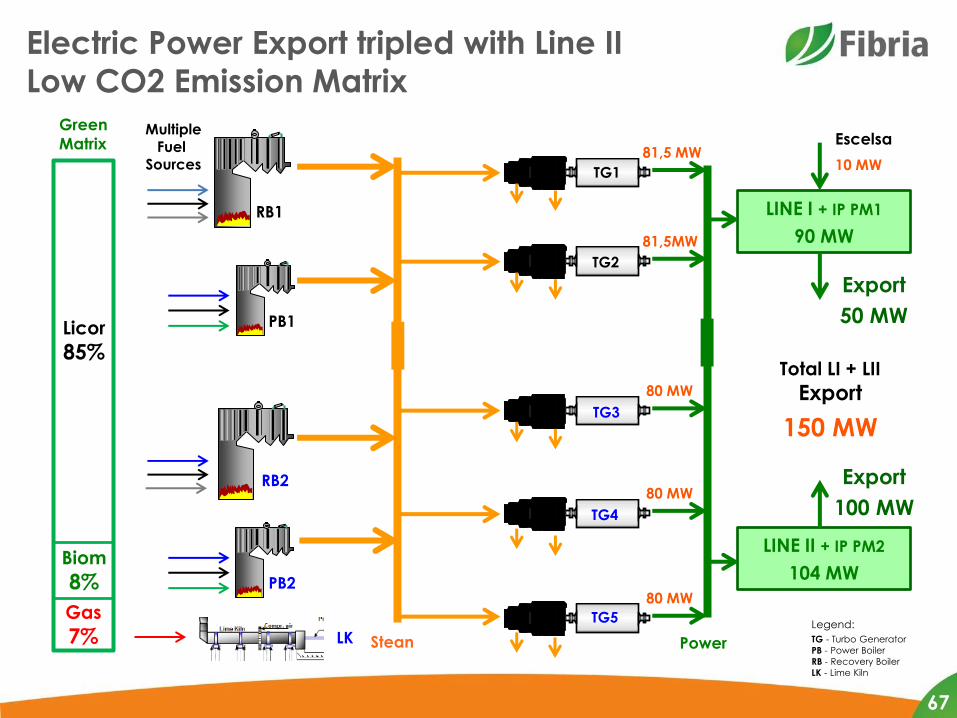
Electric Power Export tripled with Line II
Low CO2 Emission Matrix
LINE I + IP PM1
90 MW
RB1
RB2
PB1
PB2
TG1
TG2
TG3
TG4
TG5
81,5 MW
81,5MW
80 MW
80 MW
80 MW
Escelsa
Export
50 MW
Green
Matrix Multiple
Fuel Sources
Licor
85%
Gas
7%
Biom
8%
Total LI + LII
Export
150 MW
10 MW
LINE II + IP PM2
104 MW
Export
100 MW
LK Legend:
TG - Turbo Generator
PB - Power Boiler
RB - Recovery Boiler
LK - Lime Kiln
Stean Power
67
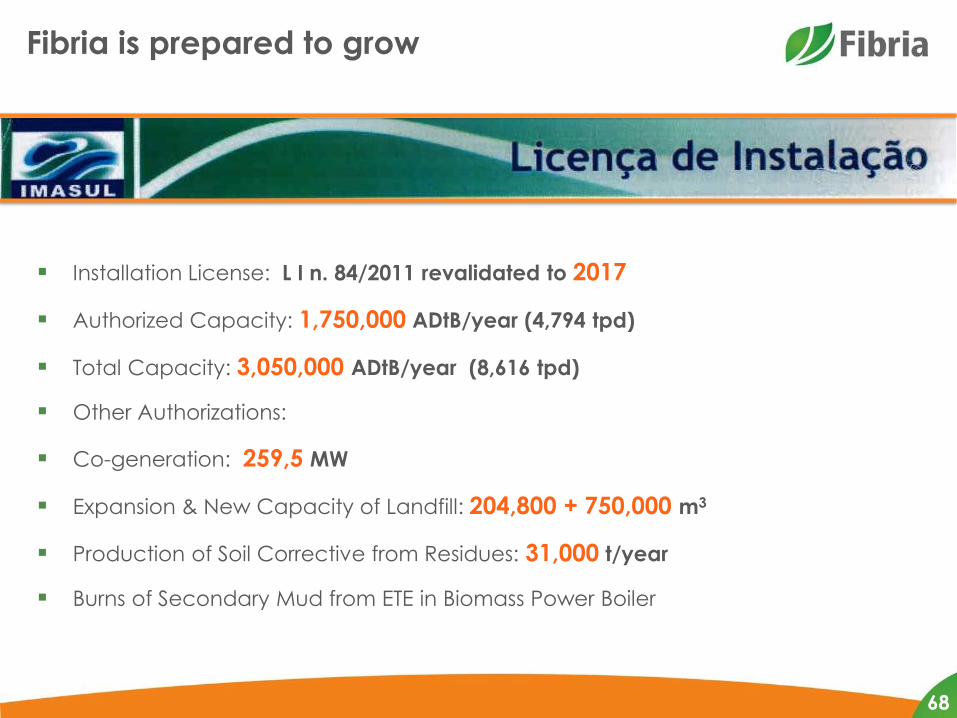
Fibria is prepared to grow
Installation License: L I n. 84/2011 revalidated to 2017
Authorized Capacity: 1,750,000 ADtB/year (4,794 tpd)
Total Capacity: 3,050,000 ADtB/year (8,616 tpd)
Other Authorizations:
Co-generation: 259,5 MW
Expansion & New Capacity of Landfill: 204,800 + 750,000 m3
Production of Soil Corrective from Residues: 31,000 t/year
Burns of Secondary Mud from ETE in Biomass Power Boiler
68
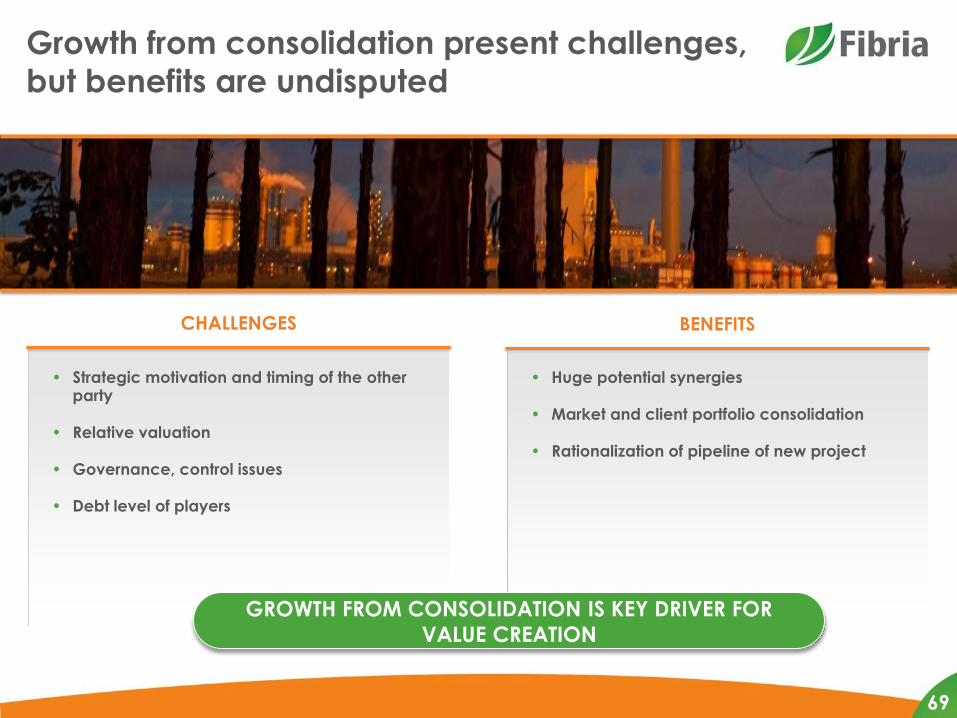
Growth from consolidation present challenges,
but benefits are undisputed
CHALLENGES
• Strategic motivation and timing of the other party
• Relative valuation
• Governance, control issues
• Debt level of players
BENEFITS
• Huge potential synergies
• Market and client portfolio consolidation
• Rationalization of pipeline of new project
GROWTH FROM CONSOLIDATION IS KEY DRIVER FOR
VALUE CREATION
69
Complementary actions include assessing
opportunities in biotechnology and in the logistics
chain
• Value drivers to improve on the current situation
• Growth Initiatives
• Complementary actions in the value chain
– Opportunities in the Bio-market
– Actions in the Logistics Chain
70
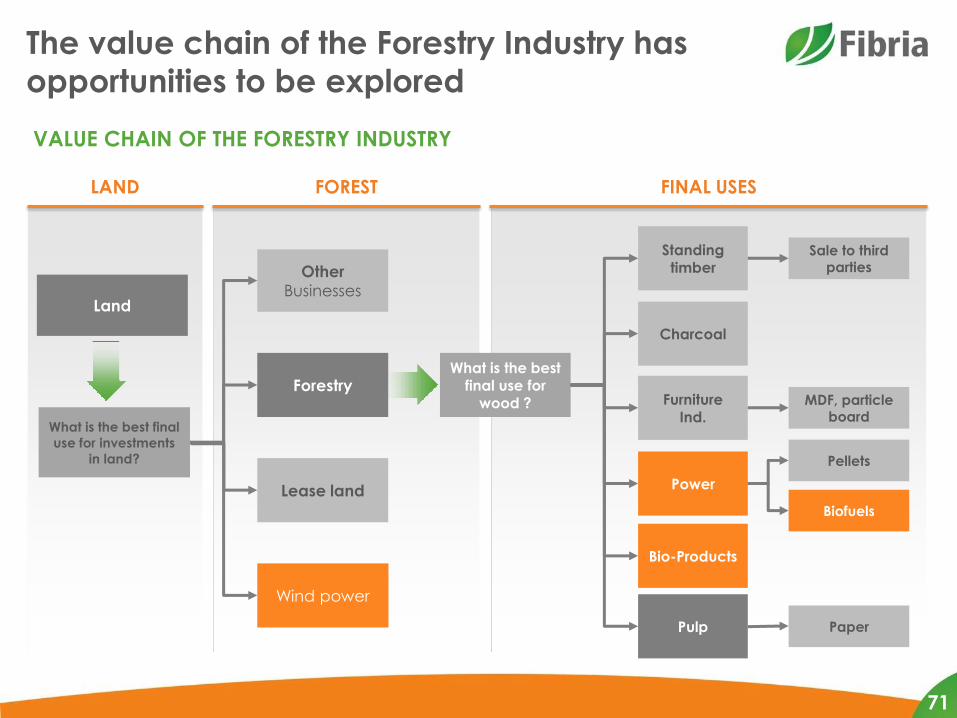
LAND
The value chain of the Forestry Industry has
opportunities to be explored
VALUE CHAIN OF THE FORESTRY INDUSTRY
FOREST FINAL USES
Land
What is the best final
use for investments
in land?
What is the best final use for
wood ? Furniture Ind.
Charcoal
Pulp
Standing timber
Power
MDF, particle board
Pellets
Biofuels
Other
Businesses
Sale to third parties
Bio-Products
Paper
Lease land
Wind power
Forestry
71
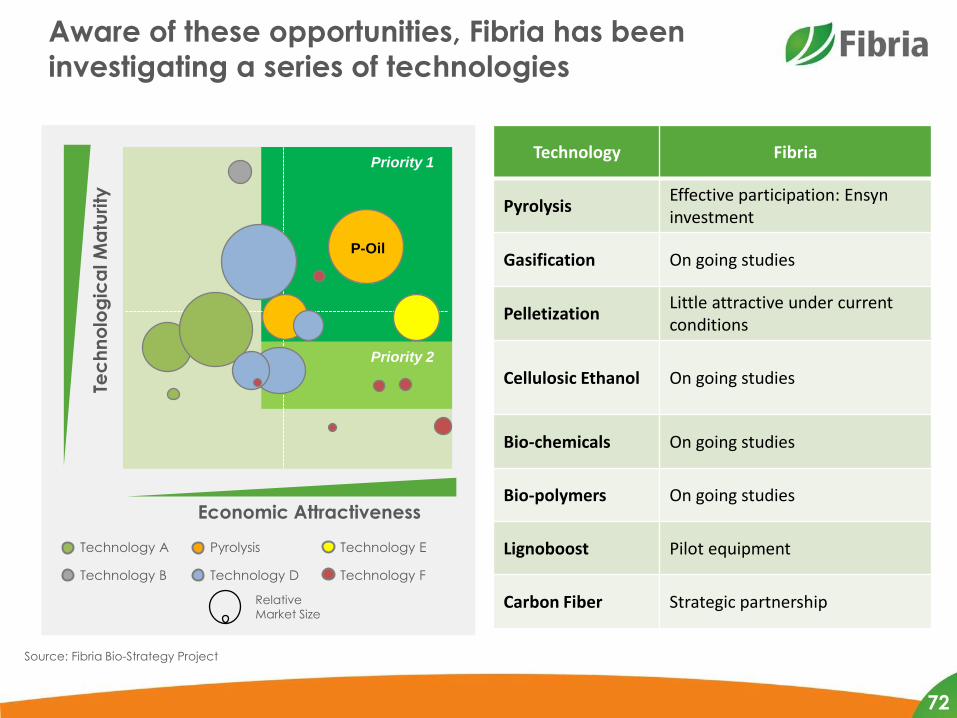
Aware of these opportunities, Fibria has been
investigating a series of technologies Te
ch
no
log
ica
l M
atu
rity
Economic Attractiveness
Technology A
Technology B
Technology E
Technology F
Pyrolysis
Technology D
Priority 1
P-Oil
Priority 2
Relative
Market Size
Source: Fibria Bio-Strategy Project
Economic Attractiveness
Technology Fibria
Pyrolysis Effective participation: Ensyn investment
Gasification On going studies
Pelletization Little attractive under current conditions
Cellulosic Ethanol On going studies
Bio-chemicals On going studies
Bio-polymers On going studies
Lignoboost Pilot equipment
Carbon Fiber Strategic partnership
72
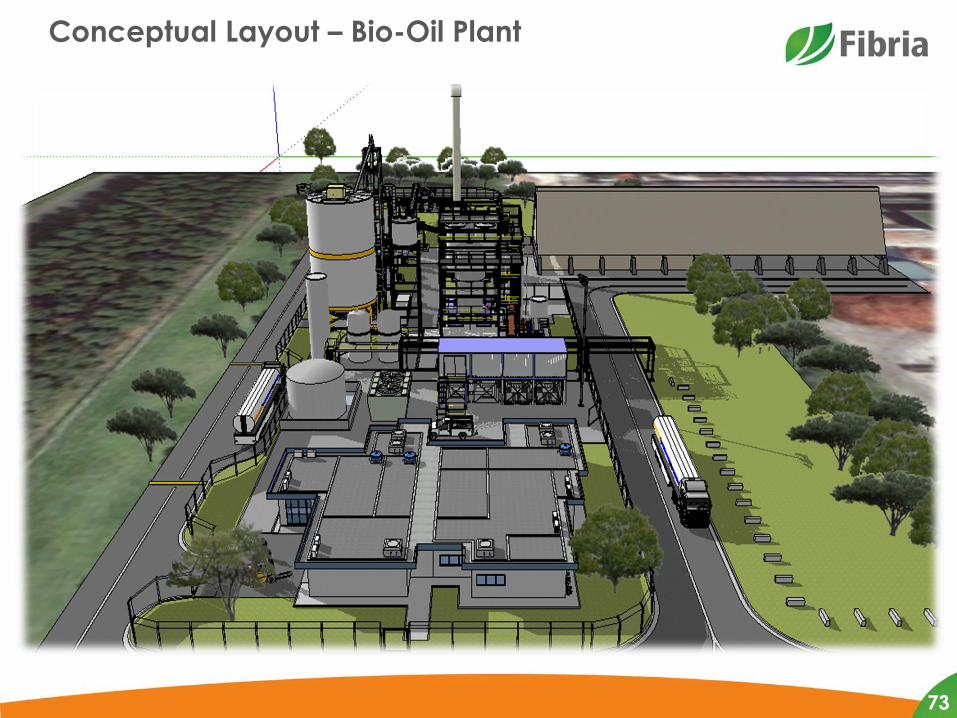
73
Conceptual Layout – Bio-Oil Plant
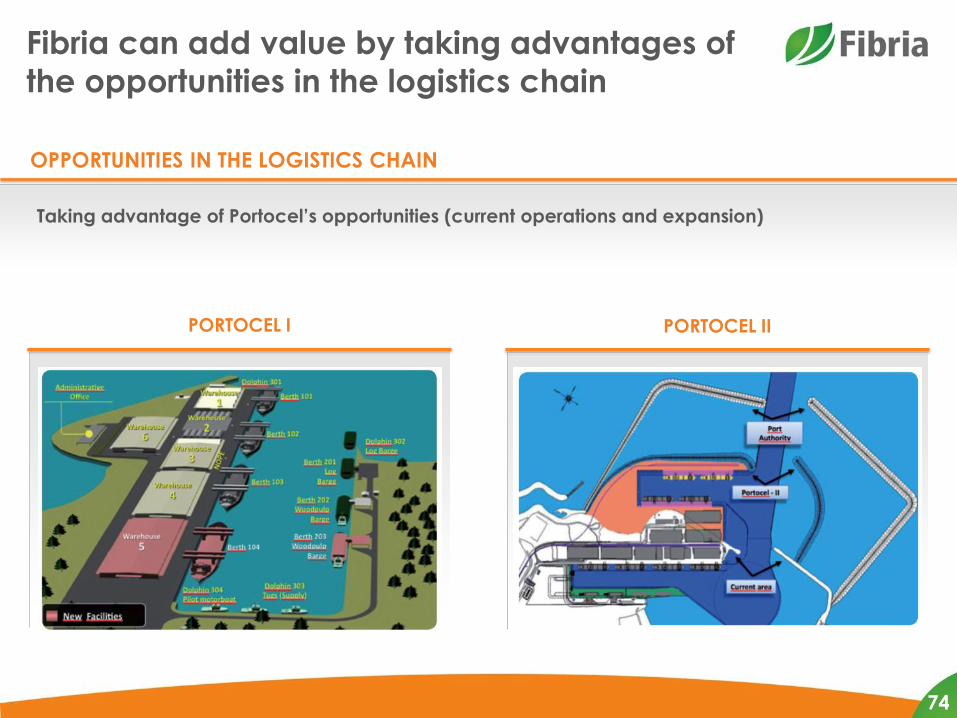
Fibria can add value by taking advantages of
the opportunities in the logistics chain
OPPORTUNITIES IN THE LOGISTICS CHAIN
Taking advantage of Portocel’s opportunities (current operations and expansion)
PORTOCEL I PORTOCEL II
74
RJ SP
BA
ES MG
GO
MT
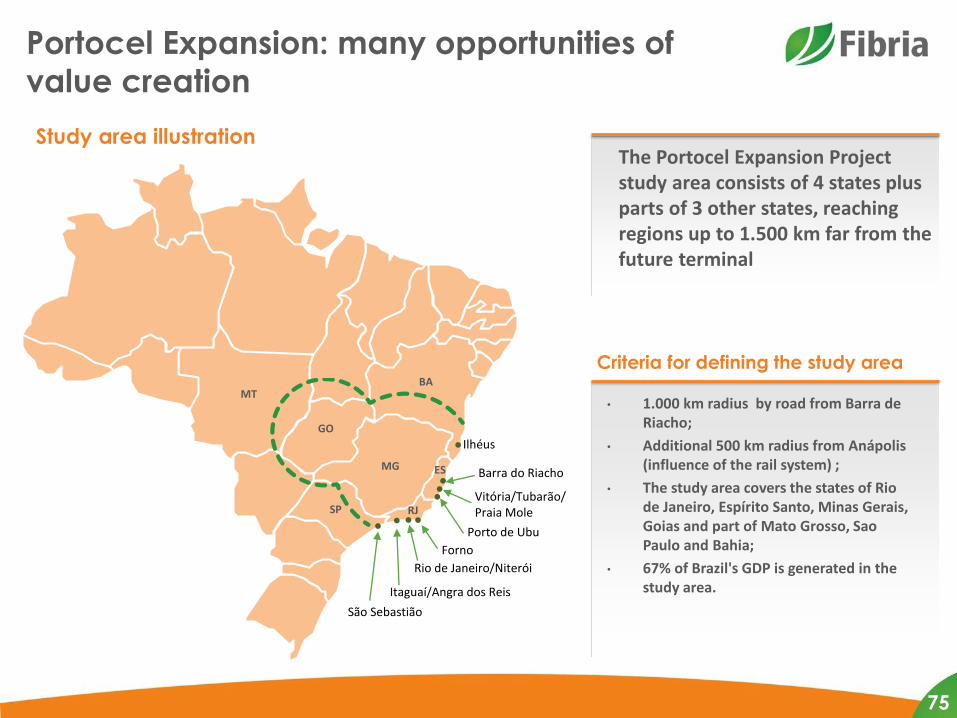
Study area illustration
Portocel Expansion: many opportunities of
value creation
Rio de Janeiro/Niterói
Itaguaí/Angra dos Reis
Vitória/Tubarão/ Praia Mole
São Sebastião
Forno
Ilhéus
Barra do Riacho
Porto de Ubu
The Portocel Expansion Project study area consists of 4 states plus parts of 3 other states, reaching regions up to 1.500 km far from the future terminal
Criteria for defining the study area
• 1.000 km radius by road from Barra de Riacho;
• Additional 500 km radius from Anápolis (influence of the rail system) ;
• The study area covers the states of Rio de Janeiro, Espírito Santo, Minas Gerais, Goias and part of Mato Grosso, Sao Paulo and Bahia;
• 67% of Brazil's GDP is generated in the study area.
75
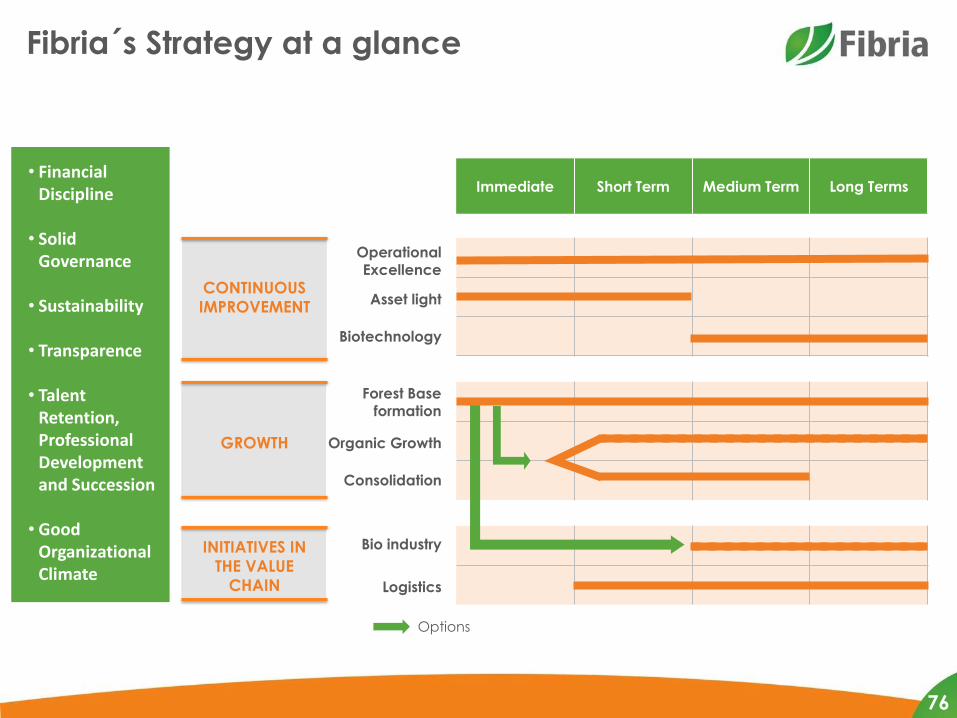
CONTINUOUS
IMPROVEMENT
Immediate Short Term Medium Term Long Terms
-
Fibria´s Strategy at a glance
Options
Operational Excellence
Asset light
Biotechnology
GROWTH
INITIATIVES IN
THE VALUE
CHAIN
Forest Base formation
Organic Growth
Consolidation
Bio industry
Logistics
• Financial Discipline
• Solid Governance
• Sustainability
• Transparence
• Talent Retention, Professional Development and Succession
• Good Organizational Climate
76