apresentação do powerpoint - ri.multiplan.com.brri.multiplan.com.br/ptb/2025/discussion...
TRANSCRIPT

May 2018
Discussion MaterialMay, 2018

May 2018
This presentation is only indicative of the Company's intention to develop the mentioned projects. The images presented are
merely illustrative, and the projects could be modified in whole or in part, at Multiplan's discretion. Many factors and
assumptions that establish the feasibility of these projects are not in the control or expectation of the Company. The
reader/investor should not rely solely on the information herein to make decisions with respect to trading the securities issued
by Multiplan.
The document may also contain prospective statements, which are subject to risks and uncertainties as they are based on
expectations of the company’s management and on available information. The company is under no obligation to update these
statements.
The Company’s future financial situation, operating results, market share and competitive position may differ substantially from
those expressed or suggested by forward-looking statements. Many factors and values that may impact these results are
beyond the company’s ability to control. Future projects could differ materially due to market conditions, changes in laws or
government policies, changes in operational conditions and costs, changes in project schedules, operating performance,
demands by tenants and consumers, commercial negotiations or other technical and economic factors. These projects may be
altered in part or totally by the company with no prior warning.
For more detailed information, please check our Financial Statements, Reference Form (Formulário de Referência) and other
relevant information on our investor relations website ir.multiplan.com.br.
Disclaimer
May, 2018

May 2018
Growth

May 2018
Future GrowthOctober, 2017
4
Multiplan's GLA growth over the years ('000 sq.m)
A seasoned Company with a proven tack record...
...in spite of the storm
May 2018
Future GrowthOctober, 2017
5
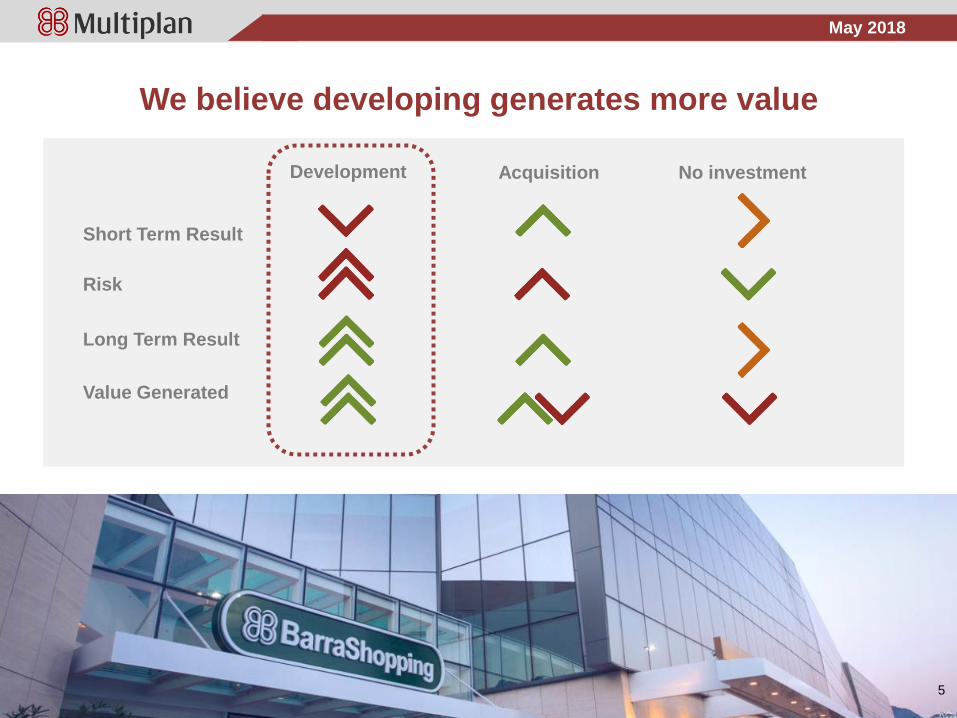
We believe developing generates more value
Short Term Result
Risk
Long Term Result
Value Generated
Development Acquisition No investment
May 2018
6
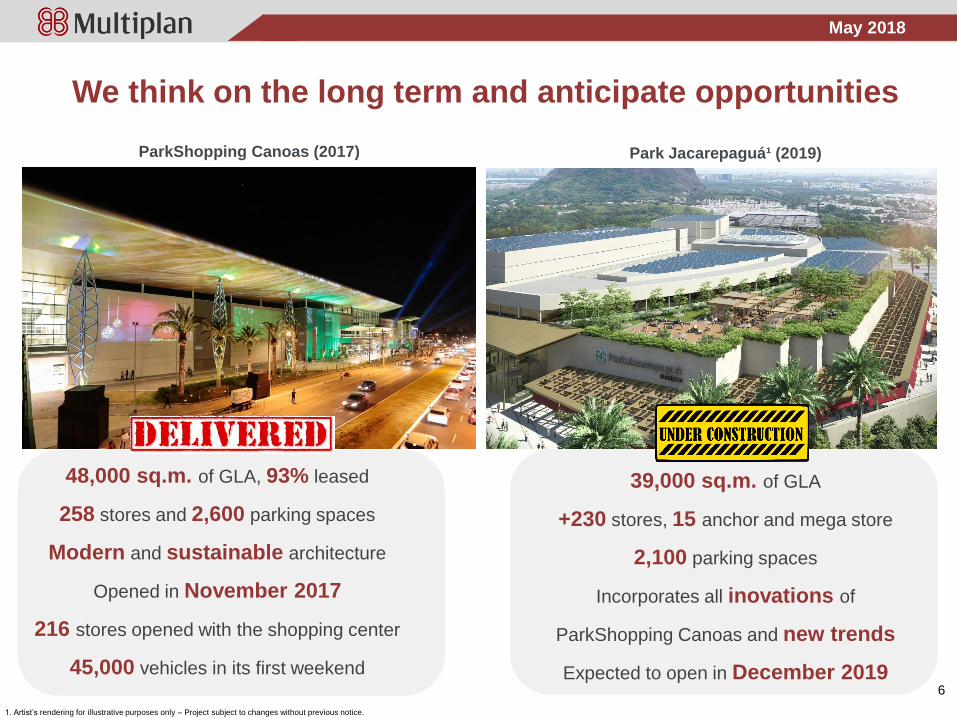
We think on the long term and anticipate opportunities
1. Artist’s rendering for illustrative purposes only – Project subject to changes without previous notice.
ParkShopping Canoas (2017)
48,000 sq.m. of GLA, 93% leased
258 stores and 2,600 parking spaces
Modern and sustainable architecture
Opened in November 2017
216 stores opened with the shopping center
45,000 vehicles in its first weekend
39,000 sq.m. of GLA
+230 stores, 15 anchor and mega store
2,100 parking spaces
Incorporates all inovations of
ParkShopping Canoas and new trends
Expected to open in December 2019
Park Jacarepaguá¹ (2019)
May 2018
7
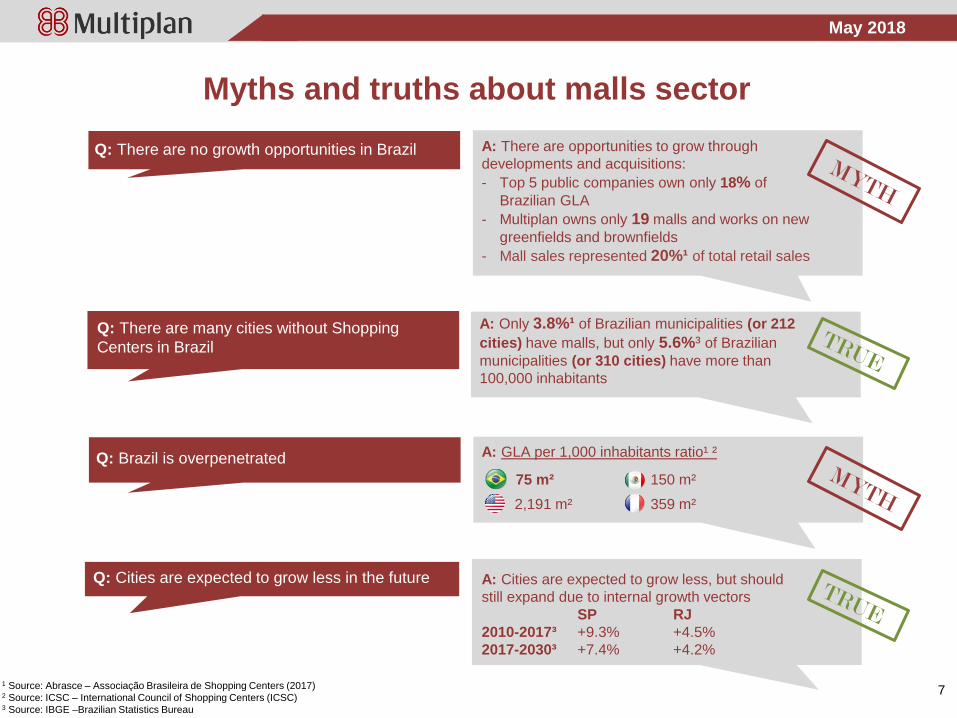
Q: There are many cities without Shopping
Centers in Brazil
Q: There is potential for building a Shopping
Center in every city
A: Only 3.8%¹ of Brazilian municipalities (or 212
cities) have malls, but only 5.6%³ of Brazilian
municipalities (or 310 cities) have more than
100,000 inhabitants
Q: Brazil is overpenetrated
Q: There are no growth opportunities in Brazil
A: GLA per 1,000 inhabitants ratio¹ ²
75 m²
2,191 m² 359 m²
150 m²
1 Source: Abrasce – Associação Brasileira de Shopping Centers (2017)2 Source: ICSC – International Council of Shopping Centers (ICSC)3 Source: IBGE –Brazilian Statistics Bureau
Myths and truths about malls sector
A: There are opportunities to grow through
developments and acquisitions:
- Top 5 public companies own only 18% of
Brazilian GLA
- Multiplan owns only 19 malls and works on new
greenfields and brownfields
- Mall sales represented 20%¹ of total retail sales
Q: Cities are expected to grow less in the future A: Cities are expected to grow less, but should
still expand due to internal growth vectors
SP RJ
2010-2017³ +9.3% +4.5%
2017-2030³ +7.4% +4.2%

May 2018
Location, Location, Location + Quality, Quality, Quality
Source: Multiplan, Abrasce and IBGE
0.2%
3.2%
8.7%
Multiplan vs Brazil average (2017)
84%
64%
GDP per capita (Exposure to States)
R$25,814
R$19,901
Exposure to A/B classes
Average GLA by mall
Total sales (R$/sq.m.)
Multiplan’s share in Brazil (2017)
Number of
municipalities
Number of
malls
GLA (sq.m.)
Shopping
center
sales (R$)
5,570 cities
571 malls
R$167.7 billion
11 cities
19 malls
R$14.7 billion
8
43.851 m²
27,285 m²
20.439 R$/m²
10.764 R$/m²
5.3%15,580,379 m²
833,165 m²

May 2018
E-commerce
May 2018
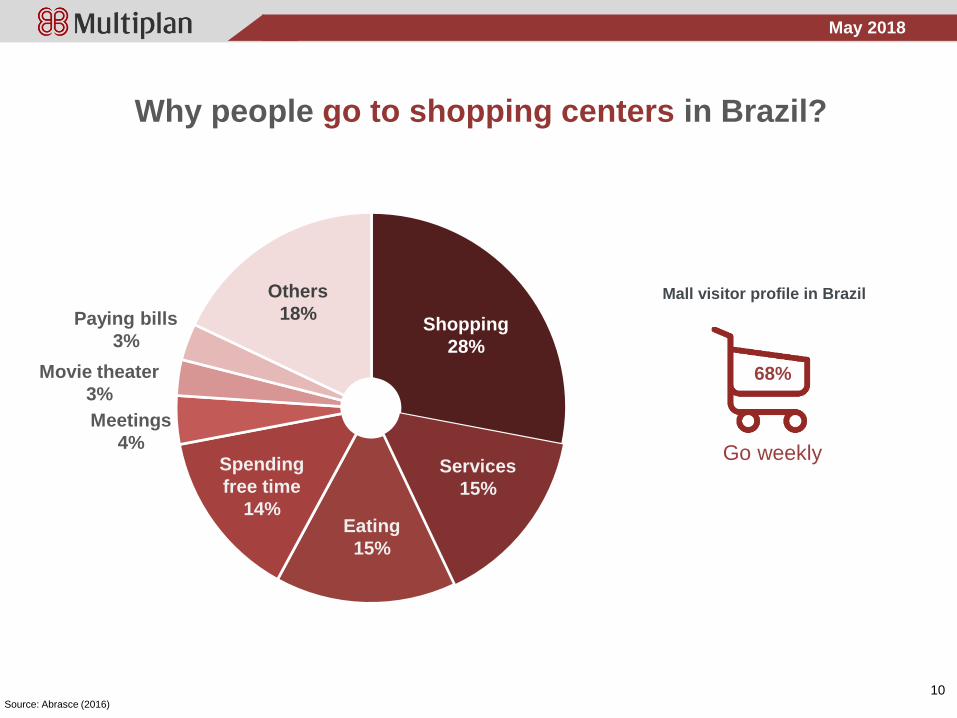
Why people go to shopping centers in Brazil?
Source: Abrasce (2016)
Shopping
28%
Others
18%
Meetings
4%
Movie theater
3%
Paying bills
3%
Eating
15%
Services
15%
Spending
free time
14%
68%
Go weekly
Mall visitor profile in Brazil
10

May 2018
E-commerce In-storeExperience, “touch and feel”
Fill an immediate need or desire
Provide a “one-stop” shopping
trip
Better for expensive shipping
goods
Fresh products
People interactions
Omni-channel is
the futureOnline purchase with in-store
pickups, returns and upsale
Internet retailers expanding their
physical footprint
Shopping centers convenience
Convenience
Assortment of products
Decision-making: online reviews
Bargain hunting: find the best
possible price
Useful functions: manage
shopping lists and set up
shopping baskets over time
Innovative technologies adding value to the in-store shopping experience
“The consumer does not care where a sale is booked, but demands excelent incentivised
service at all stages of the shopping experience.”1
1 Source: ICSC – International Council of Shopping Centers (ICSC) –
Exploring New Leasing Models in a Omni-Channel World (2016)
11Source: Multiplan
Present

May 2018
We own and manage a high productive portfolio
Tenants sales: Multiplan & Brazilian malls
Tenants sales: Multiplan & USA malls
Tenants sales – USD/sq.f.³ (anchor +
satellite stores) - 2017
Tenants sales – USD/sq.f. ³
(satellite stores only) - 2017
12
1 Source: ICSC – International Council of Shopping Centers2 Source: Abrasce – Associação Brasileira de Shopping Centers.3 Source: Bloomberg. 2017 final Exchange rate of R$3.1921/ US$.
1. Location, location, location: we are well positioned inside the
largest cities;
2. Consumer experience: Food + Service segments represented
35.1% of Multiplan’s GLA, equal to Apparel;
3. Mixed-use: integrate other types of real estate with malls,
generating synergies;
4. Organic growth: 46 mall expansions delivered in 44 years;
5. Innovation: constant mix change antecipating consumers need
and trendspotting;
6. Efficiency: High productivity, low tenant concentration.
Store Segment GLA Distribution
USA (2017)¹Multiplan (2017)
467
799
USA malls¹ Multiplan'smalls
313
574
Brazilianmalls²
Multiplan'smalls
May 2018
MULT3 Valuation
May 2018
Jul-07 May-08 Mar-09 Jan-10 Oct-10 Aug-11 Jun-12 Apr-13 Feb-14 Nov-14 Sep-15 Jul-16 May-17 Mar-18
14
NOI (LTM)
Share Price
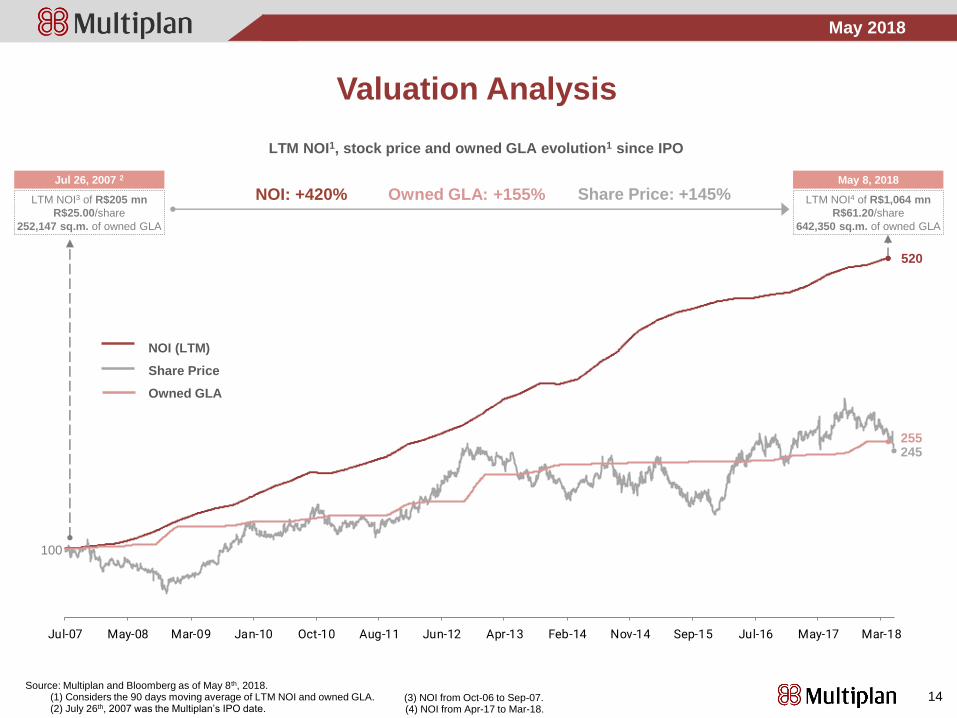
520
245
LTM NOI1, stock price and owned GLA evolution1 since IPO
100
Source: Multiplan and Bloomberg as of May 8th, 2018.(1) Considers the 90 days moving average of LTM NOI and owned GLA.(2) July 26th, 2007 was the Multiplan’s IPO date.
(3) NOI from Oct-06 to Sep-07. (4) NOI from Apr-17 to Mar-18.
255
Owned GLA
Jul 26, 2007 2
LTM NOI3 of R$205 mn
R$25.00/share
252,147 sq.m. of owned GLA
May 8, 2018
LTM NOI4 of R$1,064 mn
R$61.20/share
642,350 sq.m. of owned GLA
NOI: +420% Share Price: +145%Owned GLA: +155%
Valuation Analysis
May 2018
80
90
100
110
120
130
140
Mar-17 May-17 Jun-17 Jul-17 Sep-17 Oct-17 Nov-17 Jan-18 Feb-18 Mar-18 May-18
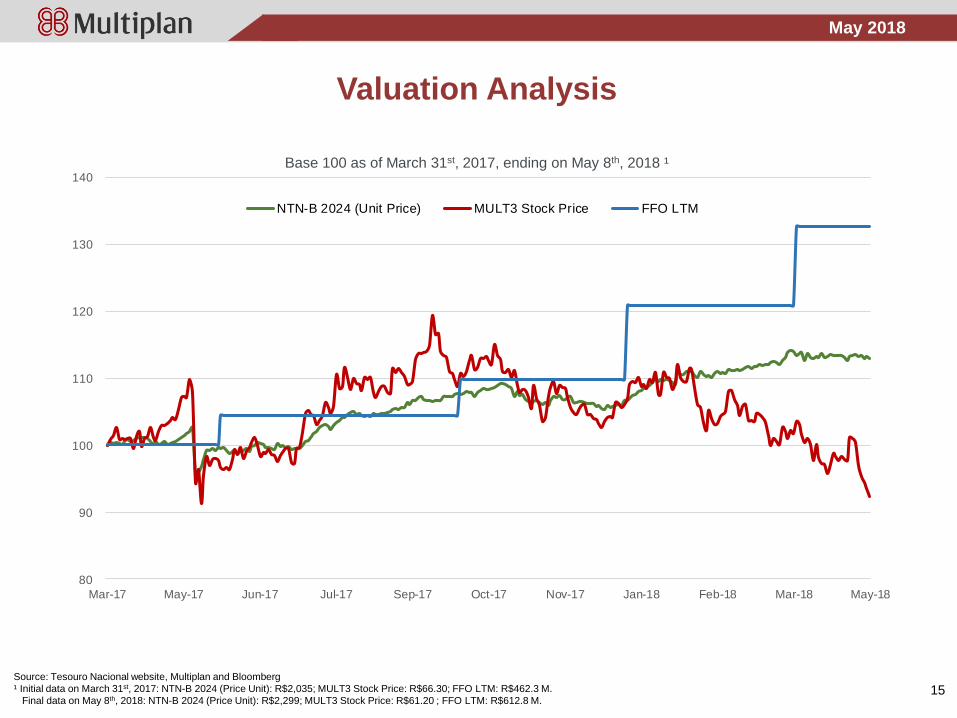
NTN-B 2024 (Unit Price) MULT3 Stock Price FFO LTM
Valuation Analysis
Base 100 as of March 31st, 2017, ending on May 8th, 2018 ¹
Source: Tesouro Nacional website, Multiplan and Bloomberg
¹ Initial data on March 31st, 2017: NTN-B 2024 (Price Unit): R$2,035; MULT3 Stock Price: R$66.30; FFO LTM: R$462.3 M.
Final data on May 8th, 2018: NTN-B 2024 (Price Unit): R$2,299; MULT3 Stock Price: R$61.20 ; FFO LTM: R$612.8 M.15

May 2018
5
6
2
4
3
2
3.5%-
4.3%
4.3%-
4.9%
5.0% 5.1%-
5.8%
5.8%-
6.5%
6.5%-
7.4%
FFO Yield
Recent (May 8, 2018)
5
11
1
3
1 1
5.3%-
6.3%
6.3%-
7.4%
7.5% 7.6%-
8.3%
8.3%-
9.3%
9.3%-
10.3%
NOI Yield
Recent(May 8, 2018)
2 2
4
7
5
2
4.1%-
4.5%
4.6% 4.7%-
5.5%
5.6%-
6.2%
6.2%-
6.8%
6.8%-
7.4%
NTN-B 2024 Yield (Gov. Bond)
Recent (May 8, 2018)
Valuation Analysis
5-year histogram of quarterly yield figures
Source: Tesouro Nacional website, Multiplan and Bloomberg
16
May 2018
1Q18 Results
May 2018
¹ Considers satellite stores sales, and the 12-month average exchange rate of R$3.2166, from April 1 2017 to March 31, 2018 (Bloomberg).
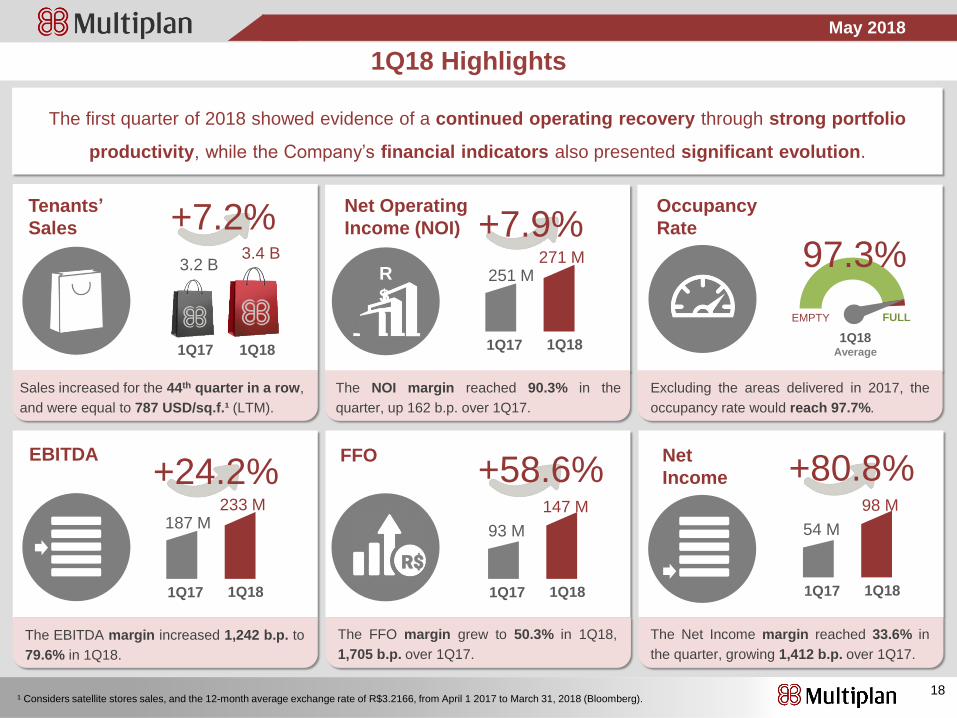
The first quarter of 2018 showed evidence of a continued operating recovery through strong portfolio
productivity, while the Company’s financial indicators also presented significant evolution.
1Q18 Highlights
97.3%
EMPTY FULL
Net Operating
Income (NOI)
EBITDA
1Q17 1Q18
Occupancy
Rate
1Q17 1Q18
233 M187 M
3.4 B3.2 B
+24.2%FFO
1Q17 1Q18
147 M
93 M
+58.6%
Tenants’
Sales +7.2%
1Q18Average
Sales increased for the 44th quarter in a row,
and were equal to 787 USD/sq.f.¹ (LTM).
The NOI margin reached 90.3% in the
quarter, up 162 b.p. over 1Q17.
Excluding the areas delivered in 2017, the
occupancy rate would reach 97.7%.
The Net Income margin reached 33.6% in
the quarter, growing 1,412 b.p. over 1Q17.
The FFO margin grew to 50.3% in 1Q18,
1,705 b.p. over 1Q17.
The EBITDA margin increased 1,242 b.p. to
79.6% in 1Q18.
R
$
1Q17 1Q18
271 M251 M
+7.9%
Net
Income
1Q17 1Q18
98 M
54 M
+80.8%
R$
18
May 2018
1Q14 1Q15 1Q16 1Q17 1Q18
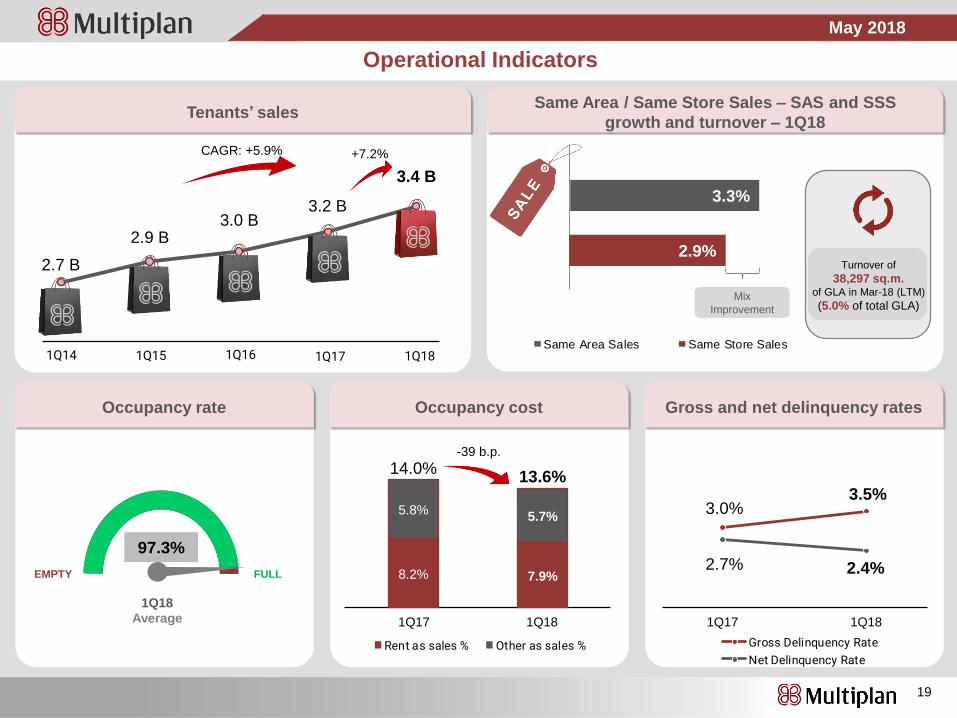
Operational Indicators
19
Mix
Improvement
3.3%
2.9%
Same Area / Same Store Sales – SAS and SSS
growth and turnover – 1Q18Tenants’ sales
Occupancy rate Gross and net delinquency ratesOccupancy cost
97.3%
EMPTY FULL 8.2% 7.9%
5.8%5.7%
14.0%13.6%
-39 b.p.
1Q181Q17
1Q151Q14 1Q16 1Q17 1Q18
+7.2%
3.4 B
3.2 B3.0 B
2.9 B
2.7 B
CAGR: +5.9%
‘Turnover of
38,297 sq.m. of GLA in Mar-18 (LTM)
(5.0% of total GLA)
2.4%
3.0% 3.0%2.8%
2.5%
0.9%
2.7%
1.3%
2.2% 1.1%
4Q16 1Q17 2Q17 3Q17 4Q17
Gross Delinquency Rate
Net Delinquency Rate
1Q18
Average
9.3%
5.7%
4.2%
5.6%
3.3%8.3%
4.3%
1.6%3.2% 2.9%
1Q14 1Q15 1Q16 1Q17 1Q18
Same Area Sales Same Store Sales
7.6% 7.5% 7.6% 7.8% 7.7% 7.6%
5.3% 5.3% 4.9% 5.3% 5.2% 5.2%
12.9% 12.7% 12.6%13.1% 12.9% 12.8%
2013 2014 2015 2016 2017 5-yearaverage
Rent as sales % Other as sales %
3.5%3.0%
2.7% 2.4%
1Q181Q17
May 2018
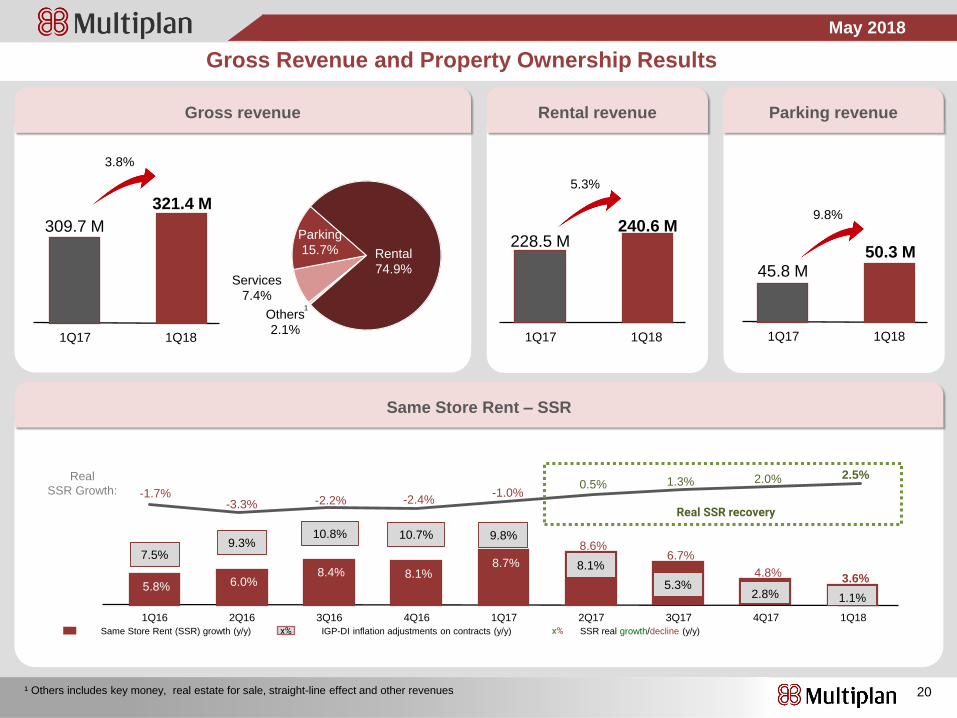
Gross Revenue and Property Ownership Results
20
Rental revenueGross revenue
Same Store Rent – SSR
1Q181Q17
309.7 M
321.4 M
3.8%
Base rent
69.1%
Overage2.5%
Merchand.5.5%
Rental
74.9%
Parking
15.7%
1Q181Q17
228.5 M240.6 M
5.3%
Others
2.1%
Services
7.4%
¹ Others includes key money, real estate for sale, straight-line effect and other revenues
1
Parking revenue
1Q181Q17
45.8 M50.3 M
9.8%
Real
SSR Growth:
5.8% 6.0%8.4% 8.1%
8.7%
8.6%
1Q16 2Q16 4Q16 1Q17 2Q173Q16
SSR real growth/decline (y/y)Same Store Rent (SSR) growth (y/y) x% IGP-DI inflation adjustments on contracts (y/y) x%
3.6%
6.7%
4.8%
-1.7%
7.5%9.3%
10.8% 10.7% 9.8%
8.1%
1.1%5.3%
2.8%
Real SSR recovery-3.3% -2.2% -2.4%
-1.0%0.5% 1.3% 2.0% 2.5%
3Q17 4Q17 1Q18

May 2018
1T17 2T17 3T17 4T17 1T18
Remuneração baseada em ações
Operating and Financial Results
21
Net Operating Income – NOI and margin
Evolution of G&A and as % of net
revenue
Shopping center expenses and as
% os shopping center revenues1
Share-based compensations and
stock price (R$)
1Q181Q17
31.0 M28.0 M
-9.7%
2016 2017
11.8%10.2%
¹ Mall rental and parking revenues.
26.1 M
(9.1 M)
1Q17 2Q17 3Q17 4Q17 1Q18
3.3 M
24.5 M
1Q181Q17
31.8 M30.5 M
-4.0%
20162017
11.4% 10.5%
707.8 M
879.6 M944.9 M 986.5 M
1,065.2 M
8.0%CAGR: +10.8%
Mar-14
(LTM)
Mar-16
(LTM)
Mar-17
(LTM)
Mar-18
(LTM)
Mar-15
(LTM)
(1.7 M)
66.30 65.32
73.33 70.9068.68
1Q181Q17
251.2 M271.0 M
7.9%
2016
2017
88.6%90.3%
84.6%88.1% 88.8%
86.8% 88.0%
26.1 M
3.3 M
24.5 M
(9.1 M)
(1.7 M)
66.3065.32
73.3370.90
68.68
1Q17 2Q17 3Q17 4Q17 1Q18
Share-based compensations Stock price
May 2018
633,646 sq.m.
723,228 sq.m.
84.6%88.0%
64.0%
73.1%
Mar-14(LTM)
Mar-15(LTM)
Mar-16(LTM)
Mar-17(LTM)
Mar-18(LTM)
Owned GLA NOI Margin EBITDA Margin
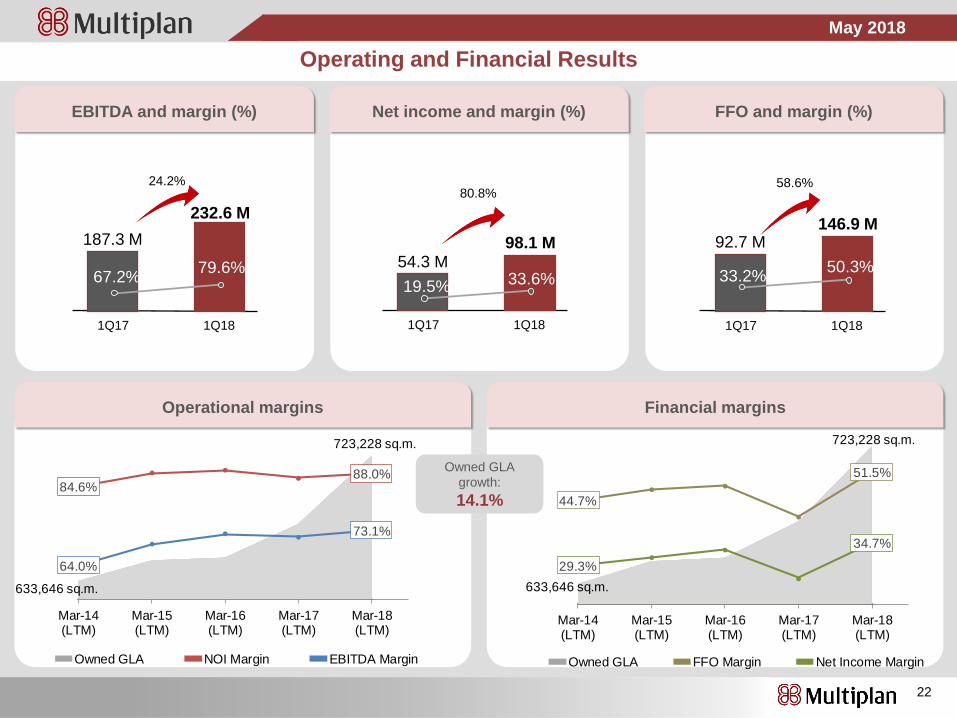
Operating and Financial Results
22
EBITDA and margin (%) FFO and margin (%)Net income and margin (%)
1Q181Q17
92.7 M146.9 M
58.6%
2016
2017
33.2%50.3%
1Q181Q17
187.3 M
232.6 M
24.2%
2016
2017
67.2%79.6%
Operational margins Financial margins
1Q181Q17
54.3 M98.1 M
80.8%
2016
2017
19.5% 33.6%
Owned GLA
growth:
14.1%
633,646 sq.m.
723,228 sq.m.
44.7%
51.5%
29.3%
34.7%
Mar-14(LTM)
Mar-15(LTM)
Mar-16(LTM)
Mar-17(LTM)
Mar-18(LTM)
Owned GLA FFO Margin Net Income Margin

May 2018
11.53% 12.29% 12.81%13.09% 13.22% 13.23% 13.50% 13.18%
12.18%10.61%
9.18%8.24%
7.79%
12.75%
13.75% 14.25% 14.25% 14.25% 14.25% 14.25% 13.75%
12.25%
10.25%
8.25%7.00% 6.50%
Mar-15 jun/15 Sep-15 Dec-15 Mar-16 Jun-16 Sep-16 Dec-16 Mar-17 Jun-17 Sep-17 Dec-17 Mar-18
Cost of Funding (gross debt) Selic Rate
CDI63.0%
TR34.9%
Others2.1%
Debt Indexes
on March 31, 2018
Lowest Covenant
4.00x
2.39x 2.40x 2.35x 2.34x 2.33x
1.00x
2.00x
3.00x
4.00x
Mar-17 Jun-17 Sep-17 Dec-17 Mar-18
Debt and Cash
23
Evolution of Net Debt to EBITDA Financial expenses and coverage ratio
Weighted average cost of funding (% p.a.)
223.0 M 231.9 M 226.9 M
199.8 M
172.7 M
3.62x 3.55x 3.62x
4.13x
5.04x
Mar-17
(LTM)
Jun-17
(LTM)
Sep-17
(LTM)
Dec-17
(LTM)
Mar-18
(LTM)
Net Financial Expenses EBITDA / Net Financial Expenses
Lowest
Covenant
2.00x

May 2018
Debt and Cash
24
Multiplan’s debt amortization schedule on March 31, 2018
776 M
613 M
294 M
394 M
504 M
437 M
413 M
421 M
120 M
89 M
26 M
26 M
26 M
26 M
26 M
7 M
Cash (Mar-18)
FFO (LTM)
2018
2019
2020
2021
2022
2023
2024
2025
2026
2027
2028
2029
2030
2031
1
1 Debt amortization schedule from Apr-18 to Dec-18.
May 2018
IR Contact
Armando d’Almeida NetoCFO and IRO
Hans MelchersInvestor Relations and Planning Director
Franco CarrionInvestor Relations Manager
Leandro VigneroInvestor Relations Analyst
Nathalia BoiseauxInvestor Relations Analyst
Tel.: +55 (21) 3031-5600
Fax: +55 (21) 3031-5322
E-mail: [email protected]
ir.multiplan.com.br