apresentação do powerpoint · franquias 124 owned stores 3 multibrands 1,304 owned stores 4...
TRANSCRIPT

2Q18

2
Results | 2Q18
ImportantDisclaimer
Information contained in this document may include forward-looking
statements and reflect Management’s current view and estimates of
the evolution of the macroeconomic environment, industry conditions,
Company’s performance and financial results. Any statements,
expectations, capabilities, plans and assumptions contained in this
document, which do not describe historical facts, such as information
about declaration of dividend payment, future direction of operations,
implementation of relevant operating and financial strategies,
investment program and factors or trends affecting the financial
condition, liquidity or results of operations, are forward-looking
statements, as set forth in the “U.S. Private Securities Litigation
Reform Act of 1995”, and involve several risks and uncertainties.
There is no guarantee that these results will occur. Forward-looking
statements are based on several factors and expectations, including
economic and market conditions, industry competitiveness and
operational factors. Any changes in such expectations and factors
may cause actual results to differ from current expectations.

3
2Q18 Highlights
Net revenue in 2Q18 reached
R$ 373.9 million, a 13.7% increase against
2Q17.
Arezzo&Co recorded a 750bps
increase in ROIC, reaching a level of
31.2%.
In 2Q18, Gross Profit totaled
R$ 178.8 million (gross margin of 47.8%), a
15.8% increase against 2Q17.
Arezzo&Co opened 11 stores and
closed 2Q18 with a growth of 8.0% in
store area in the last twelve months.
EBITDA for 2Q18 totaled
R$ 56.6 million with a net margin of 15.1%
and a 12.4% increase against 2Q17.
Net Revenue
Gross Profit
ROIC
EBITDA
Sales Area
Results | 2Q18
Same-Store-Sales growth of 3.9% in the
quarter.SSS
Excluding the non-cash effect from
exchange rate variation, net income
would have reached R$ 46.9 million,
19.4% higher than in 2Q17.
Net Income

4
Company GrowthGROSS REVENUE / DOMESTIC AND FOREIGN MARKET (R$ MILLION)
THE COMPANY REACHED A GROSS
REVENUE OF R$ 454.7 MILLION IN THE
2Q18, A 11.6% GROWTH COMPARED TO
THE 2Q17, THE HIGHLIGHT BEINIG THE
DOMESTIC MARKET WITH GROWTH OF
12.4%.
Results | 2Q18
360,3 404,9
701,0 782,1 47,0
49,7
74,7
80,2
407,3 454,7
775,7
862,4
2Q17 2Q18 1H17 1H18
Domestic Market Foreign Market
11.6%
5.7%
12.4%
11.2%
7.4%
11.6%
199,8 227,0
399,2 445,7
119,7 114,5
218,1 217,7
31,9 48,3
65,6
93,6
8,9 15,2
18,1
25,2
360,3
701,0
2Q17 2Q18 1H17 1H18
Arezzo Schutz Anacapri Other Brands
12.4%
404,9
782,1
5
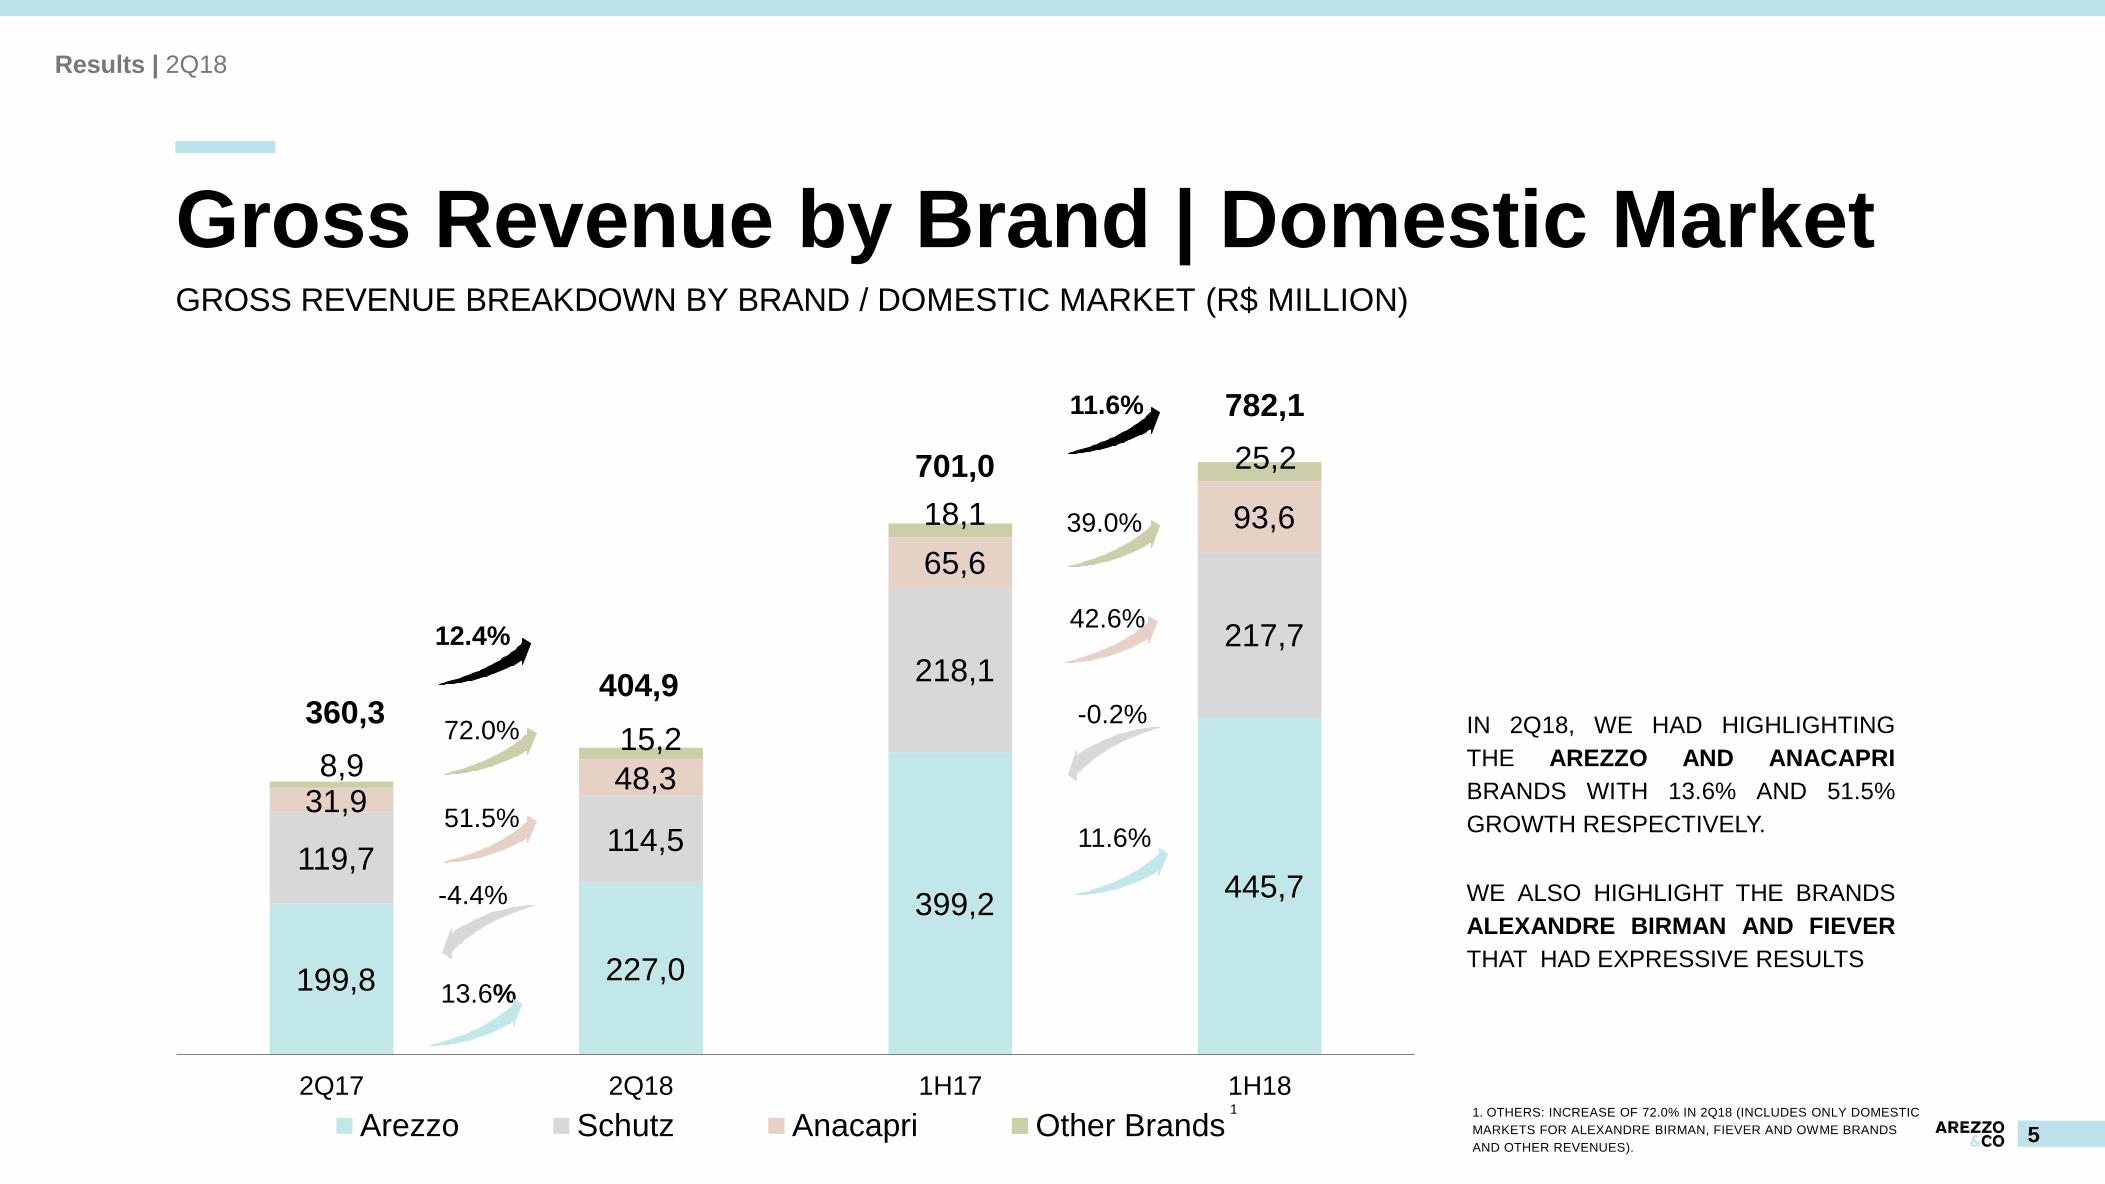
Gross Revenue by Brand | Domestic MarketGROSS REVENUE BREAKDOWN BY BRAND / DOMESTIC MARKET (R$ MILLION)
IN 2Q18, WE HAD HIGHLIGHTING
THE AREZZO AND ANACAPRI
BRANDS WITH 13.6% AND 51.5%
GROWTH RESPECTIVELY.
WE ALSO HIGHLIGHT THE BRANDS
ALEXANDRE BIRMAN AND FIEVER
THAT HAD EXPRESSIVE RESULTS
1. OTHERS: INCREASE OF 72.0% IN 2Q18 (INCLUDES ONLY DOMESTIC
MARKETS FOR ALEXANDRE BIRMAN, FIEVER AND OWME BRANDS
AND OTHER REVENUES).
Results | 2Q18
1
72.0%
51.5%
-4.4%
13.6%
11.6%
-0.2%
39.0%
42.6%
11.6%

162,9 184,8
336,1 376,2 76,7 75,0
139,3 140,9
87,6 104,2
165,6 189,9
32,5 40,7
57,8
74,1
0,6 0,3
2,2
1,1
360,3 404,9
2Q17 2Q18 1H17 1H18
Total
Other
Web Commerce
Multibrand
Owned Stores
Franchises
6
Gross Revenue by Channel | Domestic MarketGROSS REVENUE BY CHANNEL / DOMESTIC MARKET (R$ MILLION)
1. OTHERS : DECREASE OF 52.6% IN 1Q18 (INCLUDES
DOMESTIC MARKET REVENUES THAT ARE NOT SPECIFIC
FOR DISTRIBUTION CHANNELS).
Results | 2Q18
SSS SELL-IN(FRANCHISES)
SSS SELL-OUT(OWNED STORES + WEB + FRANCHISES)
1
SSS SELL-OUT(OWNED STORES + WEB + FRANCHISES)
SSS SELL-IN(FRANCHISES)
-0.8%
6.8%
7.3%
3.9%
6.2% 5.4%
4.9% 5.9%
18.9%
28.3%
14.7%
1.1%
11.9%
701,0
12.4%
11.6% 782,1
-2.3%
25.5%
13.5%
7
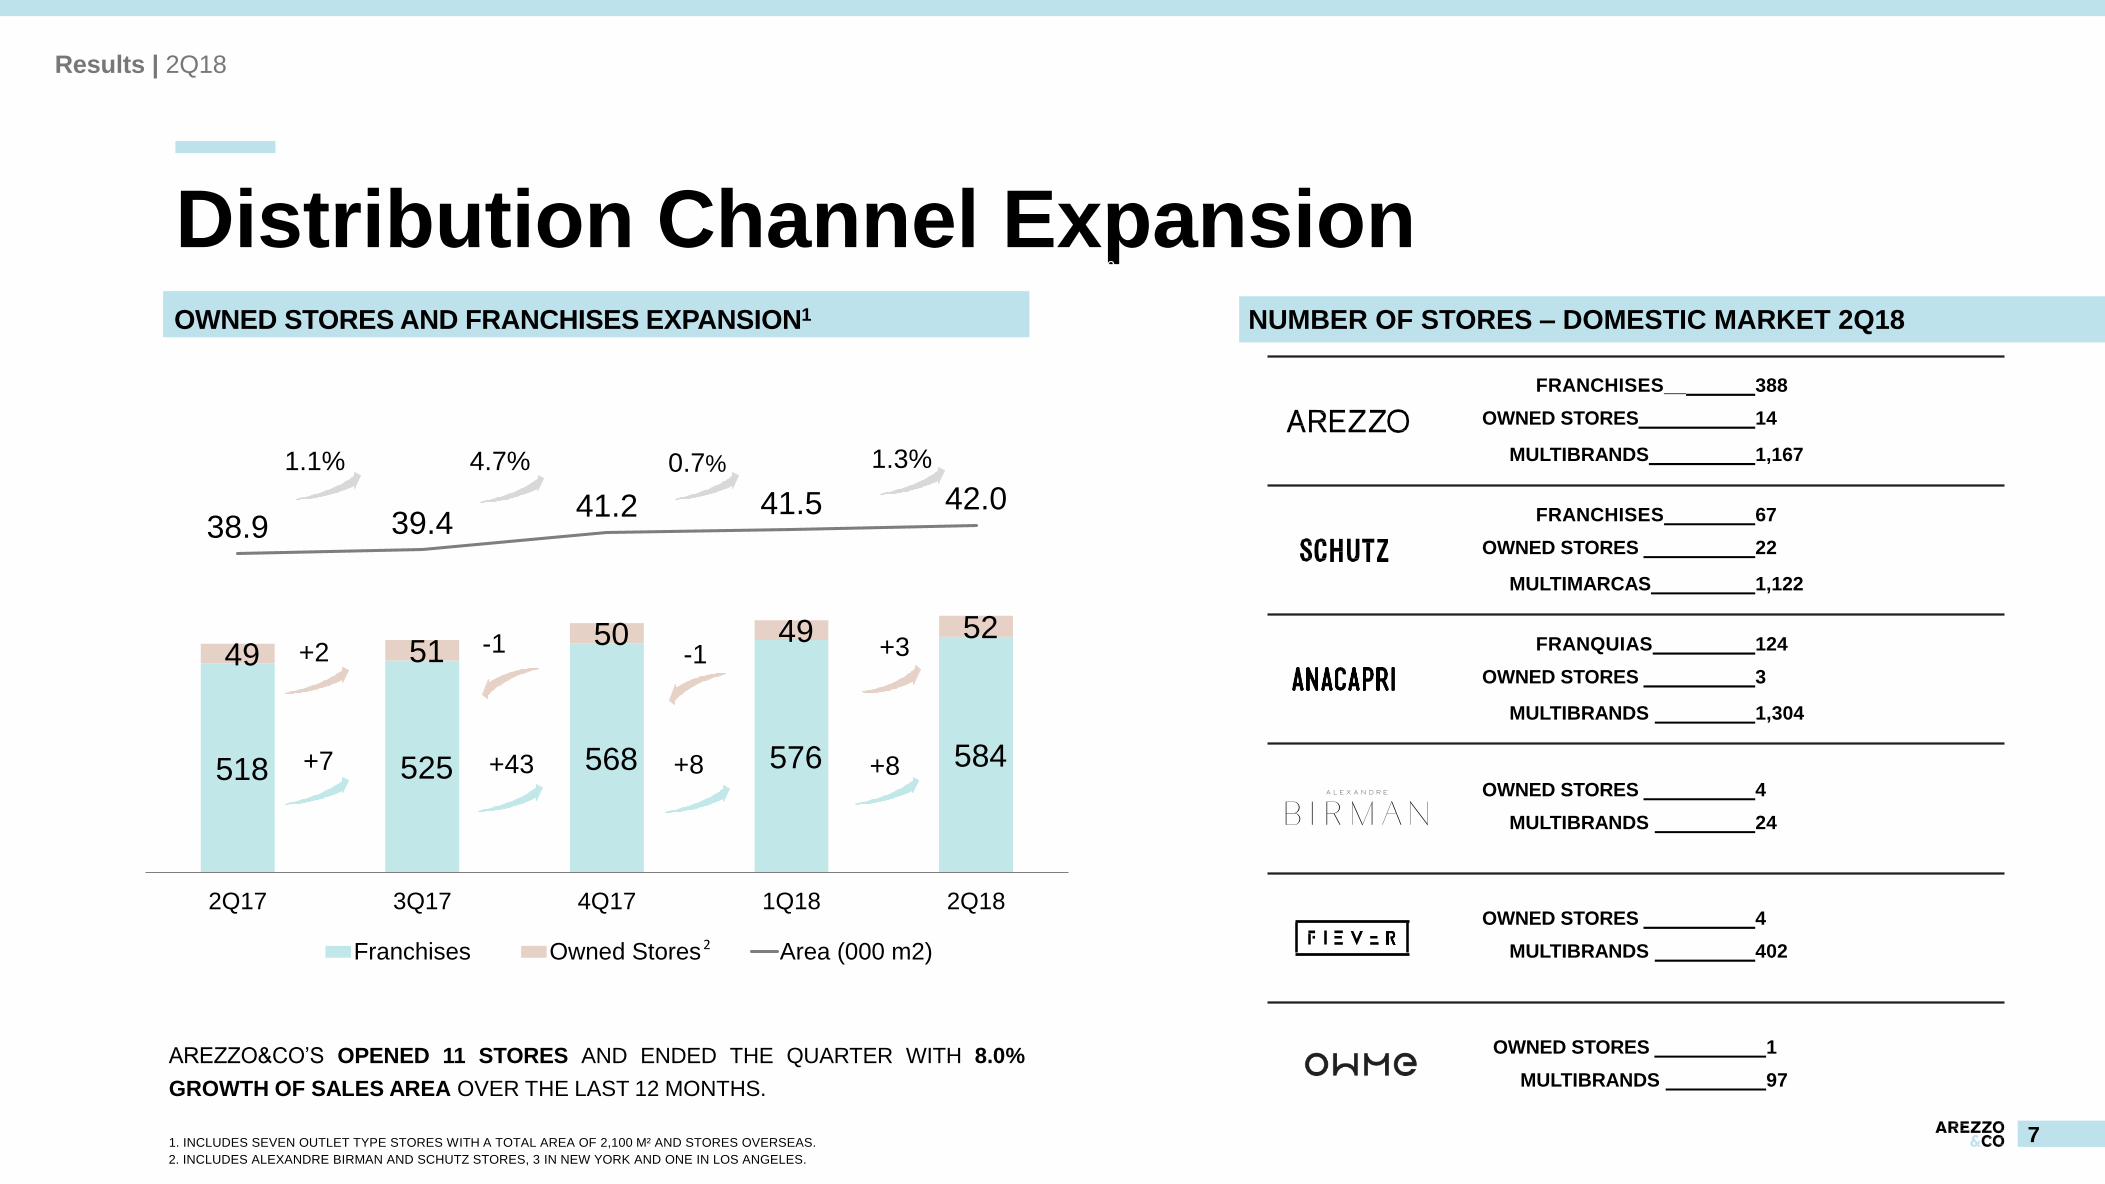
Distribution Channel ExpansionOWNED STORES AND FRANCHISES EXPANSION1 NUMBER OF STORES – DOMESTIC MARKET 2Q18
AREZZO&CO’S OPENED 11 STORES AND ENDED THE QUARTER WITH 8.0%
GROWTH OF SALES AREA OVER THE LAST 12 MONTHS.
1. INCLUDES SEVEN OUTLET TYPE STORES WITH A TOTAL AREA OF 2,100 M² AND STORES OVERSEAS.
Results | 2Q18
518 525 568 576 584
49 51 50 49 52
38.9 39.441.2 41.5 42.0
-
10,0
20,0
30,0
40,0
50,0
60,0
70,0
-100
100
300
500
700
900
1.100
1.300
1.500
2Q17 3Q17 4Q17 1Q18 2Q18
Franchises Owned Stores Area (000 m2)
+8
-1-1 +3
+8+43+7
+2
1.1% 4.7% 0.7% 1.3%
FRANCHISES__ 388
OWNED STORES 14
MULTIBRANDS 1,167
FRANCHISES 67
OWNED STORES 22
MULTIMARCAS 1,122
FRANQUIAS 124
OWNED STORES 3
MULTIBRANDS 1,304
OWNED STORES 4
MULTIBRANDS 24
OWNED STORES 4
MULTIBRANDS 402
OWNED STORES 1
MULTIBRANDS 97
2
2. INCLUDES ALEXANDRE BIRMAN AND SCHUTZ STORES, 3 IN NEW YORK AND ONE IN LOS ANGELES.

154,3 178,8
284,4
325,3
46.9% 47.8%45.4% 46.2%
0,0%
20,0%
40,0%
60,0%
-40,0
60,0
160,0
260,0
360,0
460,0
560,0
2Q17 2Q18 1H17 1H18
Gross Profit Gross Margin
15.8%
+80 bps
50,3 56,6
86,3 97,3
15.3% 15.1% 13.8% 13.8%
- 2,0 4,0 6,0 8,0
10,0 12,0 14,0 16,0 18,0 20,0 22,0 24,0 26,0 28,0 30,0 32,0 34,0 36,0 38,0 40,0 42,0 44,0 46,0 48,0 50,0 52,0 54,0 56,0 58,0 60,0 62,0 64,0 66,0 68,0 70,0 72,0 74,0 76,0 78,0 80,0 82,0 84,0 86,0 88,0 90,0 92,0 94,0 96,0 98,0
100,0 102,0 104,0 106,0 108,0 110,0 112,0 114,0 116,0 118,0 120,0 122,0 124,0 126,0 128,0 130,0 132,0 134,0 136,0 138,0 140,0 142,0 144,0 146,0 148,0 150,0 152,0 154,0 156,0 158,0 160,0
2Q17 2Q18 1H17 1H18
EBITDA EBITDA Margin
12.7%
-20 bps 0 bps
8
Gross Profit and EBITDAGROSS PROFIT (R$ MILLIONS) EBITDA (R$ MILLIONS)
GROSS PROFIT TOTALED R$ 178.8 MILLION IN 2Q18 WITH AN INCREASE OF 15.8% (+ 90BPS IN GROSS MARGIN).
EBITDA GREW BY 12.4% IN 2Q18 TO R$ 56.6 MILLION (EBITDA MARGIN OF 15.1%).
Results | 2Q18
14.4%
12.4%
+90bps

9
Net IncomeNET INCOME (R$ MILLIONS)
THE COMPANY POSTED A NET MARGIN OF 8.9% IN 2Q18
AND A NET INCOME OF R$ 33.1 MILLION, DOWN 15.7% IN
2Q17. EXCLUDING THE NON-CASH EFFECT, NET INCOME
WOULD HAVE REACHED R$ 46.9 MILLION, 19.4% HIGHER
THAN IN 2Q17. EXCLUDING THE NON-CASH EFFECT, NET
INCOME WOULD HAVE BEEN R$ 46.9 MILLION, 19.4%
HIGHER THAN IN 2Q17.
IN 4Q17 THE COMPANY OBTAINED AN INJUNCTION EXEMPTING IT FROM THE
PAYMENT OF INCOME AND SOCIAL CONTRIBUTION TAXES (IR AND CSLL) ON
AN ICMS TAX BENEFIT RETROATIVE TO 2017, WHICH REMAINED VALID
DURING THE FIRST HALF OF 2018.
ON THE OTHER HAND, NET INCOME WAS NEGATIVELY IMPACTED BY THE
WORSENING OF THE FINANCIAL RESULT - DUE TO:
(I) HIGHER EXCHANGE RATE VARIATION IN THE PERIOD (NON-CASH
EFFECT IN THE COMPANY'S RESULTS);
(II) HIGHER FINANCIAL EXPENSES, COUPLED WITH HIGHER
INDEBTEDNESS COMPARED TO 2Q17 AND;
(III) LOWER FINANCIAL INCOME DUE TO THE REDUCTION OF THE SELIC
RATE OVER THE LAST 12 MONTHS.
Results | 2Q18
39,3 33,1
61,4 60,2
11.9%
8.9%9.8%
8.6%
-14,0%
16,0%
-
10,0
20,0
30,0
40,0
50,0
60,0
70,0
80,0
90,0
100,0
2Q17 2Q18 1H17 1H18
Net Income Net Margin
-15.7%
-2.0%
-300 bps -120 bps

Operating Cash FlowOPERATING CASH FLOW (R$ THOUSAND)
AREZZO&CO GENERATED R$ 28.0
MILLION CASH FROM
OPERATIONS IN 2Q18, LOWER
THAN THE AMOUNT PRESENTED
IN 2Q17.
IT IS WORTH HIGHLIGHTING THE PAYMENT
OF SUPPLEMENTARY DIVIDENDS FOR 2017
IN THE AMOUNT OF R$ 2.8 MILLION AND THE
PAYMENT OF INTERIM DIVIDENDS BASED
ON THE PROFITS RESERVE, CONSTANT OF
THE COMPANY’S BALANCE SHEET OF
DECEMBER 2017, IN THE AMOUNT OF R$
46.0 MILLION. BOTH PAYMENTS WERE MADE
ON JUNE 8, 2018.
10
Results | 2Q18
Operating Cash Flow 2Q18 2Q17 1H18 1H17
Profits before income tax and social contribution 34.883 48.497 68.444 82.934
Depreciation and amortization 8.788 6.737 17.213 13.412
Others 15.226 1.509 14.163 (1.346)
Decrease (increase) in assets / liabilities (28.098) (1.541) (35.470) 14.605
Trade accounts receivables 9.804 21.450 1.597 19.511
Inventories (14.689) (5.462) (29.041) (14.808)
Suppliers (25.485) (23.682) 2.936 22.905
Change in other noncurrent and current assets and liabilities 2.272 6.153 (10.962) (13.003)
Payment of income tax and social contribution (2.751) (14.421) (6.141) (14.871)
Net cash flow generated by operational activities 28.048 40.781 58.209 94.734

11
Investments (CAPEX) and IndebtednessCAPEX (R$ MILLIONS) INDEBTEDNESS (R$ MILLIONS)
IN 2Q18, AREZZO&CO INVESTED R$ 15.0 MILLION IN CAPEX, INCLUDING:
• BRAZIL: (I) AREZZO&CO NEW OFFICE IN SÃO PAULO, (II) OPENING OF OWME'S FIRST FLAGSHIP STORE (II) REMODELING OF SCHUTZ STORES INTO THE NEW DIGITAL STORE
CONCEPT, (IV) DESIGN AND CONSTRUCTION OF AN ADDITIONAL OWNED FACTORY, FOCUSED ON SNEAKERS AND COMFORT SHOES.
• UNITED STATES: (I) OPENING OF SCHUTZ STORE AND ALEXANDRE BIRMAN STORES IN NYC (II) OPENING OF THE ALEXANDRE BIRMAN SHOWROOM IN EUROPE (MILAN).
THE COMPANY ENDED 2Q18 WITH R$ 107.7 MILLION IN CASH AND THE DEBT POLICY REMAINS CONSERVATIVE.
Results | 2Q18
Cash position and Indebtedness 2Q18 1Q18 2Q17
Cash 283.172 333.338 310.115
Total debt 175.501 172.112 110.847
Short term 162.002 156.354 88.311
% total debt 92,3% 90,8% 79,7%
Long-term 13.499 15.758 22.536
% total debt 7,7% 9,2% 20,3%
Net Debt (107.671) (161.226) (199.268)
Net Debt/EBITDA -0.5x -0.8x -1.0x
2,0 3,7 3,7
7,1 2,3
7,4
3,4
9,7
1,4
3,9
1,8
5,4
5,6
15,0
8,9
2Q17 2Q18 1H17 1H18
Stores Corporate Others total
150.9%
207.2%
94.7%
181.7%
167.8%
225.7%
188.1%
87.4%
22,2

12
ROIC (Return on Invested Capital)
RETURN ON INVESTED CAPITAL (ROIC)
AGAIN SHOWED GROWTH IN 2Q18, REACHING
31.2% AND A 750BPS INCREASE VS 2T17.
AMONG THE FACTORS RESPONSIBLE FOR THIS
IMPROVEMENT ARE:
(I) INCREASE OF 37.8% NOPAT AGAINST 2Q17, WHICH
IS PARTIALLY DUE TO AN INJUNCTION OBTAINED IN
4Q17 EXEMPTING THE COMPANY FROM THE PAYMENT
OF INCOME AND SOCIAL CONTRIBUTION TAXES (IR
AND CSLL – 34%) ON AN ICMS TAX BENEFIT
RETROACTIVE TO 2017, WHICH REMAINED VALID
DURING THE FIRST HALF OF 2018 AND;
(II) PERMANENT ASSET REDUCTION, RESULTING FROM
THE LOWER SHARE OF OUR OWNED STORES IN THE
COMPANY'S MIX.
(1) Working Capital: current assets minus cash, cash equivalents and financial investments less current liabilities minus loans and financing and dividends payable.
(2) Less deferred income tax and social contribution.
(3) Average invested capital in the period and same period previous year.
(4) ROIC: NOPAT for the last 12 months divided by average invested capital.
Results | 2Q18
Income from operations 2Q18 2Q17 2Q16 Δ 18 x 17
(%)
EBIT (LTM) 180.797 169.714 136.651 6,5%
+ IR and CS (LTM) (15.181) (49.539) (38.515) (69,4%)
NOPAT 165.616 120.175 98.136 37,8%
Working Capital¹ 378.688 307.097 327.433 23,3%
Permanent assets 154.515 156.998 165.567 (1,6%)
Other long-term assets² 34.156 29.173 29.505 17,1%
Invested capital 567.359 493.268 522.505 15,0%
Average invested capital³ 530.314 507.887 4,4%
ROIC4 31,2% 23,7%

ContactsCFO
RAFAEL SACHETE
IRO
ALINE PENNA
IR COORDINATOR
VICTORIA MACHADO
IR ANALYST
RAFAELLA NOLLI
+55 11 2132 4300
WWW.AREZZOCO.COM.BR