approved on: 06-jun-2019 06:52 (gmt) osteoarthritis of … · protocola4091057(pf-04383119)...
TRANSCRIPT
Protocol A4091057 (PF-04383119) Statistical Analysis Plan
PFIZER CONFIDENTIALPage 1
Protocol A4091057
A PHASE 3 RANDOMIZED, DOUBLE-BLIND, PLACEBO-CONTROLLED, MULTICENTER STUDY OF THE ANALGESIC EFFICACY AND SAFETY OF THE
SUBCUTANEOUS ADMINISTRATION OF TANEZUMAB IN SUBJECTS WITH OSTEOARTHRITIS OF THE HIP OR KNEE
Statistical Analysis Plan (SAP)
Version: 4.0 (Final)
Date: 21-DEC-2018
0901
77e1
900c
692f
\App
rove
d\Ap
prov
ed O
n: 2
1-D
ec-2
018
18:2
3 (G
MT)
0901
77e1
910c
8bd2
\App
rove
d\A
ppro
ved
On:
06-
Jun-
2019
06:
52 (
GM
T)
Protocol A4091057 (PF-04383119) Statistical Analysis Plan
PFIZER CONFIDENTIALPage 2
TABLE OF CONTENTSLIST OF TABLES.....................................................................................................................3LIST OF FIGURES ...................................................................................................................4APPENDICES ...........................................................................................................................41. VERSION HISTORY............................................................................................................52. INTRODUCTION .................................................................................................................9
2.1. Study Objectives .......................................................................................................92.1.1. Primary Objective.........................................................................................92.1.2. Secondary Objective.....................................................................................9
2.2. Study Design .............................................................................................................93. ENDPOINTS AND BASELINE VARIABLES: DEFINITIONS AND
CONVENTIONS ................................................................................................................113.1. Primary Endpoint(s) ................................................................................................113.2. Secondary Endpoint(s) ............................................................................................11
3.2.1. Efficacy Measures ......................................................................................113.3. Other Endpoints.......................................................................................................14
3.3.1. Pharmacokinetic and Pharmacodynamic Measures....................................143.4. Baseline Variables...................................................................................................14
3.4.1. Covariates ...................................................................................................143.5. Safety Endpoints .....................................................................................................15
3.5.1. Adverse Events ...........................................................................................153.5.2. Vital Signs ..................................................................................................173.5.3. Total Joint Replacement and Surgical Endpoints.......................................173.5.4. Neurological Endpoints ..............................................................................18
4. ANALYSIS SETS ...............................................................................................................184.1. Full Analysis Set .....................................................................................................18
4.2. Per Protocol Analysis Set ........................................................................................184.2.1. Major Deviations Assessed Prior to Randomization..................................194.2.2. Major Deviations Assessed Post-Randomization.......................................19
4.3. Safety Analysis Set..................................................................................................204.4. Other Analysis Sets .................................................................................................20
5. GENERAL METHODOLOGY AND CONVENTIONS....................................................205.1. Hypotheses and Decision Rules ..............................................................................20
0901
77e1
900c
692f
\App
rove
d\Ap
prov
ed O
n: 2
1-D
ec-2
018
18:2
3 (G
MT)
0901
77e1
910c
8bd2
\App
rove
d\A
ppro
ved
On:
06-
Jun-
2019
06:
52 (
GM
T)
Protocol A4091057 (PF-04383119) Statistical Analysis Plan
PFIZER CONFIDENTIALPage 3
5.1.1. Statistical Hypotheses.................................................................................205.1.2. Statistical Decision Rules ...........................................................................20
5.2. General Methods .....................................................................................................225.2.1. Analyses for Binary Data............................................................................245.2.2. Analyses for Continuous Data ....................................................................255.2.3. Analyses for Categorical Data ....................................................................295.2.4. Analyses for Time to Event Data................................................................30
5.3. Methods to Manage Missing Data ..........................................................................306. ANALYSES AND SUMMARIES ......................................................................................34
6.1. Primary Endpoint(s) ................................................................................................346.2. Secondary Endpoint(s) ............................................................................................346.3. Other Endpoint(s) ....................................................................................................34
6.3.1. Pharmacokinetics ........................................................................................346.4. Subset Analyses.......................................................................................................356.5. Baseline and Other Summaries and Analyses.........................................................35
6.5.1. Concomitant Medications and Non-Drug Treatments................................366.6. Safety Summaries and Analyses .............................................................................36
6.6.1. Adverse Events ...........................................................................................376.6.2. Vital Signs ..................................................................................................396.6.3. Neurological Results...................................................................................396.6.4. Immunogenicity..........................................................................................406.6.5. Joint Safety Events .....................................................................................40
7. INTERIM ANALYSES.......................................................................................................407.1. Introduction .............................................................................................................40
7.2. Interim Analyses and Summaries............................................................................418. REFERENCES ....................................................................................................................429. APPENDICES .....................................................................................................................43
LIST OF TABLESTable 1. Summary of Major Changes in SAP Amendments ................................................5
0901
77e1
900c
692f
\App
rove
d\Ap
prov
ed O
n: 2
1-D
ec-2
018
18:2
3 (G
MT)
0901
77e1
910c
8bd2
\App
rove
d\A
ppro
ved
On:
06-
Jun-
2019
06:
52 (
GM
T)
Protocol A4091057 (PF-04383119) Statistical Analysis Plan
PFIZER CONFIDENTIALPage 4
LIST OF FIGURESFigure 1. Study Design.........................................................................................................10Figure 2. Graphical Multiple Testing Procedure for Strong Control of Type I Error..........21
APPENDICESAppendix 1. SUMMARY OF EFFICACY ANALYSES........................................................43Appendix 2. DATA DERIVATION DETAILS ......................................................................53Appendix 2.1. Definition and Use of Visit Windows in Reporting.........................................53Appendix 3. STATISTICAL METHODOLOGY DETAILS..................................................56Appendix 3.1. Further Details of Interim Analyses.................................................................61Appendix 3.2. Further Details of the Statistical Methods........................................................61
0901
77e1
900c
692f
\App
rove
d\Ap
prov
ed O
n: 2
1-D
ec-2
018
18:2
3 (G
MT)
0901
77e1
910c
8bd2
\App
rove
d\A
ppro
ved
On:
06-
Jun-
2019
06:
52 (
GM
T)

Protocol A4091057 (PF-04383119) Statistical Analysis Plan
PFIZER CONFIDENTIALPage 5
1. VERSION HISTORYThis Statistical Analysis Plan (SAP) for study A4091057 is based on the Protocol Amendment 2 dated 10Feb2016.
Table 1. Summary of Major Changes in SAP Amendments
SAP
Version
Change Rationale
1.0(14JUL2016)
Not Applicable
Not Applicable
2.0(26SEP2018)
Clarified abbreviation, synonym, definition across this document;
Clarified the day of baseline of IAP under Section 2.2;
Amend the period to summarize about selected safety analysis is based on treatment and safety follow-up separately under Section 2.2, Section 3.5.1, Section 3.5.2;
Removed Week 32 of some categorical efficacy endpoints under Section 3.2;
Clarified the baseline definition of NRS score using the last 3 values under Section 3.4;
Moved last two sentences of source data definition of statistical model and the summary of randomization system vs. CRF from Section 3.4 through Section 3.4.1;
Added WOMAC baseline as covariate in model about rescue medication and removed the site as random effect from the same model under Section 3.4.1;
Added explanation of covariate for incidence of treatment discontinuation under Section 3.4.1;
Removed the interaction analysis of corresponding baseline, index joint, KL grade under Section 3.4.1;
Removed a sensitivity analysis without covariate under Section 3.4.1;
Added to summarize about orthostatic hypotension under Section 3.5.2;
0901
77e1
900c
692f
\App
rove
d\Ap
prov
ed O
n: 2
1-D
ec-2
018
18:2
3 (G
MT)
0901
77e1
910c
8bd2
\App
rove
d\A
ppro
ved
On:
06-
Jun-
2019
06:
52 (
GM
T)
Protocol A4091057 (PF-04383119) Statistical Analysis Plan
PFIZER CONFIDENTIALPage 6
Removed to summarize about postural change in DBP/SBP under Section 3.5.2;
Removed some analysis of composite endpoints and re-categorized the adjudication outcome under Section 3.5.3;
Removed gender subgroup analysis of neurological endpoints under Section 3.5.4;
Updated the timing to decide how patients who randomized but received incorrect treatment for safety from “prior to database lock” to “before unblinding” under Section 4;
Clarified the process about per protocol populationdefinition under Section 4.2;
Updated the criteria of major deviation assessed prior to randomization under Section 4.2.1;
Added an criteria about mismatch between CRF and electric tablet and updated criteria for non-NSAID under Section 4.2.2;
Removed other analysis set under Section 4.4;
Added estimand definition under Section 5.2;
Clarified general time points to be measured and on-off treatment detail under Section 5.2;
Removed description of sensitivity analysis about ANCOVA (LOCF and BOCF) and MMRM in section of primary analysis of co-primary endpoint under Section 5.2.2;
Amended MMRM using multiple imputation data and added MMRM using observed data (regardless of on-off treatment) up to week 24 as sensitivity analyses under Section 5.2.2;
Removed interaction analysis except for treatment by country and treatment by study site and removed unadjusted analysis under Section 5.2.2;
Added sensitivity analysis to evaluate missing sentence for Spanish translation under Section 5.2.2;
0901
77e1
900c
692f
\App
rove
d\Ap
prov
ed O
n: 2
1-D
ec-2
018
18:2
3 (G
MT)
0901
77e1
910c
8bd2
\App
rove
d\A
ppro
ved
On:
06-
Jun-
2019
06:
52 (
GM
T)
Protocol A4091057 (PF-04383119) Statistical Analysis Plan
PFIZER CONFIDENTIALPage 7
Removed analysis of other time point of primary endpoints defined as secondary endpoint using multiple imputation and added analysis from day 1 through day 7 of average pain under Section 5.2.2;
Removed the description of ANCOVA for dairy pain due to duplicated sentence under Section 5.2.2;
Added additional WPAI analysis under Section 5.2.2;
Removed CMH analysis of patient global assessment under Section 5.2.3;
Updated analyses of mPRTI under Section 5.2.3;
Removed time to joint safety analysis under Section 5.2.4;
Clarified to apply multiple imputation to time points other than primary (week 24), updated seeds for multiple imputation, added to how to impute WOMAC each items, clarified to apply using standard methods (Little & Rubin, 2002), clarified how to handle the multiple data within same time window, and clarified only to use the last 3 data for baseline calculation of IPAP under Section 5.3;
Updated PK analysis and merged Section 6.3.1 through 6.3.3 as Section 6.3.1;
Removed subset analysis about TJR under Section 6.4;
Added diabetes status as baseline characteristics under Section 6.5;
Removed some analyses (AE/SAE of patient-years, sympathetic neuropathy consults, depressed sympathetic functions, AEs of APS, plots of start and stop day of APS/DFS/Odema peripheral, summary of start day and duration of APS/DFS/Odema peripheral, summary of demographic details, etc…) under Section 6.6;
Updated duration period in some summary table under Section 6.6;
Added summary of days of NSAID use, mg dose of NSAID under Section 6.6;
Updated the cut-off % for tier 2 AE from 1% to 3%, and removed graphs of AE and risk difference under Section
0901
77e1
900c
692f
\App
rove
d\Ap
prov
ed O
n: 2
1-D
ec-2
018
18:2
3 (G
MT)
0901
77e1
910c
8bd2
\App
rove
d\A
ppro
ved
On:
06-
Jun-
2019
06:
52 (
GM
T)

Protocol A4091057 (PF-04383119) Statistical Analysis Plan
PFIZER CONFIDENTIALPage 8
6.6.1;
Clarified AE summary definition and added to summarize during safety follow-up for selected AEs under Section 6.6.1;
Removed to summarize mean change from baseline in postural blood pressure under Section 6.6.2;
Clarified neurologic data summaries under Section 6.6.3;
Removed to analyze joint some safety events like events per 1000 patients years of exposure, and removed to analyze joint space width under Section 6.6.5;
Removed all analyses about joint space width under Section 6.6.5;
Updated adjudicated events to summarize for SMC under Section 7.2;
Removed the link of EQ 5D under Section 8;
Updated analysis under Appendix 1 based on amendments before section 7;
Removed the window of end of study, added additional window of 16 +/- 4 weeks past the date of the last SC dose, added some specific endpoints window, EQ-5D-5L, WPAI: OA, HCRU, and mPRTI, updated the definition of baseline calculation to use last 3 non-missing pain score, and updated time windows of dairy pain after week 24 under Appendix 2.1.
Added to collect HCRU during last 8 week prior to baseline description under Appendix 3 to keep consistent with the corresponding CRF.
Updated to analyze rescue medication under Appendix 3.
3.0(13DEC2018)
Added gatekeeping strategy for co-primary and key secondary endpoints under Section 5.1.2 and added references under Section 8;
Clarified how to summarize p-value of Spanish interaction subgroup under Section 5.2.2;
Removed “site” from fixed effect in the model of
0901
77e1
900c
692f
\App
rove
d\Ap
prov
ed O
n: 2
1-D
ec-2
018
18:2
3 (G
MT)
0901
77e1
910c
8bd2
\App
rove
d\A
ppro
ved
On:
06-
Jun-
2019
06:
52 (
GM
T)

Protocol A4091057 (PF-04383119) Statistical Analysis Plan
PFIZER CONFIDENTIALPage 9
exploratory analysis under Appendix 1.
4.0 Removed one sentence of introductory sentence under Section 6.6.1;
Added the definition of windowing under Section 6.6.5.
2. INTRODUCTIONNote: in this document any text taken directly from the protocol is italicised.
This SAP provides the detailed methodology for summary and statistical analyses of the data collected in study A4091057. This document may modify the plans outlined in the protocol; however, any major modifications of the primary endpoint definition or its analysis will also be reflected in a protocol amendment.
2.1. Study Objectives2.1.1. Primary ObjectiveDemonstrate superior efficacy of tanezumab 5 mg and 2.5 mg administered subcutaneously (SC) every 8 weeks versus placebo at Week 24.
2.1.2. Secondary ObjectiveEvaluate the safety of tanezumab 2.5 mg SC and 5 mg SC.
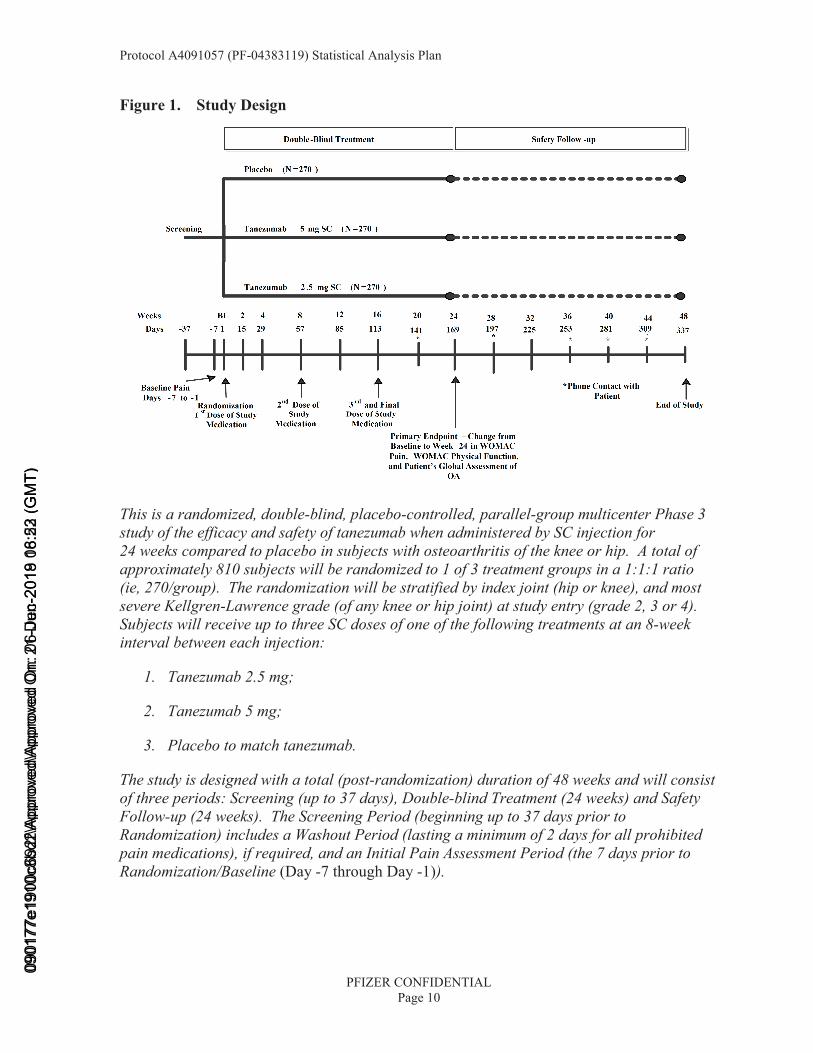
2.2. Study DesignThe study design is summarized in the diagram below.
0901
77e1
900c
692f
\App
rove
d\Ap
prov
ed O
n: 2
1-D
ec-2
018
18:2
3 (G
MT)
0901
77e1
910c
8bd2
\App
rove
d\A
ppro
ved
On:
06-
Jun-
2019
06:
52 (
GM
T)
Protocol A4091057 (PF-04383119) Statistical Analysis Plan
PFIZER CONFIDENTIALPage 10
Figure 1. Study Design
This is a randomized, double-blind, placebo-controlled, parallel-group multicenter Phase 3 study of the efficacy and safety of tanezumab when administered by SC injection for 24 weeks compared to placebo in subjects with osteoarthritis of the knee or hip. A total of approximately 810 subjects will be randomized to 1 of 3 treatment groups in a 1:1:1 ratio (ie, 270/group). The randomization will be stratified by index joint (hip or knee), and most severe Kellgren-Lawrence grade (of any knee or hip joint) at study entry (grade 2, 3 or 4). Subjects will receive up to three SC doses of one of the following treatments at an 8-week interval between each injection:
1. Tanezumab 2.5 mg;
2. Tanezumab 5 mg;
3. Placebo to match tanezumab.
The study is designed with a total (post-randomization) duration of 48 weeks and will consist of three periods: Screening (up to 37 days), Double-blind Treatment (24 weeks) and Safety Follow-up (24 weeks). The Screening Period (beginning up to 37 days prior to Randomization) includes a Washout Period (lasting a minimum of 2 days for all prohibited pain medications), if required, and an Initial Pain Assessment Period (the 7 days prior to Randomization/Baseline (Day -7 through Day -1)).
0901
77e1
900c
692f
\App
rove
d\Ap
prov
ed O
n: 2
1-D
ec-2
018
18:2
3 (G
MT)
0901
77e1
910c
8bd2
\App
rove
d\A
ppro
ved
On:
06-
Jun-
2019
06:
52 (
GM
T)
Protocol A4091057 (PF-04383119) Statistical Analysis Plan
PFIZER CONFIDENTIALPage 11
The end of treatment period is at Week 24, with the safety follow-up period up to Week 48. The primary time point for efficacy is Week 24. The period of interest for most safety results is the treatment period. Selected safety results will be provided separately for the safetyfollow-up and for the combined overall study period comprising the treatment and safety follow-up periods.
3. ENDPOINTS AND BASELINE VARIABLES: DEFINITIONS AND CONVENTIONS3.1. Primary Endpoint(s)
• Change from Baseline to Week 24 in the WOMAC Pain subscale.
• Change from Baseline to Week 24 in the WOMAC Physical Function subscale.
• Change from Baseline to Week 24 in the Patient’s Global Assessment of Osteoarthritis.
Baseline values will be those from the Baseline window as described in Appendix 2.1.
3.2. Secondary Endpoint(s)3.2.1. Efficacy Measures
• WOMAC Pain subscale change from Baseline to Weeks 2, 4, 8, 12, 16, and 32.
• WOMAC Physical Function subscale change from Baseline to Weeks 2, 4, 8, 12, 16, and 32.
• Patient’s Global Assessment of Osteoarthritis (5 point Likert scale) change from Baseline to Weeks 2, 4, 8, 12, 16, and 32.
• OMERACT-OARSI responder index at Weeks 2, 4, 8, 12, 16, and 24.
The OMERACT-OARSI responder index at Week X utilizes the change from Baseline to Week X in the WOMAC Pain subscale, the WOMAC Physical Function Subscale and the PGA of Osteoarthritis (using appropriate imputation where necessary for any components). According to this definition, a patient is classified as a responder if, either:
• The improvement from Baseline to Week X was ≥50% and ≥2 points in either the WOMAC Pain or Physical Function subscales, OR
• At least 2 of the following 3 were true:
• The improvement from Baseline to Week X was ≥20% and ≥1 point in the WOMAC Pain subscale;
• The improvement from Baseline to Week X was ≥20% and ≥1 point in the WOMAC Physical Function subscale;
0901
77e1
900c
692f
\App
rove
d\Ap
prov
ed O
n: 2
1-D
ec-2
018
18:2
3 (G
MT)
0901
77e1
910c
8bd2
\App
rove
d\A
ppro
ved
On:
06-
Jun-
2019
06:
52 (
GM
T)
Protocol A4091057 (PF-04383119) Statistical Analysis Plan
PFIZER CONFIDENTIALPage 12
• The improvement from Baseline to Week X ≥20% and ≥1 point in the PGA of Osteoarthritis (note: from the 5-point Likert scale, any change of ≥1 corresponded to a change of ≥20%).
• Cumulative distribution of percent change from Baseline in the WOMAC Pain subscale score to Week 16 and 24 (endpoint for summary only).
• Treatment Response: Reduction in the WOMAC Pain subscale of ≥30%, ≥50%, ≥70% and ≥90%, at Weeks 2, 4, 8, 12, 16, and 24.
• Treatment Response: Reduction in the WOMAC Physical Function subscale of ≥30%, ≥50%, ≥70% and ≥90% at Weeks 2, 4, 8, 12, 16, and 24.
• Cumulative distribution of percent change from Baseline in the WOMAC Physical Function subscale score to Week 16 and 24 (endpoint for summary only).
• Treatment Response: Improvement of ≥2 points in Patient’s Global Assessment of Osteoarthritis at Weeks 2, 4, 8, 12, 16, and 24.
• Average pain score in the index knee or hip change from Baseline to Weeks 1, 2, 3, 4, 6, 8, 10, 12, 16, 20, 24, 28 and 32.
• WOMAC Stiffness subscale change from Baseline to Weeks 2, 4, 8, 12, 16, 24 and 32.
• WOMAC Average score change from Baseline to Weeks 2, 4, 8, 12, 16, 24, and 32.
• WOMAC Pain Subscale Item: Pain When Walking on a Flat Surface, change from Baseline to Weeks 2, 4, 8, 12, 16, 24, and 32.
• WOMAC Pain Subscale Item: Pain When Going Up or Downstairs, change from Baseline to Weeks 2, 4, 8, 12, 16, 24, and 32.
• Work Productivity and Activity Impairment Questionnaire for Osteoarthritis (WPAI:OA) impairment scores change from Baseline to Weeks 8, 16 and 24.
The WPAI:OA impairment scores are listed below:
• Percent work time missed due to Osteoarthritis.
• Percent impairment while working due to Osteoarthritis.
• Percent overall work impairment due to Osteoarthritis.
• Percent activity impairment due to Osteoarthritis.
0901
77e1
900c
692f
\App
rove
d\Ap
prov
ed O
n: 2
1-D
ec-2
018
18:2
3 (G
MT)
0901
77e1
910c
8bd2
\App
rove
d\A
ppro
ved
On:
06-
Jun-
2019
06:
52 (
GM
T)
Protocol A4091057 (PF-04383119) Statistical Analysis Plan
PFIZER CONFIDENTIALPage 13
The calculation of these endpoints is described in Appendix 3.
• EQ-5D-5L Health State Utility and Five Items (Mobility; Self-Care; Usual Activities; Pain/Discomfort; Anxiety/Depression) change from Baseline to Weeks 8, 16 and 24.
The Baseline and Weeks 8, 16, and 24 responses in the five dimensions (mobility; self-care; usual activities; pain/discomfort; anxiety/depression) and overall health utility score from the EuroQol 5 Dimensions (EQ-5D-5L), and the EQ-VAS will be summarized by treatment group. This summary will use observed data only (no imputation for missing data). The overall health utility score is calculated using the EuroQol value sets, and is described in Appendix 3.
An additional question, called the EQ-VAS asks the patient to rate their health today using a VAS scale from 0 (the worst health you can imagine) to 100 (the best health you can imagine). This will be summarized along with the health utility score.
• Patient Reported Treatment Impact Assessment-Modified (mPRTI) at Weeks 16 and 24.
The three endpoints derived from this questionnaire are described below:
Patient satisfaction. This comes from the question “Overall, how satisfied are you with the drug that you received in this study?”. This is rated on a 5 point Likert scale from 1 (‘Extremely dissatisfied’) to 5 (‘Extremely satisfied’).
Patient willingness to use drug again. This comes from the question “In the future, would you be willing to use the same drug that you have received in this study for your osteoarthritis pain?”. This is rated on a 5 point Likert scale from 1 (‘Yes, I would definitely want to use the same drug again’) to 5 (‘No, I definitely would not want to use the same drug again’).
Patient preference of drug versus prior treatment. This comes from the question “Overall, do you prefer the drug that you received in this study to the treatment you received before this clinical trial?”. This is rated on a 5 point Likert scale from 1 (‘Yes, I definitely prefer the drug I am receiving now’) to 5 (‘No, I definitely prefer my previous treatment’).
• Health Care Resource Utilization at Baseline, and Weeks 32 and 48.
• Incidence and time to discontinuation due to Lack of Efficacy.
• Usage of rescue medication (incidence and number of days of use) during Weeks 2, 4, 8, 12, 16, 24, and 32.
• Usage of rescue medication (amount taken) during Weeks 2, 4, 8, 12, 16 and 24.
0901
77e1
900c
692f
\App
rove
d\Ap
prov
ed O
n: 2
1-D
ec-2
018
18:2
3 (G
MT)
0901
77e1
910c
8bd2
\App
rove
d\A
ppro
ved
On:
06-
Jun-
2019
06:
52 (
GM
T)
Protocol A4091057 (PF-04383119) Statistical Analysis Plan
PFIZER CONFIDENTIALPage 14
3.3. Other Endpoints3.3.1. Pharmacokinetic and Pharmacodynamic Measures
• Plasma tanezumab concentrations.
• Serum NGF assessment.
• Serum and urine osteoarthritis biomarker concentrations.
3.4. Baseline VariablesBaseline is generally defined as the last observation prior to first receipt of study drug, within the baseline window as defined in Appendix 2.1.
For analysis of diary pain intensity scores for the index joint, baseline is defined as the mean average daily Pain NRS score using the last 3 values during the 7 days of the Initial PainAssessment Period prior to Randomization/Day 1.
The stratification variables are index joint (hip or knee), and most severe Kellgren-Lawrence grade (of any knee or hip joint) at study entry (grade 2, 3 or 4).
3.4.1. CovariatesFor all models analyzing the continuous primary and secondary efficacy endpoints (except rescue medication) the corresponding Baseline value will be used as a covariate, in addition to Baseline diary average pain. Study site will be fitted as a random effect in the ANCOVA models. The randomization stratification variables of index joint (hip or knee) and highest Kellgren-Lawrence grade (2, 3 or 4) will be included as fixed effects.
A listing of subjects with mis-matches between the stratification variables entered at randomization and the case report form data (including central lab data for Kellgren-Lawrence grade) will be provided. In analysis models, the strata entered at randomization will be used, but for descriptive summarization of the population and identification of subgroups, the strata as indicated on the case report form data will be used.
For the models analyzing the amount and number of days of rescue medication use the model will include terms for Baseline WOMAC Pain, Baseline diary average pain, and stratification factors.
The analysis of the incidence of treatment discontinuation due to lack of efficacy will include … model terms for Baseline WOMAC Pain subscale score, Baseline diary average pain score, index joint, Kellgren-Lawrence grade, and treatment group.
For categorical/binary response endpoints relating to WOMAC Pain and PGA, the corresponding Baseline WOMAC Pain or PGA value will be used as a covariate in the analysis model, in addition to the stratification parameters of index joint and highest Kellgren-Lawrence grade, as well as Baseline diary average pain. For the OMERACT response endpoint, the Baseline WOMAC Pain subscale score and Baseline diary average
0901
77e1
900c
692f
\App
rove
d\Ap
prov
ed O
n: 2
1-D
ec-2
018
18:2
3 (G
MT)
0901
77e1
910c
8bd2
\App
rove
d\A
ppro
ved
On:
06-
Jun-
2019
06:
52 (
GM
T)
Protocol A4091057 (PF-04383119) Statistical Analysis Plan
PFIZER CONFIDENTIALPage 15
pain score will be used as covariates in the analysis model, in addition to the stratification parameters of index joint and highest Kellgren-Lawrence grade.
Additional analyses of the three co-primary endpoints will examine the treatment interactions with Study site, and Country.
3.5. Safety Endpoints
• Adverse Events.
• Standard safety assessments (safety laboratory testing [chemistry, hematology], sitting vital signs, electrocardiogram (ECG; 12-lead).
• Joint Safety Adjudication outcomes.
• Total joint replacements.
• Orthostatic (supine/standing) blood pressure assessments.
• Survey of Autonomic Symptom scores.
• Neurologic exam (Neuropathy Impairment Score [NIS]).
• Anti-tanezumab antibody assessments.
• Physical examinations.
3.5.1. Adverse EventsAn adverse event is considered treatment emergent relative to a given treatment if:
• The event occurs for the first time during the effective duration of treatment and was not seen prior to the start of treatment (for example, during the baseline or run-in period), or
• The event was seen prior to the start of treatment but increased in severity during treatment.
The effective duration of treatment is determined by the lag time. Any event occurring within the lag time, whether this occurs during a break in treatment or at the end of treatment, is attributed to the corresponding treatment period. An infinite lag will be used for the study,meaning any treatment-emergent AE reported in the database will be included in tables of AEs up to end of study.
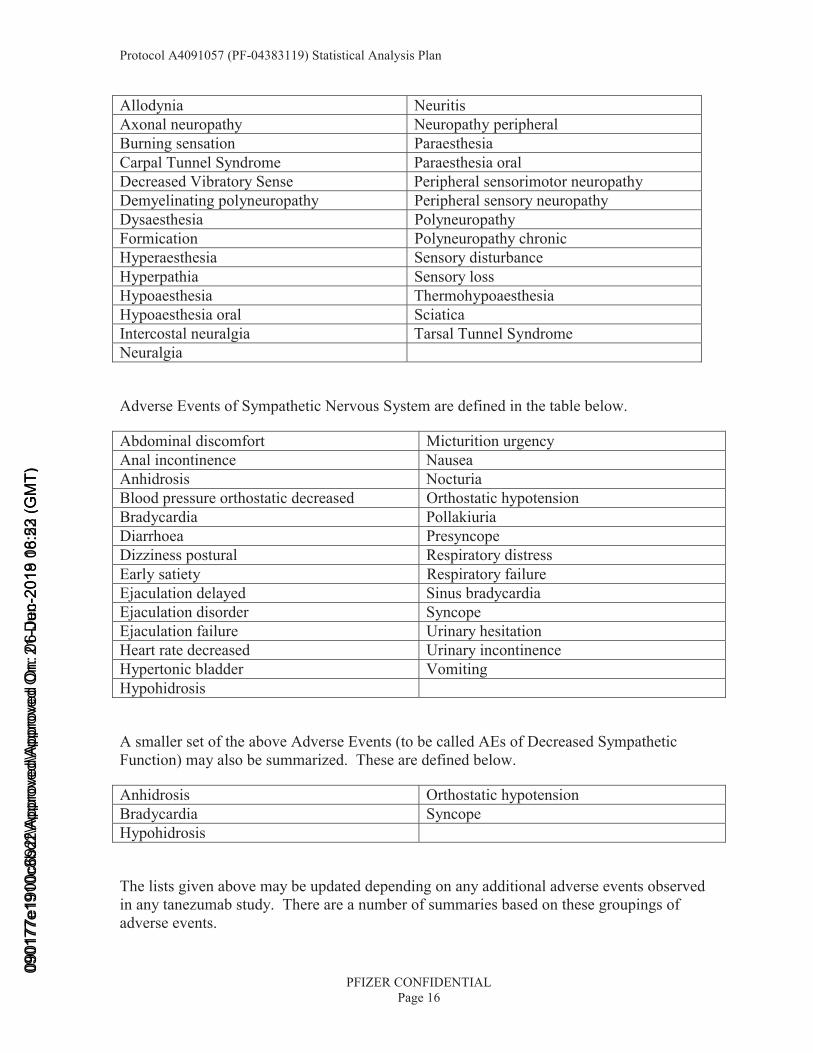
The adverse events of Abnormal Peripheral Sensation (APS) are defined in the table below.
0901
77e1
900c
692f
\App
rove
d\Ap
prov
ed O
n: 2
1-D
ec-2
018
18:2
3 (G
MT)
0901
77e1
910c
8bd2
\App
rove
d\A
ppro
ved
On:
06-
Jun-
2019
06:
52 (
GM
T)
Protocol A4091057 (PF-04383119) Statistical Analysis Plan
PFIZER CONFIDENTIALPage 16
Allodynia NeuritisAxonal neuropathy Neuropathy peripheralBurning sensation ParaesthesiaCarpal Tunnel Syndrome Paraesthesia oralDecreased Vibratory Sense Peripheral sensorimotor neuropathyDemyelinating polyneuropathy Peripheral sensory neuropathyDysaesthesia PolyneuropathyFormication Polyneuropathy chronicHyperaesthesia Sensory disturbanceHyperpathia Sensory lossHypoaesthesia ThermohypoaesthesiaHypoaesthesia oral SciaticaIntercostal neuralgia Tarsal Tunnel SyndromeNeuralgia
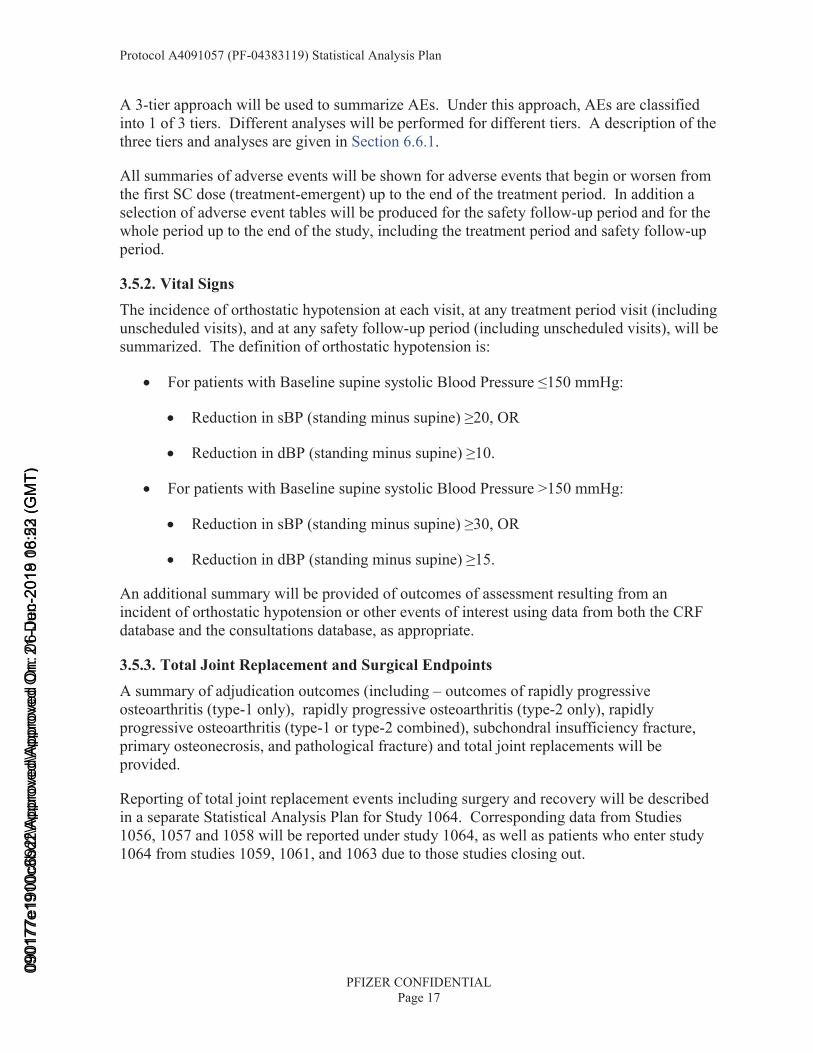
Adverse Events of Sympathetic Nervous System are defined in the table below.
Abdominal discomfort Micturition urgencyAnal incontinence NauseaAnhidrosis NocturiaBlood pressure orthostatic decreased Orthostatic hypotensionBradycardia PollakiuriaDiarrhoea PresyncopeDizziness postural Respiratory distressEarly satiety Respiratory failureEjaculation delayed Sinus bradycardiaEjaculation disorder SyncopeEjaculation failure Urinary hesitationHeart rate decreased Urinary incontinenceHypertonic bladder VomitingHypohidrosis
A smaller set of the above Adverse Events (to be called AEs of Decreased Sympathetic Function) may also be summarized. These are defined below.
Anhidrosis Orthostatic hypotensionBradycardia SyncopeHypohidrosis
The lists given above may be updated depending on any additional adverse events observed in any tanezumab study. There are a number of summaries based on these groupings of adverse events.
0901
77e1
900c
692f
\App
rove
d\Ap
prov
ed O
n: 2
1-D
ec-2
018
18:2
3 (G
MT)
0901
77e1
910c
8bd2
\App
rove
d\A
ppro
ved
On:
06-
Jun-
2019
06:
52 (
GM
T)
Protocol A4091057 (PF-04383119) Statistical Analysis Plan
PFIZER CONFIDENTIALPage 17
A 3-tier approach will be used to summarize AEs. Under this approach, AEs are classified into 1 of 3 tiers. Different analyses will be performed for different tiers. A description of the three tiers and analyses are given in Section 6.6.1.
All summaries of adverse events will be shown for adverse events that begin or worsen from the first SC dose (treatment-emergent) up to the end of the treatment period. In addition a selection of adverse event tables will be produced for the safety follow-up period and for the whole period up to the end of the study, including the treatment period and safety follow-up period.
3.5.2. Vital SignsThe incidence of orthostatic hypotension at each visit, at any treatment period visit (including unscheduled visits), and at any safety follow-up period (including unscheduled visits), will besummarized. The definition of orthostatic hypotension is:
• For patients with Baseline supine systolic Blood Pressure ≤150 mmHg:
• Reduction in sBP (standing minus supine) ≥20, OR
• Reduction in dBP (standing minus supine) ≥10.
• For patients with Baseline supine systolic Blood Pressure >150 mmHg:
• Reduction in sBP (standing minus supine) ≥30, OR
• Reduction in dBP (standing minus supine) ≥15.
An additional summary will be provided of outcomes of assessment resulting from an incident of orthostatic hypotension or other events of interest using data from both the CRF database and the consultations database, as appropriate.
3.5.3. Total Joint Replacement and Surgical Endpoints A summary of adjudication outcomes (including – outcomes of rapidly progressive osteoarthritis (type-1 only), rapidly progressive osteoarthritis (type-2 only), rapidly progressive osteoarthritis (type-1 or type-2 combined), subchondral insufficiency fracture, primary osteonecrosis, and pathological fracture) and total joint replacements will be provided.
Reporting of total joint replacement events including surgery and recovery will be described in a separate Statistical Analysis Plan for Study 1064. Corresponding data from Studies 1056, 1057 and 1058 will be reported under study 1064, as well as patients who enter study 1064 from studies 1059, 1061, and 1063 due to those studies closing out.
0901
77e1
900c
692f
\App
rove
d\Ap
prov
ed O
n: 2
1-D
ec-2
018
18:2
3 (G
MT)
0901
77e1
910c
8bd2
\App
rove
d\A
ppro
ved
On:
06-
Jun-
2019
06:
52 (
GM
T)
Protocol A4091057 (PF-04383119) Statistical Analysis Plan
PFIZER CONFIDENTIALPage 18
3.5.4. Neurological Endpoints The Neuropathy Impairment Score (NIS) is the sum of scores over all 37 items from both the Left and Right side. Items 1-24 are scored on a 0-4 scale (0, 1, 2, 3, 3.25, 3.5, 3.75, 4) and items 25-37 are scored on a 0-2 scale (0, 1, 2). The possible range of the NIS is 0-244.
The Survey of Autonomic Symptoms (SAS) is a 12 item (11 for females) questionnaires. From this the total number of symptoms (0-12 for males and 0-11 for females) will be calculated. Where a patient has a symptom, the impact of that symptom is then rated from 1 (‘not at all’) to 5 (‘a lot’). The total impact score is calculated using this 1-5 scale, with 0 assigned where the patient does not have the particular symptom. The range for the total impact score is 0-60 for males and 0-55 for females.
4. ANALYSIS SETSData for all subjects will be assessed to determine if subjects meet the criteria for inclusion in each analysis population prior to unblinding and releasing the database and classifications will be documented per standard operating procedures.
If a subject was:
• Randomized but not treated, then that subject will be excluded from all efficacy and safety analyses.
• Treated but not randomized, then by definition that subject will be excluded from the efficacy analyses, but will be reported under the treatment they actually received for all safety analyses.
• Randomized but received incorrect treatment, then that subject will be reported under their randomized treatment group for all efficacy analyses, but will be evaluated on a case-by-case basis for presentation for safety analyses. Decisions will be made before unblinding.
4.1. Full Analysis SetThe intent to treat (ITT) analysis set is the primary analysis set for efficacy analyses. It consists of all randomized subjects who received at least one dose of SC study medication (either tanezumab or placebo SC). This analysis set is used in the presentations of all efficacy data, and all data listings, and is labeled as the ‘ITT Analysis Set’ or ‘ITT Population’.
4.2. Per Protocol Analysis Set The per-protocol (PP) analysis set is the secondary efficacy analysis set. It is defined as all subjects in the ITT analysis set who are not major protocol deviators (which would potentially affect efficacy). The criteria for major protocol deviators are described below in Sections 4.2.1 and 4.2.2. The identification of specific subjects included and excluded (and reason for exclusion) for this analysis set will be made and documented prior to unblinding. Protocol deviations for the PP analysis set will be obtained from the collected list of potentially important protocol deviations, and this list will comprise deviations identified
0901
77e1
900c
692f
\App
rove
d\Ap
prov
ed O
n: 2
1-D
ec-2
018
18:2
3 (G
MT)
0901
77e1
910c
8bd2
\App
rove
d\A
ppro
ved
On:
06-
Jun-
2019
06:
52 (
GM
T)

Protocol A4091057 (PF-04383119) Statistical Analysis Plan
PFIZER CONFIDENTIALPage 19
from review of programmed potentially important protocol deviation listing and study monitoring. This analysis set is used in a specific sensitivity analysis of the co-primary efficacy endpoints, and is labeled as the ‘Per Protocol Population’.
Any other major deviation which is not pre-specified below, but results in a subject being excluded from the PP analysis set, will be specified in the protocol deviations document which is completed prior to unblinding.
The following protocol deviations are defined as ‘major’ and would exclude a subject from the PP analysis set. These deviation criteria can be split into those assessed prior to randomization relating to the protocol inclusion and exclusion criteria, and those assessed post randomization.
4.2.1. Major Deviations Assessed Prior to Randomization
• Inclusion criteria: #3-5.
• Exclusion criteria: #3, 4 (if any of the following conditions are in the index joint: severe chondrocalcinosis, other arthropathies [eg, rheumatoid arthritis], systemic metabolic bone disease [eg, pseudogout, Paget’s disease, metastatic calcifications], primary or metastatic tumor lesions, stress or traumatic fracture), 10, 14, 15, 16 (if index joint was involved), 17.
• Randomization criteria: #1, 3-6. Note, subjects with missing Baseline data for any of the co-primary endpoints would not meet the randomization/inclusion criteria for Baseline co-primary endpoints and so would be defined as a deviation according to these criteria.
4.2.2. Major Deviations Assessed Post-Randomization
• Mismatch in specification of index joint in the CRF vs. electronic tablet for WOMAC data collection.
• Rescue medication taken within 24 hours prior to the Week 24 visit.
• Prohibited medications that could affect pain and function assessments (protocol section 5.7.1) taken (i) within 48 hours prior to Week 24 visit for non-NSAID medications (or any use if long-acting, eg, Synvisc), or (ii) within 48 hours prior to Week 24 visit or within the wash-out period specified by Appendix 3 of the protocol, for NSAID medications.
In addition, unforeseen major protocol deviations may be added to this list. However the final definition of this criteria and the per-protocol population will be made prior to unblinding of this study.
0901
77e1
900c
692f
\App
rove
d\Ap
prov
ed O
n: 2
1-D
ec-2
018
18:2
3 (G
MT)
0901
77e1
910c
8bd2
\App
rove
d\A
ppro
ved
On:
06-
Jun-
2019
06:
52 (
GM
T)
Protocol A4091057 (PF-04383119) Statistical Analysis Plan
PFIZER CONFIDENTIALPage 20
4.3. Safety Analysis SetThe safety analysis set is defined as all subjects treated with tanezumab or placebo SC (see beginning of Section 4 for further details). This analysis set will be labeled as the ‘SafetyAnalysis Set’ or ‘Safety Population’ in the corresponding data analyses and summary presentations.
4.4. Other Analysis SetsNot applicable.
5. GENERAL METHODOLOGY AND CONVENTIONS5.1. Hypotheses and Decision Rules5.1.1. Statistical HypothesesThe treatment comparisons being made in this study are tanezumab 2.5 mg and 5 mg versus placebo. For these treatment comparisons, the null and alternative hypotheses are shown below (note μTREATMENT relates to the mean change from Baseline for the specified treatment group). All tests will be 2-sided.
Null Hypotheses H0: 0PLACEBO2.5mg TANEZUMAB =− μμ
H0: 0PLACEBO5mg TANEZUMAB =− μμ
Alternative Hypotheses H1: 0PLACEBO2.5mg TANEZUMAB ≠− μμ
H1: 0PLACEBO5mg TANEZUMAB ≠− μμ
The hypotheses for other types of analyses (eg, for the binary response endpoints) would be similar to those shown above.
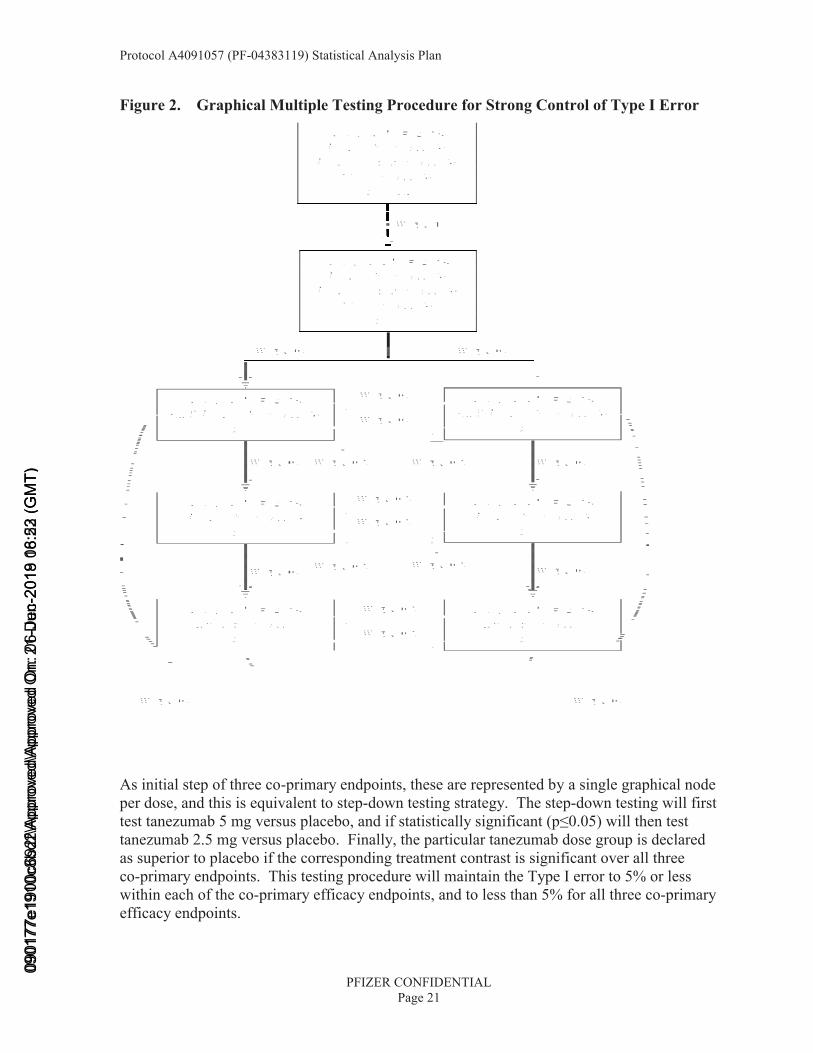
5.1.2. Statistical Decision RulesIn addition to three co-primary endpoints in Section 3.1, three secondary endpoints of subjects with ≥50% reduction from baseline in WOMAC Pain at Week 24, change from baseline to Week 2 in the WOMAC Pain subscale, and change from baseline to Week 1 in average pain score in the index knee or hip, are identified as key secondary endpoints. The testing of these co-primary endpoints and key secondary endpoints will follow the graphical approach of gate keeping strategy proposed by Bretz et al (2011)2, as depicted in the following figure. This will be implemented to control the family-wise type I error rate of 5% (two-sided), and this graphical approach is a closed testing procedure; hence, it strongly controls the family-wise error rate (Alosh et al. 2014).1
0901
77e1
900c
692f
\App
rove
d\Ap
prov
ed O
n: 2
1-D
ec-2
018
18:2
3 (G
MT)
0901
77e1
910c
8bd2
\App
rove
d\A
ppro
ved
On:
06-
Jun-
2019
06:
52 (
GM
T)
Protocol A4091057 (PF-04383119) Statistical Analysis Plan
PFIZER CONFIDENTIALPage 21
Figure 2. Graphical Multiple Testing Procedure for Strong Control of Type I Error
As initial step of three co-primary endpoints, these are represented by a single graphical node per dose, and this is equivalent to step-down testing strategy. The step-down testing will first test tanezumab 5 mg versus placebo, and if statistically significant (p≤0.05) will then test tanezumab 2.5 mg versus placebo. Finally, the particular tanezumab dose group is declared as superior to placebo if the corresponding treatment contrast is significant over all three co-primary endpoints. This testing procedure will maintain the Type I error to 5% or less within each of the co-primary efficacy endpoints, and to less than 5% for all three co-primary efficacy endpoints.
0901
77e1
900c
692f
\App
rove
d\Ap
prov
ed O
n: 2
1-D
ec-2
018
18:2
3 (G
MT)
0901
77e1
910c
8bd2
\App
rove
d\A
ppro
ved
On:
06-
Jun-
2019
06:
52 (
GM
T)
Protocol A4091057 (PF-04383119) Statistical Analysis Plan
PFIZER CONFIDENTIALPage 22
If the null hypothesis is not rejected in the above graphical multiple testing procedure, no further testing is conducted as the α for that test is considered “spent” and cannot be passed to other endpoints. The testing process continues as long as at least one null hypothesis can be rejected at its assigned α-level. Each time a null hypothesis is rejected, the graph is updated to reflect the reallocation of α assigned to that hypothesis, which is considered “recycled” (Alosh et al. 2014).1 This iterative process of updating the graph and reallocating α is repeated until all key secondary hypotheses have been tested or when no remaining hypotheses can be rejected at their corresponding α level.
The primary analysis will be that with the multiple imputation approach (see below for details), and thus the overall type I error is controlled for each of the two doses (2.5 mg and 5 mg) since all three co-primary endpoints need to be significant for a single dose. The overall type I error of the study is also controlled given the step-down testing strategy for each of the endpoints. Control of the family wise type I error rate accounting for multiplicity of contrasts will only apply to the three co-primary endpoints (model with the primary imputation analysis) and three key secondary endpoints.
Regardless of the outcome of the primary analyses and three key secondary endpoints, the secondary endpoints will be tested. No adjustment for multiple comparisons will be made for the secondary efficacy, and for the safety endpoints. The α-level for each hypothesis test for the secondary and exploratory analyses will be 5%.
5.2. General Methods Subjects will be randomized at Baseline to one of three treatment groups: placebo SC, tanezumab 2.5 mg SC, or tanezumab 5 mg SC. These will be labeled as placebo, tanezumab 2.5mg, and tanezumab 5mg for the three treatment groups respectively.
A modified treatment-policy estimands strategy is applied as the main strategy to assess effectiveness of tanezumab. Data collected will be included for efficacy assessment regardless of rescue medication being used or not.
The general study design for efficacy, as depicted below, includes a planned treatment period through the Week 24 visit, and a planned 24-week post-treatment safety follow-up period. Efficacy data planned to be collected during this post-treatment safety follow-up period are intended to have efficacy measures contemporaneous to safety observations during this period. They are not intended to assess treatment effects or compare treatment groups. All endpoints up to Week 32 will be summarized (where available), and endpoints up to Week 24will be analyzed.
0901
77e1
900c
692f
\App
rove
d\Ap
prov
ed O
n: 2
1-D
ec-2
018
18:2
3 (G
MT)
0901
77e1
910c
8bd2
\App
rove
d\A
ppro
ved
On:
06-
Jun-
2019
06:
52 (
GM
T)
Protocol A4091057 (PF-04383119) Statistical Analysis Plan
PFIZER CONFIDENTIALPage 23
1057 study visits/analysis windows
Week B 2 4 8 12 16 24 32 48Study Day 1 15 29 57 85 113 169 225 337
Completer x x x x x x x x Drop after week 8 dose
x x x x x ET1
x ET2
Drop after day 1 dose
x x x x ET1
xET2
B is baseline, x is collection of most efficacy endpoints, and ET is “Early Termination Visit.”
The method and definition of reporting windows for assigning efficacy data to particular time points is described in Appendix 2.1.
All efficacy assessments during the treatment period are made on the analysis windows defined in Appendix 2.1. Using these windows we find the analysis window for a patient’s last subcutaneous (SC) dose. Any data included in a window that is up to 8 weeks from this last SC dose window is ‘on-treatment’, and any data included in a window that is more than 8 weeks after the last SC dose window is ‘off-treatment’. Data in on-treatment analysis windows will be used in summaries and analyses, while data in off-treatment analysis windows will be excluded from all summaries and analyses of treatment period efficacy data, ie, up to Week 24.
For example, the table below shows on-treatment and off-treatment windows for the planned collection visits for the WOMAC data during the treatment period:
Last SC Dose Analysis Window
On-treatment Analysis Window Data
Off-treatment Analysis Window Data
Baseline Weeks 2, 4, 8 Weeks 12, 16, 24Week 2 Weeks 2, 4, 8 Weeks 12, 16, 24Week 4 Weeks 2, 4, 8, 12 Weeks 16, 24Week 8 Weeks 2, 4, 8, 12, 16 Week 24Week 12 Weeks 2, 4, 8, 12, 16 Week 24Week 16 Weeks 2, 4, 8, 12, 16, 24 NoneWeek 24 Weeks 2, 4, 8, 12, 16, 24 None
Efficacy data at Week 32 is planned to be off-treatment so will not be subject to the above handling, ie, all available data in the Week 32 window will be used in summaries.
Efficacy data collected via subject diary (NRS pain scores and rescue medication use) are collected daily or weekly, not at study visits. Diary efficacy data will be considered on-treatment if it is collected up to 12 weeks (84 days) after the last SC dose. Diary efficacy data collected more than 12 weeks (84 days) after the last SC dose will be considered off-treatment and excluded from summaries and analyses of treatment period efficacy data, ie, for presentation up to Week 24.
Diary data after Week 24 is planned to be off-treatment so will not be subject to the above handling, ie, all available data after Week 24 window will be used in summaries.
0901
77e1
900c
692f
\App
rove
d\Ap
prov
ed O
n: 2
1-D
ec-2
018
18:2
3 (G
MT)
0901
77e1
910c
8bd2
\App
rove
d\A
ppro
ved
On:
06-
Jun-
2019
06:
52 (
GM
T)
Protocol A4091057 (PF-04383119) Statistical Analysis Plan
PFIZER CONFIDENTIALPage 24
A summary of all analyses is given in Appendix 1. In all tables the treatment group ordering will be: placebo, tanezumab 2.5mg, tanezumab 5mg. Unless otherwise specified, efficacy analyses use the ITT analysis set only.
5.2.1. Analyses for Binary DataBinary response parameters, and the incidence of rescue medication use and treatment discontinuation due to lack of efficacy will be analyzed using logistic regression for binary data, with covariates described in Section 3.4.1. Output will show the number and percentage of subjects in each response category, and odds ratios (with 95% confidence intervals) for the treatment comparisons shown in Section 5.1.1.
The OMERACT-OARSI responder index, and subject response endpoints of improvement in the WOMAC Pain ≥30, 50, 70 and 90%, WOMAC Physical Function ≥30, 50, 70 and 90%, and improvement in the Patient’s Global Assessment of Osteoarthritis ≥2 will be analyzed for change from Baseline to Weeks 2, 4, 8, 12, 16, and 24 using logistic regression for binary data, with model terms for Baseline WOMAC Pain subscale score, Baseline WOMAC Physical Function or Baseline Patient’s Global Assessment score (Baseline WOMAC Pain for OMERACT-OARSI responder index), Baseline Diary Average Pain, index joint, Kellgren-Lawrence grade and treatment group. The cumulative distribution of percent change to Weeks 16 and 24 in the WOMAC Pain subscale score and WOMAC Physical Function subscale score will be summarized for the response categories of reductions of >0%, ≥10 to 90% (in steps of 10%) and 100% (no reported pain or difficulties at timepoint of interest). Imputation for missing data will use both LOCF and BOCF, where imputation with BOCF will lead to the subject being assessed as a nonresponder for the response endpoint at a particular timepoint. In addition, in order to closely match the primary imputation analysis, a mixed BOCF/LOCF imputation for response endpoints will be used. In this analysis BOCF imputation (ie, a subject would be a nonresponder) would be used for missing data due to discontinuation for reasons of lack of efficacy (‘Insufficient Clinical Response’ on the End of Treatment Subject Summary Case Report form), adverse event or death up to the timepoint of interest, and LOCF imputation would be used for missing data for any other reason.
The use of BOCF for missing data implies subjects with missing data are included in the analysis as non-responders. Similarly the use of LOCF in the case where subjects have no post-Baseline data (and Baseline would be carried forward) again implies those subjects are included in the analysis as non-responders.
The incidence … of rescue medication use will be analyzed for Weeks 2, 4, 8, 12, 16, and 24. The incidence of use of rescue medication will be analyzed using logistic regression for binary data, with model terms for Baseline WOMAC Pain subscale score, Baseline Diary Average Pain, index joint, Kellgren-Lawrence grade and treatment group... Imputation for missing rescue medication data will use LOCF only. The incidence … of rescue medication use will be summarized up to Week 32...
The incidence of…treatment withdrawal due to lack of efficacy will also be analyzed fordiscontinuation up to Week 24 (end of treatment period)... The analysis of the incidence of
0901
77e1
900c
692f
\App
rove
d\Ap
prov
ed O
n: 2
1-D
ec-2
018
18:2
3 (G
MT)
0901
77e1
910c
8bd2
\App
rove
d\A
ppro
ved
On:
06-
Jun-
2019
06:
52 (
GM
T)
Protocol A4091057 (PF-04383119) Statistical Analysis Plan
PFIZER CONFIDENTIALPage 25
discontinuation due to lack of efficacy will be made using logistic regression for binary data, with model terms for baseline WOMAC Pain subscale score, Baseline Diary Average Pain, index joint, Kellgren-Lawrence grade and treatment group. Discontinuation in the post-treatment safety follow-up period will not be included in this endpoint for analysis, but will be summarized as part of the safety tables.
5.2.2. Analyses for Continuous DataThe co-primary efficacy endpoints will be analyzed using an ANCOVA model, with model terms for Baseline score, Baseline diary average pain, index joint (knee or hip), highest Kellgren Lawrence grade, and treatment group, and study site as a random effect. The assessment of significance for the tanezumab SC versus placebo treatment contrasts will use a step-down testing strategy within each of the co-primary efficacy endpoints defined as first testing tanezumab 5 mg versus placebo, and if statistically significant (p≤0.05) to then test tanezumab 2.5 mg versus placebo. Finally, a tanezumab treatment group is declared as superior to placebo if the corresponding treatment contrast is significant over all three co-primary endpoints. This testing procedure will maintain the Type I error to 5% or less within each of the co-primary efficacy endpoints, and to less than 5% for all three co-primary efficacy endpoints. An additional (main effects ANCOVA) analysis for each of the co-primary efficacy endpoints will use a per-protocol analysis set, which will exclude subjects who are major protocol deviators.
The primary analysis of the co-primary endpoints will use multiple imputation for missing data, to account for uncertainty around the subject response. The basis for imputing missing values will be dependent on the reasons for missing data. For subjects with missing data due to discontinuation prior to Week 24 for lack of efficacy or for an adverse event or death, imputation will be based on sampling from a normal distribution using a mean value equal to the subject’s Baseline efficacy value and the standard deviation (over all treatment groups) of the observed efficacy data at Week 24. For subjects with missing data for any other reason, imputation will be based on sampling from a normal distribution using a mean value equal to the subject’s last observed efficacy value and standard deviation (over all treatment groups) of the observed efficacy data at Week 24. Imputed values for the Patient’s Global Assessment of Osteoarthritis will be rounded to integer values from 1 to 5. Imputed values for WOMAC Pain and Physical Function will be truncated at 0 and 10. One hundred imputation samples will be used, and the ANCOVA model described above will be used for each imputation dataset. The final results will be calculated using the combined sets of results from each imputation dataset analysis.
The primary analysis set is the Intent to Treat analysis set. These three primary endpoint analyses will be used to assess the primary objective of the study.
The mixed model ANCOVA, with multiple imputation, will also be used with other continuous change from Baseline endpoints for landmark (single time point) analyses. The model will include the covariates described in Section 3.4.1, including study site as a randomeffect. Estimates of treatment effects and pair wise treatment comparisons will be based on least squares means (LS means) and 95% confidence intervals (CI) will be provided.
0901
77e1
900c
692f
\App
rove
d\Ap
prov
ed O
n: 2
1-D
ec-2
018
18:2
3 (G
MT)
0901
77e1
910c
8bd2
\App
rove
d\A
ppro
ved
On:
06-
Jun-
2019
06:
52 (
GM
T)
Protocol A4091057 (PF-04383119) Statistical Analysis Plan
PFIZER CONFIDENTIALPage 26
A number of sensitivity analyses will be performed on the primary efficacy endpoints in order to assess the robustness of the conclusions for the primary objective. These relate to the analyses for missing data and the analysis population, the homogeneity of the results across factors that may influence efficacy, and for a secondary analysis of the PGA. The analyses described below will not be subject to the testing strategy described for multiple comparisons of the primary analyses. As such, assessment of all treatment comparisons will be made independent of results over the three co-primary endpoints or the two treatment comparisons for each analysis.
Primary Endpoint Sensitivity Analyses
The ITT analysis set is used in the analyses numbered 2 and 3 below, and Per-Protocol analysis set used in analysis number 1 below.
1. Per-Protocol Analysis Set
The primary analysis using multiple imputation described above will be repeated, but using the Per-Protocol analysis set in place of the ITT analysis set. This analysis will assess the robustness of the efficacy conclusions to subjects who have more strictly adhered to protocol inclusion and exclusion criteria, and to protocol defined study procedures.
2. Alternative Missing Data Analyses
There are four additional analyses that will assess the robustness of the efficacy conclusions to the choice of multiple imputation as the primary method for accounting for missing data.
In the first and second analyses, the primary ANCOVA analysis model described above will be repeated, but using BOCF and LOCF respectively for missing data (note these are single imputation analyses).
The third sensitivity analysis for the primary endpoints will use a mixed model repeated measures analysis using the observed and imputed data up to Week 24 from the primary multiple imputation analysis, with covariate terms for Time (study week, treated as a categorical variable), Treatment Group and Time-by-Treatment interaction, as well as the covariates described in Section 3.4.1. The unstructured covariance will be used in the modeling of the within-subject errors in the analysis. Even though this is a sensitivity analysis for the primary endpoints, estimates for the time points of Weeks 2, 4, 8, 12, and 16, in addition to Week 24 will be shown from this analysis. See Appendix 2.1 for details on windows.
The forth sensitivity analysis for the primary endpoints will use a mixed model repeated measures analysis using all observed data up to Week 24 (ie, retrieved dropout), with covariate terms for Time (study week, treated as a categorical variable), Treatment Group and Time-by-Treatment interaction, as well as the covariates described in Section 3.4.1. The unstructured covariance will be used in the modeling of the within-subject errors in the analysis.
0901
77e1
900c
692f
\App
rove
d\Ap
prov
ed O
n: 2
1-D
ec-2
018
18:2
3 (G
MT)
0901
77e1
910c
8bd2
\App
rove
d\A
ppro
ved
On:
06-
Jun-
2019
06:
52 (
GM
T)
Protocol A4091057 (PF-04383119) Statistical Analysis Plan
PFIZER CONFIDENTIALPage 27
A summary of the missing data pattern will be shown for the WOMAC Pain and Physical Function subscales and the PGA over Baseline and Weeks 2, 4, 8, 12, 16, and 24. This summary will show the incidence of subjects with each pattern of observed and missing data over these visits and endpoints. This summary will be shown overall, and split by treatment group.
3. Interaction Analyses
Interaction analyses will be performed for the co-primary endpoints, exploring the effect ofStudy site and Country. These analyses will fit the covariate terms described in Section 3.4.1(except for use of Study site as a covariate in the Country interaction analysis, where Country will be used instead [as a fixed term], in addition to the interaction term of treatment group by factor. The Treatment by Study site interaction term will be fitted as a random effect.
The interaction of Treatment with Study site will be fitted as a random effect (in addition to Study site itself), with the resulting estimated treatment differences being shown for the largest (pertaining to enrollment) study sites to illustrate the level of consistency of treatment benefit across the larger study sites. The study sites to be examined in this way will be any site with an average of four or more subjects per treatment group within the site, which for this study relates to any site with 12 or more subjects in total. This assessment will be made prior to unblinding, therefore a study site in this group may still have fewer than four subjects in one or more of the treatment groups, however that site will still be included in this summary of efficacy of the largest study sites. To aid the interpretation of the treatment-site and treatment-country interactions, a summary of the efficacy data for each co-primary endpoint by treatment group will be shown for the sites with ≥12 subjects and also for the countries with ≥15 subjects over all treatment groups.
Other time points for the primary efficacy measure
The ANCOVA model described above for the co-primary endpoints, using covariates ofBaseline score, Baseline diary average pain, Index Joint, Highest KL grade (2, 3 or 4) and Treatment, with Study Site as a random variable, will be used in the analysis of WOMAC Pain, WOMAC Physical Function and PGA for the change from Baseline to Weeks 2, 4, 8, 12, and 16. This analysis will be produced using multiple imputation, and BOCF and LOCF for missing data.
The MMRM analysis described above will also analyze results for the secondary time points of Weeks 2, 4, 8, 12 and 16, for the co-primary efficacy endpoints.
Exploratory Analyses of WOMAC Physical Function Subscale
For WOMAC physical functions questionnaire from Q through Q , the 90 subjects answered them with missing last sentence
in Spanish version until January 5 2017. To evaluate the impact of this missing sentence, the following analysis about WOMAC physical functionsubscale will be conducted.
0901
77e1
900c
692f
\App
rove
d\Ap
prov
ed O
n: 2
1-D
ec-2
018
18:2
3 (G
MT)
CC
CCICCI
0901
77e1
910c
8bd2
\App
rove
d\A
ppro
ved
On:
06-
Jun-
2019
06:
52 (
GM
T)
Protocol A4091057 (PF-04383119) Statistical Analysis Plan
PFIZER CONFIDENTIALPage 28
• The mixed model ANCOVA, with multiple imputation, will be conducted with change from baseline to week 24. The model will include the covariates described in Section 3.4.1 (including study site as random effects), the subgroup of missing last sentence (See the below bullet for definition), and the interaction of treatment by the subgroup of missing last sentence (p-value of interaction term will be calculated by imputation and will be summarized.). There are two categories of this subgroup defined as below sub-bullets;
• If a subject answered questionnaires with full sentence at both baseline and post-baseline (week 24), then the subject will be categorized as “the subject who answered them with full sentence”.
• If a subject answered questionnaires with missing last sentence but answered them with full sentence at week 24 or if a subject answered questionnaires with missing last sentence at baseline and at week 24, then the subject will be categorized as “the subject who answered them with missing last sentence”.
• Descriptive statistics of change from baseline of each treatment group at week 24visit will be summarized using the same subgroup categories of ANCOVA.
• Descriptive statistics of raw value of each treatment group at baseline and at week 24will be summarized using the same subgroup categories of ANCOVA.
Secondary Endpoint Analyses
Other secondary endpoints include the WOMAC Stiffness subscale, WOMAC Average score and WOMAC Pain subscale items (Pain When Walking on a Flat Surface, and Pain When Going Up or Down Stairs), conducted for the change from Baseline to Weeks 2, 4, 8, 12, 16,and 24. Analysis of Average Pain in the index joint will be conducted for the change from Baseline to Days 1, 2, 3, 4, 5, 6, and 7 and to Weeks 1, 2, 3, 4, 6, 8, 10, 12, 16, 20, and 24. The analysis of these endpoints will use the same ANCOVA analysis as described above for the co-primary endpoints, with multiple imputation for missing data, and using the additional covariate of baseline diary average pain score.
The rescue medication data will be converted to Weekly scores for the week prior to the timepoint of interest. Calculation of the endpoints is described in Appendix 3.
The … number of days per week of rescue medication use will be analyzed for Weeks 2, 4, 8, 12, 16, and 24, and the amount of rescue medication use per week will be analyzed for Weeks 2, 4, 8, 12 16 and 24… The number of days and amount of rescue medication (mg dosage of acetaminophen) will be analyzed using the Negative Binomial model, with model terms of Baseline WOMAC Pain subscale score, Baseline Diary Average Pain, index joint, Kellgren-Lawrence grade, and treatment group. In this model the error term is defined with a negative binomial distribution, and ‘log’ is used as the link function. Estimated levels of rescue medication use will be shown for each treatment group, and the ratio (with 95% CI) for comparisons versus placebo will be shown. Imputation for missing rescue medication data will use LOCF only. For this analysis, Baseline data will not be carried forward in the
0901
77e1
900c
692f
\App
rove
d\Ap
prov
ed O
n: 2
1-D
ec-2
018
18:2
3 (G
MT)
0901
77e1
910c
8bd2
\App
rove
d\A
ppro
ved
On:
06-
Jun-
2019
06:
52 (
GM
T)
Protocol A4091057 (PF-04383119) Statistical Analysis Plan
PFIZER CONFIDENTIALPage 29
case of a post-Baseline observation not being available for use in LOCF. The … number of days of rescue medication use will be summarized up to Week 32, and the amount of rescue medication taken in a week summarized up to Week 24.
A table showing number and percentage of subjects will summarize the response for each dimension (item) of the EQ-5D-5L at Baseline and Weeks 8, 16 and 24. These summary tables will be shown by treatment group. In addition, for each treatment and each time point assessed, descriptive statistics (mean, standard deviation, median, number of subjects) will characterize the five-item health status profile on the EQ-5D-5L in terms of the health utility score and the EQ-VAS.
A summary of the change from Baseline to Weeks 8, 16 and 24 in the WPAI:OA impairment scores will be shown by treatment group. This summary will use observed data only (no imputation for missing data). The calculation of these endpoints is described in Appendix 3.
The summary will show number and % of subjects with a decrease, no change, and an increase in score for the change from Baseline to Week 8, 16, and 24 as well as descriptive statistics (mean, standard deviation, median, number of subjects) of the change in addition to the individual time points of Baseline and Week 8, 16, and 24. The 4 WPAI parameters will be analyzed using the ANCOVA model described above for the primary endpoint using covariates of the corresponding Baseline score, Baseline diary average pain, Index Joint, Highest KL grade (2, 3 or 4), and Treatment, with Study Site as a random variable.
The Health Care Resource Utilization (HCRU) at Baseline, Weeks 32 and 48 will be summarized.
5.2.3. Analyses for Categorical DataThe change from Baseline in the Patient’s Global Assessment of Osteoarthritis to Weeks 2, 4, 8, 12, 16, and 24 will also be analyzed using the Cochran-Mantel-Haenszel test (stratified by the combinations of the two stratification factors). Changes by each level of improvement will be summarized, as well as any improvement (change<0), and any worsening (change>0). For this analysis imputation for missing data will used mixed BOCF/LOCF, as well as BOCF and LOCF separately. The mixed BOCF/LOCF analysis at Week 24 will provide a sensitivity analysis for the primary analysis of the PGA.
All data from mPRTI will be summarized by visit. Three items of the mPRTI (patient satisfaction, patient willingness to use drug again; patient preference of drug versus prior treatment in Section 3.2.1) will be analyzed using the Cochran-Mantel-Haenszel test (stratified by the combination of the two stratification factors) at both Weeks 16 and 24.
For any analysis using the CMH test, if there are too few subjects in any stratification combination group (defined as <15 subjects in any of the 6 combinations of stratification factors) then an unstratified test will be performed.
0901
77e1
900c
692f
\App
rove
d\Ap
prov
ed O
n: 2
1-D
ec-2
018
18:2
3 (G
MT)
0901
77e1
910c
8bd2
\App
rove
d\A
ppro
ved
On:
06-
Jun-
2019
06:
52 (
GM
T)
Protocol A4091057 (PF-04383119) Statistical Analysis Plan
PFIZER CONFIDENTIALPage 30
The change from Baseline in the NIS will be analyzed using a Cochran-Mantel-Haenszel (CMH) test for ‘row mean scores differ’, using change from Baseline categories as the scores in the analysis, and stratified by the combined levels of the stratification factors. Output will show number and percentage of subjects whose NIS score worsened (change>0), improved (change<0) or had no change, in addition to the mean (with standard deviation) and median change, and minimum and maximum change. This analysis will be performed for the two treatment comparisons separately, and shown by visit and worst change (largest change from baseline to any post-baseline visit), and by last change (summary statistics only).
5.2.4. Analyses for Time to Event DataThe … time to treatment withdrawal due to lack of efficacy will also be analyzed for discontinuation up to Week 24 (end of treatment period). The time to discontinuation will be analyzed using the log-rank test, with Kaplan-Meier estimates of the time to discontinuation shown for selected percentiles, dependent on the level of discontinuation. The expectation is that these would be the 1st, 2nd, 5th, 10th and 25th percentiles, in addition to the minimum and maximum time to discontinuation. Other percentiles may be shown if the level of discontinuation due to lack of efficacy as calculated using Kaplan-Meier procedure is sufficiently large...
A plot of the time to discontinuation (failure) will be shown using the Kaplan-Meier estimates. Only treatment discontinuation up to the end of treatment period (Week 24 visit or early discontinuation) will be used in this analysis. Discontinuation due to lack of efficacy after the end of treatment visit will be included in the standard safety tables. Time to event for discontinued subjects (discontinuing for reasons other than lack of efficacy) prior to the Week 24 visit uses censoring at the time of discontinuation. Imputation of time to event for completed subjects or discontinued subjects (for any reason) post Week 24 visit uses censoring at the Week 24 visit time point.
5.3. Methods to Manage Missing DataThe three co-primary efficacy endpoints are the changes from Baseline to Week 24 in theWOMAC Pain subscale, the WOMAC Physical Function subscale, and the Patient Global Assessment of Osteoarthritis.
The primary analysis of the co-primary endpoints will use multiple imputation for missing data at Week 24 (where the method for imputation will be dependent on the reason for missing data) followed by the ANCOVA analysis with the model described below for the multiple imputed datasets. The imputation strategies are described in the following table.
While the table describes the multiple imputation strategy specifically for the Week 24 time point, multiple imputation analysis at other time points will use the same strategy but with the appropriate time point, eg, ‘Week 2,’ substituted for ‘Week 24’ in the table below. Efficacy data missing from windows after the Week 24 window, eg, Week 32, will not be imputed for any summary or analysis unless otherwise indicated.
0901
77e1
900c
692f
\App
rove
d\Ap
prov
ed O
n: 2
1-D
ec-2
018
18:2
3 (G
MT)
0901
77e1
910c
8bd2
\App
rove
d\A
ppro
ved
On:
06-
Jun-
2019
06:
52 (
GM
T)
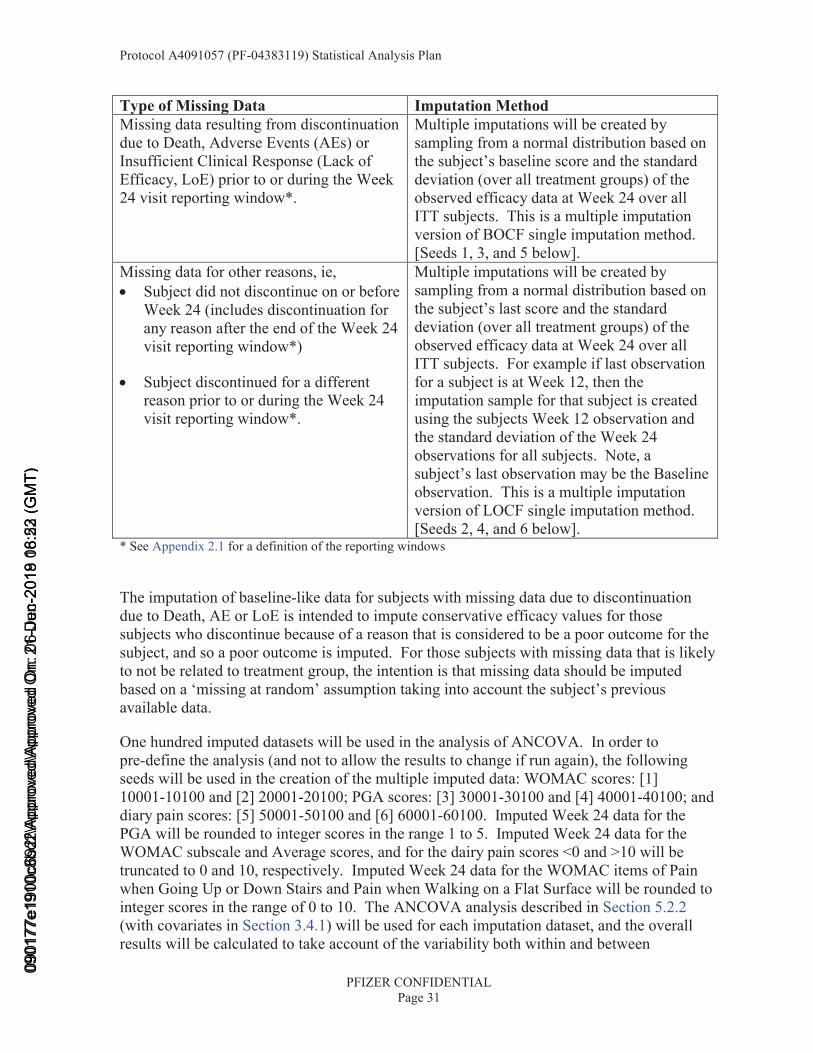
Protocol A4091057 (PF-04383119) Statistical Analysis Plan
PFIZER CONFIDENTIALPage 31
Type of Missing Data Imputation MethodMissing data resulting from discontinuation due to Death, Adverse Events (AEs) or Insufficient Clinical Response (Lack of Efficacy, LoE) prior to or during the Week 24 visit reporting window*.
Multiple imputations will be created by sampling from a normal distribution based on the subject’s baseline score and the standard deviation (over all treatment groups) of theobserved efficacy data at Week 24 over all ITT subjects. This is a multiple imputation version of BOCF single imputation method. [Seeds 1, 3, and 5 below].
Missing data for other reasons, ie,• Subject did not discontinue on or before
Week 24 (includes discontinuation for any reason after the end of the Week 24 visit reporting window*)
• Subject discontinued for a different reason prior to or during the Week 24 visit reporting window*.
Multiple imputations will be created by sampling from a normal distribution based on the subject’s last score and the standard deviation (over all treatment groups) of theobserved efficacy data at Week 24 over all ITT subjects. For example if last observation for a subject is at Week 12, then the imputation sample for that subject is created using the subjects Week 12 observation and the standard deviation of the Week 24 observations for all subjects. Note, a subject’s last observation may be the Baseline observation. This is a multiple imputation version of LOCF single imputation method. [Seeds 2, 4, and 6 below].
* See Appendix 2.1 for a definition of the reporting windows
The imputation of baseline-like data for subjects with missing data due to discontinuation due to Death, AE or LoE is intended to impute conservative efficacy values for those subjects who discontinue because of a reason that is considered to be a poor outcome for the subject, and so a poor outcome is imputed. For those subjects with missing data that is likely to not be related to treatment group, the intention is that missing data should be imputed based on a ‘missing at random’ assumption taking into account the subject’s previous available data.
One hundred imputed datasets will be used in the analysis of ANCOVA. In order to pre-define the analysis (and not to allow the results to change if run again), the following seeds will be used in the creation of the multiple imputed data: WOMAC scores: [1] 10001-10100 and [2] 20001-20100; PGA scores: [3] 30001-30100 and [4] 40001-40100; and diary pain scores: [5] 50001-50100 and [6] 60001-60100. Imputed Week 24 data for the PGA will be rounded to integer scores in the range 1 to 5. Imputed Week 24 data for the WOMAC subscale and Average scores, and for the dairy pain scores <0 and >10 will be truncated to 0 and 10, respectively. Imputed Week 24 data for the WOMAC items of Pain when Going Up or Down Stairs and Pain when Walking on a Flat Surface will be rounded to integer scores in the range of 0 to 10. The ANCOVA analysis described in Section 5.2.2(with covariates in Section 3.4.1) will be used for each imputation dataset, and the overall results will be calculated to take account of the variability both within and between
0901
77e1
900c
692f
\App
rove
d\Ap
prov
ed O
n: 2
1-D
ec-2
018
18:2
3 (G
MT)
0901
77e1
910c
8bd2
\App
rove
d\A
ppro
ved
On:
06-
Jun-
2019
06:
52 (
GM
T)

Protocol A4091057 (PF-04383119) Statistical Analysis Plan
PFIZER CONFIDENTIALPage 32
imputation datasets using standard methods (Little & Rubin, 2002), which are described inAppendix 3.2. This analysis will be used for the co-primary efficacy endpoints at Week 24, plus secondary analyses at other time points, and also for a range of secondary efficacy endpoints at all time points up to Week 24. When using the multiple imputation method described above for time points earlier than Week 24, then the reason for missing data is assessed up to the end of the window for that particular time point (see Appendix 2.1).
Four additional methods will explore the sensitivity of the effect of missing data. The first method of Baseline Observation Carried Forward (BOCF) for missing data at the primary time point of Week 24 will impute the subject’s Baseline value for the Week 24 time point, and therefore a zero change from baseline. If a subject’s baseline data is also missing then that subject’s data remain missing for the post-baseline time point, and the patient would effectively be excluded from the analysis. The second method of Last Observation Carried Forward (LOCF) for missing data at the primary time point of Week 24 will impute the subject’s last observed data value for the efficacy endpoint. With LOCF, if a subject is missing all post-baseline efficacy data for a given efficacy endpoint, then baseline will be carried forward (if baseline is also missing then the subject would have no contributing data to be included in the analysis, and again effectively be excluded from the analysis). In both the BOCF and LOCF imputation analyses, the same main effects ANCOVA model as described below will be used. The third method will use Mixed Model for Repeated Measurements (MMRM) utilizing the datasets created by the multiple imputation process up to and including Week 24 (see Appendix 2.1 for details on windows; if multiple observations are within a window, only the single observation selected for analysis by the windowing algorithm will be used in the MMRM analysis). The fourth method will use MMRM utilizing all available data up to and including Week 24, including data considered off-treatment (retrieved dropout).
Analyses of the three co-primary endpoints at secondary time points will use the BOCF and LOCF imputation methods for missing data, and use the same (main effects) ANCOVA model as described for the primary analyses.
The responder endpoints will be analyzed using logistic regression for binary data, using both BOCF and LOCF separately for missing data of the response endpoint at a particular time point. Imputation using BOCF will lead to the subject being assessed as a non-responder. In addition, in order to closely match the primary imputation analysis, a mixed BOCF/LOCF imputation for response endpoints will be used. In this analysis BOCF imputation (ie, a subject would be a non-responder) would be used for missing data due to discontinuation for reasons of lack of efficacy, adverse event or death up to the time point of interest, and LOCF imputation would be used for missing data for any other reason.
Note, if Baseline is missing then the subject data for the change from Baseline will be set to missing for all efficacy analyses for that parameter. A subject who has a missing baselinescore will be missing for the response criteria for endpoints where the response is based on one parameter. The OMERACT-OARSI responder index is based on 3 parameters. It is set to missing if two or three out of these three parameters are missing at baseline (per its definition, a response can be still be achieved if only one parameter is missing, regardless of which one it is).
0901
77e1
900c
692f
\App
rove
d\Ap
prov
ed O
n: 2
1-D
ec-2
018
18:2
3 (G
MT)
0901
77e1
910c
8bd2
\App
rove
d\A
ppro
ved
On:
06-
Jun-
2019
06:
52 (
GM
T)

Protocol A4091057 (PF-04383119) Statistical Analysis Plan
PFIZER CONFIDENTIALPage 33
The individual WOMAC subscales are calculated of the mean of the individual items (5 for Pain, 17 for Physical Function and 2 for Stiffness).
The WOMAC Average score is calculated as the mean of the three WOMAC subscale scores of Pain, Physical Function and Stiffness.
issing WOMAC subscale or WOMAC Average scores will be subject to the imputation method of the analysis as described above.
For the analysis of the rescue medication endpoints, missing data is imputed for daily missing scores first, and then the last available weekly score (after daily missing data is imputed) will be used for subsequent missing weekly scores, as described below. While subjects are still in the study any missing data will be imputed by carrying forward the last recorded daily data up to Week 24 (LOCF daily data). Where there is no record of rescue medication being taken on a study day, and the subject has not completed or discontinued from the study, then the last daily rescue medication observation will be carried forward. Imputation using the daily data will occur up to the end of the last week when the subject is in the study (see Appendix 2.1 for definitions of the last study day in each week). For example if a subject discontinues on study day 10, then data up to the end of Week 2 will be imputed in this way. The weekly scores for the rescue medication endpoints can then be calculated for each week the subject is in the study. Rescue medication endpoints are summarized and analyzed using LOCF, and so the last weekly score for the rescue medication will be used for LOCF after the subject has discontinued from the study (note, imputation is taken from the last week with non-missing data and not necessarily from the last available study week, eg, if Week 8 is missing then Week 7 data can be used). The baseline observation will not be carried forward in the case where a post-baseline observation is not available for the LOCF imputation. In the example above, the subject who discontinued in Week 2 (Study Day 10) will have their Week 2 value used as the LOCF value for all Weeks 3-24. The BOCF imputation rule will not be used for the subject because rescue medication is collected during the Initial Pain Assessment Period only (days -7 to -1) and subjects should not be taking rescue medication within 24 hours of the Baseline visit (so part of day -1), therefore Baseline rescue medication use is not an accurate reflection of subjects true Baseline use of rescue medication. Imputation of weekly diary data after Week 24 will not be performed.
The electronic diary data are a mix of daily and weekly average pain assessments for the index hip or knee, although the recall assessment period is the past 24 hours for both daily and weekly assessments. A weekly mean score will be calculated from the available daily pain scores where that is available. Any missing daily pain scores will be left as missing in the weekly pain score calculated. If there are no non-missing observations then the weekly score will be missing. The Baseline mean will be calculated using the last 3 values during the 7 days of the Initial Pain Assessment Period (IPAP) prior to Randomization/Day1. The weekly pain scores (either calculated from the daily scores when available or directly from the weekly pain assessments) will then be utilized for the multiple imputation, and the LOCF and BOCF imputations in the standard way. Note, for the weekly pain score, a pain score
0901
77e1
900c
692f
\App
rove
d\Ap
prov
ed O
n: 2
1-D
ec-2
018
18:2
3 (G
MT)
CCI
CCI
0901
77e1
910c
8bd2
\App
rove
d\A
ppro
ved
On:
06-
Jun-
2019
06:
52 (
GM
T)
Protocol A4091057 (PF-04383119) Statistical Analysis Plan
PFIZER CONFIDENTIALPage 34
being carried forward with LOCF might not be a visit week assessment (eg, carry forward Week 3 for missing Week 4 data even though there is no scheduled Week 3 visit). For the purposes of the imputation analyses, where there is no post-baseline observation available to carry forward, then the baseline score carried forward will be the baseline average pain score, being the mean of the last 3 pain scores in the baseline assessment period. If there are less than 3 baseline pain scores then the baseline is calculated over the remaining non-missing values.
Missing values in standard summaries of AEs, lab values, vital signs and ECGs will be handled per Pfizer standard algorithms. For the analysis of NIS the baseline observation will not be carried forward in the case where a post-baseline observation is not available for the LOCF imputation.
The Baseline diary average pain is used in the analysis of most endpoints as described inSection 3.4.1. However if a patient has a missing value for this covariate then to avoid exclusion of the patient for the endpoint then a Baseline value will be imputed as the patient’s WOMAC Pain subscale score. This imputed value will not be used in the analysis of the Average Pain from the diary, but as a covariate for other endpoints.
6. ANALYSES AND SUMMARIESA summary of the details of the efficacy analyses is presented in tabular format in Appendix 1.
6.1. Primary Endpoint(s)See Appendix 1.
6.2. Secondary Endpoint(s)See Appendix 1.
6.3. Other Endpoint(s)6.3.1. PharmacokineticsThe following reporting of PK data will be done using all available data:
• A listing of all plasma tanezumab concentrations sorted by subject, active treatment group and nominal time post dose. The listing of concentrations will also include the actual times post dose.
• A descriptive summary of the plasma tanezumab concentrations based on nominal time post dose for each treatment group.
• Pharmacodynamics (NGF)
Serum samples from a subset of patients will be run in the bioanalytical assays for the NGF related proteins (total NGF, bound NGF, proNGF, soluble p75).
0901
77e1
900c
692f
\App
rove
d\Ap
prov
ed O
n: 2
1-D
ec-2
018
18:2
3 (G
MT)
0901
77e1
910c
8bd2
\App
rove
d\A
ppro
ved
On:
06-
Jun-
2019
06:
52 (
GM
T)
Protocol A4091057 (PF-04383119) Statistical Analysis Plan
PFIZER CONFIDENTIALPage 35
The NGF related protein concentrations will be reported in summary tables and figures and will be part of the A4091057 study CSR. The data analysis of the NGF related protein concentrations will be described in a separate Population Modeling Analysis Plan and the results will be reported in a separate Population Modeling Analysis Report.
The following reporting of NGF concentration data will be done in the CSR:
• A listing of individual total NGF, relative percent bound NGF, proNGF/total NGFand soluble p75 concentrations in serum sorted by subject, active treatment group and nominal time post dose. The listing of concentrations will also include the actual times post dose.
• A descriptive summary (mean, SD, SE, 95% CI, median, min, max) of the total NGF, relative percent bound NGF, proNGF/total NGF and soluble p75 concentrations in serum based on nominal time post dose for each treatment group.
• Box plot of either total NGF, relative percent bound NGF, proNGF/total NGF and soluble p75 concentrations over time by treatment.
• Osteoarthritis Biomarkers
Biomarker concentrations will be measured in subjects with any of the joint safety adjudication outcomes of rapidly progressive osteoarthritis (type 1 and type 2), subchondral insufficiency fracture, primary osteonecrosis, or pathological fracture, and for occurrence of total joint replacement due to normal progression of OA. In addition, control subjects (no AEs) to these cases will be analyzed for biomarker concentrations and will be identified based on matching duration of treatment. The biomarker concentrations will be reported in summary tables and figures in a report separate from the A4091057 study CSR. The data analysis of the osteoarthritis biomarker concentrations will be described in a separate Statistical Analysis Plan and the results will be reported in a separate report which will address the biomarker results in a combined fashion across OA studies A4091056, A4091057, and A4091058.
6.4. Subset Analyses Separate tables will be produced for subjects in the ITT analysis set in Japanese sites. These tables will be defined prior to the unblinding of the study.
6.5. Baseline and Other Summaries and AnalysesThe following non-standard baseline tables will be included:
• A summary of baseline characteristics, including index joint, Kellgren-Lawrence grade of the index joint (for subjects with Hip and Knee OA separately then overall), highest Kellgren-Lawrence grade for each subject, WOMAC subscales at Baseline and Screening (for Pain subscale only), diabetes status (from medical history and/or pre-treatment HbA1c ≥6.5%), and the PGA at Baseline. This summary will also include a summary of the number of subjects who are ≥75 years old.
0901
77e1
900c
692f
\App
rove
d\Ap
prov
ed O
n: 2
1-D
ec-2
018
18:2
3 (G
MT)
0901
77e1
910c
8bd2
\App
rove
d\A
ppro
ved
On:
06-
Jun-
2019
06:
52 (
GM
T)

Protocol A4091057 (PF-04383119) Statistical Analysis Plan
PFIZER CONFIDENTIALPage 36
6.5.1. Concomitant Medications and Non-Drug TreatmentsSummaries of various classes of concomitant medications based on Case Report Form classifications will be provided, eg, treatments for bone metastasis, non-NSAID and NSAID medications (shown separately).
6.6. Safety Summaries and AnalysesAdverse events, concomitant medications, laboratory safety tests, physical and neurological examinations, vital signs, electrocardiogram (ECG), the anti-drug antibody test will be collected for each subject during the study according to the Schedule of Assessments. Standard safety reporting tables will summarize and list the safety data.
Pfizer standard safety data presentations will be made for demography data, discontinuation data, adverse event data, laboratory test data, vital signs data and ECG data.
The following non-standard safety tables will also be included:
• Summary of number of subjects treated by country and treatment group.
• Incidence and severity of Adverse Events leading to discontinuation.
• Summary of AEs, Incidence of AEs, Incidence of AEs leading to discontinuation and summary of Serious AEs will be shown for the whole study period (including the safety follow-up period).
• Summary of evidence of neurological examination abnormalities by visit and final assessment, and incidence of neurological findings over consecutive visits. Further details of this summary are given below.
• Summary of final outcome of neurological consultation. Further details of this summary are given below.
• Summary of the Incidence of sympathetic neuropathy based on investigator assessment and, if performed, expert consultant assessment.
• ‘Incidence and severity’ tables of treatment-emergent adverse events of Abnormal Peripheral Sensation (APS) and Sympathetic Nervous Function, as defined above. Other adverse events may be added to these groupings if they are observed in this study or other studies in the tanezumab program.
• Summary table and listing of inclusion and exclusion criteria that are not met by subjects who were screened (but not randomized).
• Summary of discontinuation by treatment group and reason, and study week of discontinuation for the treatment period (Weeks 1-2, 3-4, 5-8, 9-12, 13-16, 17-20, 21-24, ≥24) ) and for the safety follow-up period (Weeks 1-8, 9-16, 17-24, >24).
0901
77e1
900c
692f
\App
rove
d\Ap
prov
ed O
n: 2
1-D
ec-2
018
18:2
3 (G
MT)
0901
77e1
910c
8bd2
\App
rove
d\A
ppro
ved
On:
06-
Jun-
2019
06:
52 (
GM
T)
Protocol A4091057 (PF-04383119) Statistical Analysis Plan
PFIZER CONFIDENTIALPage 37
• A summary of the maximum increase from baseline in the sitting systolic and diastolic blood pressure. The categories used are: (systolic BP) only decreases or no change, >0 to 10, >10-20, >20-30, >30, and (diastolic BP) only decreases or no change, >0 to 10, >10-20, >20.
• A summary of the maximum decrease from baseline in the sitting systolic and diastolic blood pressure. The categories used are: (systolic BP) <-30, -30 to <-20, -20 to <-10, -10 to <0, only increases or no change, and (diastolic BP) <-20, -20 to <-10, -10 to <0, only increases or no change.
• A summary of the change from baseline to last observation in the sitting systolic and diastolic blood pressure. The categories used for these summaries are: (systolic BP) ≤-40, >-40 to -30, >-30 to -20, >-20 to -10, >-10 to 0, >0 to <10, 10-<20, 20-<30, 30-<40, ≥40, and (diastolic BP) ≤-30, >-30 to -20, >-20 to -10, >-10 to 0, >0 to <10, 10-<20, 20-<30, ≥30.
• A summary of incidence of subjects with confirmed orthostatic hypotension, for each visit and any post-baseline incidence of orthostatic hypotension.
• A summary of discontinuation up to End of Treatment period, and up to End of Study period.
• Incidence of musculoskeletal physical examination at screening.
• Summary of the Survey of Autonomic Symptoms (SAS) number of symptoms reported and total symptom impact score, at each visit, and for the change from Baseline score.
• Summary of concomitant medications for Osteoarthritis for non-NSAID and NSAID medications (shown separately).
• Summary of number of days of NSAID use per dosing interval (eg, Day 1 to Week 8,Week 8 to Week 16, Week 16 to Week 24) and for the first 8-week interval in the safety follow-up period. This will show the number and percentage of subjects in aninterval that exceeded the limit of 10 days of NSAID use. If an interval exists, the visits will be used to define the interval, otherwise calendar time will be used. A summary of average number of days of NSAID use will be displayed by interval. Also, a summary of the overall number of days of NSAID use from Day 1 to Week 32 will be shown, as well as the number and percentage of subjects who exceeded the limit of 40 days of NSAID use during this interval.
• Summary of failed drug treatments for protocol qualification, with reasons for discontinuation.
6.6.1. Adverse EventsAdverse Events of Abnormal Peripheral Sensation will be summarized. The Survey ofAutonomic Symptoms (SAS) scores will be summarized for the total number of symptomsreported and total impact score, by visit and for the change from Baseline.
0901
77e1
900c
692f
\App
rove
d\Ap
prov
ed O
n: 2
1-D
ec-2
018
18:2
3 (G
MT)
0901
77e1
910c
8bd2
\App
rove
d\A
ppro
ved
On:
06-
Jun-
2019
06:
52 (
GM
T)
Protocol A4091057 (PF-04383119) Statistical Analysis Plan
PFIZER CONFIDENTIALPage 38
Separate adverse event summaries by treatment group for adverse events of decreasedsympathetic function will be conducted. More specifically, adverse events with the followingpreferred terms will be considered to represent adverse events of decreased sympatheticfunction: Blood pressure orthostatic decreased, bradycardia, dizziness postural, heart ratedecreased, orthostatic hypotension, presyncope, sinus bradycardia, syncope, anhidrosis,hypohidrosis, abdominal discomfort, diarrhea, early satiety, fecal incontinence, nausea,vomiting, ejaculation delay, ejaculation disorder, ejaculation failure, hypertonic bladder,micturition urgency, nocturia, urinary frequency, urinary hesitation, urinary incontinence,respiratory distress and respiratory failure. If necessary, this list of preferred terms may beadjusted for updates made to the MEDICAL DICTIONARY FOR DRUG REGULATORYAFFAIRS (MedDRA) dictionary versions used for reporting.
In addition to summaries of adverse events considered to represent adverse events ofdecreased sympathetic function noted above, adverse events of syncope, bradycardia,orthostatic hypotension, anhidrosis, or hypohidrosis are designated as adverse events ofinterest that will be reviewed by the unblinded E-DMC.
Selected adverse events of interest and common adverse events will be summarized usingRisk Differences (with 95% confidence intervals) between each tanezumab group andplacebo. In addition, significance testing will be performed for adverse events of interestbetween each tanezumab group and placebo. There will be no multiplicity adjustment forthese significance tests.
For the 3-tier adverse event reporting, tier 1 adverse events are defined in the tanezumab Safety Review Plan, and this definition of tier-1 adverse events for the report of study 1057tables will be finalized prior to the unblinding of this study.
Tier 2 AEs are those with a frequency of ≥3% in any treatment group and that are not in tier 1.
Tier 3 AEs are those not in Tier 1 or Tier 2, and will be summarized using standard Pfizer data standards tables, where all Adverse Events will be included (ie, Tier 3 AEs will not be shown separately).
Adverse events within tier 1 and 2 will be summarized using Risk Differences between each tanezumab group and placebo, together with 95% confidence interval, using exact methods. Significance tests will be performed for tanezumab versus placebo comparisons using exact methods for the tier 1 AEs. There will be no multiplicity adjustment for these significance tests. These tables will be produced for the comparisons of tanezumab 2.5 mg versus placebo and tanezumab 5 mg versus placebo.
The following footnote will be used in the Tier 1 AE tables: “P-values and confidence intervals are not adjusted for multiplicity and should be used for screening purpose only. 95% Confidence intervals are provided to help gauge the precision of the estimates for Risk Difference. Risk Difference is computed as ‘Tanezumab 2.5 mg versus placebo’ and ‘Tanezumab 5 mg versus placebo’. Exact methods are used for 95% confidence intervals and significance tests”. Similarly the following footnote will be used in the Tier 2 AE tables: “Confidence intervals are not adjusted for multiplicity and should be used for screening
0901
77e1
900c
692f
\App
rove
d\Ap
prov
ed O
n: 2
1-D
ec-2
018
18:2
3 (G
MT)
0901
77e1
910c
8bd2
\App
rove
d\A
ppro
ved
On:
06-
Jun-
2019
06:
52 (
GM
T)
Protocol A4091057 (PF-04383119) Statistical Analysis Plan
PFIZER CONFIDENTIALPage 39
purpose only. 95% Confidence intervals are provided to help gauge the precision of the estimates for Risk Difference. Risk Difference is computed as ‘Tanezumab 2.5 mg versus placebo’ and ‘Tanezumab 5 mg versus placebo’. Exact methods are used for 95% confidence intervals.”
It should be recognized that most studies are not designed to reliably demonstrate a causal relationship between the use of a pharmaceutical product and an adverse event or a group of adverse events. Except for select events in unique situations, studies do not employ formal adjudication procedures for the purpose of event classification. As such, safety analysis is generally considered as an exploratory analysis and its purpose is to generate hypotheses for further investigation. The 3-tier approach facilitates this exploratory analysis.
All summaries of adverse events will be shown for adverse events that begin or worsen after the first dose of study drug (treatment-emergent) up to the end of the treatment period. In addition a selection of adverse event tables will be produced for the off-study medication safety follow-up period, and some will be produced for the whole period up to the end of the study, including the treatment period and safety follow-up period.
6.6.2. Vital SignsIncidence of orthostatic hypotension using postural changes in blood pressure…, will be summarized.
6.6.3. Neurological ResultsThe Neuropathy Impairment Score (NIS) is the sum of scores over all 37 items from both the Left and Right side. The change from baseline to each post-baseline visit in the NIS, (using LOCF for missing data), and to the last and the worst (largest) change from Baseline (over all post-Baseline visits) will be summarized, and analyzed using Cochran-Mantel-Haenszel test (stratified by the combinations of two stratification factors, last change from Baseline will be analyzed). The NIS data, the neurological consultation data and the conclusion from neurological examination data will be reported.
The neurological consultation data will be summarized for all subjects…. The “conclusion from the neurological examination” data will be summarized for each timepoint, and then a summary of the final assessment over all neurological examinations for each subject.
The change from Baseline in the NIS for Weeks 2, 4, 8, 12, 16, 24, 32 and 48 will be analyzed using a CMH test (stratified by the combined levels of the stratification factors) with change scores. Missing data will be imputed using LOCF only. For this analysis, Baseline data will not be carried forward in the case of a post-Baseline observation not being available for use in LOCF. An additional analysis will use the change from Baseline to the largest (worst) post-Baseline value.
The “conclusion from the neurological examination” data will be summarized for each time point and the last subject assessment. In addition the persistence of any neurological examination finding will be summarized, showing the incidence of subjects with new or worsened neurological examination abnormality (both clinically significant only and also for any finding) for 2, 3, 4, and ≥5 consecutive visits.
0901
77e1
900c
692f
\App
rove
d\Ap
prov
ed O
n: 2
1-D
ec-2
018
18:2
3 (G
MT)
0901
77e1
910c
8bd2
\App
rove
d\A
ppro
ved
On:
06-
Jun-
2019
06:
52 (
GM
T)

Protocol A4091057 (PF-04383119) Statistical Analysis Plan
PFIZER CONFIDENTIALPage 40
6.6.4. ImmunogenicityThe following assessments of anti-drug antibody (ADA) data will be made:
• A listing of individual serum ADA results sorted by treatment group, subject ID and planned visit. The listing will also include the actual test date/times.
• The proportion of subjects who test positive (ie, develop anti-tanezumab antibodies) and negative for treatment-emergent ADA presence will be summarized by treatment group and planned visit. The summary will also include the proportion of subjects who test positive and negative overall for treatment-emergent ADA in the study.
• Subjects who develop treatment-emergent anti-tanezumab antibodies will be evaluated for the presence of anti-tanezumab neutralizing antibodies, and individual results will be listed.
• Individual subjects who develop treatment-emergent antibodies will be evaluated for potential ADA impact on the individual’s PK, NGF, efficacy and safety profile.
6.6.5. Joint Safety EventsThe incidence of subjects with any of the adjudication outcomes of rapidly progressiveosteoarthritis (type 1 and type 2), subchondral insufficiency fracture, primary osteonecrosis, or pathological fracture, and for occurrence of total joint replacement will be shown by number of subjects treated and subject years of exposure (treatment plus follow up periods), for individual treatment groups.
Events will be included in summaries if they occur up to the end of the safety follow-up period or 26 weeks (planned duration of the follow-up period + 2 weeks) after the end of the treatment period, whichever is later.
For the joint safety event analyses, the observation period is defined as the time from first SCdose to study completion or discontinuation for subjects who did not have an event, or timefrom first SC dose to the earliest event for subjects who did have at least one event.
The change from Baseline to Weeks 24 and 48 in the Minimum Joint Space Width (JSW) for subjects with Kellgren-Lawrence grades of 2 or 3 in the index joint will be listed for subjects with measurements in the knee and hip separately.
7. INTERIM ANALYSES
7.1. IntroductionInterim analysis is planned for safety as described in the following sections.
0901
77e1
900c
692f
\App
rove
d\Ap
prov
ed O
n: 2
1-D
ec-2
018
18:2
3 (G
MT)
0901
77e1
910c
8bd2
\App
rove
d\A
ppro
ved
On:
06-
Jun-
2019
06:
52 (
GM
T)
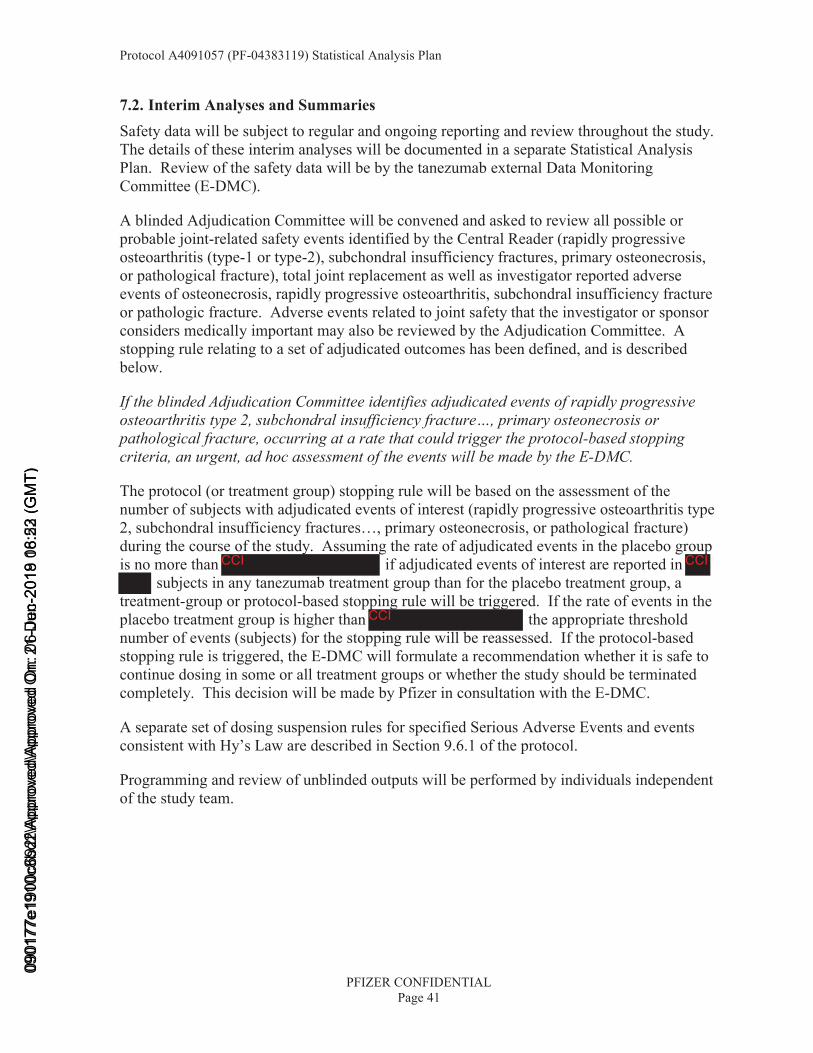
Protocol A4091057 (PF-04383119) Statistical Analysis Plan
PFIZER CONFIDENTIALPage 41
7.2. Interim Analyses and SummariesSafety data will be subject to regular and ongoing reporting and review throughout the study. The details of these interim analyses will be documented in a separate Statistical Analysis Plan. Review of the safety data will be by the tanezumab external Data Monitoring Committee (E-DMC).
A blinded Adjudication Committee will be convened and asked to review all possible or probable joint-related safety events identified by the Central Reader (rapidly progressive osteoarthritis (type-1 or type-2), subchondral insufficiency fractures, primary osteonecrosis, or pathological fracture), total joint replacement as well as investigator reported adverse events of osteonecrosis, rapidly progressive osteoarthritis, subchondral insufficiency fracture or pathologic fracture. Adverse events related to joint safety that the investigator or sponsor considers medically important may also be reviewed by the Adjudication Committee. A stopping rule relating to a set of adjudicated outcomes has been defined, and is described below.
If the blinded Adjudication Committee identifies adjudicated events of rapidly progressive osteoarthritis type 2, subchondral insufficiency fracture…, primary osteonecrosis or pathological fracture, occurring at a rate that could trigger the protocol-based stopping criteria, an urgent, ad hoc assessment of the events will be made by the E-DMC.
The protocol (or treatment group) stopping rule will be based on the assessment of the number of subjects with adjudicated events of interest (rapidly progressive osteoarthritis type 2, subchondral insufficiency fractures…, primary osteonecrosis, or pathological fracture) during the course of the study. Assuming the rate of adjudicated events in the placebo group is no more than if adjudicated events of interest are reported in
subjects in any tanezumab treatment group than for the placebo treatment group, a treatment-group or protocol-based stopping rule will be triggered. If the rate of events in the placebo treatment group is higher than the appropriate threshold number of events (subjects) for the stopping rule will be reassessed. If the protocol-based stopping rule is triggered, the E-DMC will formulate a recommendation whether it is safe to continue dosing in some or all treatment groups or whether the study should be terminated completely. This decision will be made by Pfizer in consultation with the E-DMC.
A separate set of dosing suspension rules for specified Serious Adverse Events and events consistent with Hy’s Law are described in Section 9.6.1 of the protocol.
Programming and review of unblinded outputs will be performed by individuals independent of the study team.
0901
77e1
900c
692f
\App
rove
d\Ap
prov
ed O
n: 2
1-D
ec-2
018
18:2
3 (G
MT)
CCI CCI
CCI
0901
77e1
910c
8bd2
\App
rove
d\A
ppro
ved
On:
06-
Jun-
2019
06:
52 (
GM
T)

Protocol A4091057 (PF-04383119) Statistical Analysis Plan
PFIZER CONFIDENTIALPage 42
8. REFERENCES 1. Alosh M, Bretz F, Huque M. Advanced multiplicity adjustment methods in clinical
trials. Statist. Med. (2014):33:693–713.
2. Bretz F, Posch M, Glimm E, Klingmueller F, Maurer W, Rohmeyer K. Graphical approaches for multiple comparison procedures usingweighted Bonferroni, Simes, or parametric tests Biometrical Journal. 53(2011) 6, 894–913.
3. EuroQol Group. EuroQol: a new facility for the measurement of health related quality of life. Health Policy 1990; 16:199-208.
4. Little RJ & Rubin DB (2002). Statistical Analysis with Missing Data. New Jersey: Wiley.
0901
77e1
900c
692f
\App
rove
d\Ap
prov
ed O
n: 2
1-D
ec-2
018
18:2
3 (G
MT)
0901
77e1
910c
8bd2
\App
rove
d\A
ppro
ved
On:
06-
Jun-
2019
06:
52 (
GM
T)

Protocol A4091057 (PF-04383119) Statistical Analysis Plan
PFIZER CONFIDENTIALPage 43
9. APPENDICESAppendix 1. SUMMARY OF EFFICACY ANALYSES
Note: BL=Baseline
Endpoint Analysis Set
Statistical Method Model/ Covariates Missing Data
Objective
Change from Baseline to Week 24 in WOMAC Pain subscale
ITT ANCOVA BL Score, BL diary average pain, Index Joint (Knee/Hip), Highest KL grade (2, 3 or 4), Treatment Group (Study site as a random effect)
Multiple Imputation
Primary Analysis
Change from Baseline to Week 24 in WOMAC Physical Function subscale
ITT ANCOVA BL Score, BL diary average pain, Index Joint (Knee/Hip), Highest KL grade (2, 3 or 4), Treatment Group (Study site as a random effect)
Multiple Imputation
Primary Analysis
Change from Baseline to Week 24 in Patient Global Assessment of Osteoarthritis
ITT ANCOVA BL Score, BL diary average pain, Index Joint (Knee/Hip), Highest KL grade (2, 3 or 4), Treatment Group (Study site as a random effect)
Multiple Imputation
Primary Analysis
Change from Baseline to Week 24 in WOMAC Pain subscale
ITT ANCOVA BL Score, BL diary average pain, Index Joint (Knee/Hip), Highest KL grade (2, 3 or 4), Study Site, Treatment Group, Study Site x Treatment Group (Study site and interaction as random effects)
Multiple Imputation
Additional (Interaction) Analysis
Change from Baseline to Week 24 in WOMAC Pain subscale
ITT ANCOVA BL Score, BL diary average pain, Index Joint (Knee/Hip), Highest KL grade (2, 3 or 4), Country, Treatment Group, Country x Treatment Group.
Multiple Imputation
Additional (Interaction) Analysis
Change from Baseline to Week 24 in WOMAC Physical Function subscale
ITT ANCOVA BL Score, BL diary average pain, Index Joint (Knee/Hip), Highest KL grade (2, 3 or 4), Study Site, Treatment Group, Study Site x Treatment Group (Study site and interaction as random effects)
Multiple Imputation
Additional (Interaction) Analysis
Change from Baseline to Week 24 in WOMAC Physical Function subscale
ITT ANCOVA BL Score, BL diary average pain, Index Joint (Knee/Hip), Highest KL
Multiple Imputation
Additional (Interaction)
0901
77e1
900c
692f
\App
rove
d\Ap
prov
ed O
n: 2
1-D
ec-2
018
18:2
3 (G
MT)
0901
77e1
910c
8bd2
\App
rove
d\A
ppro
ved
On:
06-
Jun-
2019
06:
52 (
GM
T)
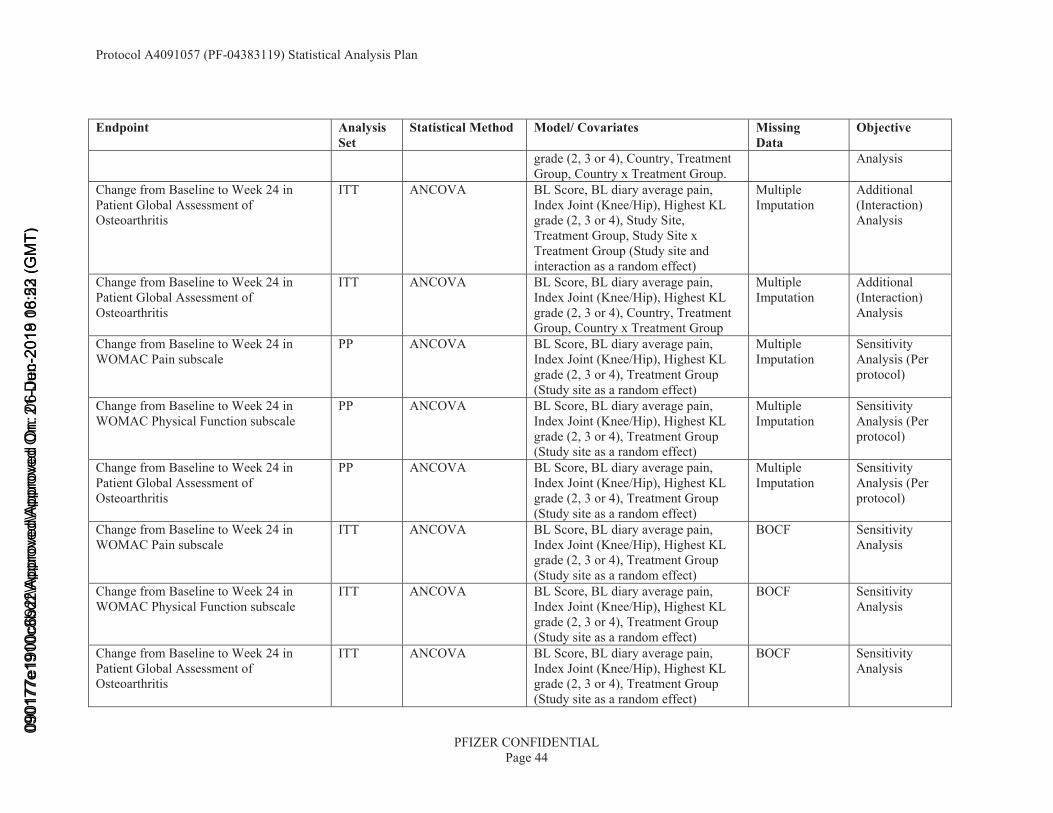
Protocol A4091057 (PF-04383119) Statistical Analysis Plan
PFIZER CONFIDENTIALPage 44
Endpoint Analysis Set
Statistical Method Model/ Covariates Missing Data
Objective
grade (2, 3 or 4), Country, Treatment Group, Country x Treatment Group.
Analysis
Change from Baseline to Week 24 in Patient Global Assessment of Osteoarthritis
ITT ANCOVA BL Score, BL diary average pain, Index Joint (Knee/Hip), Highest KL grade (2, 3 or 4), Study Site, Treatment Group, Study Site x Treatment Group (Study site and interaction as a random effect)
Multiple Imputation
Additional (Interaction) Analysis
Change from Baseline to Week 24 in Patient Global Assessment of Osteoarthritis
ITT ANCOVA BL Score, BL diary average pain, Index Joint (Knee/Hip), Highest KL grade (2, 3 or 4), Country, Treatment Group, Country x Treatment Group
Multiple Imputation
Additional (Interaction) Analysis
Change from Baseline to Week 24 in WOMAC Pain subscale
PP ANCOVA BL Score, BL diary average pain, Index Joint (Knee/Hip), Highest KL grade (2, 3 or 4), Treatment Group (Study site as a random effect)
Multiple Imputation
Sensitivity Analysis (Per protocol)
Change from Baseline to Week 24 in WOMAC Physical Function subscale
PP ANCOVA BL Score, BL diary average pain, Index Joint (Knee/Hip), Highest KL grade (2, 3 or 4), Treatment Group (Study site as a random effect)
Multiple Imputation
Sensitivity Analysis (Per protocol)
Change from Baseline to Week 24 in Patient Global Assessment of Osteoarthritis
PP ANCOVA BL Score, BL diary average pain, Index Joint (Knee/Hip), Highest KL grade (2, 3 or 4), Treatment Group (Study site as a random effect)
Multiple Imputation
Sensitivity Analysis (Per protocol)
Change from Baseline to Week 24 in WOMAC Pain subscale
ITT ANCOVA BL Score, BL diary average pain, Index Joint (Knee/Hip), Highest KL grade (2, 3 or 4), Treatment Group (Study site as a random effect)
BOCF Sensitivity Analysis
Change from Baseline to Week 24 in WOMAC Physical Function subscale
ITT ANCOVA BL Score, BL diary average pain, Index Joint (Knee/Hip), Highest KL grade (2, 3 or 4), Treatment Group (Study site as a random effect)
BOCF Sensitivity Analysis
Change from Baseline to Week 24 inPatient Global Assessment of Osteoarthritis
ITT ANCOVA BL Score, BL diary average pain, Index Joint (Knee/Hip), Highest KL grade (2, 3 or 4), Treatment Group (Study site as a random effect)
BOCF Sensitivity Analysis
0901
77e1
900c
692f
\App
rove
d\Ap
prov
ed O
n: 2
1-D
ec-2
018
18:2
3 (G
MT)
0901
77e1
910c
8bd2
\App
rove
d\A
ppro
ved
On:
06-
Jun-
2019
06:
52 (
GM
T)

Protocol A4091057 (PF-04383119) Statistical Analysis Plan
PFIZER CONFIDENTIALPage 45
Endpoint Analysis Set
Statistical Method Model/ Covariates Missing Data
Objective
Change from Baseline to Week 24 in WOMAC Pain subscale
ITT ANCOVA BL Score, BL diary average pain, Index Joint (Knee/Hip), Highest KL grade (2, 3 or 4), Treatment Group (Study site as a random effect)
LOCF Sensitivity Analysis
Change from Baseline to Week 24 in WOMAC Physical Function subscale
ITT ANCOVA BL Score, BL diary average pain, Index Joint (Knee/Hip), Highest KL grade (2, 3 or 4), Treatment Group (Study site as a random effect)
LOCF Sensitivity Analysis
Change from Baseline to Week 24 in Patient Global Assessment of Osteoarthritis
ITT ANCOVA BL Score, BL diary average pain, Index Joint (Knee/Hip), Highest KL grade (2, 3 or 4), Treatment Group (Study site as a random effect)
LOCF Sensitivity Analysis
Change from Baseline to Weeks 2, 4, 8, 12, 16 and 24 in WOMAC Pain subscale
ITT MMRM BL Score, BL diary average pain, Index Joint (Knee/Hip), Highest KL grade (2, 3 or 4), Time, Treatment Group, Time x Treatment Group (Study site as a random effect)
Multiple Imputation
Sensitivity Analysis for Week 24 (Secondary Endpoint Analysis for other time points)
Change from Baseline to Weeks 2, 4, 8, 12, 16 and 24 in WOMAC Physical Function subscale
ITT MMRM BL Score, BL diary average pain, Index Joint (Knee/Hip), Highest KL grade (2, 3 or 4), Time, Treatment Group, Time x Treatment Group (Study site as a random effect)
Multiple Imputation
Sensitivity Analysis for Week 24 (Secondary Endpoint Analysis for other time points)
Change from Baseline to Weeks 2, 4, 8, 12, 16 and 24 in Patient Global Assessment of Osteoarthritis
ITT MMRM BL Score, BL diary average pain, Index Joint (Knee/Hip), Highest KL grade (2, 3 or 4), Time, Treatment Group, Time x Treatment Group (Study site as a random effect)
Multiple Imputation
Sensitivity Analysis for Week 24 (Secondary Endpoint Analysis for other time points)
0901
77e1
900c
692f
\App
rove
d\Ap
prov
ed O
n: 2
1-D
ec-2
018
18:2
3 (G
MT)
0901
77e1
910c
8bd2
\App
rove
d\A
ppro
ved
On:
06-
Jun-
2019
06:
52 (
GM
T)

Protocol A4091057 (PF-04383119) Statistical Analysis Plan
PFIZER CONFIDENTIALPage 46
Endpoint Analysis Set
Statistical Method Model/ Covariates Missing Data
Objective
Change from Baseline to Weeks 2, 4, 8, 12, 16 and 24 in WOMAC Pain subscale
ITT MMRM BL Score, BL diary average pain, Index Joint (Knee/Hip), Highest KL grade (2, 3 or 4), Time, Treatment Group, Time x Treatment Group (Study site as a random effect)
All Observed Data Including Off-Treatment
Sensitivity Analysis for Week 24 (Secondary Endpoint Analysis for other time points)
Change from Baseline to Weeks 2, 4, 8, 12, 16 and 24 in WOMAC Physical Function subscale
ITT MMRM BL Score, BL diary average pain, Index Joint (Knee/Hip), Highest KL grade (2, 3 or 4), Time, Treatment Group, Time x Treatment Group (Study site as a random effect)
All Observed Data Including Off-Treatment
Sensitivity Analysis for Week 24 (Secondary Endpoint Analysis for other time points)
Change from Baseline to Weeks 2, 4, 8, 12, 16 and 24 in Patient Global Assessment of Osteoarthritis
ITT MMRM BL Score, BL diary average pain, Index Joint (Knee/Hip), Highest KL grade (2, 3 or 4), Time, Treatment Group, Time x Treatment Group (Study site as a random effect)
All Observed Data Including Off-Treatment
Sensitivity Analysis for Week 24 (Secondary Endpoint Analysis for other time points)
Change from Baseline to Week 24 in WOMAC Physical Function subscale
ITT ANCOVA BL Score, BL diary average pain, Index Joint (Knee/Hip), Highest KL grade (2, 3 or 4), Treatment Group, Spanish flag , Spanish flag x Treatment Group (Study site as random effects)
Multiple Imputation
Exploratory analysis about interactionregarding themissing sentence in Spanish questionnaires
Change from Baseline to Weeks 2, 4, 8, 12, 16, and 24 in Patient Global Assessment of Osteoarthritis
ITT CMH test Treatment Group [1] Mixed BOCF/LOCF
Sensitivity Analysis for PGA
Change from Baseline to Weeks 2, 4, 8, ITT CMH test Treatment Group [1] BOCF Sensitivity
0901
77e1
900c
692f
\App
rove
d\Ap
prov
ed O
n: 2
1-D
ec-2
018
18:2
3 (G
MT)
0901
77e1
910c
8bd2
\App
rove
d\A
ppro
ved
On:
06-
Jun-
2019
06:
52 (
GM
T)

Protocol A4091057 (PF-04383119) Statistical Analysis Plan
PFIZER CONFIDENTIALPage 47
Endpoint Analysis Set
Statistical Method Model/ Covariates Missing Data
Objective
12, 16, and 24 in Patient Global Assessment of Osteoarthritis
Analysis for PGA
Change from Baseline to Weeks 2, 4, 8, 12, 16, and 24 in Patient Global Assessment of Osteoarthritis
ITT CMH test Treatment Group [1] LOCF Sensitivity Analysis for PGA
Change from Baseline to Week 24 in WOMAC Pain subscale, shown by site (sites with n≥12)
ITT None (summary) NA Multiple Imputation
Supportive summary for interaction analysis
Change from Baseline to Week 24 in WOMAC Physical Function subscale, shown by site (sites with n≥12)
ITT None (summary) NA Multiple Imputation
Supportive summary for interaction analysis
Change from Baseline to Week 24 in Patient Global Assessment of Osteoarthritis, shown by site (sites with n≥12)
ITT None (summary) NA Multiple Imputation
Supportive summary for interaction analysis
Change from Baseline to Week 24 in WOMAC Pain subscale, shown by country (countries with n≥15)
ITT None (summary) NA Multiple Imputation
Supportive summary for interaction analysis
Change from Baseline to Week 24 in WOMAC Physical Function subscale, shown by country (countries with n≥15)
ITT None (summary) NA Multiple Imputation
Supportive summary for interaction analysis
Change from Baseline to Week 24 in Patient Global Assessment of Osteoarthritis, shown by country (countries with n≥15)
ITT None (summary) NA Multiple Imputation
Supportive summary for interaction analysis
Missing data pattern for WOMAC Pain subscale for Baseline and Weeks 2, 4, 8, 12, 16 and 24
ITT None (summary) NA Observed Data Supportive summary for missing data
Missing data pattern for WOMAC Physical Function subscale for Baseline and Weeks 2, 4, 8, 12, 16 and 24
ITT None (summary) NA Observed Data Supportive summary for missing data
Missing data pattern for Patient Global ITT None (summary) NA Observed Data Supportive
0901
77e1
900c
692f
\App
rove
d\Ap
prov
ed O
n: 2
1-D
ec-2
018
18:2
3 (G
MT)
0901
77e1
910c
8bd2
\App
rove
d\A
ppro
ved
On:
06-
Jun-
2019
06:
52 (
GM
T)
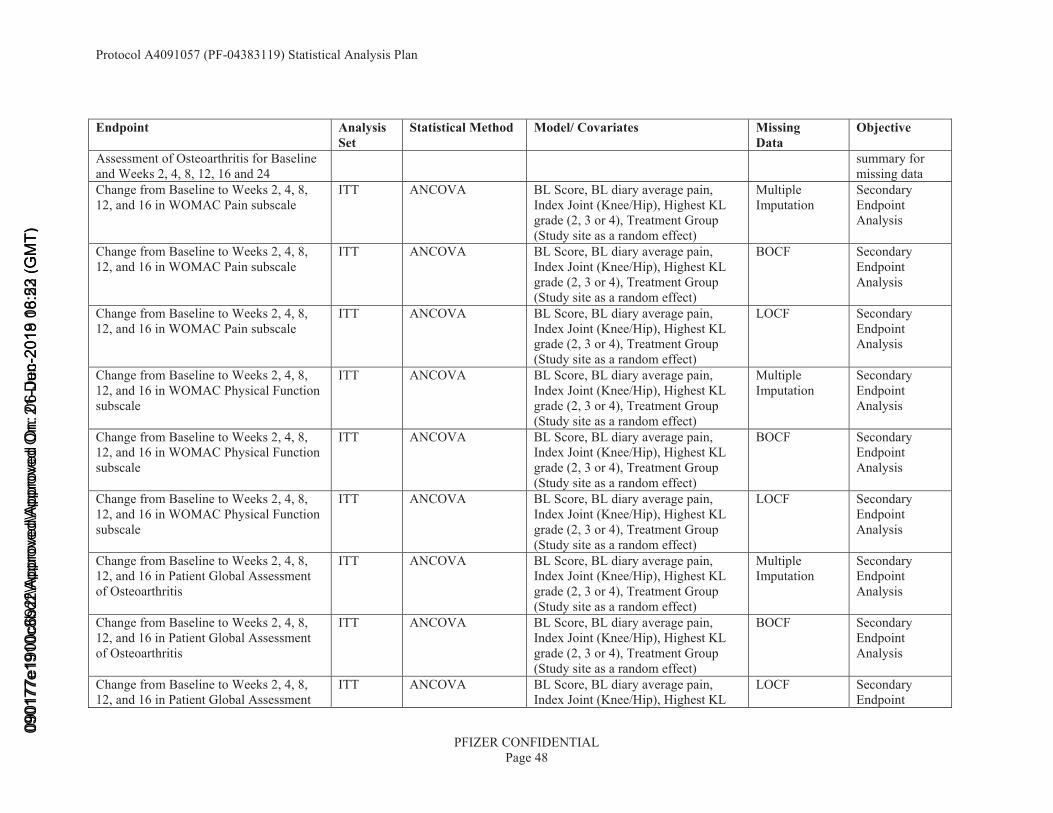
Protocol A4091057 (PF-04383119) Statistical Analysis Plan
PFIZER CONFIDENTIALPage 48
Endpoint Analysis Set
Statistical Method Model/ Covariates Missing Data
Objective
Assessment of Osteoarthritis for Baselineand Weeks 2, 4, 8, 12, 16 and 24
summary for missing data
Change from Baseline to Weeks 2, 4, 8, 12, and 16 in WOMAC Pain subscale
ITT ANCOVA BL Score, BL diary average pain, Index Joint (Knee/Hip), Highest KL grade (2, 3 or 4), Treatment Group (Study site as a random effect)
Multiple Imputation
Secondary Endpoint Analysis
Change from Baseline to Weeks 2, 4, 8,12, and 16 in WOMAC Pain subscale
ITT ANCOVA BL Score, BL diary average pain, Index Joint (Knee/Hip), Highest KL grade (2, 3 or 4), Treatment Group (Study site as a random effect)
BOCF Secondary Endpoint Analysis
Change from Baseline to Weeks 2, 4, 8, 12, and 16 in WOMAC Pain subscale
ITT ANCOVA BL Score, BL diary average pain, Index Joint (Knee/Hip), Highest KL grade (2, 3 or 4), Treatment Group (Study site as a random effect)
LOCF Secondary Endpoint Analysis
Change from Baseline to Weeks 2, 4, 8, 12, and 16 in WOMAC Physical Function subscale
ITT ANCOVA BL Score, BL diary average pain, Index Joint (Knee/Hip), Highest KL grade (2, 3 or 4), Treatment Group (Study site as a random effect)
Multiple Imputation
Secondary Endpoint Analysis
Change from Baseline to Weeks 2, 4, 8, 12, and 16 in WOMAC Physical Function subscale
ITT ANCOVA BL Score, BL diary average pain, Index Joint (Knee/Hip), Highest KL grade (2, 3 or 4), Treatment Group (Study site as a random effect)
BOCF Secondary Endpoint Analysis
Change from Baseline to Weeks 2, 4, 8, 12, and 16 in WOMAC Physical Function subscale
ITT ANCOVA BL Score, BL diary average pain, Index Joint (Knee/Hip), Highest KL grade (2, 3 or 4), Treatment Group (Study site as a random effect)
LOCF Secondary Endpoint Analysis
Change from Baseline to Weeks 2, 4, 8, 12, and 16 in Patient Global Assessment of Osteoarthritis
ITT ANCOVA BL Score, BL diary average pain, Index Joint (Knee/Hip), Highest KL grade (2, 3 or 4), Treatment Group (Study site as a random effect)
Multiple Imputation
Secondary Endpoint Analysis
Change from Baseline to Weeks 2, 4, 8, 12, and 16 in Patient Global Assessment of Osteoarthritis
ITT ANCOVA BL Score, BL diary average pain, Index Joint (Knee/Hip), Highest KL grade (2, 3 or 4), Treatment Group (Study site as a random effect)
BOCF Secondary Endpoint Analysis
Change from Baseline to Weeks 2, 4, 8, 12, and 16 in Patient Global Assessment
ITT ANCOVA BL Score, BL diary average pain, Index Joint (Knee/Hip), Highest KL
LOCF Secondary Endpoint
0901
77e1
900c
692f
\App
rove
d\Ap
prov
ed O
n: 2
1-D
ec-2
018
18:2
3 (G
MT)
0901
77e1
910c
8bd2
\App
rove
d\A
ppro
ved
On:
06-
Jun-
2019
06:
52 (
GM
T)
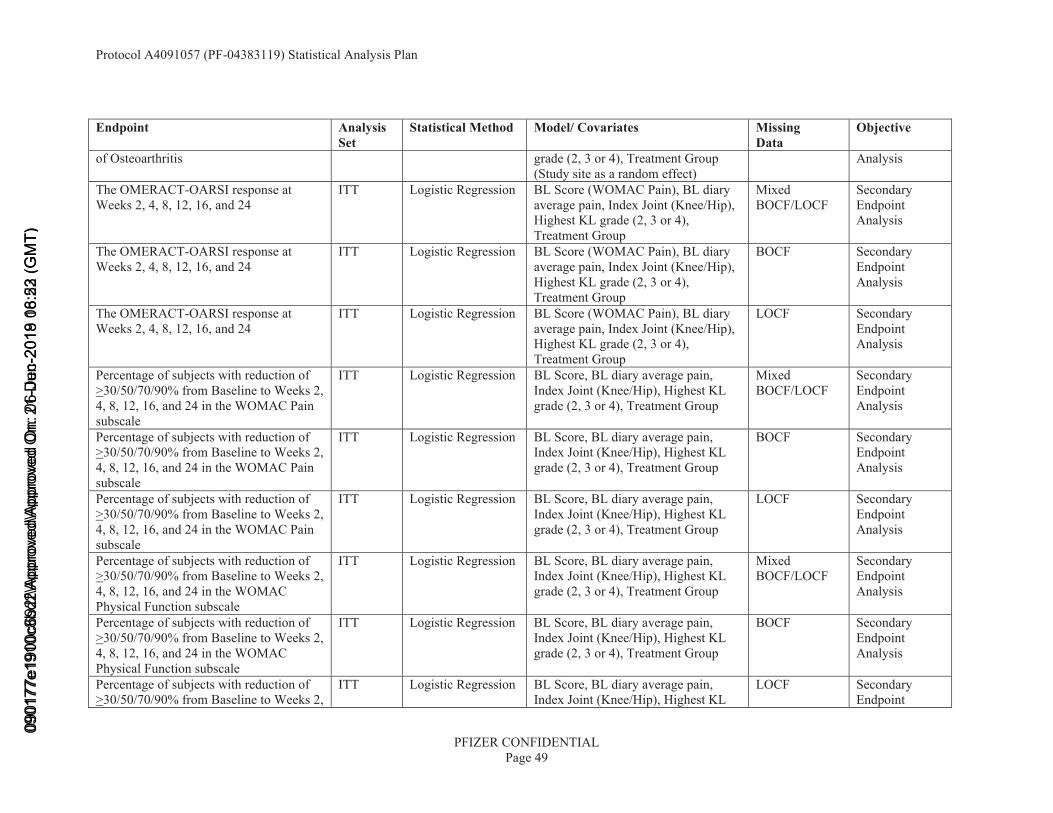
Protocol A4091057 (PF-04383119) Statistical Analysis Plan
PFIZER CONFIDENTIALPage 49
Endpoint Analysis Set
Statistical Method Model/ Covariates Missing Data
Objective
of Osteoarthritis grade (2, 3 or 4), Treatment Group (Study site as a random effect)
Analysis
The OMERACT-OARSI response at Weeks 2, 4, 8, 12, 16, and 24
ITT Logistic Regression BL Score (WOMAC Pain), BL diary average pain, Index Joint (Knee/Hip), Highest KL grade (2, 3 or 4), Treatment Group
Mixed BOCF/LOCF
Secondary Endpoint Analysis
The OMERACT-OARSI response atWeeks 2, 4, 8, 12, 16, and 24
ITT Logistic Regression BL Score (WOMAC Pain), BL diary average pain, Index Joint (Knee/Hip), Highest KL grade (2, 3 or 4), Treatment Group
BOCF Secondary Endpoint Analysis
The OMERACT-OARSI response at Weeks 2, 4, 8, 12, 16, and 24
ITT Logistic Regression BL Score (WOMAC Pain), BL diary average pain, Index Joint (Knee/Hip), Highest KL grade (2, 3 or 4), Treatment Group
LOCF Secondary Endpoint Analysis
Percentage of subjects with reduction of >30/50/70/90% from Baseline to Weeks 2, 4, 8, 12, 16, and 24 in the WOMAC Pain subscale
ITT Logistic Regression BL Score, BL diary average pain, Index Joint (Knee/Hip), Highest KL grade (2, 3 or 4), Treatment Group
Mixed BOCF/LOCF
Secondary Endpoint Analysis
Percentage of subjects with reduction of >30/50/70/90% from Baseline to Weeks 2, 4, 8, 12, 16, and 24 in the WOMAC Pain subscale
ITT Logistic Regression BL Score, BL diary average pain, Index Joint (Knee/Hip), Highest KL grade (2, 3 or 4), Treatment Group
BOCF Secondary Endpoint Analysis
Percentage of subjects with reduction of >30/50/70/90% from Baseline to Weeks 2, 4, 8, 12, 16, and 24 in the WOMAC Pain subscale
ITT Logistic Regression BL Score, BL diary average pain, Index Joint (Knee/Hip), Highest KL grade (2, 3 or 4), Treatment Group
LOCF Secondary Endpoint Analysis
Percentage of subjects with reduction of >30/50/70/90% from Baseline to Weeks 2, 4, 8, 12, 16, and 24 in the WOMAC Physical Function subscale
ITT Logistic Regression BL Score, BL diary average pain, Index Joint (Knee/Hip), Highest KL grade (2, 3 or 4), Treatment Group
Mixed BOCF/LOCF
Secondary Endpoint Analysis
Percentage of subjects with reduction of >30/50/70/90% from Baseline to Weeks 2, 4, 8, 12, 16, and 24 in the WOMAC Physical Function subscale
ITT Logistic Regression BL Score, BL diary average pain, Index Joint (Knee/Hip), Highest KL grade (2, 3 or 4), Treatment Group
BOCF Secondary Endpoint Analysis
Percentage of subjects with reduction of >30/50/70/90% from Baseline to Weeks 2,
ITT Logistic Regression BL Score, BL diary average pain, Index Joint (Knee/Hip), Highest KL
LOCF Secondary Endpoint
0901
77e1
900c
692f
\App
rove
d\Ap
prov
ed O
n: 2
1-D
ec-2
018
18:2
3 (G
MT)
0901
77e1
910c
8bd2
\App
rove
d\A
ppro
ved
On:
06-
Jun-
2019
06:
52 (
GM
T)
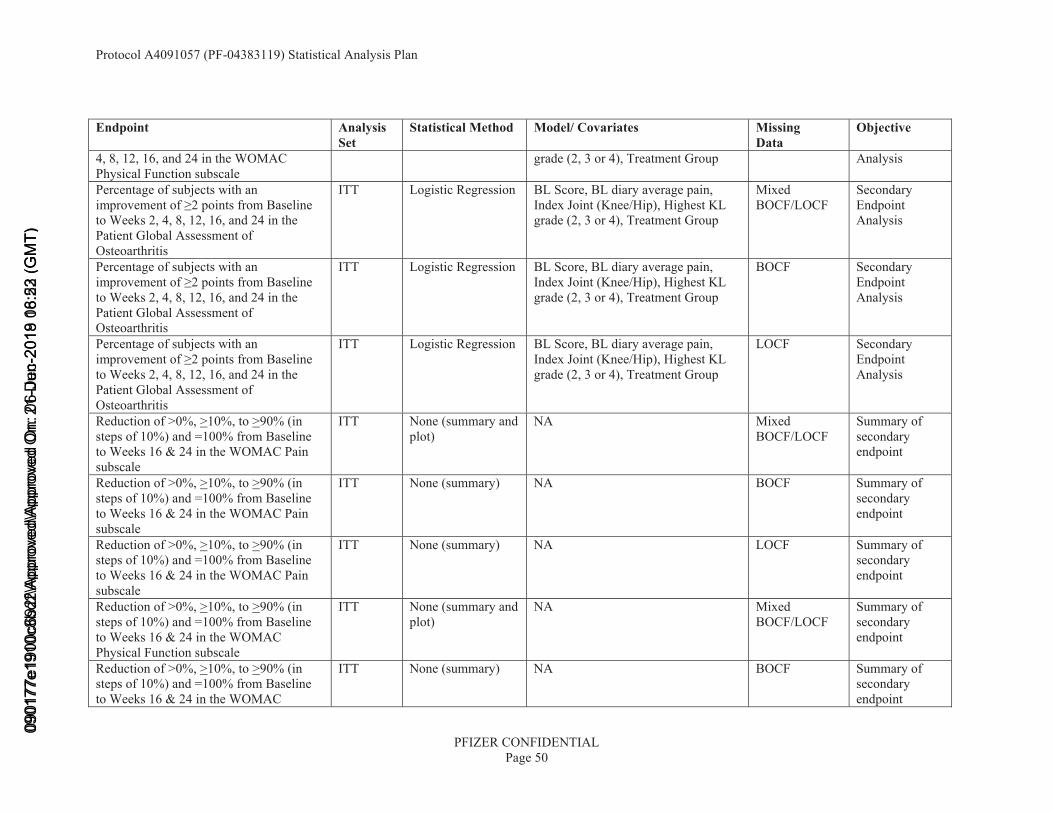
Protocol A4091057 (PF-04383119) Statistical Analysis Plan
PFIZER CONFIDENTIALPage 50
Endpoint Analysis Set
Statistical Method Model/ Covariates Missing Data
Objective
4, 8, 12, 16, and 24 in the WOMAC Physical Function subscale
grade (2, 3 or 4), Treatment Group Analysis
Percentage of subjects with an improvement of ≥2 points from Baseline to Weeks 2, 4, 8, 12, 16, and 24 in the Patient Global Assessment of Osteoarthritis
ITT Logistic Regression BL Score, BL diary average pain, Index Joint (Knee/Hip), Highest KL grade (2, 3 or 4), Treatment Group
Mixed BOCF/LOCF
Secondary Endpoint Analysis
Percentage of subjects with an improvement of ≥2 points from Baseline to Weeks 2, 4, 8, 12, 16, and 24 in the Patient Global Assessment of Osteoarthritis
ITT Logistic Regression BL Score, BL diary average pain, Index Joint (Knee/Hip), Highest KL grade (2, 3 or 4), Treatment Group
BOCF Secondary Endpoint Analysis
Percentage of subjects with an improvement of ≥2 points from Baseline to Weeks 2, 4, 8, 12, 16, and 24 in the Patient Global Assessment of Osteoarthritis
ITT Logistic Regression BL Score, BL diary average pain, Index Joint (Knee/Hip), Highest KL grade (2, 3 or 4), Treatment Group
LOCF Secondary Endpoint Analysis
Reduction of >0%, >10%, to >90% (in steps of 10%) and =100% from Baseline to Weeks 16 & 24 in the WOMAC Pain subscale
ITT None (summary and plot)
NA Mixed BOCF/LOCF
Summary of secondary endpoint
Reduction of >0%, >10%, to >90% (in steps of 10%) and =100% from Baseline to Weeks 16 & 24 in the WOMAC Pain subscale
ITT None (summary) NA BOCF Summary of secondary endpoint
Reduction of >0%, >10%, to >90% (in steps of 10%) and =100% from Baseline to Weeks 16 & 24 in the WOMAC Pain subscale
ITT None (summary) NA LOCF Summary of secondary endpoint
Reduction of >0%, >10%, to >90% (in steps of 10%) and =100% from Baseline to Weeks 16 & 24 in the WOMAC Physical Function subscale
ITT None (summary and plot)
NA Mixed BOCF/LOCF
Summary of secondary endpoint
Reduction of >0%, >10%, to >90% (in steps of 10%) and =100% from Baselineto Weeks 16 & 24 in the WOMAC
ITT None (summary) NA BOCF Summary of secondary endpoint
0901
77e1
900c
692f
\App
rove
d\Ap
prov
ed O
n: 2
1-D
ec-2
018
18:2
3 (G
MT)
0901
77e1
910c
8bd2
\App
rove
d\A
ppro
ved
On:
06-
Jun-
2019
06:
52 (
GM
T)
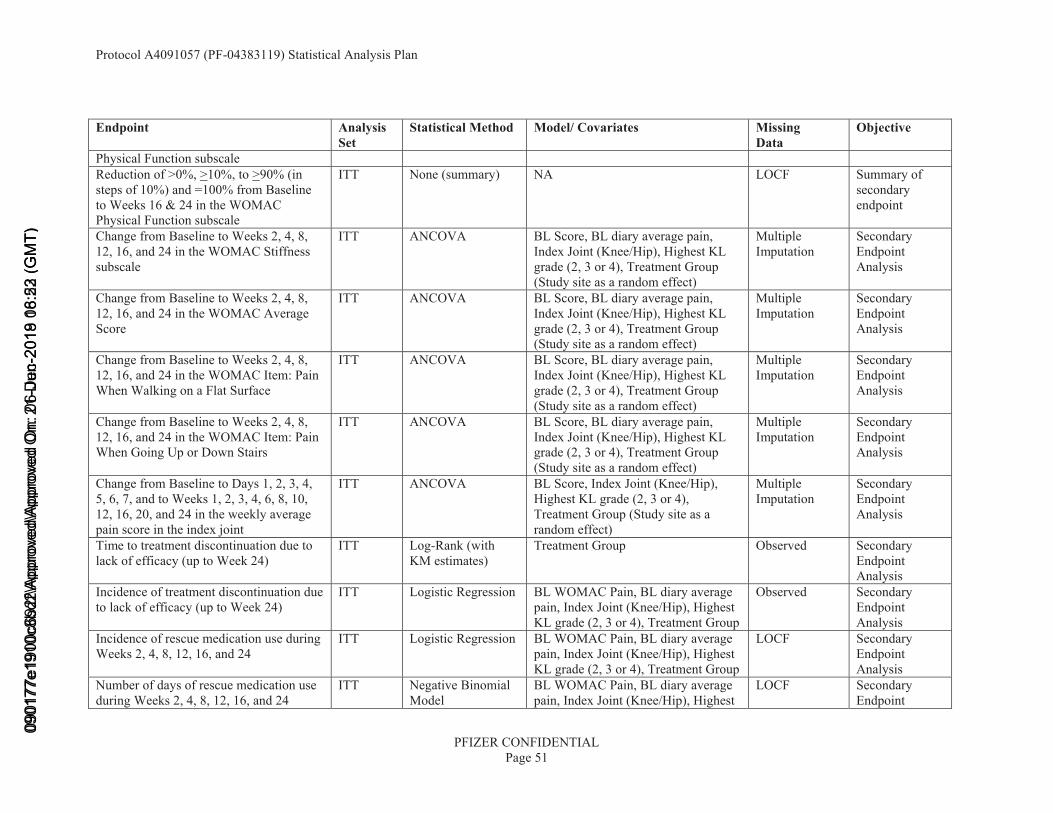
Protocol A4091057 (PF-04383119) Statistical Analysis Plan
PFIZER CONFIDENTIALPage 51
Endpoint Analysis Set
Statistical Method Model/ Covariates Missing Data
Objective
Physical Function subscaleReduction of >0%, >10%, to >90% (in steps of 10%) and =100% from Baseline to Weeks 16 & 24 in the WOMAC Physical Function subscale
ITT None (summary) NA LOCF Summary of secondary endpoint
Change from Baseline to Weeks 2, 4, 8, 12, 16, and 24 in the WOMAC Stiffness subscale
ITT ANCOVA BL Score, BL diary average pain, Index Joint (Knee/Hip), Highest KL grade (2, 3 or 4), Treatment Group (Study site as a random effect)
Multiple Imputation
Secondary Endpoint Analysis
Change from Baseline to Weeks 2, 4, 8, 12, 16, and 24 in the WOMAC Average Score
ITT ANCOVA BL Score, BL diary average pain, Index Joint (Knee/Hip), Highest KL grade (2, 3 or 4), Treatment Group (Study site as a random effect)
Multiple Imputation
Secondary Endpoint Analysis
Change from Baseline to Weeks 2, 4, 8, 12, 16, and 24 in the WOMAC Item: Pain When Walking on a Flat Surface
ITT ANCOVA BL Score, BL diary average pain, Index Joint (Knee/Hip), Highest KL grade (2, 3 or 4), Treatment Group (Study site as a random effect)
Multiple Imputation
Secondary Endpoint Analysis
Change from Baseline to Weeks 2, 4, 8, 12, 16, and 24 in the WOMAC Item: Pain When Going Up or Down Stairs
ITT ANCOVA BL Score, BL diary average pain, Index Joint (Knee/Hip), Highest KL grade (2, 3 or 4), Treatment Group (Study site as a random effect)
Multiple Imputation
Secondary Endpoint Analysis
Change from Baseline to Days 1, 2, 3, 4, 5, 6, 7, and to Weeks 1, 2, 3, 4, 6, 8, 10, 12, 16, 20, and 24 in the weekly average pain score in the index joint
ITT ANCOVA BL Score, Index Joint (Knee/Hip), Highest KL grade (2, 3 or 4), Treatment Group (Study site as a random effect)
Multiple Imputation
Secondary Endpoint Analysis
Time to treatment discontinuation due tolack of efficacy (up to Week 24)
ITT Log-Rank (with KM estimates)
Treatment Group Observed Secondary Endpoint Analysis
Incidence of treatment discontinuation due to lack of efficacy (up to Week 24)
ITT Logistic Regression BL WOMAC Pain, BL diary average pain, Index Joint (Knee/Hip), Highest KL grade (2, 3 or 4), Treatment Group
Observed Secondary Endpoint Analysis
Incidence of rescue medication use during Weeks 2, 4, 8, 12, 16, and 24
ITT Logistic Regression BL WOMAC Pain, BL diary average pain, Index Joint (Knee/Hip), Highest KL grade (2, 3 or 4), Treatment Group
LOCF Secondary Endpoint Analysis
Number of days of rescue medication use during Weeks 2, 4, 8, 12, 16, and 24
ITT Negative Binomial Model
BL WOMAC Pain, BL diary average pain, Index Joint (Knee/Hip), Highest
LOCF Secondary Endpoint
0901
77e1
900c
692f
\App
rove
d\Ap
prov
ed O
n: 2
1-D
ec-2
018
18:2
3 (G
MT)
0901
77e1
910c
8bd2
\App
rove
d\A
ppro
ved
On:
06-
Jun-
2019
06:
52 (
GM
T)

Protocol A4091057 (PF-04383119) Statistical Analysis Plan
PFIZER CONFIDENTIALPage 52
Endpoint Analysis Set
Statistical Method Model/ Covariates Missing Data
Objective
KL grade (2, 3 or 4), Treatment Group AnalysisAmount (mg) of rescue medication taken during Weeks 2, 4, 8, 12, 16 and 24
ITT Negative Binomial Model
BL WOMAC Pain, BL diary average pain, Index Joint (Knee/Hip), Highest KL grade (2, 3 or 4), Treatment Group
LOCF Secondary Endpoint Analysis
EQ-5D-5L dimensions (Mobility; Self-care; Usual activities; Pain/Discomfort; Anxiety/Depression), EQ-VAS and Overall Health Utility at Baseline and Weeks 8, 16 and 24
ITT Summary NA Observed Secondary EndpointAnalysis
mPRTI endpoints (willingness to re-use; patient preference; patient satisfaction) at Weeks 16 and 24)
ITT CMH test Treatment Group [1] Observed Secondary Endpoint Analysis
WPAI endpoints (% work time missed; % impairment while working; % overall work impairment; % activity impairment) at Weeks 8, 16, and 24
ITT ANCOVA BL Score, BL diary average pain, Index Joint (Knee/Hip), Highest KL grade (2, 3 or 4), Treatment Group(Study site as a random effect)
Observed Secondary Endpoint Analysis
Healthcare Resource Utilization at baseline, weeks 32 and 48
ITT Descriptive Summary
Treatment group Observed Secondary Endpoint Analysis
Change from baseline to Weeks 2, 4, 8,12, 16, 24, 32, and 48 in the NIS score, and Change from Baseline to Worst post-Baseline NIS score
ITT CMH test Treatment Group [1] LOCF (Weeks 8, 16, 24, 32, 40 & 48), Worstpost-baseline score
Safety Endpoint Analysis
Survey of Autonomic Symptoms (SAS), number of symptoms and total impact score (by visit and change from Baseline)
ITT Summary NA Observed, Safety EndpointAnalysis
[1] CMH test will be stratified by the levels of the combined stratification parameters (6 levels). If there are <15 subjects in any combined stratification level then the CMH test will be unstratified.
0901
77e1
900c
692f
\App
rove
d\Ap
prov
ed O
n: 2
1-D
ec-2
018
18:2
3 (G
MT)
0901
77e1
910c
8bd2
\App
rove
d\A
ppro
ved
On:
06-
Jun-
2019
06:
52 (
GM
T)
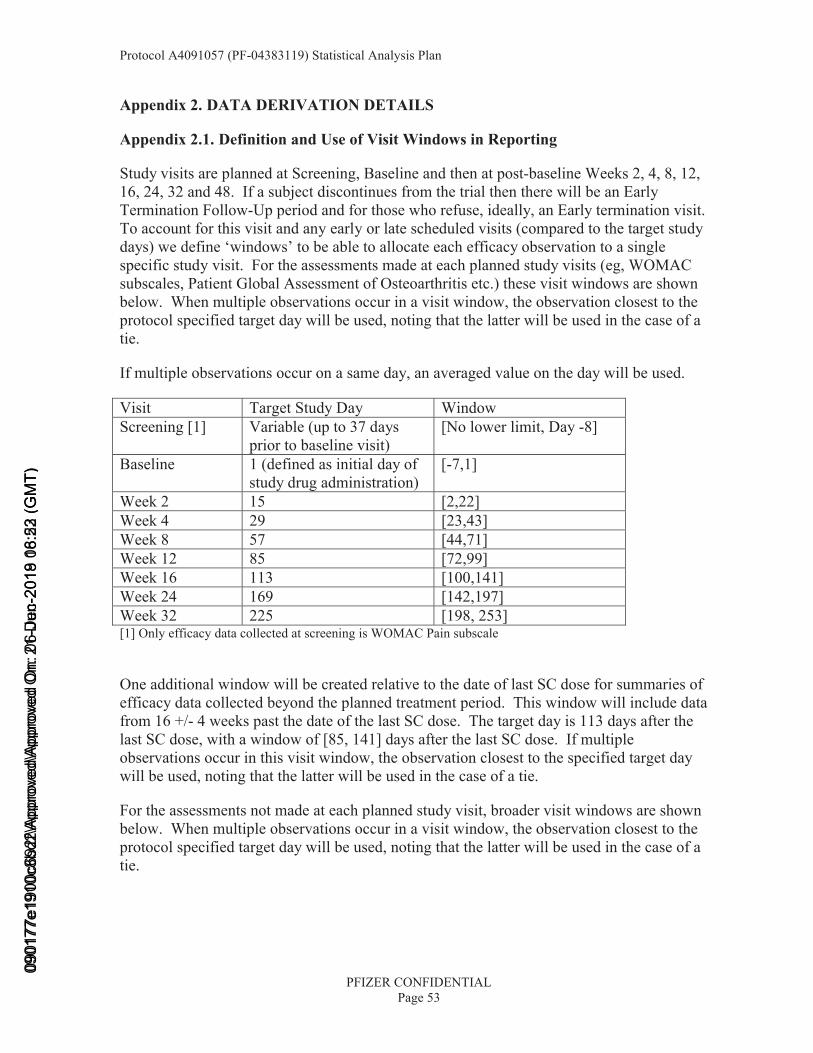
Protocol A4091057 (PF-04383119) Statistical Analysis Plan
PFIZER CONFIDENTIALPage 53
Appendix 2. DATA DERIVATION DETAILS
Appendix 2.1. Definition and Use of Visit Windows in Reporting
Study visits are planned at Screening, Baseline and then at post-baseline Weeks 2, 4, 8, 12, 16, 24, 32 and 48. If a subject discontinues from the trial then there will be an Early Termination Follow-Up period and for those who refuse, ideally, an Early termination visit. To account for this visit and any early or late scheduled visits (compared to the target study days) we define ‘windows’ to be able to allocate each efficacy observation to a single specific study visit. For the assessments made at each planned study visits (eg, WOMAC subscales, Patient Global Assessment of Osteoarthritis etc.) these visit windows are shown below. When multiple observations occur in a visit window, the observation closest to the protocol specified target day will be used, noting that the latter will be used in the case of a tie.
If multiple observations occur on a same day, an averaged value on the day will be used.
Visit Target Study Day WindowScreening [1] Variable (up to 37 days
prior to baseline visit)[No lower limit, Day -8]
Baseline 1 (defined as initial day of study drug administration)
[-7,1]
Week 2 15 [2,22]Week 4 29 [23,43]Week 8 57 [44,71]Week 12 85 [72,99]Week 16 113 [100,141]Week 24 169 [142,197]Week 32 225 [198, 253][1] Only efficacy data collected at screening is WOMAC Pain subscale
One additional window will be created relative to the date of last SC dose for summaries of efficacy data collected beyond the planned treatment period. This window will include data from 16 +/- 4 weeks past the date of the last SC dose. The target day is 113 days after the last SC dose, with a window of [85, 141] days after the last SC dose. If multiple observations occur in this visit window, the observation closest to the specified target day will be used, noting that the latter will be used in the case of a tie.
For the assessments not made at each planned study visit, broader visit windows are shown below. When multiple observations occur in a visit window, the observation closest to the protocol specified target day will be used, noting that the latter will be used in the case of a tie.
0901
77e1
900c
692f
\App
rove
d\Ap
prov
ed O
n: 2
1-D
ec-2
018
18:2
3 (G
MT)
0901
77e1
910c
8bd2
\App
rove
d\A
ppro
ved
On:
06-
Jun-
2019
06:
52 (
GM
T)
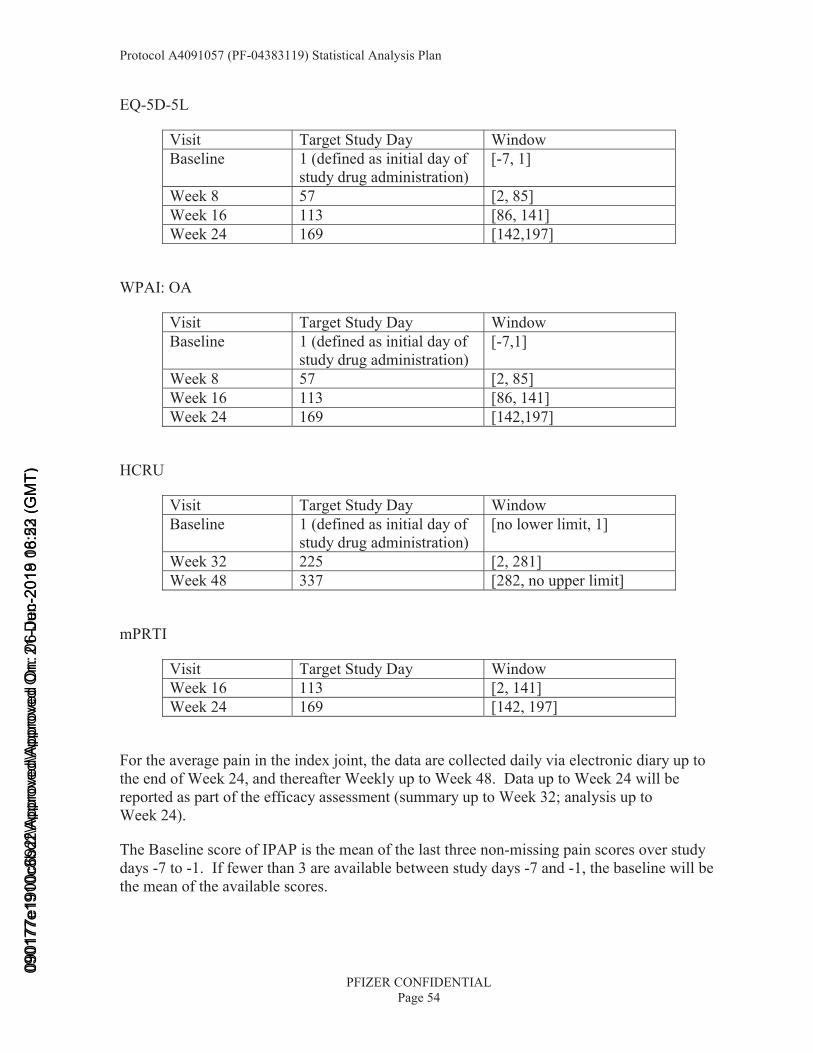
Protocol A4091057 (PF-04383119) Statistical Analysis Plan
PFIZER CONFIDENTIALPage 54
EQ-5D-5L
Visit Target Study Day WindowBaseline 1 (defined as initial day of
study drug administration)[-7, 1]
Week 8 57 [2, 85]Week 16 113 [86, 141]Week 24 169 [142,197]
WPAI: OA
Visit Target Study Day WindowBaseline 1 (defined as initial day of
study drug administration)[-7,1]
Week 8 57 [2, 85]Week 16 113 [86, 141]Week 24 169 [142,197]
HCRU
Visit Target Study Day WindowBaseline 1 (defined as initial day of
study drug administration)[no lower limit, 1]
Week 32 225 [2, 281]Week 48 337 [282, no upper limit]
mPRTI
Visit Target Study Day WindowWeek 16 113 [2, 141]Week 24 169 [142, 197]
For the average pain in the index joint, the data are collected daily via electronic diary up to the end of Week 24, and thereafter Weekly up to Week 48. Data up to Week 24 will be reported as part of the efficacy assessment (summary up to Week 32; analysis up to Week 24).
The Baseline score of IPAP is the mean of the last three non-missing pain scores over study days -7 to -1. If fewer than 3 are available between study days -7 and -1, the baseline will be the mean of the available scores.
0901
77e1
900c
692f
\App
rove
d\Ap
prov
ed O
n: 2
1-D
ec-2
018
18:2
3 (G
MT)
0901
77e1
910c
8bd2
\App
rove
d\A
ppro
ved
On:
06-
Jun-
2019
06:
52 (
GM
T)
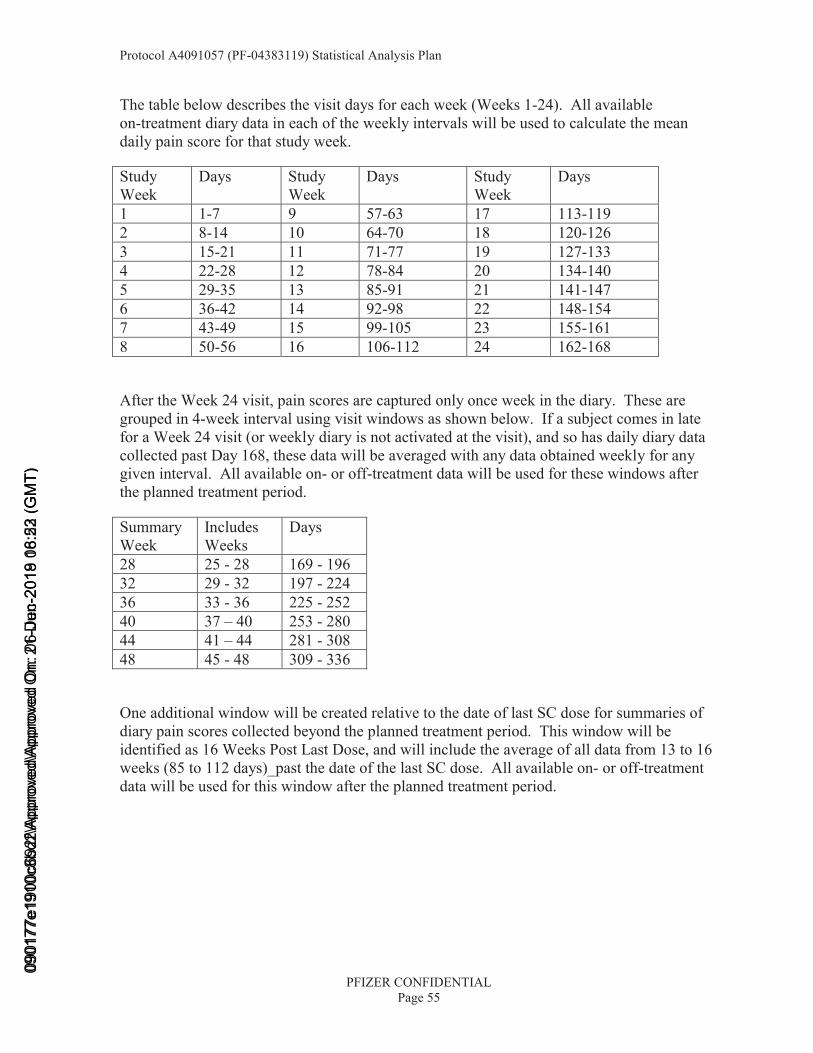
Protocol A4091057 (PF-04383119) Statistical Analysis Plan
PFIZER CONFIDENTIALPage 55
The table below describes the visit days for each week (Weeks 1-24). All available on-treatment diary data in each of the weekly intervals will be used to calculate the mean daily pain score for that study week.
Study Week
Days Study Week
Days Study Week
Days
1 1-7 9 57-63 17 113-1192 8-14 10 64-70 18 120-1263 15-21 11 71-77 19 127-1334 22-28 12 78-84 20 134-1405 29-35 13 85-91 21 141-1476 36-42 14 92-98 22 148-1547 43-49 15 99-105 23 155-1618 50-56 16 106-112 24 162-168
After the Week 24 visit, pain scores are captured only once week in the diary. These aregrouped in 4-week interval using visit windows as shown below. If a subject comes in late for a Week 24 visit (or weekly diary is not activated at the visit), and so has daily diary data collected past Day 168, these data will be averaged with any data obtained weekly for any given interval. All available on- or off-treatment data will be used for these windows after the planned treatment period.
Summary Week
Includes Weeks
Days
28 25 - 28 169 - 19632 29 - 32 197 - 22436 33 - 36 225 - 25240 37 – 40 253 - 28044 41 – 44 281 - 308 48 45 - 48 309 - 336
One additional window will be created relative to the date of last SC dose for summaries of diary pain scores collected beyond the planned treatment period. This window will be identified as 16 Weeks Post Last Dose, and will include the average of all data from 13 to 16 weeks (85 to 112 days)_past the date of the last SC dose. All available on- or off-treatment data will be used for this window after the planned treatment period.
0901
77e1
900c
692f
\App
rove
d\Ap
prov
ed O
n: 2
1-D
ec-2
018
18:2
3 (G
MT)
0901
77e1
910c
8bd2
\App
rove
d\A
ppro
ved
On:
06-
Jun-
2019
06:
52 (
GM
T)
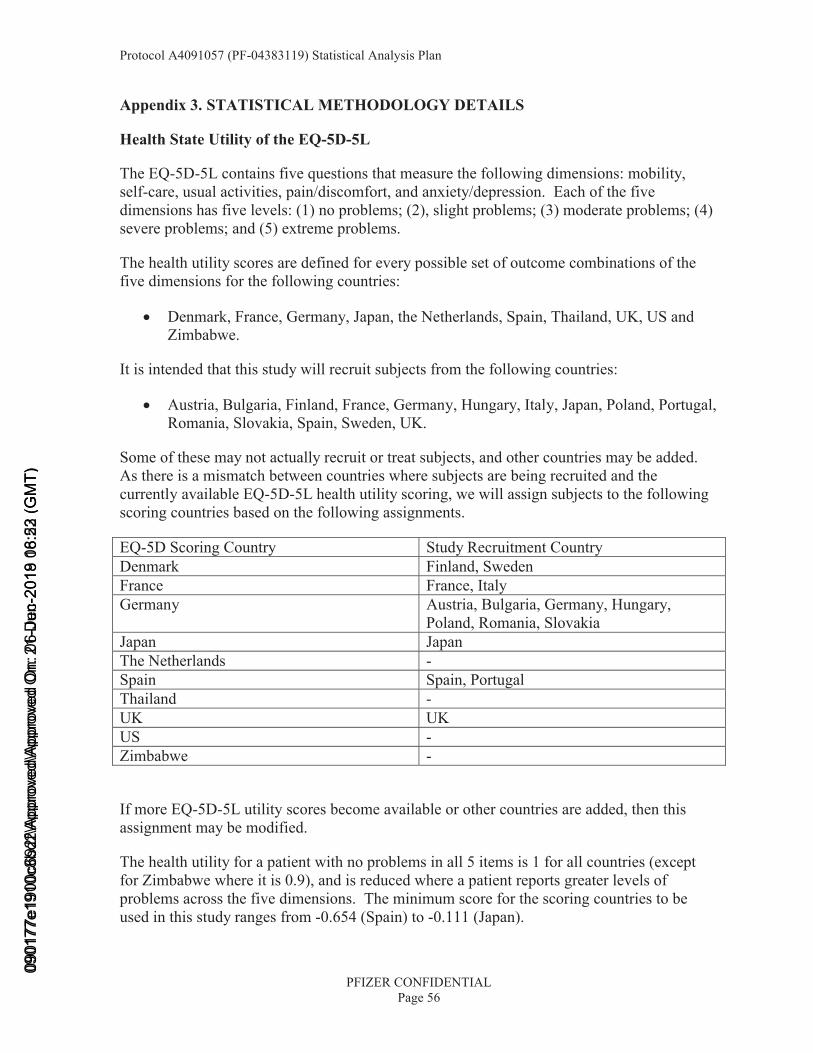
Protocol A4091057 (PF-04383119) Statistical Analysis Plan
PFIZER CONFIDENTIALPage 56
Appendix 3. STATISTICAL METHODOLOGY DETAILS
Health State Utility of the EQ-5D-5L
The EQ-5D-5L contains five questions that measure the following dimensions: mobility, self-care, usual activities, pain/discomfort, and anxiety/depression. Each of the five dimensions has five levels: (1) no problems; (2), slight problems; (3) moderate problems; (4) severe problems; and (5) extreme problems.
The health utility scores are defined for every possible set of outcome combinations of the five dimensions for the following countries:
• Denmark, France, Germany, Japan, the Netherlands, Spain, Thailand, UK, US and Zimbabwe.
It is intended that this study will recruit subjects from the following countries:
• Austria, Bulgaria, Finland, France, Germany, Hungary, Italy, Japan, Poland, Portugal, Romania, Slovakia, Spain, Sweden, UK.
Some of these may not actually recruit or treat subjects, and other countries may be added. As there is a mismatch between countries where subjects are being recruited and the currently available EQ-5D-5L health utility scoring, we will assign subjects to the following scoring countries based on the following assignments.
EQ-5D Scoring Country Study Recruitment CountryDenmark Finland, SwedenFrance France, ItalyGermany Austria, Bulgaria, Germany, Hungary,
Poland, Romania, SlovakiaJapan JapanThe Netherlands -Spain Spain, PortugalThailand -UK UKUS -Zimbabwe -
If more EQ-5D-5L utility scores become available or other countries are added, then this assignment may be modified.
The health utility for a patient with no problems in all 5 items is 1 for all countries (except for Zimbabwe where it is 0.9), and is reduced where a patient reports greater levels of problems across the five dimensions. The minimum score for the scoring countries to be used in this study ranges from -0.654 (Spain) to -0.111 (Japan).
0901
77e1
900c
692f
\App
rove
d\Ap
prov
ed O
n: 2
1-D
ec-2
018
18:2
3 (G
MT)
0901
77e1
910c
8bd2
\App
rove
d\A
ppro
ved
On:
06-
Jun-
2019
06:
52 (
GM
T)
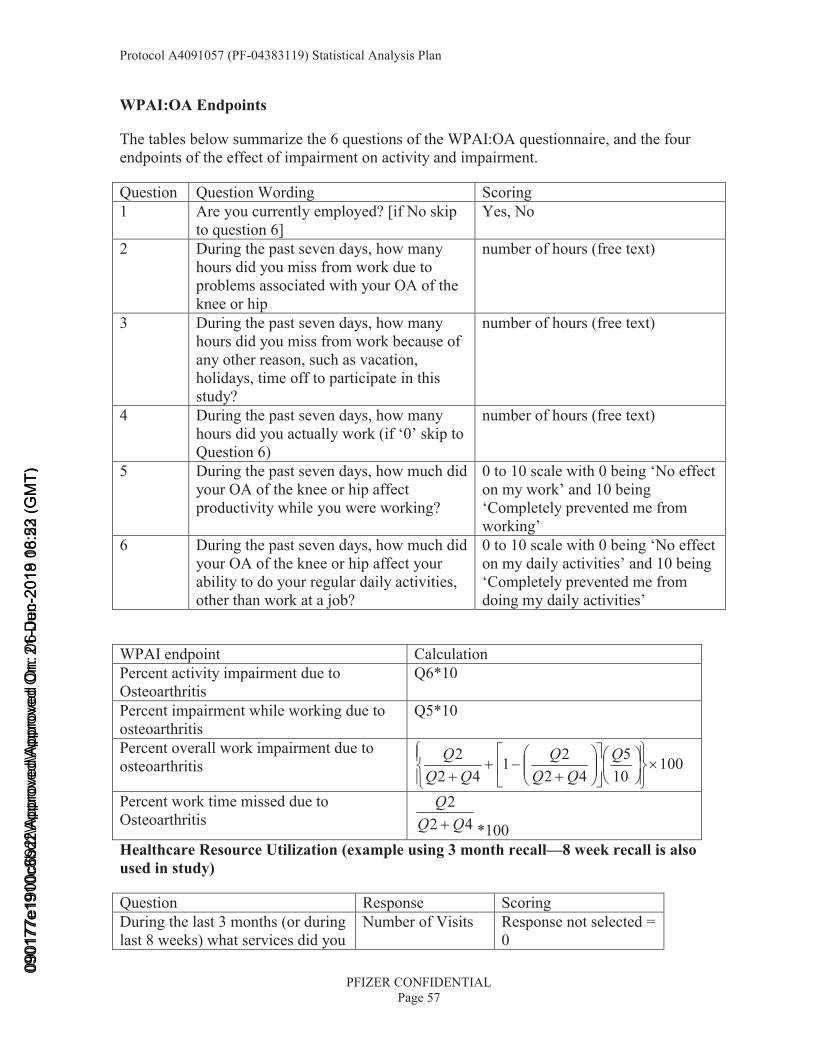
Protocol A4091057 (PF-04383119) Statistical Analysis Plan
PFIZER CONFIDENTIALPage 57
WPAI:OA Endpoints
The tables below summarize the 6 questions of the WPAI:OA questionnaire, and the four endpoints of the effect of impairment on activity and impairment.
Question Question Wording Scoring1 Are you currently employed? [if No skip
to question 6]Yes, No
2 During the past seven days, how many hours did you miss from work due to problems associated with your OA of the knee or hip
number of hours (free text)
3 During the past seven days, how many hours did you miss from work because of any other reason, such as vacation, holidays, time off to participate in this study?
number of hours (free text)
4 During the past seven days, how many hours did you actually work (if ‘0’ skip to Question 6)
number of hours (free text)
5 During the past seven days, how much did your OA of the knee or hip affect productivity while you were working?
0 to 10 scale with 0 being ‘No effect on my work’ and 10 being ‘Completely prevented me from working’
6 During the past seven days, how much did your OA of the knee or hip affect your ability to do your regular daily activities, other than work at a job?
0 to 10 scale with 0 being ‘No effect on my daily activities’ and 10 being ‘Completely prevented me from doing my daily activities’
WPAI endpoint CalculationPercent activity impairment due to Osteoarthritis
Q6*10
Percent impairment while working due to osteoarthritis
Q5*10
Percent overall work impairment due to osteoarthritis 100
105
4221
422
×⎪⎭
⎪⎬⎫
⎪⎩
⎪⎨⎧
⎟⎠⎞
⎜⎝⎛⎥⎦
⎤⎢⎣
⎡⎟⎟⎠
⎞⎜⎜⎝
⎛+
−++
QQQ
QQQ
Q
Percent work time missed due to Osteoarthritis 42
2QQ
Q+ *100
Healthcare Resource Utilization (example using 3 month recall—8 week recall is also used in study)
Question Response ScoringDuring the last 3 months (or during last 8 weeks) what services did you
Number of Visits Response not selected = 0
0901
77e1
900c
692f
\App
rove
d\Ap
prov
ed O
n: 2
1-D
ec-2
018
18:2
3 (G
MT)
0901
77e1
910c
8bd2
\App
rove
d\A
ppro
ved
On:
06-
Jun-
2019
06:
52 (
GM
T)

Protocol A4091057 (PF-04383119) Statistical Analysis Plan
PFIZER CONFIDENTIALPage 58
Question Response Scoringreceive directly related to your osteoarthritis?
• Primary Care Physician;
• Neurologist;
• Rhematologist;
• Physician Assistant or Nurse Practioner;
• Pain Specialist;
• Orthopedist;
• Physical Therapist;
• Chiropractor;
• Alternative Medicine or Therapy;
• Podiatrist;
• Nutritionist/Dietician;
• Radiologist;
• Home healthcare services;
• Other;
Number of visits = 1-999
During the past 3 months (or during last 8 weeks), have you visited the emergency room due to your osteoarthritis?
Yes, No No = 0Yes = 1
How many times? Number of visits 0-999 During the past 3 months (or during last 8 weeks), have you been hospitalized due to your osteoarthritis?
Yes, No No = 0Yes = 1
How many nights in total did you stay in hospital due to your osteoarthritis in the last 3 months(or during last 8 weeks)?
Number of Nights 0-999 (max should be 92)
Did you use these aids or devices Did not use any Did not use any aids or
0901
77e1
900c
692f
\App
rove
d\Ap
prov
ed O
n: 2
1-D
ec-2
018
18:2
3 (G
MT)
0901
77e1
910c
8bd2
\App
rove
d\A
ppro
ved
On:
06-
Jun-
2019
06:
52 (
GM
T)
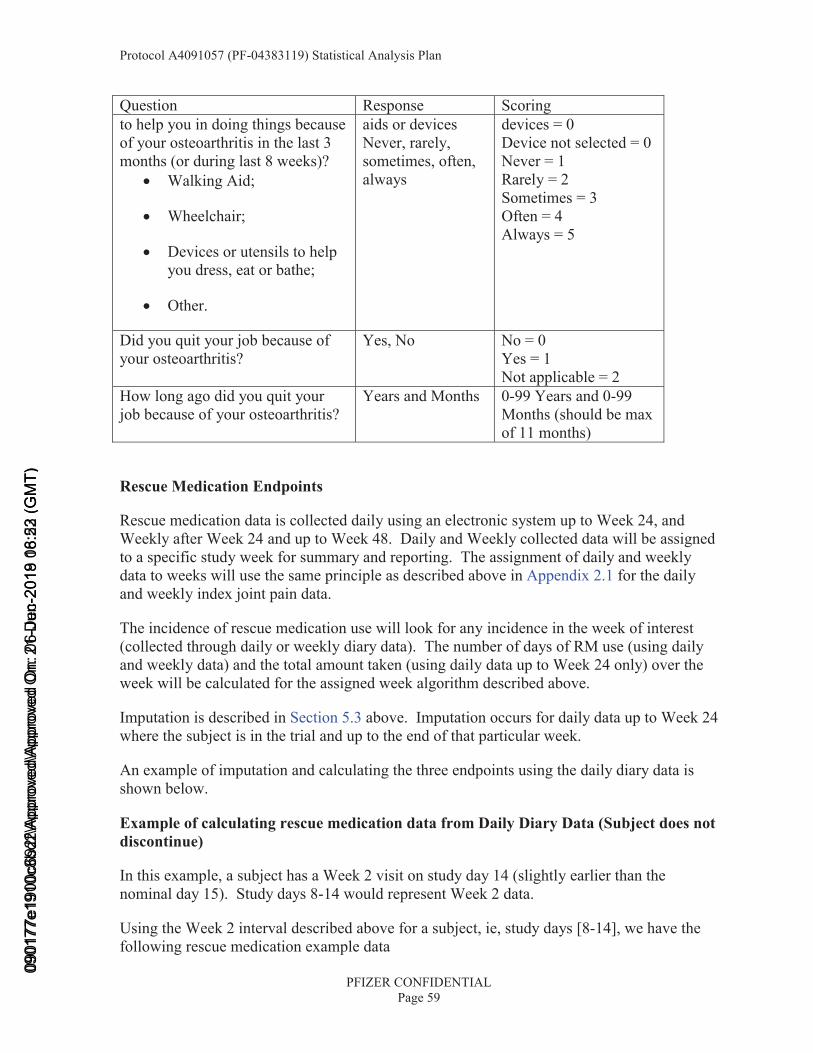
Protocol A4091057 (PF-04383119) Statistical Analysis Plan
PFIZER CONFIDENTIALPage 59
Question Response Scoringto help you in doing things because of your osteoarthritis in the last 3 months (or during last 8 weeks)?
• Walking Aid;
• Wheelchair;
• Devices or utensils to help you dress, eat or bathe;
• Other.
aids or devicesNever, rarely, sometimes, often, always
devices = 0Device not selected = 0Never = 1Rarely = 2Sometimes = 3Often = 4Always = 5
Did you quit your job because of your osteoarthritis?
Yes, No No = 0Yes = 1Not applicable = 2
How long ago did you quit your job because of your osteoarthritis?
Years and Months 0-99 Years and 0-99 Months (should be max of 11 months)
Rescue Medication Endpoints
Rescue medication data is collected daily using an electronic system up to Week 24, and Weekly after Week 24 and up to Week 48. Daily and Weekly collected data will be assigned to a specific study week for summary and reporting. The assignment of daily and weekly data to weeks will use the same principle as described above in Appendix 2.1 for the daily and weekly index joint pain data.
The incidence of rescue medication use will look for any incidence in the week of interest (collected through daily or weekly diary data). The number of days of RM use (using daily and weekly data) and the total amount taken (using daily data up to Week 24 only) over the week will be calculated for the assigned week algorithm described above.
Imputation is described in Section 5.3 above. Imputation occurs for daily data up to Week 24where the subject is in the trial and up to the end of that particular week.
An example of imputation and calculating the three endpoints using the daily diary data is shown below.
Example of calculating rescue medication data from Daily Diary Data (Subject does not discontinue)
In this example, a subject has a Week 2 visit on study day 14 (slightly earlier than the nominal day 15). Study days 8-14 would represent Week 2 data.
Using the Week 2 interval described above for a subject, ie, study days [8-14], we have the following rescue medication example data
0901
77e1
900c
692f
\App
rove
d\Ap
prov
ed O
n: 2
1-D
ec-2
018
18:2
3 (G
MT)
0901
77e1
910c
8bd2
\App
rove
d\A
ppro
ved
On:
06-
Jun-
2019
06:
52 (
GM
T)
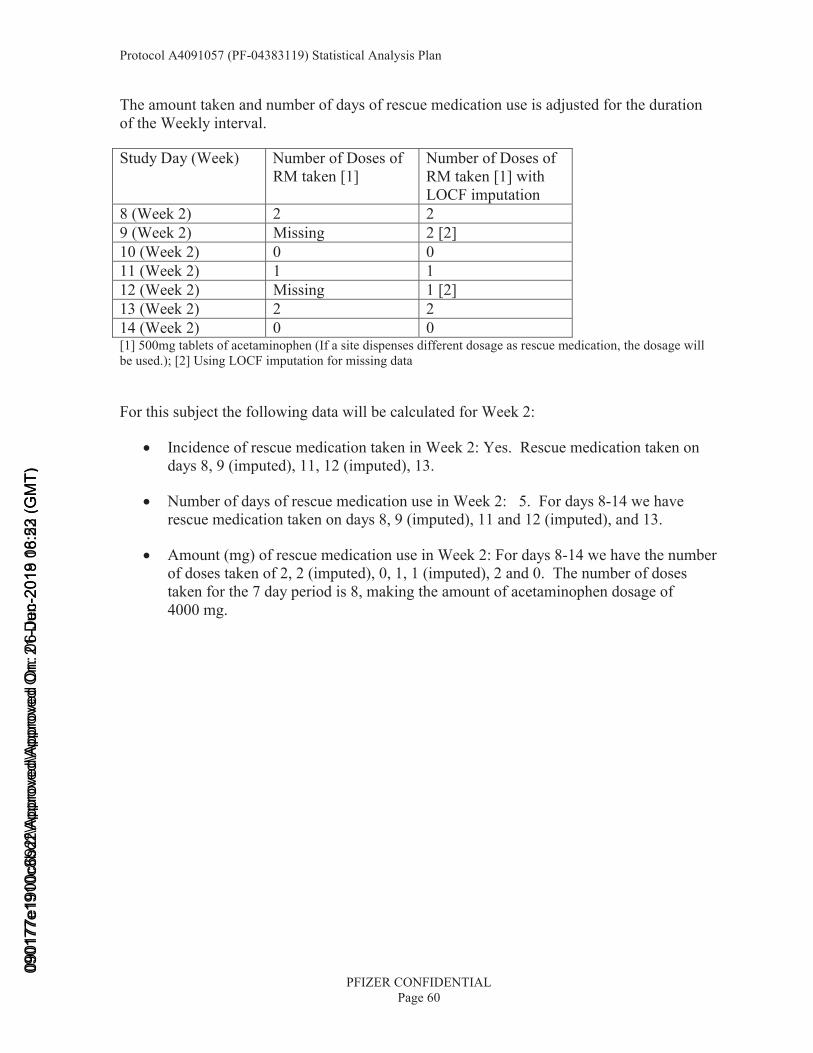
Protocol A4091057 (PF-04383119) Statistical Analysis Plan
PFIZER CONFIDENTIALPage 60
The amount taken and number of days of rescue medication use is adjusted for the duration of the Weekly interval.
Study Day (Week) Number of Doses of RM taken [1]
Number of Doses of RM taken [1] with LOCF imputation
8 (Week 2) 2 29 (Week 2) Missing 2 [2]10 (Week 2) 0 011 (Week 2) 1 112 (Week 2) Missing 1 [2]13 (Week 2) 2 214 (Week 2) 0 0[1] 500mg tablets of acetaminophen (If a site dispenses different dosage as rescue medication, the dosage will be used.); [2] Using LOCF imputation for missing data
For this subject the following data will be calculated for Week 2:
• Incidence of rescue medication taken in Week 2: Yes. Rescue medication taken on days 8, 9 (imputed), 11, 12 (imputed), 13.
• Number of days of rescue medication use in Week 2: 5. For days 8-14 we have rescue medication taken on days 8, 9 (imputed), 11 and 12 (imputed), and 13.
• Amount (mg) of rescue medication use in Week 2: For days 8-14 we have the number of doses taken of 2, 2 (imputed), 0, 1, 1 (imputed), 2 and 0. The number of doses taken for the 7 day period is 8, making the amount of acetaminophen dosage of 4000 mg.
0901
77e1
900c
692f
\App
rove
d\Ap
prov
ed O
n: 2
1-D
ec-2
018
18:2
3 (G
MT)
0901
77e1
910c
8bd2
\App
rove
d\A
ppro
ved
On:
06-
Jun-
2019
06:
52 (
GM
T)
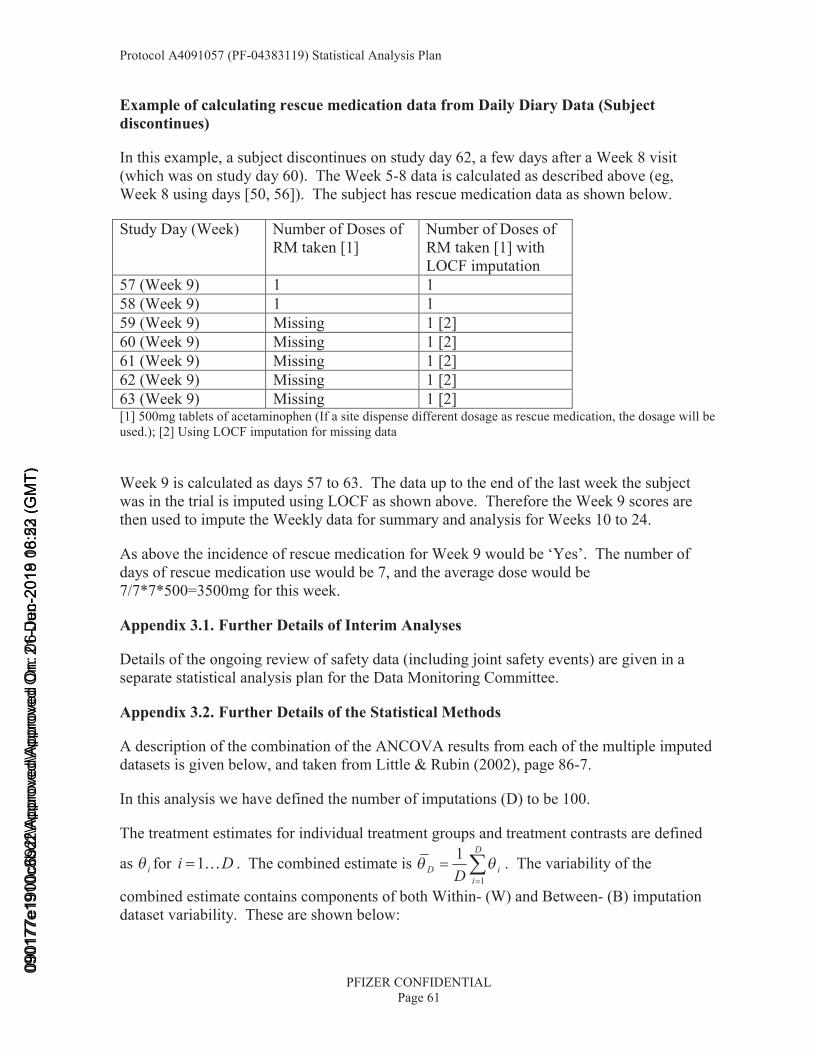
Protocol A4091057 (PF-04383119) Statistical Analysis Plan
PFIZER CONFIDENTIALPage 61
Example of calculating rescue medication data from Daily Diary Data (Subject discontinues)
In this example, a subject discontinues on study day 62, a few days after a Week 8 visit (which was on study day 60). The Week 5-8 data is calculated as described above (eg,Week 8 using days [50, 56]). The subject has rescue medication data as shown below.
Study Day (Week) Number of Doses of RM taken [1]
Number of Doses of RM taken [1] with LOCF imputation
57 (Week 9) 1 158 (Week 9) 1 159 (Week 9) Missing 1 [2]60 (Week 9) Missing 1 [2]61 (Week 9) Missing 1 [2]62 (Week 9) Missing 1 [2]63 (Week 9) Missing 1 [2][1] 500mg tablets of acetaminophen (If a site dispense different dosage as rescue medication, the dosage will be used.); [2] Using LOCF imputation for missing data
Week 9 is calculated as days 57 to 63. The data up to the end of the last week the subject was in the trial is imputed using LOCF as shown above. Therefore the Week 9 scores are then used to impute the Weekly data for summary and analysis for Weeks 10 to 24.
As above the incidence of rescue medication for Week 9 would be ‘Yes’. The number of days of rescue medication use would be 7, and the average dose would be 7/7*7*500=3500mg for this week.
Appendix 3.1. Further Details of Interim Analyses
Details of the ongoing review of safety data (including joint safety events) are given in a separate statistical analysis plan for the Data Monitoring Committee.
Appendix 3.2. Further Details of the Statistical Methods
A description of the combination of the ANCOVA results from each of the multiple imputed datasets is given below, and taken from Little & Rubin (2002), page 86-7.
In this analysis we have defined the number of imputations (D) to be 100.
The treatment estimates for individual treatment groups and treatment contrasts are defined
as iθ for Di K1= . The combined estimate is ∑=
=D
iiD D 1
1θθ . The variability of the
combined estimate contains components of both Within- (W) and Between- (B) imputation dataset variability. These are shown below:
0901
77e1
900c
692f
\App
rove
d\Ap
prov
ed O
n: 2
1-D
ec-2
018
18:2
3 (G
MT)
0901
77e1
910c
8bd2
\App
rove
d\A
ppro
ved
On:
06-
Jun-
2019
06:
52 (
GM
T)

Protocol A4091057 (PF-04383119) Statistical Analysis Plan
PFIZER CONFIDENTIALPage 62
∑=
=D
iiD W
DW
1
1 and ( )∑=
−−
=D
iDiD D
B1
2ˆ1
1θθ
where iW is the variance for the parameter iθ .
The total variance for Dθ is shown below:
DDD BD
DWT 1++= .
The test statistic ( )
D
D
Tθθ −
has a t-distribution with *v degrees of freedom, which is defined
below:
⎟⎟⎠
⎞⎜⎜⎝
⎛+=
obsvvv
ˆ11* ,
using
( )
( )
.11ˆ
1ˆ1ˆ
1111
3
2
D
DD
comcom
comDobs
D
D
TB
D
vv
vv
BW
DDv
⎟⎠⎞
⎜⎝⎛ +=
⎟⎟⎠
⎞⎜⎜⎝
⎛ +−=
⎟⎟⎠
⎞⎜⎜⎝
⎛+
+−=
+
γ
γ
This distribution can be used to construct the test statistics and 95% confidence intervals for θ.
0901
77e1
900c
692f
\App
rove
d\Ap
prov
ed O
n: 2
1-D
ec-2
018
18:2
3 (G
MT)
0901
77e1
910c
8bd2
\App
rove
d\A
ppro
ved
On:
06-
Jun-
2019
06:
52 (
GM
T)