approaching the ev tipping point
TRANSCRIPT

Confidential
Elaine BuckbergChief Economist
November 5, 2021
1
EVERYBODY INAPPROACHING THE EV TIPPING POINT

2

GM Confidential
CONSUMERS WANT A NO COMPROMISES EVTO GROW THE EV MARKET, ADDRESS FOUR PRIORITIES
3

GM Confidential 4Source: Consumer Reports, December 2020

GM Confidential
0%
5%
10%
15%
20%
25%
30%
35%
40%
2020 2021 2022 2023 2024 2025 2026 2027 2028 2029 2030
US BEV PenetrationGoldman Sachs Morgan Stanley LMC IHS Navigant BCG BNEF UBS Mid EV-Volumes
2025 2030
UBS (10/20) 11% 35%
BCG (4/21) 11% 31%
BNEF (6/21) 10% 31%
Goldman Sachs (12/20) 15% 30%
EV-Volumes.com (4/21) 11% 29%
Morgan Stanley (10/20) 10% 25%
Navigant (5/21) 8% 25%
LMC (5/21) 8% 20%
IHS (5/21) 11% 16%
FORECASTS OF U.S. EV ADOPTION RANGE WIDELY BUT CENTER AROUND ~30% IN 2030
5
Median

GM Confidential
BATTERY COSTS HAVE DECLINED ~20% PER YEAR WHILE EV RANGE IS INCREASING
Source: Bloomberg New Energy Finance
1,191
137
58
0
200
400
600
800
1,000
1,200
1,400
2010 2011 2012 2013 2014 2015 2016 2017 2018 2019 2020 2030
Volume-weighted average battery pack costReal 2020 $/kWh
94
335
387
0
50
100
150
200
250
300
350
400
MY 2011 MY 2018 MY 2021
6358 59
Median73
U.S. Electric Range, Miles
Median125
Median250
Source: Fuel economy.gov6

GM Confidential
24
69
153
2020 2022 2025
US: NUMBER OF EV ENTRIES INCREASING EXPONENTIALLY
Sources: General Motors, IHS VPaC May 2021
9
54
29
40
9
7
22
16
15
4
0
6
7
4
7
Pickup
Lux SUV/Crossover
Lux Car/Sports
SUV/Crossover
Car
2020 2022 2025
Total U.S. EV Entries Top EV Segments in U.S.
7

GM Confidential
CHINA: NUMBER OF EV ENTRIES IS INCREASING
242
345
433
0
50
100
150
200
250
300
350
400
450
500
2020 2022 2025
Sources: General Motors, IHS VPaC May 2021
13
49
35
179
106
12
24
18
150
93
10
12
8
95
78
Pickup
Lux SUV/Crossover
Lux Car/Sports
SUV/Crossover
Car
2020 2022 2025
Total China EV Entries Top EV Segments in China
8

GM Confidential
A BEV SAVES ~$1K IN FUEL COSTS PER YEAR ASSUMES RESIDENTIAL PRICES WHICH VARY BY STATE
1 Annual miles per vehicle according to Highway Statistics 2000; fhwa.dot.gov2 US average residential cost of electricity per kWh, Jul 2021; eia.gov3 US average retail gasoline price (all grades, all formulations), Sep 2021; eia.gov4 Median efficiency of 2021 MY electric vehicles is 104 mpge (or 3.1 mi/kWh); fueleconomy.gov5 Median fuel economy of 2021 MY gasoline vehicles; fueleconomy.gov
Internal Combustion Engine
Miles per year 1 12,416
Gasoline ($/gallon) 3 $3.27
Miles per gallon 5 23.6
Fuel cost per year $1,720
Battery Electric Vehicle
Miles per year 1 12,416
Electricity ($/kWh) 2 $0.14
Miles per kWh 4 3.1
Fuel cost per year $561
9

GM Confidential 10
EARLY ADOPTERS WILL DO MAJORITY OF CHARGING AT HOME OR WORK
U.S. Energy demand, home-centered scenario% of kilowatt-hours
Source: McKinsey, Charging ahead: electric vehicle infrastructure demand

GM Confidential
CY 2019 EV share of new vehicles and public chargers per million pop.For the 200 most populous U.S. metro areas
11
HOWEVER, AREAS WITH HIGHER EV ADOPTION TEND TO HAVE MORE PUBLIC CHARGING INFRASTRUCTURE
Source: ICCT, Update on electric vehicle adoption across U.S. cities, Aug. 2020

GM Confidential
CALIFORNIA CITIES HAVE MORE PUBLIC CHARGERS, HIGH MODEL AVAILABILITY, AND MANY OTHER INCENTIVES
Source: ICCT, August 202012

GM Confidential
1,4941,615
1,756 1,8201,926
2,0882,236 2,340
2,676
3,466
4,322
0
500
1,000
1,500
2,000
2,500
3,000
3,500
4,000
4,500
5,000
2010 2011 2012 2013 2014 2015 2016 2017 2018 2019 2020
U.S.: GROWTH IN FAST CHARGING IS ACCELERATING
Source: Alternative Fuels Data Center
+85%
DC Fast Charging Stations*U.S. Public and Private
*All DC Fast Charge Stations, including Tesla.Tesla has a fifth of all DC Fast stations (locations) and half of all DC Fast charging outlets.
13

GM Confidential 14
ICCT PROJECTS NEED FOR 180,000 DC FAST CHARGERS2.4M TOTAL CHARGERS BY 2030 TO SUPPORT EV MARKET
Charging Infrastructure Needed
Source: ICCT, Charging Up America, July 2021
Associated investment needed to support U.S. EV market through 2030

GM Confidential
1. Point of sale rebates and tax credits to buy U.S.-made EVs
House draft of budget reconciliation bill provides for consumer EV tax credits up to $12,500 for 10 years; tax credit for commercial EV purchases; and used EV tax credit
2. Public investment in charging stations (500K additional chargers by 2030)
Funding included in Bipartisan Infrastructure Package and Budget Reconciliation bill
3. Issued draft regulations tightening GHG and fuel economy standards
4. EVs included in $35 billion for climate focused R&D
5. Executive orders call for electrifying federal fleet, using tools to shift state/local/tribal fleets to zero emission. Budget reconciliation bill provides $3B in funding for federal fleet.
Source: White House. Fact Sheet: The American Jobs Plan (3/31/21), Executive Orders “Ensuring the Future Is Made in All of America by All of America’s Workers” (1/25/21) and "Tackling the Climate Crisis at Home and Abroad“ (1/27/21), joebiden.com.
EVS IN THE BIDEN ADMINISTRATION
15
GM Confidential
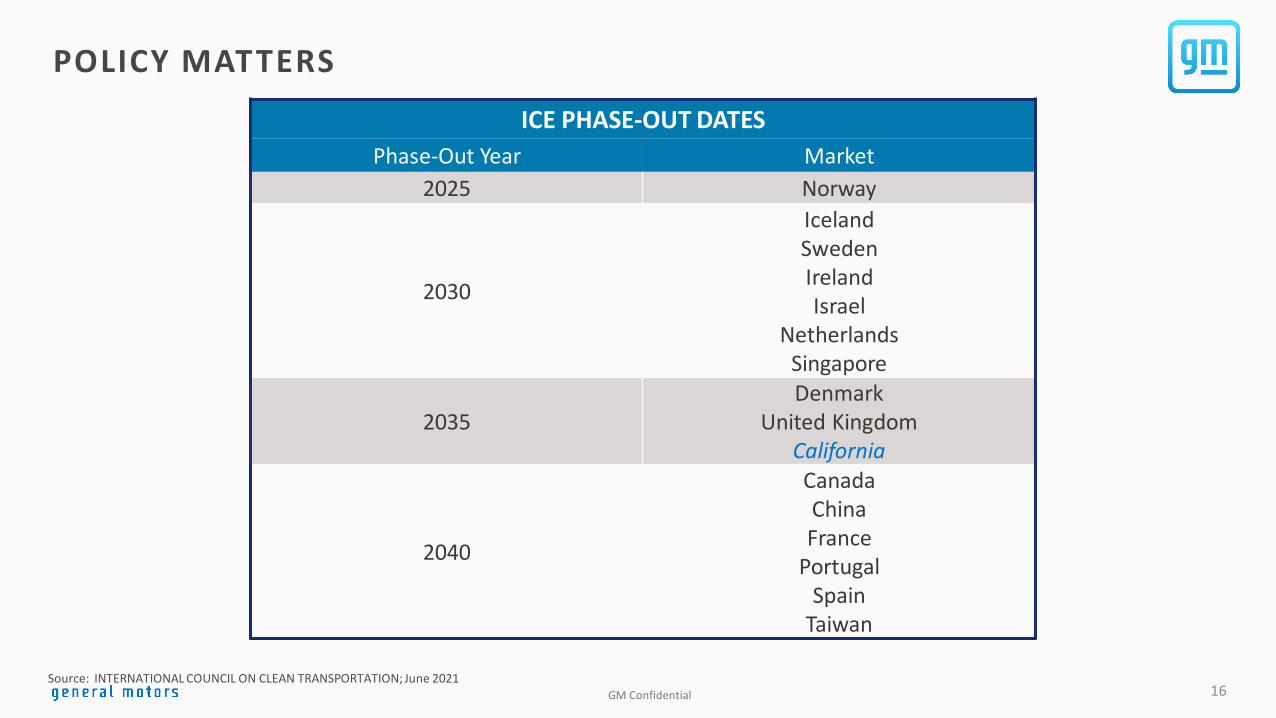
POLICY MATTERS
ICE PHASE-OUT DATES
Phase-Out Year Market
2025 Norway
2030
IcelandSwedenIrelandIsrael
NetherlandsSingapore
2035Denmark
United KingdomCalifornia
2040
CanadaChinaFrance
PortugalSpain
Taiwan
Source: INTERNATIONAL COUNCIL ON CLEAN TRANSPORTATION; June 202116

THANK YOU