approaches to visualization of trade networks ryan denniston duke data visualization friday forum...
TRANSCRIPT

APPROACHES TO VISUALIZATION OF TRADE NETWORKS
Ryan Denniston
Duke Data Visualization Friday Forum
November 16, 2012

Outline
• The nature of the problem(s)
• Non-spatial approaches (Excel)
• Spatial approaches (ArcGIS)
• Sharing options

The ProjectPolitical economy of tobacco control in Southeast Asia
• Southeast Asia increasingly wealthy, one of the few areas with low female prevalence

The Project
Political Economy of tobacco control in Southeast Asia
• Liberalized markets heighten importance of trade to health outcomes
• Principal origins and destinations of cigarettes within and from outside the region
• Especially large flows, indicative of transit points
• Trade discrepancies, suggesting smuggling activity
• Regional manufacturing hubs

The Project
ASEAN Region – AFTA operational in 1996

The Nature of the ProblemProvide a clear understanding of the underlying data• How important are the methods for the results?• Case selection (year, categories, etc.)
Effective communication to applied audiences• Visible impact with minimal explanation• Compelling• Mitigation of data anomalies (missing data, etc.)
Balance between comprehensiveness and complexity• At what point is the visualization overwhelming?• Who is the audience?

Project DataData• Time series, cross sectional (annual)
• Multiple levels of analysis
• Typical sources: UN Comtrade, FAO
Bilateral Trade Data

Non-Spatial Examples – Grouped Bars
• Visualizes relative positions of cases• Year and case selection not apparent• Single variable, no groupings without data manipulation
Cambodia Indonesia Malaysia Philippines Singapore Thailand Vietnam
-30,000
-20,000
-10,000
0
10,000
20,000
30,000
40,000
50,000
60,000
Net Trade, Cigarettes, Volume Basis
1990
2000
2008

Non-Spatial Examples – Stacked Column
2000 2005 2010
-300000000
-250000000
-200000000
-150000000
-100000000
-50000000
0
50000000
Vietnamese Cigarette Trade Discrepancies, Major Partners
Singapore China, Hong Kong SAR China, Macao SAR Malaysia Australia Germany France Greece United Kingdom
Brazil
• Visualizes relative positions of cases• Year selection not apparent
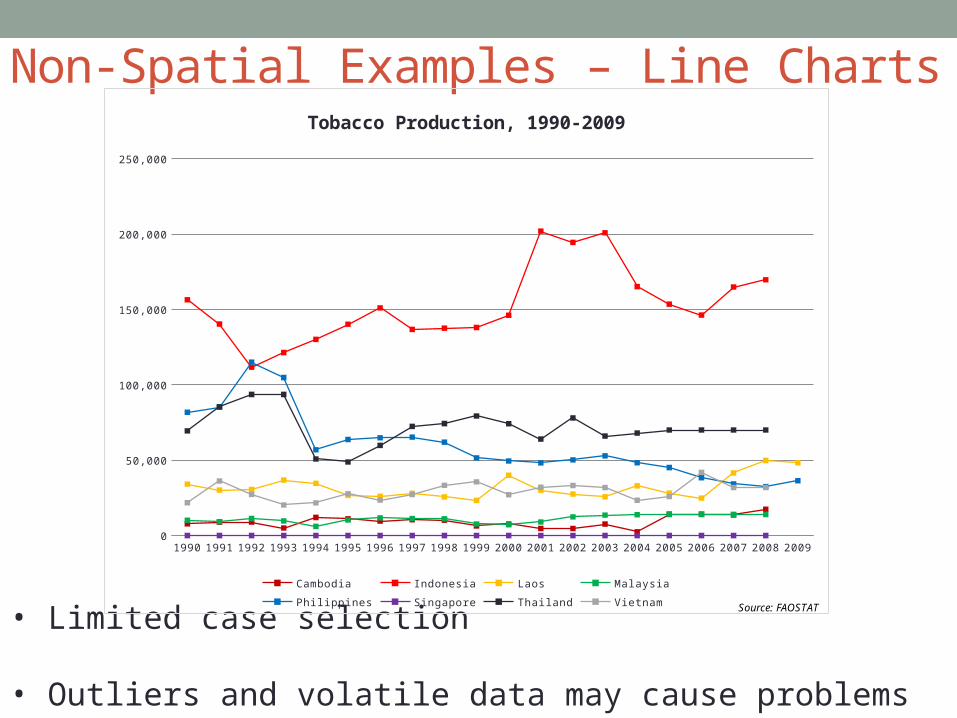
Non-Spatial Examples – Line Charts
• Limited case selection
• Outliers and volatile data may cause problems
1990 1991 1992 1993 1994 1995 1996 1997 1998 1999 2000 2001 2002 2003 2004 2005 2006 2007 2008 20090
50,000
100,000
150,000
200,000
250,000
Tobacco Production, 1990-2009
Cambodia Indonesia Laos Malaysia
Philippines Singapore Thailand Vietnam Source: FAOSTAT

Non-Spatial Examples – Line Chart
1990 1991 1992 1993 1994 1995 1996 1997 1998 1999 2000 2001 2002 2003 2004 2005 2006 2007 2008 20090
10,000
20,000
30,000
40,000
50,000
60,000
70,000
Cigarette Exports, 1990-2009
Cambodia Indonesia Laos Malaysia Philippines Singapore Thailand Vietnam
Source: UN Comtrade and FAOSTAT

Non-Spatial Examples – Line Chart
1990 1991 1992 1993 1994 1995 1996 1997 1998 1999 2000 2001 2002 2003 2004 2005 2006 2007 2008 20090
10
20
30
40
50
60
70
80
90
100
Percentage of Cigarette Exports to ASEAN Region, Volume Basis, 1990-2009
Cambodia Indonesia Laos Malaysia Philippines Singapore Thailand
Source: UN Comtrade and FAOSTATNote: ASEAN region defined as eight selected countries

Non-Spatial Examples – Radar Chart
Production (kg per capita)
Exports (kg per capita)
Consumption (kg per capita)
Imports (kg per capita) 0
1
2
Prototype Profile of Country with Little Trade Exposure

Non-Spatial Examples – Radar Chart
Production (kg per capita)
Exports (kg per capita)
Consumption (kg per capita)
Imports (kg per capita) 0
1
2
Prototype Profile of Country with Likely Transshipments

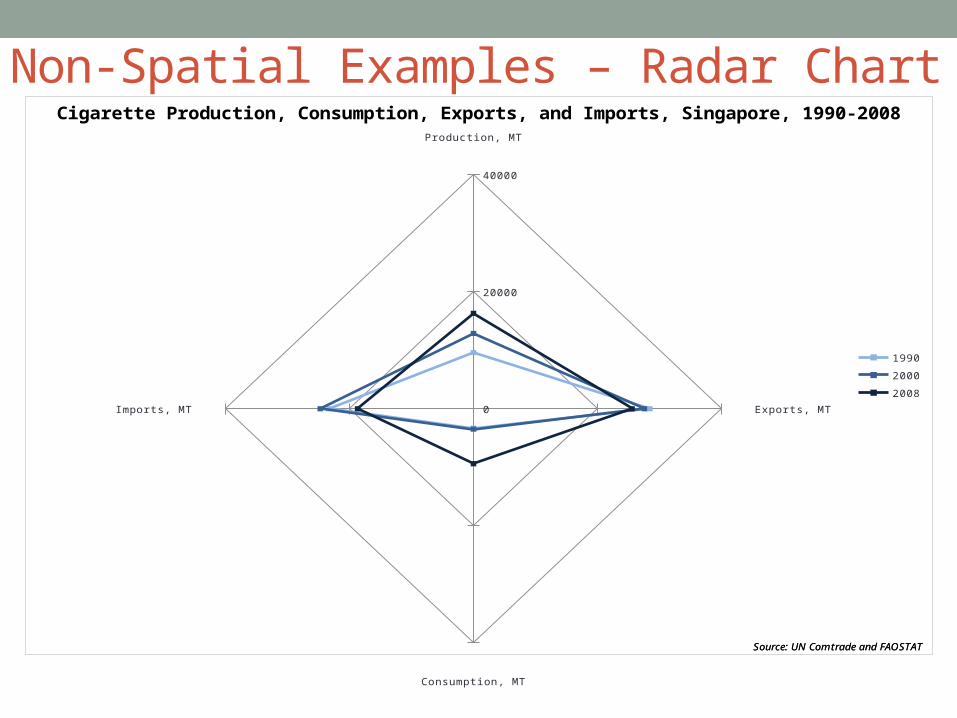
Non-Spatial Examples – Radar ChartProduction, MT
Exports, MT
Consumption, MT
Imports, MT -
50,000
100,000
2000
2008
Source: UN Comtrade and FAOSTATSource: UN Comtrade and FAOSTAT
Cigarette Production, Consumption, Exports, and Imports, Vietnam 1990-2008
Non-Spatial Examples – Radar ChartProduction, MT
Exports, MT
Consumption, MT
Imports, MT 0
20000
40000
1990
2000
2008
Source: UN Comtrade and FAOSTATSource: UN Comtrade and FAOSTAT
Cigarette Production, Consumption, Exports, and Imports, Singapore, 1990-2008

Non-Spatial Examples – Radar ChartProduction, MT
Exports, MT
Consumption, MT
Imports, MT -
20,000
40,000
1990
2000
2008
Source: UN Comtrade and FAOSTATSource: UN Comtrade and FAOSTAT
Cigarette Production, Consumption, Exports, and Imports, Cambodia, 1990-2008

Non-Spatial Examples - TradeoffsProblems• Data volatility when range of years displayed• Outliers distort when multiple cases displayed• Repeated cross-section (year selection)• Limited number of cases due to complexity• Others?

Spatial Examples – GIS SoftwareArcGIS essentially Excel with a column containing a shape (set of ordered coordinates)
• Qgis is an alternate program
• Recent tools launched to plot spatial data (addresses, lat/lon, some polygon sets, custom boundaries)

Spatial Examples – Choropleth Maps

Spatial Examples – Choropleth Maps

Spatial Examples – Choropleth Maps

Spatial ExamplesPotential problems• Year-over year volatility• Threshold selection (across cases and over time)• Zero value, not available• Time series, ArcGIS does not sense minimum and maximum• Trade networks at different level of analysis
Levels of analysis• Freeze one country, report its bilateral values over time• Find or create new layer at correct level of analysis

Spatial Examples – Bilateral Trade

Spatial Examples – Bilateral Trade
http://www.duke.edu/~rcd2/2.avi

Spatial Examples – Bilateral Trade

Spatial Examples – Bilateral Trade

Spatial Examples – Bilateral Trade
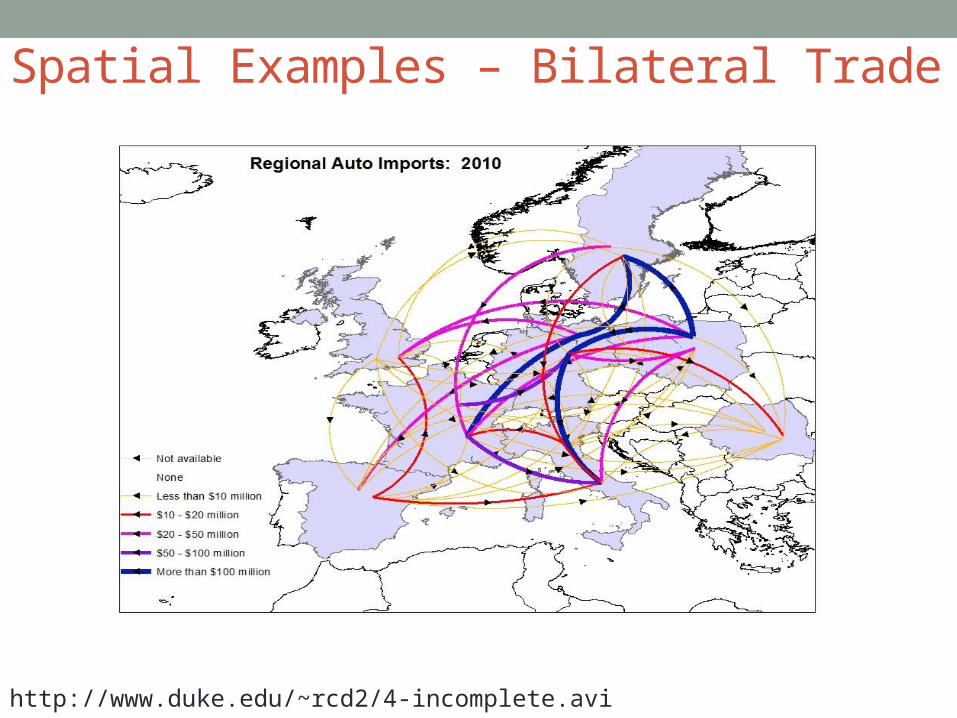
Spatial Examples – Bilateral Trade
http://www.duke.edu/~rcd2/4-incomplete.avi

Spatial ExamplesProblems• Volatility of data remains• Tradeoff between complexity and comprehensiveness• Threshold selection• Stability possible with grouping, data transformation
http://www.duke.edu/~rcd2/Untitled.avi

Spatial ExamplesArcScene is a 3D visualization and analysis program bundled with Map. Designed for x y z data, but can be coerced to multidimensional data.
Mathematica, R, Matlab are other, likely better alternatives

Tableau 7

Tableau 7 - Sharinghttp://public.tableausoftware.com/views/ag_nc/Sheet1

Tableau 7 – Custom Layershttp://public.tableausoftware.com/views/autos_test_1/Sheet1?:embed=y

Tableau 7 – Custom Layers
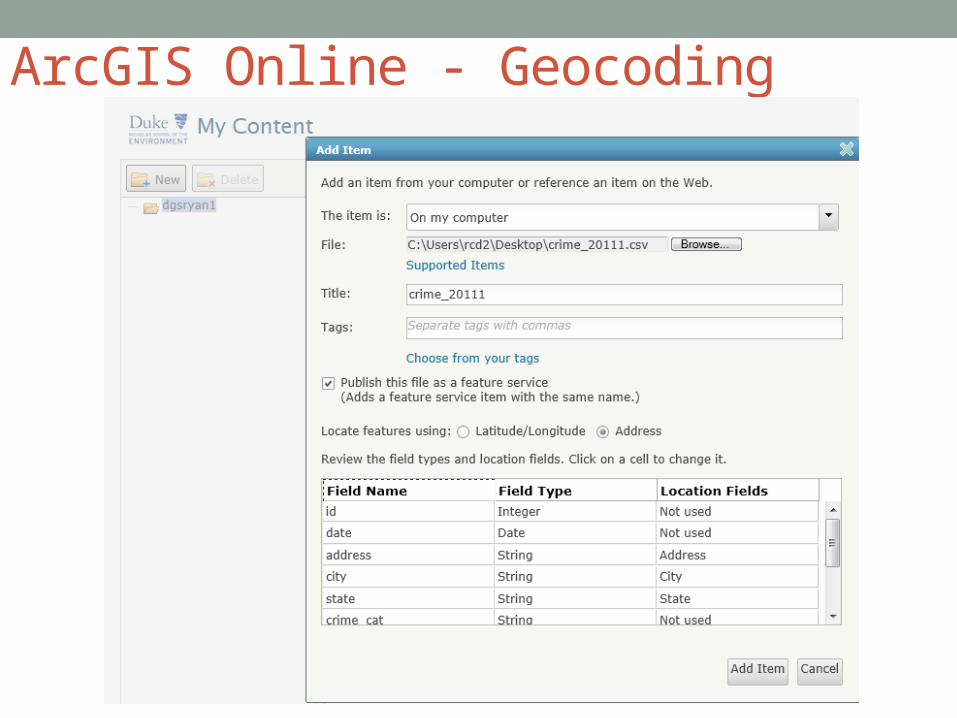
ArcGIS Online - Geocoding

ArcGIS Onlinehttps://dukeuniv.maps.arcgis.com/explorer/?open=213f0e846ea84d03b198b9339645a936&extent=-8797614.54634536,4293258.24833525,-8771524.04069068,4306656.81009333
http://people.duke.edu/~rcd2/arcgis.html

ArcGIS Online – Multiple Layers and Typeshttps://dukeuniv.maps.arcgis.com/explorer/?open=e43f3f5ef5b74d70b67ce9a9c49eef24&extent=-4388260.72929949,3794930.68242125,6008705.13322915,9285828.27856918

Google Fusion Tables

Google Fusion Tables
https://www.google.com/fusiontables/DataSource?docid=1AwhNH8tuJE1DKDCS2XIXE7coEn97mnjdWKt9Z-Q

Google Fusion Tables
https://www.google.com/fusiontables/DataSource?docid=1KGksrlD62Rbf0ZbymCMmQvnZohNwfhTFjiz64g

LinksVids
1. http://www.duke.edu/~rcd2/2.avi
2. http://www.duke.edu/~rcd2/4-incomplete.avi
3. http://www.duke.edu/~rcd2/Untitled.avi
Sites
1. http://public.tableausoftware.com/views/ag_nc/Sheet1
2. http://public.tableausoftware.com/views/autos_test_1/Sheet1?:embed=y
3. https://dukeuniv.maps.arcgis.com/explorer/?open=213f0e846ea84d03b198b9339645a936&extent=-8797614.54634536,4293258.24833525,-8771524.04069068,4306656.81009333
4. https://dukeuniv.maps.arcgis.com/explorer/?open=e43f3f5ef5b74d70b67ce9a9c49eef24&extent=-4388260.72929949,3794930.68242125,6008705.13322915,9285828.27856918
5. http://people.duke.edu/~rcd2/arcgis.html
6. https://www.google.com/fusiontables/DataSource?docid=1KGksrlD62Rbf0ZbymCMmQvnZohNwfhTFjiz64g