approaches to the validation of internal rating systems 200309_en_rating
TRANSCRIPT

8/7/2019 Approaches to the Validation of Internal Rating Systems 200309_en_rating
http://slidepdf.com/reader/full/approaches-to-the-validation-of-internal-rating-systems-200309enrating 1/13
DEUTSCHEBUNDESBANKMonthly ReportSeptember 2003
59
Approachesto the validationof internal ratingsystems
The new international capital standardfor credit institutions (Basel II) permits
banks to use internal rating systems for
determining the risk weights relevant
for calculating the capital charge. In
return the banks are obliged to regu-
larly review their rating systems (valid-
ation). Regulatory standards for valid-
ation are designed to ensure a uniform
framework for the prudential certifica-tion and ongoing monitoring of the in-
ternal rating systems used.
Validation represents a major chal-
lenge for both banks and supervisors.
It is true that the statistical methods
used for quantitative validation are
useful indicators of possible undesir-
able developments. As a rule, however,
it is not possible to deduce from them
a stringent criterion for assessing the
suitability of a rating system. For this
reason qualitative criteria will play an
important role in validation.
It is likely that the methods described
in this article will be further developed
and refined in the coming years, not
least owing to the increasing availabil-
ity of reliable data. In particular, the
future discussions generated both by
research and banking practice will pro-
vide additional insights into the
methods used for estimating the risk
parameters.
Rating systems serve to determine the credit
risk of individual borrowers. Using various

8/7/2019 Approaches to the Validation of Internal Rating Systems 200309_en_rating
http://slidepdf.com/reader/full/approaches-to-the-validation-of-internal-rating-systems-200309enrating 2/13
DEUTSCHEBUNDESBANKMonthly ReportSeptember 2003
60
methods, rating scores are assigned to indi-
vidual borrowers to indicate their degree of
creditworthiness.
In view of the envisaged prudential recogni-
tion of banks’ internal rating systems under
the two IRB (Internal Ratings-Based) ap-
proaches, the problems associated with their
quantitative and qualitative validation are cur-rently the subject of much discussion. The
term validation denotes the entire process of
assessing an internal rating system, from val-
idating its discriminatory power to process-
oriented validation (“use test”). The chart on
this page gives an overview of the main com-
ponents of the validation process for rating
systems.
The task of validating rating systems is closely
connected with the validation of additional
risk parameters that are derived from the rat-
ing assessments and which, under the IRB ap-
proaches of the new Basel minimum require-
ments (Basel II), largely determine the amount
of capital which a bank needs to maintain.
This article examines the problems associated
with validation without expressing any pru-dential choice for or against particular
methods. It reflects some of the best practices
as ascertained from a survey of German
banks carried out in the spring of 2003.
Quantitative aspects of validation
The precise nature of both quantitative and
qualitative validation greatly depends on the
Deutsche Bundesbank
Aspects of validation
Qualitative validationQuantitative validation
Cali-brationStability
Discrim in-atory
power
BenchmarkingBacktestingInternal
application(use test)
Data qualityModel design
Validation by thecredit institution

8/7/2019 Approaches to the Validation of Internal Rating Systems 200309_en_rating
http://slidepdf.com/reader/full/approaches-to-the-validation-of-internal-rating-systems-200309enrating 3/13
DEUTSCHEBUNDESBANKMonthly ReportSeptember 2003
61
character of the rating system in use. A basicdistinction is drawn between model-based
systems and systems based on expert judge-
ment.
Model-based systems, such as discriminant
analysis or various kinds of regression analy-
sis, are typically developed on the basis of his-
torical default data. If such data are not avail-
able on a sufficient scale, many practitioners
resort to a “shadow rating” which adopts the
credit assessment of external rating agencies.
A feature shared by all model-based systems
is that – using statistical methods – they cap-
ture a number of risk factors (eg total expos-
ure, equity capital or sector/profession) in a
risk ratio (rating score).
If little statistically significant information is
available or if the credit operations are of ma-terial importance or complex, the bank will
normally rely instead on expert judgement. In
such a rating system, too, a standardised pro-
cedure is normally applied for assigning the
ratings. The main difference between this
and model-based methods is that there is no
statistical modelling of the rating score.
In practice, the most common methods usedare hybrid forms combining elements of both
types of rating system. In such hybrid systems
the responsible credit expert can correct the
model-based rating if he has information of
which the model-based rating system takes
no or insufficient account.
All rating systems – whether model-based or
based on expert judgement – can essentially
be validated by quantitative means. However,
a quantitative validation requires a sufficientnumber of loan defaults. This requirement is
typically met in the case of retail business, ie
loans to small and medium-sized enterprises
or to individuals. The principal criteria for the
quantitative validation of a rating system are
its discriminatory power, its stability and its
calibration.
Discriminatory power and stability
The discriminatory power of a rating system
denotes its ability to discriminate ex ante be-
tween defaulting and non-defaulting borrow-
ers. The discriminatory power can be assessed
using a number of statistical measures of dis-
crimination, some of which are described in
detail in the Annex to this article. However,
the absolute measure of the discriminatory
power of a rating system is only of limitedmeaningfulness. A direct comparison of dif-
ferent rating systems, for example, can only
be performed if statistical “noise” is taken
into account. Such a comparison must be
based on the same dataset.
Moreover, the discriminatory power should
be tested not only in the development data-
set but also in an independent dataset (out-of-sample validation). Otherwise there is a
danger that the discriminatory power may be
overstated by over-fitting to the development
dataset. In this case the rating system will
then frequently exhibit a relatively low dis-
criminatory power on datasets that are inde-
pendent of but structurally similar to the de-
velopment dataset. Hence the rating system
would have a low stability.
Model-based rating systems
Expert
judgement
Hybrid systems
Criteria for quantitative
validation
Discriminatory power of arating system

8/7/2019 Approaches to the Validation of Internal Rating Systems 200309_en_rating
http://slidepdf.com/reader/full/approaches-to-the-validation-of-internal-rating-systems-200309enrating 4/13

8/7/2019 Approaches to the Validation of Internal Rating Systems 200309_en_rating
http://slidepdf.com/reader/full/approaches-to-the-validation-of-internal-rating-systems-200309enrating 5/13
DEUTSCHEBUNDESBANKMonthly ReportSeptember 2003
63
There are several tried and tested statisticalmethods for deriving the PDs (Probabilities of
Default) from a rating system. Firstly, a dis-
tinction needs to be drawn between direct
and indirect methods. In the case of the direct
methods, such as Logit, Probit and Hazard
Rate models, the rating score itself can be
taken as the borrower’s PD. The PD of a given
rating grade is then normally calculated as
the mean of the PDs of the individual borrow-
ers assigned to each grade.
Where the rating score cannot be taken as
the PD (as in the case of discriminant analy-
sis), one may resort to indirect methods. One
simple method consists of estimating the PD
for each rating grade from historical default
rates. Another method is the estimation of
the score distributions of defaulting borrow-
ers, on the one hand, and non-defaultingborrowers, on the other. A specific PD can
subsequently be assigned to each borrower
using Bayes’ Formula.
In practice a bank’s PD estimates will differ
from the default rates actually observed sub-
sequently. The key question is whether the
deviations are purely random or whether they
occur systematically. A systematic underesti-mation of PDs merits a critical assessment –
from the point of view of supervisors and
bankers alike – since in this case the bank’s
computed capital requirement would not be
adequate to the risk it has incurred.
Various statistical methods of assessing the
estimation quality of PDs are discussed in the
academic literature. Most of these methods
are based on backtesting. However, these
methods display shortcomings in practicewhich argue against their mechanical applica-
tion. These can be illustrated by means of the
binomial test, the technical details of which
are described in the Annex.
The binomial test was first incorporated into
prudential practice in connection with the
backtesting of market risk models. For the as-
sessment of PDs, too, it is possible to con-
struct a statistical test (using simplified as-
sumptions) based on the binomial distribu-
tion. It is assumed that the defaults per rating
grade are statistically independent. Under the
hypothesis that the estimated PDs of the rat-
ing grades are correct, the actually observable
number of defaults per rating grade after one
year would then be binomially distributed. If
major differences are evident between the
default rate and the estimated PD of the rat-ing grade, the hypothesis of a correct estima-
tion must be rejected. The rating model
would thus be poorly calibrated.
One problem associated with this test is the
assumption that the defaults of the borrow-
ers constitute independent events. In reality,
however, the defaults are more or less strong-
ly correlated owing to cyclical influences. The-oretically, a solution to this problem would be
conceivable if the default correlations were
known. But determining the default correl-
ations is difficult. Hence even a modified bi-
nomial test is suitable at most as an indicator
of a good or poor calibration.
Another approach to the statistical validation
of PDs is the use of benchmark portfolios. In
banking practice, for example, using external
Methods of calculating PD
Binomial test
8/7/2019 Approaches to the Validation of Internal Rating Systems 200309_en_rating
http://slidepdf.com/reader/full/approaches-to-the-validation-of-internal-rating-systems-200309enrating 6/13
DEUTSCHEBUNDESBANKMonthly ReportSeptember 2003
64
data from rating agencies and other commer-cial providers as a benchmark is widespread.
Systematic deviations of the bank’s internal
estimates from the estimates in the bench-
mark portfolio would have to be checked.
Benchmarking can serve as a useful comple-
ment to the validation process. However, the
usefulness of this approach depends very
much on the choice of a suitable benchmark
portfolio. The choice of a benchmark rating is
likewise generally not an easy task.
Besides an estimation of the PD, the IRB ad-
vanced approach under Basel II will also per-
mit banks to themselves estimate the LGD
(Loss Given Default) and the EAD (Exposure
At Default). A quantitative validation of the
LGDs consists in verifying the bank’s internal
estimates. The LGD of bank loans is deter-
mined mainly by the realisation of the loancollateral. If a loan is not repaid, the credit in-
stitution does not know how high the actual
loss is until the liquidation period is termin-
ated. The liquidation period may vary greatly,
depending on the precise features of the loan
and, in particular, on the collateral. As a rule
it is between 18 months and three years, but
in exceptional cases it may even exceed ten
years.
In order to calculate the actual loss it is neces-
sary to take account of all payment streams
that flow during the liquidation process and,
where appropriate, to assign them to individ-
ual collateral items. The payment streams
comprise payments made to the bank and
payments which the bank itself has to make.
The former consist primarily of partial pay-
ments made by the borrower or of proceeds
from realising collateral. The latter consist, forexample, of lawyer’s costs, court costs plus
cumulative interest charges and refinancing
costs during the liquidation process. Given
the duration of the liquidation process, the
payment streams have to be discounted be-
fore the actual economic LGD can be calcu-
lated.
A number of statistical studies already exist
which can be used to determine the LGDs of
exchange-traded corporate bonds. By con-
trast, standardised databases concerning
losses from unsecured loans are still at a rudi-
mentary stage of development. But in the
case of unsecured loans, too, it is likely that
the LGDs are very much sector-specific and
are strongly correlated with the default rates.
The LGD database must capture the losses
completely and must also contain those de-faulted loans where the unsecured shares
have not led to losses. The exclusive inclusion
of loans that have actually led to losses would
lead to an overstating of the LGD. It is also
common for several loans to be secured by
one and the same collateral item (eg a global
land charge). As a rule a credit institution will
try to estimate a separate realisation rate for
each category of collateral. In the case ofglobal collateral the collateral must be distrib-
uted across the individual loans.
Like the LGD, the validation of the EAD (Ex-
posure At Default) is based on the verification
of the bank’s internal estimates. For balance
sheet assets the Basel minimum requirements
envisage that the estimated values must not
be less than the currently drawn credit
amount (though netting effects may be taken
Use of benchmark portfolios and external data sources
Measuringthe LGDs
EAD
8/7/2019 Approaches to the Validation of Internal Rating Systems 200309_en_rating
http://slidepdf.com/reader/full/approaches-to-the-validation-of-internal-rating-systems-200309enrating 7/13
DEUTSCHEBUNDESBANKMonthly ReportSeptember 2003
65
into account). For derivative transactions thecredit equivalent amount is calculated from
the replacement cost plus an add-on for fu-
ture potential liabilities. The supplementary
prudential requirements in respect of the
bank’s internal estimates of the EAD are thus
concentrated on off-balance-sheet transac-
tions. A central problem is determining the
drawn share of credit line amounts at the
time of default. Studies indicate that there
are significant correlations between the EAD
and the residual maturity of the loan, and be-
tween the EAD and the borrower’s credit rat-
ing. Additional utilisation of the credit line
tends to increase the EAD in accordance with
the length of the residual maturity of the
loan. This is plausible, since the longer the re-
sidual maturity of a loan, the greater is the
probability that the borrower’s credit rating
will deteriorate and his potential access to al-ternative financing sources will diminish.
Other study findings indicate that the degree
of utilisation of the credit line by the time of
default tends to decrease in accordance with
the quality of the borrower’s credit rating at
the time the credit line was granted. The ar-
gument put forward to explain this is that,
faced with a borrower with a poor credit rat-
ing, a bank will insert clauses into the creditagreement that hamper his utilisation of the
approved credit line in the event of a further
deterioration in his rating.
The estimates can be greatly simplified if de-
pendencies on the creditworthiness and the
residual maturity do not have to be taken into
account. However, this harbours the risk that
neglecting these dependencies may systemat-
ically distort the estimates for the credit util-isation.
Qualitative aspects of validation
The quantitative validation methods have to
be complemented by qualitative – ie non-
statistical – methods. Qualitative validation
serves not least to safeguard the applicability
of quantitative methods. In these cases the
qualitative validation will have to be per-
formed before the quantitative validation.
The qualitative analyses primarily test three
aspects: the design of the rating models, the
quality of the data for the rating development
and deployment as well as the internal use of
the rating system in the credit-granting pro-
cess (“use test”).
Testing the model design plays a major role in
the case of model-based systems, in particu-
lar, but not just for these. This is especially
true whenever a quantitative validation is
subject to limitations owing to the dataset. In
any case the process of assigning the rating
must be transparent and well documented.
The influence of the risk factors should be dis-
cretely disaggregated and economicallyplausible. In addition, the demonstration of
statistical foundation is crucial in the case of
model-based systems.
A bank should, as a general rule, pay close at-
tention to the integrity of its data and their
consistent collection. Only a sound database
with a sufficiently large data history makes
possible the development of a high-quality
rating system and reliable estimates of the
Qualitativevalidation as acomplement toquantitativevalidation
Model design
Data quality and availability

8/7/2019 Approaches to the Validation of Internal Rating Systems 200309_en_rating
http://slidepdf.com/reader/full/approaches-to-the-validation-of-internal-rating-systems-200309enrating 8/13
DEUTSCHEBUNDESBANKMonthly ReportSeptember 2003
66
prudentially stipulated risk parameters. If thecredit institution itself has only a small data-
base of default information, it may resort if
necessary – as mentioned above – to external
data sources.
A second major criterion for the qualitative
validation of internal rating systems is the ac-
tual use of rating results in banks’ internal risk
management and reporting. This kind of
qualitative validation tests the design of the
internal bank processes and is therefore re-
ferred to as “process-oriented validation”. Ex-
amples of credit risk management using rat-
ing systems include ratings-based credit deci-
sions and credit-granting competencies, a
credit risk strategy geared to rating grades
and correspondingly structured limit systems.
In all of these applications a credit institution
bases important business policy decisions onthe risk assessment generated by internal rat-
ings.
From a prudential point of view the way in
which the bank uses its rating system for in-
ternal decision-making processes reflects the
confidence it has in its own system. Wherever
banks’ own rating systems are not used in-
ternally or are used only for individual, isol-ated purposes, this can be interpreted as an
internal assessment of the (deficient) quality
of the rating systems. A rating system that is
not sufficiently integrated into the bank’s in-
ternal credit processes will therefore not re-
ceive prudential approval.
The quantification of risk, expressed in PDs
and realisation or LGD rates, should likewise
be used for the bank’s internal purposes. The
most important example of this is the calcula-tion of the standard risk costs as part of con-
tribution margin costing. The calculation of
risk provisions based on standard risk costs is
another conceivable indicator of the internal
use of rating systems.
In addition, the Basel minimum requirements
for internal rating systems stipulate that rat-
ing decisions must not be influenced by other
business divisions that profit from the credit
decision either directly or indirectly. A particu-
larly important requirement is the independ-
ent assignment of ratings when using expert
judgements. In these cases the final rating
competence must lie with the back office
staff and not the front office staff. This ap-
plies even more so if the sales staff are remu-
nerated according to the volume of transac-
tions concluded. One of the qualitative cri-teria is therefore that the initial rating pro-
posal, which may potentially be made by the
customer account staff, must be reviewed
and confirmed by an independent third party.
Other key points of the validation process are
appropriate training for the staff and the ac-
ceptability of the rating systems to their
users. These must have a good understandingof the rating system and actually apply the
rating system in everyday business.
Prospect of using a central credit register
for validation purposes
If an institution seeks approval for internal
rating systems under Basel II, it must demon-
strate that its system has been adequately val-
Use test
Independence
Other factors

8/7/2019 Approaches to the Validation of Internal Rating Systems 200309_en_rating
http://slidepdf.com/reader/full/approaches-to-the-validation-of-internal-rating-systems-200309enrating 9/13
DEUTSCHEBUNDESBANKMonthly ReportSeptember 2003
67
idated. The task of the supervisors is to certifythe rating systems and to continuously moni-
tor compliance with these minimum require-
ments by the bank. In the context of this pro-
cess the bank’s internal validation procedures
also have to be assessed. In this connection
central credit registers can play an important
role. The Basel Committee on Banking Super-
vision is therefore currently considering their
possible application for this purpose.
The main precondition for using a central
credit register for prudential purposes is the
availability of information about loan de-
faults, banks’ internal rating grades and the
collateralisation of the loans. This information
is already available in part on the central
credit registers of certain countries. A central
credit register has the advantage over the al-
ternative of individual enquiries, by virtue ofstandardised borrower IDs, of being able to
compare the rating of different banks for one
and the same borrower (benchmarking). The
sample selected for the comparison could be
defined flexibly. Moreover, the reporting sys-
tem would cover the entire range of banks.
Another field of application of credit registers
in connection with validation questions isbacktesting. As explained above, backtesting
involves comparing the estimated PDs with
the actually observed defaults. In principle,
this would make it possible to test banks’ in-
ternal quantitative validation.
Thus central credit registers could, in prin-
ciple, play a supporting role in the prudential
certification of rating systems and their over-
sight. Depending on the scale of the investi-
gations which this would necessitate, thiswould require making modifications to the
central credit registers in their current form.
This should be decided on the basis of careful
cost/benefit considerations. The primary ap-
plication of central credit registers will prob-
ably be the benchmarking of estimates of dif-
ferent credit institutions. By contrast, the use
of credit registers for backtesting comes up
against limits owing to the high degree of de-
tail required for the relevant credit informa-
tion.
Outlook
Banks and banking supervisors are currently
preparing intensively for the validation of rat-
ing systems. With a view to further develop-
ing the approaches to validation, a workinggroup for validation issues has been set up
under the stewardship of the Research Task
Force of the Basel Committee on Banking
Supervision. The steep increase in the number
of publications on this subject in recent years
shows that academics are also considering
this question. However, the suitability of indi-
vidual methods is still disputed. One thing
that is certain is that the assessment of in-ternal rating systems cannot be based on a
single validation method but instead will
emerge as the synthesis of various quantita-
tive and qualitative methods. The current dis-
cussion will lead to the further refinement of
validation methods. In addition, the quality
and quantity of the available data will im-
prove substantially in the coming years. The
resulting insights will be incorporated into the
prudential validation standards.
Required database
Use for backtesting

8/7/2019 Approaches to the Validation of Internal Rating Systems 200309_en_rating
http://slidepdf.com/reader/full/approaches-to-the-validation-of-internal-rating-systems-200309enrating 10/13
DEUTSCHEBUNDESBANKMonthly ReportSeptember 2003
68
Annex
Statistical measures of discriminatory power
The CAP curve provides a graphical illustration of
the discriminatory power of a rating process. For
this purpose, the creditworthiness indicator (score)
of every borrower is established for the dataset to
be used to examine the rating model’s discrimin-
atory power. This score can be continuous, for in-
stance the result of a discriminant analysis or a
Logit regression, or it may be an integer which rep-
resents the rating grade to which the borrower has
been assigned. In the following analysis, it is as-
sumed that a high score is a reflection of a good
rating. In a first step the borrowers are arranged in
an ascending order of scores. The CAP curve is
then determined by plotting the cumulative per-
centage of all borrowers (“alarm rate”) on the
horizontal axis and the cumulative percentage ofall defaulters (“hit rate”) on the vertical axis. This is
shown in the adjacent chart. If, for example, those
30% of all debtors with the lowest rating scores
include 70% of all defaulters, the point (0.3;0.7)
lies on the CAP curve. The steeper the CAP curve
at the beginning, the more accurate the rating pro-
cess. Ideally, the rating process would give all de-
faulters the lowest scores. The CAP curve would
then rise linearly at the beginning before becoming
horizontal. The other extreme would be a purely
random rating classification. Such a rating process
would not have any discriminatory power. The ex-
pected CAP curve would, in this case, be identical
to the diagonal. In reality, rating classifications are
neither perfect nor random. The corresponding
CAP curve therefore runs between these two ex-
tremes. Using the CAP curve, the discriminatory
power of a rating process can be aggregated into
a single figure, the so-called “Gini coefficient” 1
(GC). In the above chart, the area between the
perfect rating and the random rating is denoted by
ap and the area between the actual rating and the
random rating is denoted by a R. The Gini coeffi-
cient is defined as the ratio of a R to a p , which
means
GC ¼aR
aP:
The Gini coefficient is always between minus one
and one. A rating system is the more accurate the
closer it is to one.
The ROC curve is a concept related to the CAP
curve. In order to plot this curve, the empirical
score distribution for defaulters, on the one hand,
and for non-defaulters, on the other, is deter-
Deutsche Bundesbank
Cumulative Accuracy Prole(CAP)* and Gini coefcient **
* For each rating score the alarm rate meas-ures the fraction of borrowers with a lower-than-specied score within all borrowers.The hit rate gives, for each rating score, thefraction of defaulters with a lower-than-specied score within all defaulters. Process-ing all possible scores yields the points ofthe CAP curve. — ** The Gini coefcient isthe quotient of the area a R, between theCAP curve and the diagonal, and the area a Pof the shaded triangle. The larger the quo-tient, the more accurate the rating process.
Alarm rate
100
%
H i t r a
t e
100 %0
a P
a R
perfect model
CAP curve of therating system
random model
1 The Gini coefficient is often termed the “accuracyratio”.
Cumulative Accuracy Profile(CAP)
Gini coefficient (GC)
Receiver OperatingCharacteristic (ROC)

8/7/2019 Approaches to the Validation of Internal Rating Systems 200309_en_rating
http://slidepdf.com/reader/full/approaches-to-the-validation-of-internal-rating-systems-200309enrating 11/13
DEUTSCHEBUNDESBANKMonthly ReportSeptember 2003
69
mined. The result could be similar to that shown inthe chart on page 70. Next, a score C is set. Using
this score C, it is possible to define a simple
decision-making rule for identifying potential de-
faulters. All borrowers with a score greater than C
are deemed to be creditworthy and those with a
lower score are deemed to be not creditworthy.
One of the features of a good rating system is that
it has as high a hit rate as possible (correct classifi-
cation of a borrower as a potential defaulter) and
at the same time as low a false alarm rate as pos-
sible (incorrect classification of a creditworthy bor-
rower as a potential defaulter). In order to analyse
the discriminatory power of a rating system irre-
spective of the chosen cut-off value C, both the
false alarm rate and the hit rate are calculated for
every C between the maximum and the minimum
score. The points determined in this way yield the
ROC curve (see adjacent chart). The steeper the
ROC curve at the beginning, the more accuratethe rating system. In a perfect rating system, the
ROC curve would be plotted solely on the line de-
fined by the points (0;0), (0;1) and (1;1). In a purely
random rating system, the ROC curve would be
plotted exactly along the diagonal in the adjacent
chart.
As for the CAP curve, an aggregated ratio can also
be given for the ROC curve. This ratio results from
the area under the ROC curve and is called the
AUC. The AUC ratio is always between zero and
one. The closer the AUC is to one, the more accur-
ate the rating system. The connection between the
AUC and the GC as well as the statistical proper-
ties of the AUC and the GC are dealt with in the
next section. The equivalence of the AUC and the
GC is a key result. It is possible to convert one ratio
into the other through a simple linear transform-
ation.
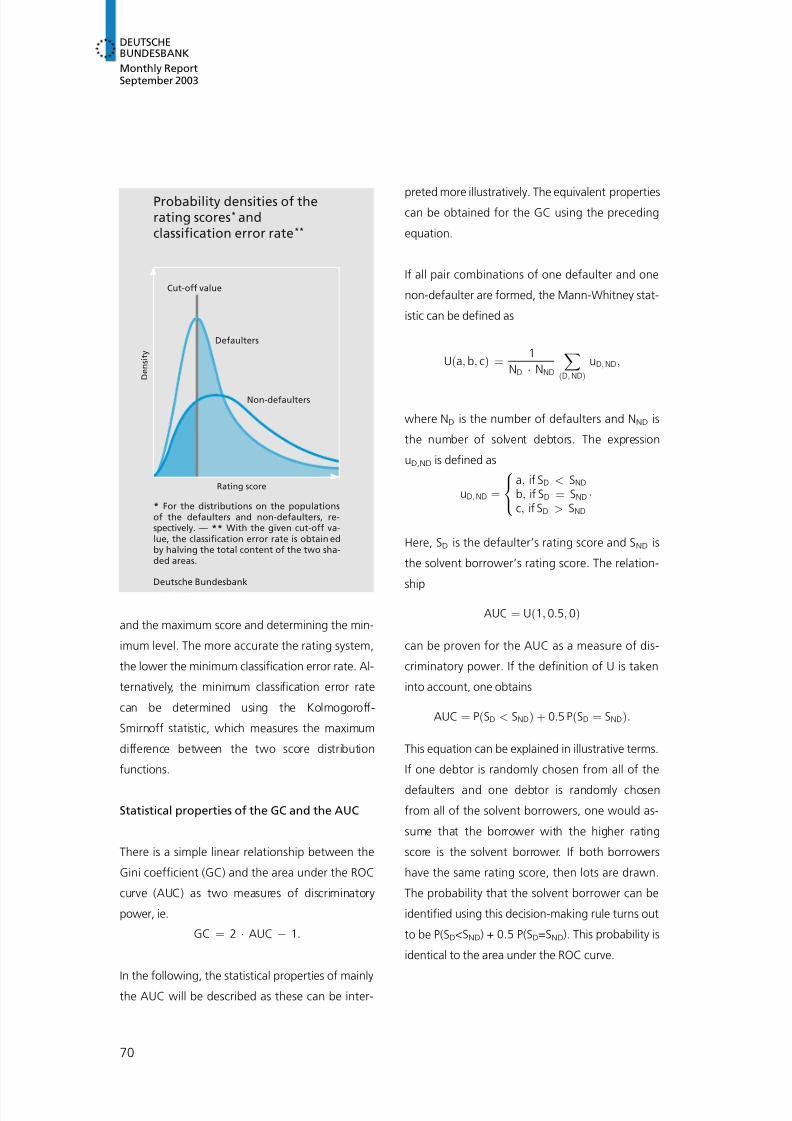
Another measure of discriminatory power widely
applied in practice is the minimum classification
error rate, the calculation of which is illustrated in
the chart on page 70. The classification error rate
is the term used to describe the mean of the rela-
tive frequencies for defaulters and non-defaulters
who were incorrectly classified with a cut-off value
of C. The fraction of defaulters who were deemed
to be creditworthy in view of the cut-off value C
corresponds to the area to the right of C under the
defaulters’ score distribution curve. Similarly, the
fraction of non-defaulters who were incorrectly
classified as not creditworthy corresponds to the
area to the left of C under the non-defaulters’
score distribution curve. The classification error
rate is obtained by halving the total content of
these two areas. The minimum classification error
rate is obtained by calculating the classification
error rate for every C value between the minimum
Deutsche Bundesbank
Receiver OperatingCharacteristic (ROC) * andArea under the Curve (AUC) **
* For each rating score the false alarm ratemeasures the fraction of non-defaulters witha lower-than-specied score within all non-defaulters. The hit rate gives, for each rat-ing score, the fraction of defaulters witha lower-than-specied score within all de-faulters. Processing all possible scores yieldsthe points of the ROC curve. — ** The AUC(shaded area under the ROC curve) is theaverage hit rate formed by computing thearithmetic mean of the hit rates belongingto all pos sible false alarm rates.
False alarm rate
100
%
H i t r a
t e
100 %0
AUC
ROC curve of therating system
perfect model
random model
Area under theCurve (AUC)
Minimumclassificationerror rate
8/7/2019 Approaches to the Validation of Internal Rating Systems 200309_en_rating
http://slidepdf.com/reader/full/approaches-to-the-validation-of-internal-rating-systems-200309enrating 12/13
DEUTSCHEBUNDESBANKMonthly ReportSeptember 2003
70
and the maximum score and determining the min-
imum level. The more accurate the rating system,
the lower the minimum classification error rate. Al-
ternatively, the minimum classification error rate
can be determined using the Kolmogoroff-
Smirnoff statistic, which measures the maximum
difference between the two score distribution
functions.
Statistical properties of the GC and the AUC
There is a simple linear relationship between the
Gini coefficient (GC) and the area under the ROC
curve (AUC) as two measures of discriminatory
power, ie.
GC ¼ 2 ÁAUC À 1:
In the following, the statistical properties of mainly
the AUC will be described as these can be inter-
preted more illustratively. The equivalent propertiescan be obtained for the GC using the preceding
equation.
If all pair combinations of one defaulter and one
non-defaulter are formed, the Mann-Whitney stat-
istic can be defined as
Uða ; b ; cÞ ¼1
ND ÁNND XðD; NDÞ
uD; ND;
where N D is the number of defaulters and N ND is
the number of solvent debtors. The expression
uD,ND is defined as
uD; ND ¼a ; if SD < SNDb ; if SD ¼ SNDÁc; if SD > SND
8<:
Here, SD is the defaulter’s rating score and S ND is
the solvent borrower’s rating score. The relation-
ship
AUC ¼ Uð1; 0:5; 0Þ
can be proven for the AUC as a measure of dis-
criminatory power. If the definition of U is taken
into account, one obtains
AUC ¼ PðSD < SNDÞ þ 0:5 PðSD ¼ SNDÞ:
This equation can be explained in illustrative terms.
If one debtor is randomly chosen from all of the
defaulters and one debtor is randomly chosen
from all of the solvent borrowers, one would as-
sume that the borrower with the higher rating
score is the solvent borrower. If both borrowers
have the same rating score, then lots are drawn.
The probability that the solvent borrower can be
identified using this decision-making rule turns out
to be P(SD<SND ) + 0.5 P(SD=SND). This probability is
identical to the area under the ROC curve.
Deutsche Bundesbank
Probability densities of therating scores * andclassication error rate **
* For the distributions on the populationsof the defaulters and non-defaulters, re-spectively. — ** With the given cut-off va-lue, the classication error rate is obtain edby halving the total content of the two sha-ded areas.
Rating score
D e n s i t y
Cut-off value
Defaulters
Non-defaulters
8/7/2019 Approaches to the Validation of Internal Rating Systems 200309_en_rating
http://slidepdf.com/reader/full/approaches-to-the-validation-of-internal-rating-systems-200309enrating 13/13
DEUTSCHEBUNDESBANKMonthly ReportSeptember 2003
71
The connection between the area under the ROCcurve and the Mann-Whitney statistic can be used
to calculate confidence intervals for the AUC in a
relatively simple manner. Moreover, it also makes it
possible to test for differences between the AUC
values of two rating systems which are validated
on the same dataset. In both cases, advantage is
taken of the fact that the Mann-Whitney statistic
or the normed difference between two Mann-
Whitney statistics is subject to asymptotically nor-
mal distribution. The associated variances can be
easily calculated using the empirical data. 2
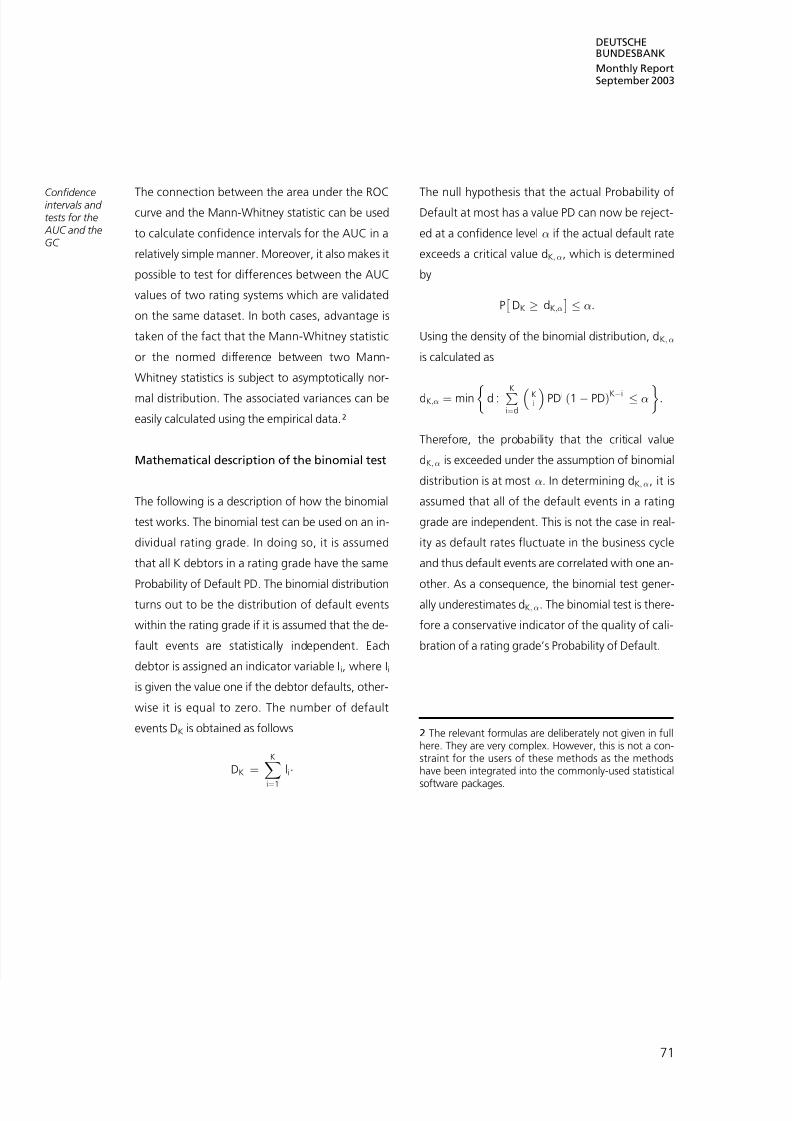
Mathematical description of the binomial test
The following is a description of how the binomial
test works. The binomial test can be used on an in-
dividual rating grade. In doing so, it is assumed
that all K debtors in a rating grade have the same
Probability of Default PD. The binomial distributionturns out to be the distribution of default events
within the rating grade if it is assumed that the de-
fault events are statistically independent. Each
debtor is assigned an indicator variable I i, where I i
is given the value one if the debtor defaults, other-
wise it is equal to zero. The number of default
events D K is obtained as follows
DK ¼
X
K
i¼1
liÁ
The null hypothesis that the actual Probability ofDefault at most has a value PD can now be reject-
ed at a confidence level if the actual default rate
exceeds a critical value d K; , which is determined
by
PÂDK ! dK; Ã :
Using the density of the binomial distribution, d K;
is calculated as
dK; ¼ min d : PK
i¼d
Ki PDi ð1 À PDÞKÀi& ':
Therefore, the probability that the critical value
dK; is exceeded under the assumption of binomial
distribution is at most . In determining d K; , it is
assumed that all of the default events in a rating
grade are independent. This is not the case in real-
ity as default rates fluctuate in the business cycle
and thus default events are correlated with one an-
other. As a consequence, the binomial test gener-ally underestimates d K; . The binomial test is there-
fore a conservative indicator of the quality of cali-
bration of a rating grade’s Probability of Default.
2 The relevant formulas are deliberately not given in fullhere. They are very complex. However, this is not a con-straint for the users of these methods as the methodshave been integrated into the commonly-used statistical
software packages.
Confidenceintervals and tests for the AUC and theGC