approaches to mri gating using multiple sensorsthe navigator mri data. second, the system had to be...
TRANSCRIPT

MRI GATING USING MULTIPLE SENSORS
H
Approaches to MRI Gating Using Multiple Sensors
Russell J. Iannuzzelli, Patrick N. Morgan, Bernard E. Kluga, and Michelle M. Rockwell
igh-resolution images of the heart and coronary arteries produced by magneticresonance imaging (MRI) typically require acquisition over multiple heart cycles. Thegoal of the work reported here was to develop an improved method of imaging coronaryarteries using MRI that would minimize image artifacts caused by motion. We obtainedinformation from a variety of sensors, including some that had never before beenapplied to MRI. This article gives a detailed description of our efforts to meet the statedgoal. (Keywords: Cardiac gating, MRI, MRI gating, Sensors, Telemetry.)
INTRODUCTIONHigh-quality images of the heart and coronary arter-
ies obtained by magnetic resonance imaging (MRI) areadversely affected by motion. In order to minimize theresulting image artifacts, gating to the heart and respi-ratory cycle is required. Typically, the heart cycle ismonitored by an electrocardiograph (EKG), whichmeasures changes in electrical potential occurring dur-ing the heartbeat, and the respiratory cycle is moni-tored using a pressure transducer (“bellows”) affixedaround the abdomen.
In February 1997, APL began a collaborative effortwith EPIX Medical, Inc., and the Laboratory of CardiacEnergetics of the National Heart, Lung, and Blood Insti-tute (NHLBI, NIH) to develop an improved method ofimaging coronary arteries using MRI. Specifically, APLwas tasked to:
• Develop a computer hardware system that wouldcorrelate sensor data with MRI navigator data
JOHNS HOPKINS APL TECHNICAL DIGEST, VOLUME 20, NUMBER 2 (19
• Develop suitable adaptive pattern recognition or cor-relation software algorithms
• Investigate and select a set of sensors that wouldproduce the best correlation results
• Assist in volunteer or patient studies involving the useof the system at the NHLBI Laboratory of CardiacEnergetics
Our approach was to obtain information from avariety of sensors, including some that had never beforebeen applied to MRI, in hopes of improving the cardiacand respiratory gating. Specifically, we used or evaluat-ed 12 different sensors. In this article we present resultsfrom an EKG, a bellows, a single-channel Doppler radar,and an accelerometer. We also initially examined an M-mode ultrasound probe, in-phase (I) and quadrature-phase (Q) Doppler radar, an electric impedance mea-surement sensor, and a video field monitor, all of whichshowed promise but were not completely investigated.
99) 143

R. J. IANNUZZELLI ET AL.
We considered laser vibrometers, acoustophones, andpiezoelectric devices as well, but these were ruled outbecause of high cost or speculated poor performancewithin a harsh acoustic and electromagnetic imagingenvironment.
Of the sensors used, we graded performance based ona correlation of the data with MRI navigator data aimedat the diaphragm. An MRI navigator is a specific typeof scan that is not intended to produce an image.Rather, it is primarily used to identify interface positionwithin a patient. It is a one-dimensional scan that issimilar to an M-mode–type scan in ultrasound. Later inthis article we present several snapshots of the MRInavigator data which clearly show the interface posi-tion moving. Ideally, the navigators would be aimed atthe coronary arteries, but we were unable to obtainreliable results using the three-dimensional navigatorpulse sequence developed by General Electric (GE).This article describes in detail our accomplishment ofthe tasks listed above.
SYSTEM DEVELOPMENTOur Data Acquisition System interfaces with an
MRI scanner to collect navigator data and with thesensors’ electronics to collect sensor data. All of thesoftware and much of the electronics were developedby APL.
144 JOH
We designed the Data Acquisition System with twoprimary functions in mind. First, it had to collect datafrom both the single-channel MRI scanner coil andfrom the various sensors simultaneously. This capabilitywould allow us to analyze the data offline for possiblecorrelations and patterns among the various sensors andthe navigator MRI data. Second, the system had to beable to process the sensors in real time so that a bettergating algorithm, if developed, could be implementedwith the same base system, with a possible extensionin the form of an added processor board. (Althoughsuch a gating algorithm was not used directly in theEPIX project, in a prototype aimed at producing real-time imaging, the identical hardware was successfullyused with the addition of a processor board.)
Figure 1 is a block diagram of the Data AcquisitionSystem used in the EPIX project. The MRI scanner isshown at the bottom; the receiver coil is attached tothe patient. Initially, the system was interfaced to a GESigna series scanner outfitted with four-channel analogfast receivers. About midway through the project, theLaboratory of Cardiac Energetics acquired an upgradeto an LX Model GE scanner. The only significantchange due to the upgrade was to the center frequencyof the demodulated echoes, which increased from 2.5to 2.625 MHz.
The heavy dotted line in Fig. 1 represents a dividerbetween the Magnet Room and the Scanner Electronics
Figure 1. Block diagram of the Data Acquisition System. (S/H = sample and hold, A/D = analog-to-digital converter, DSP = Digital SignalProcessor, FIFO = first-in/first-out, FPDP = front panel data port, LO = local oscillator, LAN = local area network.)
Mix bus
FPDP digitized signal
RadarAccelerometerEKGBellowsReceiver gate
FIFO reset
VME bus
LAN
FIFO enable Signal
Clock
Receiver signalReceiver gateUnblankLO
10-MHzsync
MRI scannerTransmit/control
Receiver coil
Pentek Model 424832-channel
S/H and A/D
Pentek Model 4284TMS320C40
DSP processorVME board
Pentek Model 6441Dual-channel
40 msamples/sA/D
Pentek Model 42723-channel digitalreceiver mix bus
board w/FIFOenable
APL-built RF/IFreceiver w/digital
logic
MotorolaModel MVME 2604
Power PCVME board
Sensor datapreamp
Sun workstationw/separate files for
receiver andsensor data
HP synthesizer+15 dBm40-MHz
sine waveScanner
electronics
Sensor datapreamp
Receiver channel
Mix bus Scanner Electronics Room
Magnet Room
NS HOPKINS APL TECHNICAL DIGEST, VOLUME 20, NUMBER 2 (1999)

MRI GATING USING MULTIPLE SENSORS
Room. All signals passing between these rooms gothrough the patch panel. The five signals from thescanner necessary to collect MRI navigator data are thesurface coil signal, the echo gate signal, the unblanksignal, the local oscillator (LO) signal, and the 10-MHztime-base reference signal. The time base is used toreference the HP synthesizer, which generates the 40-MHz sine wave. This synthesized sine wave signal isused to clock the digital logic in the analog receiver andthe high-speed analog/digital (A/D) converter. Theother four signals from the scanner go to the APL-builtRF/IF analog demodulation box, which is functionallybroken down in Fig. 2. Here, the MRI scanner is shownat the top. The signal off the receiver coil/preamp issent through a bandpass filter to reduce out-of-bandnoise. It is then sent through a switch that passes theecho outside the unblank interval. This switch is nec-essary so that the bleed-through from the MR RF trans-mitter does not saturate or harm any of the componentsto follow. The signal is then amplified and mixed withthe LO from the scanner. By using the LO from thescanner, the signal after mixing will always be posi-tioned at 2.625 MHz, regardless of the actual transmitfrequency. This is because the LO and the transmit aregenerated from the same set of direct digital synthesiz-ers (DDS) within the MRI scanner electronics. Themixing is followed by a variable attenuator, low-passfilter, and amplifier. These components reject out-of-band frequencies and match the gain necessary at theA/D converter. The other elements in the RF/IF analogdemodulation box are a splitter/amplifier path for themaster clock and the digital logic that converts the sinewave clock into a TTL signal and buffers and latchesthe first-in/first-out (FIFO) control signals.
The outputs of the RF/IF analog demodulation boxare the clock signal split, which goes to clock the
Figure 2. Expanded view of the APL-built RF/IF receiver withdigital logic shown in Fig. 1.
HP synthesizer+14 dbm40 MHz
sinewaveHigh speed
A/D
MRI scanner
63.8-MHzbandpass
filter
RFswitch Digital logic
SplitterVariable
attenuatorLow-pass
filter
Signalfrom coil
20 dB
20 dB
Clock to A/Dconverter
20 dB
FIFOenable/reset
MRI data
Signalto A/D
converter HPsynthesizer+15 dBm40-MHz
sine wave
C40 withdigital
receiverHigh-speed
A/D
Unblank Scanner LO
Scanner gate
10-MHz sync
JOHNS HOPKINS APL TECHNICAL DIGEST, VOLUME 20, NUMBER 2 (1
A/D, the demodulated and amplified coil signal, whichis input into the A/D, and the FIFO enable controllogic. The A/D output is used as the input to a digitalreceiver. Functionally, the digital receiver comprises aset of DDS used to generate a sine/cosine pair for I/Qmixing. After the mixing, which is a true multiply, I andQ are filtered with a combination of linear-phase filters.The output is then a complex echo, centered at DC,with an appropriate bandwidth selected by a filter/decimate parameter. The FIFO enable and reset logicwere added to support a means of collecting data on thedigital receiver board only when an echo gate wasreceived. Engineers at Pentek modified the Model 4272digital receiver mix board to include a FIFO enable/resetBNC connector on the front panel. Thus, the echo gatefrom the scanner turns on the FIFO, enabling it tocollect output data. After these output data are trans-ferred to the C40 processor board, the C40 processorputs out a pulse on the front panel to reset the digitalreceiver FIFO. In addition to controlling the data ac-quisition interval, the C40 routes data from the digitalreceiver to a file on a workstation. It also routes datafrom the A/D converter that are used to digitize theslow data sensor signals to a separate file on the work-station. In Fig. 1, this is shown as the Pentek Model4248 32-channel simultaneously sampling A/D mixboard. The mix bus is the local bus used for data input/output on the Pentek Model 4284 C40 processor board.
PREAMPLIFICATIONThe sensor data are sent through two different
preamp boxes, one in the Magnet Room and one in theScanner Electronics Room. Separate preamp boxeswere required to amplify the signals and filter 60 Hz andgradient noise on the signals. To obtain precise timestamping between the scanner data file and the sensordata file, the echo window gate was sampled with thesensor data set. This also allowed sensor data to becollected when the scanner was on and off. We willexpand upon this feature in a later section.
The dual-preamp configuration shown in Fig. 1 wasnecessary to stabilize the signals in the Magnet Room,and then to perform notch filtering and general low-passfiltering in the Scanner Electronics Room. Figure 3 is ablock diagram of the processing used in the preampboxes. The radar had a voltage regulator and preampcircuit built into the cylindrical container. The preampcircuits only applied to the single-channel radar and theaccelerometer. The EKG and the bellows used preexist-ing preamps built into the GE scanner. Some of the plotsof data, shown later in the article, still exhibited gradientnoise bleeding on the sensor signals. We determined thatthe cabling in the Magnet Room would need to bemodified and possibly replaced with a fiber-optic set ofcommunications channels.
999) 145

R. J. IANNUZZELLI ET AL.
SENSORSWe developed two new sensors to measure physio-
logical data for the purpose of MRI gating. We alsoacquired data from existing MRI sensors (e.g., thebellows and EKG).
RadarThe first APL-developed sensor was a compact, low-
cost K-band radar (Kustom Signals, Inc., Lenexa, KS),similar to those used in police speed monitors. To min-imize RF interference to and from the MRI scanner, theradar was mounted in an aluminum enclosure along withAPL-built circuitry for power regulation, preamplifica-tion, and offset trimming. This sensor has two majoradvantages: it can be used remotely from the patient andhas high sensitivity to motion. Its principal disadvantageis poor specificity, which may be overcome with the useof MRI-compatible copper waveguide.
The radar signal contains information from objectsmoving along the direction of the radar beam. Theseobjects produce an offset in the frequency f of the signalknown as a Doppler shift. For example, an object movingat a velocity v produces a Doppler shift given by1
Df = 2v/ l , (1)
where l is the radar wavelength. For the K-band radar,f = 35.5 GHz, so l = c/f = 0.85 cm. Hence, a slow-
caused by heart mFigure 4 is a ph
is attached to the ing the device. A pangle is shown in 8°. When mountwould illuminate70 cm in diameterradar is obliquelyinside the magnetlarger.
Figure 3. Block diagram of preamps used for radar and accelerometer.
Fig
TTrransmeteransmeterAnalogDevices
Accelerometer
Frequencyto
voltage
Low-passfilter
Receiver
Magnet Room preamp
Topatchpanel
Radar Low-passfilter
Radar enclosure
Low-passfilter
Transmitter
Accelerometer EMIfilter
60-Hznotch
Low-passfilter
To A/Dconverter
EMIfilter
60-Hznotch
Low-passfilter
Radar
From patchpanel
Scanner Electronics Room preamp
146 JO
moving object such as the chestwall, with a velocity of 5 cm/s,produces a Doppler shift Df = 12Hz. This Doppler shift is detectableusing standard Fourier analysiswith at least 83 ms of data.
The depth of penetration of theradar into human tissue can beapproximated with the formula2
d p s= 1/ ,fm (2)
where m = 4p 3 10–7 H/m is thepermeability of tissue, and s is theelectrical conductivity. At f = 35.5GHz, s ≈ 0.9 S/m (Ref. 3), so s ≈3 mm. Hence, the radar signal willnot penetrate much farther thanthe surface of the skin, whichshould be sufficient to detect respi-ratory motion. Although minimalinformation from the heart wouldbe obtained directly, some informa-tion may be contained in the signalthrough compression of tissue
otion or blood flow.otograph of the radar. A laser level
aluminum enclosure to assist in aim-lot of the sensitivity of the radar withFig. 5. The 3-dB beamwidth is abouted 5 m from the patient, the radar a circular region of 10 tan(4°) = perpendicular to the beam. Since the positioned relative to the patient bore, the actual region is somewhat
ure 4. The radar sensor.
HNS HOPKINS APL TECHNICAL DIGEST, VOLUME 20, NUMBER 2 (1999)

Accelerometer with IR Wireless TelemetryWe also developed a sensor using a micromachined
accelerometer (Analog Devices, Norwood, MA,ADXL05) mounted on a single monolithic integratedcircuit. Rather than directly measuring chest wall ac-celeration, the device acts as a tilt sensor by measuringinclination of the chest or stomach relative to theEarth’s gravitational field. To make the device wireless,we added an IR transmitter. Both devices, along withAPL-built circuitry and MRI-compatible batteries,were mounted in an RF-shielded enclosure to preventinterference from the RF coils on the MRI scanner.One advantage of using this sensor is its high specificity,since the small size enables it to be placed anywhereon the patient to obtain localized measurements of tiltwith high sensitivity. The principal disadvantage is cor-ruption of the signal by the MRI gradient coils, whichcan be minimized by careful circuit design. A photo-graph of the accelerometer and IR transmitter is shownin Fig. 6.
Since the device was packaged in a metal can thatwas extremely magnetic, we asked the Electronic Ser-vices Group of APL’s Technical Services Department toremove the cans from 10 devices and repackage themusing nonmagnetic ceramics. The device and ceramicpackage were mounted on a small multilayer printedcircuit board containing surface-mount components.
A circuit schematic is shown in Fig. 7. The deviceis powered by MRI-compatible lithium (Li) batteries(Ultralife Batteries, Inc., Newark, NJ) regulated to 5 V.The standard IR link used in television remote controlsand other devices relies on a digital stream of IR pulsessynchronized to a 38-kHz repetition rate. To improvethe signal-to-noise ratio, most standard IR receivershave a built-in bandpass filter at 38 kHz. Since the
Figure 5. Radar azimuth data (operating frequency = 35.4848 GHzwith 0° cutting angle).
–15 –10 –5 0 5 10 15
–30 –20 –10 0 10 4020 30
Azimuth (deg)
Azimuth (deg)
0
–5
–10
–15
–20
–25
Rel
ativ
e ga
in (
dB)
0
–5
–10
–15
–20
–25
Rel
ativ
e ga
in (
dB)
JOHNS HOPKINS APL TECHNICAL DIGEST, VOLUME 20, NUMBER 2 (1
MRI GATING USING MULTIPLE SENSORS
Figure 6. Accelerometer sensor and IR transmitter. The enclosureis about 5 cm wide × 3.8 cm tall × 3.8 cm deep. A plastic on/off switchis mounted on the back of the enclosure.
signal from the accelerometer is an analog voltage, wedeveloped a frequency modulation technique involvingtwo voltage-controlled oscillators (VCOs). The firstVCO outputs a TTL signal from 0.7 to 1.7 kHz that islinearly proportional to the accelerometer voltage.That output drives a second VCO, which pulses the IRlight-emitting diodes at a repetition rate of 36 to 41kHz. Hence, at the receiver, a square wave is generatedwhose frequency varies from 0.7 to 1.7 kHz linearly withthe accelerometer voltage. At the receiver, the FMsquare wave is carried by a nonmagnetic triaxial cableout of the Scanner Electronics Room into the APL-built circuit that converts frequency to voltage, theoutput of which is fed into the sensor A/D board. Figure8 is a block diagram of the modulation techniques usedin the IR and RF wireless approaches.
VideoWe also considered directly digitizing a video signal
of the patient’s thorax. The patient would wear a tight-fitting black shirt with white stripes that would trackrespiratory or gross patient motion. One advantage ofusing this sensor is the ability to track motion nonin-vasively with good resolution in two spatial dimensions.The third spatial dimension along the camera axis couldbe inferred from magnification or distortion of thepatterns. The sensor’s principal disadvantage is its inabil-ity to track motion on patients who require a blanket.
Data obtained from a volunteer dressed as specifiedoutside the magnet are shown in Fig. 9. The datasampling rate was 2.5 MHz, corresponding to 159 pointsper line of video data. The standard video format is 525lines per interlaced image at 30 Hz. The stripes ap-peared as spikes in the video field (Fig. 9, left) and aswhite lines in the image (Fig. 9 right). The square dips
IRlight-emitting diode
Anglecalibration knob
999) 147

R. J. IANNUZZELLI ET AL.
Figure 7. Circuit schematic of the accelerometer and IR transmitter. The ADXL05 was repackaged by APL into a nonmagnetic die.
Figure 8. Wireless modulation techniques.
Figure 9. Video signal and corresponding image.
VIN GND
VDUT
1
2
13
6
1615
3
4
145
7
1211
10PP
P1
P2
VCOIN
DEMDZEN
CIN
VGOUT
SINCX
CXINNR1R2
74MC4848
94Guf
1
2
13
6
1615
3
4
145
7
1211
10PP
P1
P2
VCOIN
DEMDZEN
CIN
VGOUT
SINCX
CXINNR1R2
74MC4848
56Luf+
–
1 2
1
4
2
3
56
3
ADXL05
IRemitter
7805
Ultralife Thin Cell TM
Li 33+
Nor
mal
ized
vol
tage
A/D sample position
1.0
0.5
–0.5
–1.00 100 200 300
0RF module
Basebandsignal
(<100 Hz)
Square wave between 800 Hzand 1.7 kHz
Voltage-to-
frequencyconverter
VCO IR module
Square wave between 43and 48 kHz
in the signal are the horizontal sync pulses. The carrierburst that follows the sync pulses is undersampled, butthe video data are adequately sampled. The contrast-to-noise ratio of the stripes is about 12, and the spatialresolution is about 2 × 2 mm.
RF Telemetry
APL also developed an RF wireless system for theaccelerometer. Two different transmit/receive moduleswere tried, the Linx Technologies HP series (900 MHz)and the LC series (434 MHz). The basic accelerometerwith IR wireless telemetry device was duplicated and
148 JOH
modified to use either the HP or LC transmit module,which offered 50 kbps and 5 kbps modulation rates,respectively. The HP uses a frequency shift keying–typecommunications scheme and should typically yield amore robust communications approach than the LC on/off keying communications scheme. However, whenplaced near or in the main magnet, the HP series didnot operate properly, perhaps owing to corruption ofthe oscillator. The LC series did continue to operateeven in the magnet, but reception was so degraded thatthe receiver box had to be placed at the edge of themagnet bore. In both cases, accelerometer operationand modulation were identical to the wireless IR
NS HOPKINS APL TECHNICAL DIGEST, VOLUME 20, NUMBER 2 (1999)
MRI GATING USING MULTIPLE SENSORS
approach, with the exception of bypassing the last mod-ulation stage and feeding a sampled signal square wavefrom 0.7 to 1.7 kHz into the data pin on the twodifferent transmitter modules. We investigated bothspiral antennas and loop antennas on the transmitter.The results of these investigations are very promisingand indicate that a robust RF wireless system for bothEKG and inclination could be developed and usedwithin the main magnet.
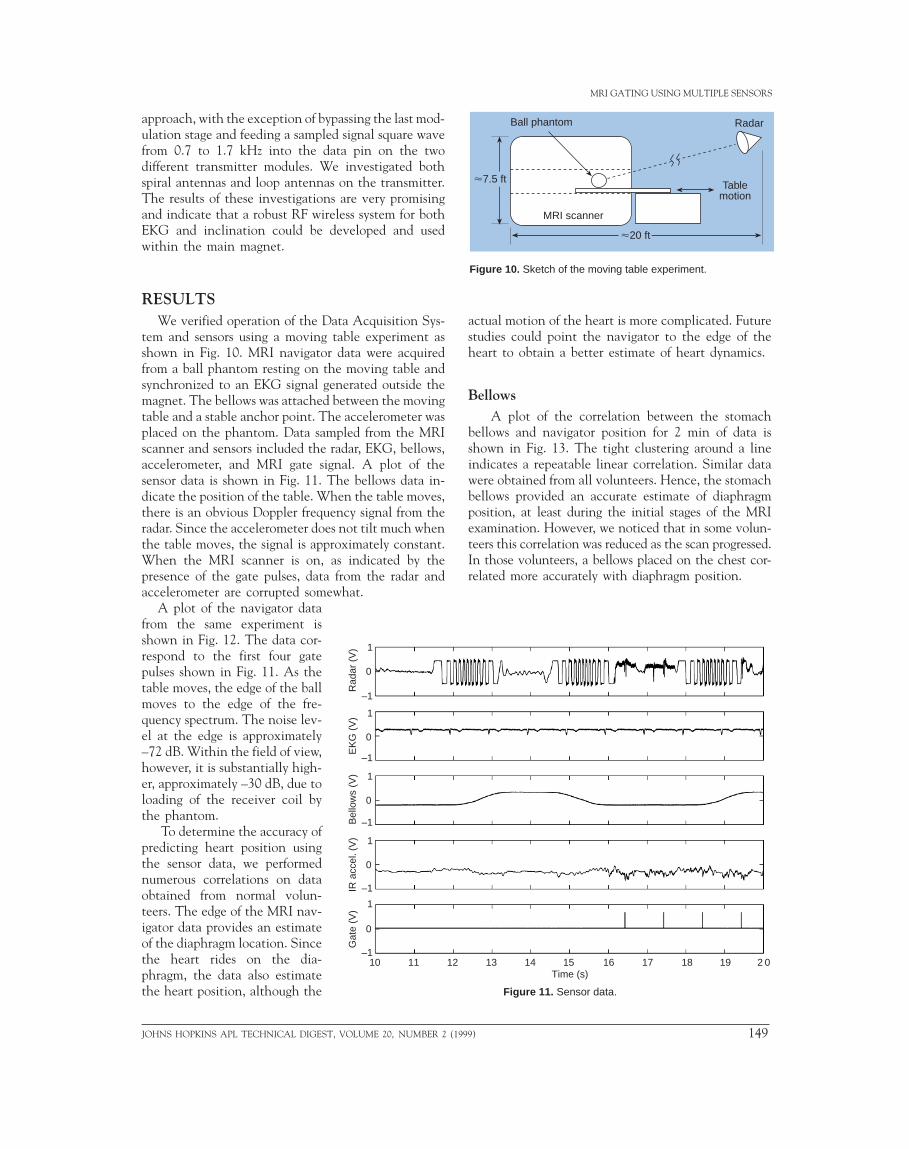
RESULTSWe verified operation of the Data Acquisition Sys-
tem and sensors using a moving table experiment asshown in Fig. 10. MRI navigator data were acquiredfrom a ball phantom resting on the moving table andsynchronized to an EKG signal generated outside themagnet. The bellows was attached between the movingtable and a stable anchor point. The accelerometer wasplaced on the phantom. Data sampled from the MRIscanner and sensors included the radar, EKG, bellows,accelerometer, and MRI gate signal. A plot of thesensor data is shown in Fig. 11. The bellows data in-dicate the position of the table. When the table moves,there is an obvious Doppler frequency signal from theradar. Since the accelerometer does not tilt much whenthe table moves, the signal is approximately constant.When the MRI scanner is on, as indicated by thepresence of the gate pulses, data from the radar andaccelerometer are corrupted somewhat.
A plot of the navigator datafrom the same experiment isshown in Fig. 12. The data cor-respond to the first four gatepulses shown in Fig. 11. As thetable moves, the edge of the ballmoves to the edge of the fre-quency spectrum. The noise lev-el at the edge is approximately–72 dB. Within the field of view,however, it is substantially high-er, approximately –30 dB, due toloading of the receiver coil bythe phantom.
To determine the accuracy ofpredicting heart position usingthe sensor data, we performednumerous correlations on dataobtained from normal volun-teers. The edge of the MRI nav-igator data provides an estimateof the diaphragm location. Sincethe heart rides on the dia-phragm, the data also estimatethe heart position, although the
1
0
–1
Rad
ar (
V)
1
0
–1
1
0
–1
1
0
–1
1
0
–1
EK
G (
V)
Bel
low
s (V
)IR
acc
el. (
V)
Gat
e (V
)
10 11 12
JOHNS HOPKINS APL TECHNICAL DIGEST
Figure 10. Sketch of the moving table experiment.
Figure 11. Sensor data.
actual motion of the heart is more complicated. Futurestudies could point the navigator to the edge of theheart to obtain a better estimate of heart dynamics.
Bellows A plot of the correlation between the stomach
bellows and navigator position for 2 min of data isshown in Fig. 13. The tight clustering around a lineindicates a repeatable linear correlation. Similar datawere obtained from all volunteers. Hence, the stomachbellows provided an accurate estimate of diaphragmposition, at least during the initial stages of the MRIexamination. However, we noticed that in some volun-teers this correlation was reduced as the scan progressed.In those volunteers, a bellows placed on the chest cor-related more accurately with diaphragm position.
13 14 15 16 17 18 19 2 0Time (s)
Radar
Tablemotion
Ball phantom
MRI scanner
<7.5 ft
<20 ft
, VOLUME 20, NUMBER 2 (1999) 149

R. J. IANNUZZELLI ET AL.
Figure 12. MRI navigator data.
–100
–50
0
–100
–50
0
–100
–50
0
–100
–50
0
Mag
nitu
de (
dB)
Gate 1
Gate 2
Gate 3
Gate 4
–50 –40 –30 –20 –10 0 10 20 30 40 50Frequency (kHz)
EKGPrevious studies (e.g., Ref. 4) have suggested a cor-
relation between the peak of the QRS complex of theEKG and respiration. Results of correlating the peak ofthe QRS complex and the R-R interval with the nav-igator data for 6 min are shown in Fig. 14, respectively.For the QRS peak, the data are nearly correlated, withsome outlying data points corresponding to low EKGvoltage. The discrepancy could be caused by inducedvoltages from the RF or gradients, either of which couldbe compensated for, or from the flow of blood ions in thestrong static magnetic field of the scanner, i.e., the “mag-netodynamic” effect. The artifact could be minimizedusing more EKG channels, as suggested by Fischer.5 TheR-R interval measurements are poorly correlated.
Figure 13. Correlation of stomach bellows and position of naviga-tors (1 through 128).
150
140
130
120
Edg
e po
sitio
n
–0.2 –0.1 0 0.1 0.2 0.3Bellows mean value
150 JOH
AccelerometerA plot of the data from the accelerometer on a
normal volunteer outside the magnet is shown in Fig.15. The low-frequency data are well correlated with thestomach bellows trace, and the high-frequency dataappear a short time after the QRS peak. When thevolunteer was placed inside the magnet, the high-frequency data obtained by simply filtering the signalwere contaminated by the gradients. These data mightbe obtained more reliably by actively canceling thegradients. The low-frequency data are readily obtained,both inside and outside the magnet, using a low-passfilter.
RadarThe radar data are shown with respect to the other
sensor data in Fig. 16a. This data set was derived beforethe MRI scanner was turned on. The radar signal showsan appropriate response when the bellows is in a tran-sition period, i.e., changing at its highest rate. Theheart motion can be seen on the radar signal as well.This could contain valuable information about thecardiac phase and position. Such information can alsobe seen on the accelerometer.
Figure 16b shows a similar plot after the MRI scan-ner was turned on, acquiring navigators on the abdo-men. The spikes on the MRI gate data-trace show theprecise timing as to when the gates were turned on. Asignificant amount of corruption due to the gradientsis present on the accelerometer and radar signals. This
NS HOPKINS APL TECHNICAL DIGEST, VOLUME 20, NUMBER 2 (1999)

JOHNS HOPKIN
MRI GATING USING MULTIPLE SENSORS
Figure 14 . Correlation of stomach bellows with (a) peak of QRS complex and (b) EKGR-R interval for the first 319 EKGs.
–0.3
–0.2
–0.1
0
0.1
0.2
0.3
–0.18 –0.16 –0.14 –0.12 –0.10 –0.08 –0.06
EKG peak value
Bel
low
s va
lue
–0.3
–0.2
–0.1
0
0.1
0.2
0.3
Bel
low
s va
lue
0.85 0.90 0.95 1.00 1.05EKG R-R (s)
(a)
(b)
corruption could be reduced using improved preampand filtering circuitry.
CONCLUSIONOur results indicate that the stomach bellows data
correlate well with diaphragm position in most volun-teers. However, some volunteers required a bellows
S APL TECHNICAL DIGEST, VOLUME 20, NUMBER 2 (19
placed on the chest to obtain a more accurate estimate.The peak of the QRS complex also appears to be cor-related with the diaphragm location, but may be cor-rupted by the magnetodynamic effect. Sampling mul-tiple EKG channels may remove the effect and lendinsight into cardiac dynamics through the rotation ofthe cardiac vector. Accelerometer data may also yieldinformation about the respiratory cycle and cardiac
99) 151

R. J. IANNUZZELLI ET AL.
dynamics, but thbecause of inadeqradar data are incinduced by the gradar signals wougradient noise couther in the form leads or with an for an accurate a
FUTURE WOSeveral potent
investigations thaless telemetry couan accelerometerwould greatly redu
Figure 15. Plot of data from stomach bellows (top), EKG (center),and IR accelerometer (bottom).
0.4
–0.4
1.5
–1.5
1.5
–1.5
1.5
–1.5
1.5
–1.50 2 4 6 8 10
Time (s)
Rad
ar (
V)
EK
G (
V)
Bel
low
s (V
)IR
acc
el. (
V)
Gat
e (V
)
0.4
–0.4
0 2 4 6 8 10Time (s)
1.5
–1.5
1.5
–1.5
1.5
–1.5
1.5
–1.5
Rad
ar (
V)
EK
G (
V)
Bel
low
s (V
)IR
acc
el. (
V)
Gat
e (V
)
(a)
(b)
0 2 4 6 8 10Time (s)
Rel
ativ
e am
plitu
de
152 JO
ese data were sometimes unreliableuate shielding. Correlations with theonclusive because of excessive noiseradients. There is evidence that theld be useful in a gating system if theld be controlled. More channels, ei-
of a chest bellows and multiple EKGaccelerometer, appear to be requirednd reliable cardiac gating system.
RKial directions have come out of thet APL has performed. First, the wire-ld be expanded to include not only
, but also several EKG leads. Thisce the wiring attached to the patient
and could enable more accuratecardiac gating. If wireless telemetrywere successful, the technologycould possibly be licensed to asmall equipment manufacturer forproduction. Both the IR and RFwireless approaches have merit andshould be pursued in parallel. Issuesneeding to be resolved on the RFwireless concern the poor signalcoherence within the magnet. TheIR wireless would require bettershielding, and a new modulationtechnique would be needed tomultiplex more information on thecarrier. Because there is a gradientnoise on the sensor signals, bothapproaches would benefit from anoptical lead system from the wire-less receiver to the patch panel.Figure 17 is a block diagram of aproposed multiple EKG and accel-erometer transmit system. Such asystem would have clear market-ability.
The radar is another example ofusing RF within the Magnet Room,this time as an ancillary sensor.Two potential avenues exist forfurther development with respectto the radar. First, as an ancillarymotion sensor, the current radarmay not be able to distinguish
Figure 16. Plot of sensor data on a normalvolunteer (a) before and (b) after the MRIscanner was turned on.
HNS HOPKINS APL TECHNICAL DIGEST, VOLUME 20, NUMBER 2 (1999)

MRI GATING USING MULTIPLE SENSORS
direction of motion, necessitatingthe use of an I/Q demodulator.Thus, it may be appropriate to addan I/Q demodulator or anotherradar that is direction sensitive.We have experimented with justsuch a radar, one that is relativelyinexpensive and operates at 24GHz, typical of automatic dooropening systems. Logistics wouldstill need to be worked out, sinceit is unknown whether this radarwould have enough return powerwhen being used from the samelocation as the police radar. Oneapproach with this radar would beto use a nonferrous waveguidefrom outside the bore of the mainmagnet to within the magnet. Certainly there would beenough return power if it were pointing straight downon the patient, and it might become a more specificsensor than the other radar <4.6 m away from the mainmagnet. The waveguide and small door-opening radarexist at APL, where several experiments were conduct-ed. Results showed that this radar could sense bothrespiratory and heart beat surface deflections on a per-son from a short distance. No attempt has been made,however, to incorporate this sensor with the others inclose proximity to the MRI scanner.
The second avenue using the radar would be toexamine longer wavelength systems, which would havemore penetration than the radar systems we have beenexamining. The potential exists to combine both anMRI scanner with a crude radar imaging system. Fromprevious work, a short pulse centered at about 1 GHzwould have both bandwidth and penetration potential.We found that Lawrence Livermore National
Figure 17. Block
Analogdevices o
VTIaccleromet
AnalogDevices or
VTIAcceleromet
Diff. ampEKGleads
Diff. ampEKGleads
JOHNS HOPKINS APL TECHNICAL DIGEST, V
diagram of a modular, wireless accelerometer/multiple EKG.
Laboratories had developed a system called the Micro-powered Impulse Radar (MIR), a small, inexpensive,but still quite immature system. However, such a short-pulse or impulse radar system does have the potentialto do ranging, and this could be important in determin-ing interface positions within a person being scanned.
REFERENCES1Levanon, N., Radar Principles, John Wiley & Sons, New York (1988).2Ramo, S., Whinnery, J., and vanDuzer, T., Fields and Waves in Communication
Electronics, John Wiley & Sons, New York (1984).3Stoy, R., Foster, K., and Schwan, H., “Dielectric Properties of Mammalian
Tissues from 0.1 to 100 MHz: A Summary of Recent Data,” Phys. Med. Biol.37, 501–513 (1982).
4Felbinger, J., and Boesch, C., “Amplitude Demodulation of the Electrocardio-gram Signal (ECG) for Respiration Monitoring and Compensation DuringMR Examinations,” MRM 38, 129–136 (1997).
5Fischer, S., Wickline, S., and Lorentz, C., “Robust Real-Time R-WaveDetection Based on the Vector Cardiogram,” Proc. ISMRM 6, 742 (Apr 1998).
ACKNOWLEDGMENTS: We would like to thank Frank Marcote, Jim Hanson,and Allen Bric for their engineering support, Henry Kues and Lex Hughes for theirradar help, and Robert Balaban for time on the scanner in the Laboratory of CardiacEnergetics.
Transmitter unit
r
er
Low passfilter
Low passfilter
Low passfilter
er
Low-passfilter S/H
MultiplexerS/H
S/H
Sync word
Low-passfilter
Low-passfilter
RF orIR
transmitter
A/D
THE AUTHORS
RUSSELL J. IANNUZZELLI received a B.S. in electrical engineering fromDrexel University in 1982 and an M.A. in applied mathematics from theUniversity of Maryland in 1987. He joined APL in 1982 and is a member of theSenior Professional Staff in the Air Defense Systems Department’s CombatSystems Development Group. Mr. Iannuzzelli has been involved in signalprocessing analysis and real-time software implementations for over 15 years. Hehas worked on the Terrier Fire Control System, the Standard Missile Program,Noncooperative Target Recognition, the Norway Ocean Radar, and the BistaticVortex Detection Radar. Most recently, he has worked on several real-timeimplementations related to cardiac MRI. His e-mail address [email protected].
OLUME 20, NUMBER 2 (1999) 153

R. J. IANNUZZELLI ET AL.
PATRICK N. MORGAN received a B.S. degree from Duke University in1989, an M.S. degree from UCLA in 1991, and a Ph.D. from StanfordUniversity in 1996, all in electrical engineering. At Stanford, he developedinstrumentation for a low-cost MRI scanner while supported by a NationalScience Foundation Graduate Research Fellowship. During 1996–1998, asa member of the APL Senior Staff, Dr. Morgan worked to develop a real-time MRI system and an improved gating system for cardiac MRI. In 1998,he joined the Electrical Engineering Department at Texas A&M Universityas an Assistant Professor. His research interests include real-time MRI,prepolarized MRI, and optimal magnet design. His e-mail address [email protected].
MICHELLE M. ROCKWELL received her B.S.E.E. degree from the Universityof Maryland in 1994. She joined APL’s Fleet Systems Department in 1996 andis currently a member of the Associate Professional Staff in the Air DefenseSystems Department. In addition to the MRI gating project, Ms. Rockwellworked extensively on radar systems analyses for the Trilateral Frigate Coopera-tive (TFC) project. She is currently continuing her work in the TFC project andhas recently joined in the DEXA project, which involves the design andconstruction of an X-ray densitometer to measure bone strength and density.Her e-mail address is [email protected].
BERNARD E. KLUGA is an Engineering Assistant with the Air DefenseSystems Department’s Combat Systems Development Group and hasworked at APL since 1985. He has been involved with the development ofthe Terrier/Tartar “land-based test site” at APL, and has also worked onprojects such as Captive Seeker, The Wake Vortex Experiment, FlareGenesis, CEC, and The Amature Sky Survey (Sky & Telescope, Feb 98).Currently the president of the APL Astronomy Club, Mr. Kluga partici-pates in the club’s outreach learning program for the local school systems.He is a member of the American Astronomical Society and S.P.I.E. Hise-mail address is [email protected].
154 JOHNS HOPKINS APL TECHNICAL DIGEST, VOLUME 20, NUMBER 2 (1999)