appraisalofthree-dimensionalnumericalsimulationforsub...
TRANSCRIPT

Chemical Engineering Science 60 (2005) 6551–6563
www.elsevier.com/locate/ces
Appraisal of three-dimensional numerical simulation for sub-micronparticle deposition in a micro-porous ceramic filter
Fabio Sbrizzaia, Paolo Faraldib, Alfredo Soldatia,∗aCentro Interdipartimentale di Fluidodinamica e Idraulica and Dipartimento di Energetica e Mecchine, Università degli Studi di Udine, Udine 33100,Italy
bAdvanced Process Technologies - Centro Ricerche FIAT (CRF), Strada Torino 50, 10043 Orbassano (TO), Italy
Received 27 October 2004; received in revised form 21 March 2005; accepted 13 May 2005Available online 14 July 2005
Abstract
A computational, three-dimensional approach to investigate the behavior of diesel soot particles in the micro-channels of a wall-flow,porous-ceramic particulate filter is presented. Particle size examined is in the PM2.5 range. The flow field is simulated with a finite-volume Navier–Stokes solver and the Ergun equation is used to model the porous material. The permeability coefficients were obtainedby fitting experimental data. Particle flow, dispersion, deposition and wall–particle interactions are investigated tracking large swarms of2 and 0.2�m diameter particles in a Lagrangian frame of reference. Particle dynamics included rarefied gas hypotheses (the Knudsennumber being larger than unity) and bounce/capture models based on impact kinetic energy loss. The influence of gas molecules–particleinteraction on overall particle behavior is also examined by including Brownian motion and partial slip in particle equation of motion.Simulations help to highlight three-dimensional non-uniform particle deposition, mainly due to flow distribution in the micro-channel.All particles deposit onto the porous filter wall following the distribution of the through-wall velocity. The larger, 2�m, particles show alarger tendency to deposit at the end of the filter. Due to the flow contraction at the inlet, virtually no particle deposit in the inlet sectionof the filter. Reasons for the scarce influence on particle deposition due to particle-flow slip and Brownian motion are given.� 2005 Elsevier Ltd. All rights reserved.
Keywords:Nanoparticles; Micro-porous filter; Deposition; Numerical simulation
1. Introduction
The presence in the environment of particles with sizeranging from 10 nm to 10�m (known in technical literatureas PM10) has a profound impact on human health due to theirtendency to remain trapped in the inner respiratory wayscausing a variety of lung-disease typologies. It is known thatin urban environment a significant amount of these micro-particles is produced by diesel engines which are specificallyresponsible for the emission of soot with size ranging inthe sub-micron scale, with an average diameter of about150–200 nm (part of the so-called PM2.5, i.e., particles withdiameter smaller than 2.5�m). The intrinsic lung-damaging
∗ Corresponding author. Tel.: +39 0432 558020; fax: +39 0432 558027.E-mail address:[email protected](A. Soldati).
0009-2509/$ - see front matter� 2005 Elsevier Ltd. All rights reserved.doi:10.1016/j.ces.2005.05.038
effect of the diesel soot particles is further increased bythe presence of policyclic aromatic hydrocarbons and nitrocompounds adsorbed on their surface (Saracco et al., 1999),which form a soluble organic fraction (SOF) responsiblefor mutagens and carcinogenic effects (Kagawa, 2002; Finoet al., 2003).
Diesel soot production can be reduced, for instance,by optimizing fuel combustion or by filtering the post-combustions gases. Among other filtering techniques, asuitable, low-cost way to reduce diesel particulate emis-sions down to acceptable concentrations (e.g., less than0.025 g/km, as per the 2005 EU regulations—Euro 4) is theuse of particulate traps placed in the exhaust line of vehi-cles, as shown inFig. 1(a). We will examine in particularthe broadly used wall-flow ceramic filters. The workingprinciple is sketched inFig. 1(b) and it is based on thepermeability properties of porous ceramics, such assilicon

6552 F. Sbrizzai et al. / Chemical Engineering Science 60 (2005) 6551–6563
Fig. 1. Schematic of the experimental apparatus used to measure thegas parameters in the exhaust line of a diesel engine equipped with awall-flow filter (a). Working principle of the wall-flow filter (b).
carbide(SiC) andcordierite (2MgO· 2Al2O3 · 5SiO2). Thestructure of these materials is characterized by a high surfaceconcentration ofO(10�m) pores through which the particle-laden flow is driven thus ensuring particle adsorption at theceramic walls. Additives are usually added to fuel and tofilter walls to reduce soot combustion temperature avoidingexcessive pressure drop across the filter caused by particulateaccumulation and thermal stresses due to particulate burn-off (Ambrogio et al., 2001).
A continuing effort of the research community aims at pro-ducing optimized diesel traps with the highest filtering effi-ciency and the lowest pressure drop. Specifically, attention ispaid to the filter regeneration cycle which is a strong functionof particle deposition mechanisms. Briefly, the filter must bere-generated (the deposited soot is burnt) to avoid large pres-sure drop (detrimental for engine performance) and loss offiltering efficiency. However, since re-generation is a highlypolluting phase, the environmentally optimal cycle lengthmust be identified. During the filter cycle, particles driventhrough the filter deposit, foul and eventually plug specificfilter areas, giving rise to a spatially non-uniform deposition.Optimal filtering efficiency leading to longer regenerationcycles would be ensured (i) by a uniform particle distributionin the filter cross-section, so that filtering load is distributeduniformly among the micro-channels (Sbrizzai et al.,2004) and (ii) by uniform particle deposition inside eachsingle micro-channel. To understand and possibly optimizeparticle deposition inside micro-channels we have to rely onaccurate local measurements and on accurate and reliablethree-dimensional simulations. Measurements are hard andcostly (Saracco et al., 1999) and literature shows a surprisinglack of sophisticated simulations of three-dimensional par-ticle behavior inside the flow field developing in the porouswalls micro-channels characterizing the ceramic filter. Pre-cisely, this lack of literature is the motivation for our study.
Particle deposition is dominated by the flow field, thecharacteristics of which have been addressed by the scientificliterature only in a macroscopic way in a large number of
experimental works characterizing the macro-scale featuresof particulate filtration (see, e.g.,Saracco et al., 1999;Ambrogio et al., 2001, 2002; Fino et al., 2003). Specificmodels using balance equations to predict filter efficiencyhave been developed, for instance, byAmbrogio et al.(2001), who use balance equations to predict filter efficiencyas a function of the different terms corresponding to particleimpaction, interception, Brownian diffusion, soot accumu-lation and other second-order terms. We notice however,that currently proposed models do not allow insight of thethree-dimensional features of the flow field leading to non-uniform deposition, and may not be used for optimizingfiltering esteem parameters.
In this work we exploit numerical models to investigatethe behavior of sub-micron particles dispersed in the three-dimensional flow field which develops in the smallest micro-channel working unit of a particulate trap. In particular, wewant to identify a suitable way to predict accurately particledeposition in the trap by using a numerical solution of theNavier–Stokes equations for the fluid and the Lagrangiantracking method. Navier–Stokes equations are solved by afinite-volume commercial code, and Ergun equation is usedto reproduce the characteristics of the porous materials sep-arating the channels. Permeability coefficients� and� in theErgun equation are obtained through an adjustment proce-dure and fitted to experimental data (i.e., flowrate vs. pres-sure drop) measured on the real filter.
The particulate trap object of our investigation is that de-scribed bySaracco et al. (1999)andFino et al. (2003)whichis broadly employed in the automotive industry. Specifically,the configuration presented is that of the exhaust line of acategory of cars produced by FIAT Auto. The filter is madeby a periodic arrangement of longitudinal, square-sectionmicro-channels ofO(1 mm) side, into which the particle-laden flow is driven, as shown inFig. 1(b). Ceramic plugsare placed in a chessboard arrangement either at the end orat the beginning of each channel, so as the exhaust gas flowis forced to cross the porous-ceramic walls and soot parti-cles deposit in the micro-pore network of the walls.
Sub-micron particles are characterized by a size whichscales with the mean free path� of molecules of the high-temperature carrier gas. In the examined cases of 0.2�mparticles, theKnudsen number Kn, that is the ratio betweenthe mean free path of the gas molecules and the particle di-ameter, is 0.52. Specific particle–gas interaction modellingis required to take into account both drag coefficient modi-fication, through the Cunningham correction factor (Li andAhmadi, 1993; Crowe et al., 1998; Fan and Ahmadi, 1995,2000; Shams et al., 2000) and, being the kinetic energy of agas molecule high enough to impact on particle trajectory,a Brownian force term (Li and Ahmadi, 1993; Fan and Ah-madi, 1995, 2000; Shams et al., 2000). Also, particle–wallinteractions are modelled by means of a restitution coeffi-cient derived on the basis of the kinetic energy loss at theimpact (Wall et al., 1990; Johnson and Pollock, 1994; Dah-neke, 1995; Brach and Dunn, 1995, 1998among others).

F. Sbrizzai et al. / Chemical Engineering Science 60 (2005) 6551–6563 6553
2. Methodology
2.1. Flow field simulation
Reynolds number based on the average velocity of the ex-haust gas and on the channel side gives a value of∼ 200,in the range of laminar flow regime. To obtain an accuratenumerical solution of the flow field, we used a commercial,finite-volume Navier–Stokes solver (Star-CD). Diesel en-gine exhaust smoke systems are preceded by a turbochargerand a long pipe. We can thus, in a first approximation, ne-glect flow oscillations and solve the steady-state flow field.The equations solved are mass balance:
�ui
�xi
= 0 (1)
and momentum balance:
uj
�ui
�xj
= −�P ∗
�xi
+ ��2ui
�x2j
(2)
written in incompressible form due to limited pres-sure drop, which is small enough to make compress-ibility effects negligible. In Eq. (2),P ∗ is the kine-matic pressure termP/�, and P is the time-averagedpressure field. Equations are solved using the SIMPLEalgorithm.
Flow field is calculated in a limited region of the fil-ter, representing an elementary portion of it which, peri-odically reproduced in thex and y directions, forms theoverall structure. This element is sketched inFig. 2. Itprovides a periodic arrangement of longitudinal square-section micro-channels with sidel of 1.4 mm. As shown inFig. 2 domain inlet, at the center of which the origin ofreference frame is located, lies at about 36 channel sidesupstream of the filter face to make flow field in proximityof the filter independent from inlet conditions. For the samereason, outlet is placed at 33 channel sides downstream ofthe filter exit. The overall length of the filter isL = 181l,whereas the length of the domain is 250l. Computationaldomain is discretized into 44× 44× 159 hexaedric finite-volumes (giving an overall amount of 307 824 cells) inthe spanwisex and y directions and in the streamwisez,respectively. For clarity, the sub-division along thez direc-tion is not shown inFig. 2. Dark-gray cells represent fluidconditions, whereas light-gray cells are used to model theporous walls. A grid refinement is visible in correspon-dence of the interface between fluid cells and porous cellswhere larger velocity gradients were found in preliminarysimulations.
Two of the four channels are plugged at entrance, withceramic plugs 1–2 channel sides long. Similar plugs areplaced at the end of the other two channels, forcing theflow to cross the porous ceramic and to trap particles on thesurface of the filter walls (thickness of which iss=0.38 mm).
Channels with a plug placed at the entrance are crossed by aparticle-free gas stream (since particles have been capturedby the wall, in the adjacent channel) and will be referred toasclean channels, whereas the channels plugged at the end,containing all particles, will be referred to asdirty channelshereinafter.
2.2. Flow boundary conditions
Appropriate boundary conditions are applied to domainboundaries to reproduce faithfully the working conditionsof the filter. As shown inFig. 2, an inlet condition is placedin the far upstream boundary, normal toz-axis. It providesa velocity of 3 m/s, uniform alongx and y directions andparallel toz-axis. At the opposite boundary mass balanceconservation is ensured by an outlet condition.
As mentioned earlier, being the domain represented inFig. 2an elementary part of a periodic arrangement, periodicconditions are applied to all boundaries perpendicular tox-and y-axes. This means that flow conditions found at onelateral side of the domain are re-introduced at opposite side,both inx and iny directions. Finally, a no-slip and no-crossboundary condition is applied to all solid surfaces (e.g., theplugs).
2.3. Porosity modelling against experiments
To obtain a realistic representation of working conditions,correct values for the porosity parameters must be deter-mined. The porosity index of the ceramic used to build thefilter was experimentally determined and its value, definedas
� = volume void fraction
overall volume(3)
is � = 0.45.The flow field through the porous walls is modelled by the
Darcy equation, giving a distributed pressure loss describedby Eq. (4),
�u = − k
�∇P (4)
in which ki is the permeability,� is the fluid viscosityand P is the static pressure.�u is the superficial velocityvector.
The permeability value was obtained as:
ki = �i |�u| + �i (5)
�i and�i being thepermeability coefficients.In the present case,ki is the same for all directions (ki =
k), i.e., the medium is isotropically porous and the Ergun

6554 F. Sbrizzai et al. / Chemical Engineering Science 60 (2005) 6551–6563
Fig. 2. Axonometric view (mesh) of four channels which form the elementary filtration cell, modelled via a finite-volume CFD code for the solution ofthe Navier–Stokes equation (Star-CD).
equation (6) is used.
dp
L= −150�(1 − �)2u
�3D2p
− 1.75�(1 − �)u2
�3Dp
. (6)
Here,� is the fluid molecular viscosity andDp is the av-erage diameter of the grains forming the porous medium.Combining Eqs. (5) and (6) we obtain
� = 1.75�(1 − �)�3Dp
; � = 150�(1 − �)2
�3D2p
. (7)
To determine� and� we need thus, other than the valuesof �, � and�, the average diameter of the grainsDp, whichis a priori unknown. The uncertainty in the average value ofDp (observed through microscope) leads to large errors inthe determination of� and�. For this reason, we took anaverage value ofDp from literature only to perform a firstsimulation—with trial values of� and �—which purposewas that of giving us a starting point from which to proceedfor further adjustment ofDp to fit with the experimentalvalue of pressure loss at given values of the mass flowrate.Experiments were performed to measure the characteristic
pressure—flowrate velocity curve and data are provided inSection 3.
2.4. Sub-micron particle modelling
To simulate the behavior of particles with dimensionssmaller than 1�m (sub-micron particles) we must accountfor the non-continuous molecular structure of the flow. It isknown (Li and Ahmadi, 1993; Crowe et al., 1998) that forparticles having dimension smaller than the mean free pathof the molecules of the gas in which they are dispersed,the carrier fluid is far from being a continuum, since it in-teracts with particles as a collection of rigid bodies whichrandomly collide with the particle, with intensity dependingon the kinetic energy content of the molecules (i.e., on thegas absolute temperature). This introduces two effects: (i) aBrownian force term able to modify particle trajectories in anearly random fashion and (ii) a partial slip, which reducesthe drag coefficient depending on dilution parameters. Theparameter used to quantify dilution effect is the Knudsennumber, defined as the ratio of the mean free path of the gas

F. Sbrizzai et al. / Chemical Engineering Science 60 (2005) 6551–6563 6555
molecules� and the particle diameterdp:
Kn = �dp
. (8)
The mean free path of a molecule can be calculated fromkinetic theory by (Sharipov and Seleznev, 1998):
� =√
��2P
(2RT
m
)1/2
, (9)
whereT is the gas temperature inK, dm is the molecule di-ameter,m is the molecular mass in atomic unitsP is pres-sure andR is the universal gas constant. In the presentcase, characterized by a temperature ofT = 600 K, and apressure of 100 kPa, the mean free path value is (for air)��1.040× 10⁻⁷ m. The value of the Knudsen number isthenKn�0.52 and we are in the case oftransitional flow(Crowe et al., 1998), defined for 0.25<Kn<10.
We calculated the trajectory of each particle by integratingover time the equation of motion—i.e., using a Lagrangianapproach—modelling the particles as non-interacting, non-deformable solid spheres and considering one-way couplingmomentum transfer between particles and fluid. Time ad-vancement is done with a forward-Euler method, using atime step of 5.7×10⁻⁸ s. The small time step is determinedby the small size of the particles and makes simulations longand costly. Further improvement may be achieved by usingsemi-implicit methods.
The generic equation of motion for each particle, writtenin a Lagrangian reference frame is
�p
�d3p
6
��v�t
=∑i
�Fi , (10)
wheredp is particle diameter,�p is particle density and�vis particle velocity vector. The sum of forces on the RHSof Eq. (10) represents all the forces acting on a particlein a fluid stream. For the purposes of the present work,the assumption of transitional flow described leads to thefollowing expression (Ahmadi and Chen, 1998):
d �vdt
= 3�CDRep
2d2p(2�p/� + 1)Cc
(�u − �v) + �Fb(t) (11)
in which �u is the fluid velocity at the particle position,�is fluid density andCD is the drag coefficient evaluated as(Ahmadi and Chen, 1998):
24
Rep
(1 + 1
6Re0.67
p
), (12)
Rep being the particle Reynolds number:
Rep = dp|�v − �u|�
. (13)
Eq. (12) represents a good approximation for the drag coeffi-cient while 1<Rep <1000.Cc is the Stokes–Cunningham
slip correction, calculated as:
Cc = 1 + 2Kn[1.257+ 0.4 exp(−0.55Kn)]. (14)
The second term on the RHS of Eq. (11) is the Brownianforce, which also becomes important for sub-micron parti-cles. This Brownian term was simulated as a Gaussian whitenoise random process (seeOunis et al., 1991; Gupta andPeters, 1985; Li and Ahmadi, 1993; Ahmadi and Chen,1998).
To evaluate the overall effect of both transitional flow andof Brownian effect, we performed Lagrangian tracking oftwo swarms of 0.2�m particles released at the same initialpositions. The first simulation, calledno-slipcase, includedonly drag and inertia acting on particles; the second simula-tion, calledslip case, included also the Cunningham correc-tion factorCc for drag calculation and the influence of theBrownian term described above.
2.5. Porous wall–particle interactions
During an impact between a particle and a wall, kineticenergy is dissipated (i) via plastic deformation during theparticle–wall approach and (ii) through adhesion–separationwork during the contraction phase (Johnson et al., 1971;Johnson and Pollock, 1994; Brach and Dunn, 1995, 1998).The material properties both of the particles and of the im-pacting barrier strongly affect these energy losses, makingexperimental measurements of crucial importance. In thiswork we considered the rigid-body impact models devel-oped byCaylor (1993), Dunn et al. (1995)andBrach andDunn (1995)among others, and kinetic-energy-based mod-els such as that developed byDahneke (1995).
Dahneke (1995)presented an energy-based model for asimple-collision process in which energy of plastic defor-mation dissipated during the approach phase, and energy ofseparation from the adhesive force in the contraction (re-bound) phase were accounted for by means of a coefficient ofrestitutione, which is thus the ratio between the wall-normalcomponent of the approaching velocityvi and the wall-normal component of the rebound velocityvr (e = vi/vr ).The coefficient of restitution was validated through normal-impact experiments in which 1.27�m polystyrene sphereshit a fused-silica surface at different velocities. Startingfrom the experimental curve ofDahneke (1995), shown inFig. 3(a) as white circles, we calculated an interpolationfunction, also shown inFig. 3(a) with the continuous line, us-ing the following expression for the coefficient of restitution:
e = 0.94
[1 − exp
(−vi + 0.5
1.6
)]+ 0.02. (15)
This correlation reproduces well the behavior of the co-efficient of restitution for the range of incident normalvelocities up to 20 m/s, as visible inFig. 3.
As it will be discussed later, we observed from simula-tions that wall normal velocities never exceed 0.05 m/s in

6556 F. Sbrizzai et al. / Chemical Engineering Science 60 (2005) 6551–6563
Fig. 3. Interpolation function (a) used to calculate the coefficient ofrestitution during impacts between soot particles and the porous wall,according to the experimental observations ofDahneke (1995). As visiblefrom the vectorial representation of the velocity field shown in (b), smallnormal velocities cause very small coefficient of restitution, involving thatall particles are captured after an impact.
the entire micro-channel. Again, fromFig. 3, we notice thatfor normal velocity lower than 2 m/s, the coefficient of resti-tution has not been experimentally determined, but approx-imated through an asymptotic expression (Dahneke, 1995)going to zero while normal velocity value decreases. Con-sequently, we can assume that particles withvi �2 m/s areprobably all captured by the adhesive forces and by adsorp-tion on the ceramic surface. We verified a posteriori that evenapplying the bounce–capture model ofDahneke (1995), allparticles are captured at their first impact.
3. Results
3.1. Experimental validation
Measuring local velocities in the filter channels withoutaltering the filter geometry is made difficult by fragility andhardness of the materials used. Thus, we made an indirectflow field validation by using the characteristic curve of thefilter, experimentally obtained. As characteristic curve wemean here the pressure drop between the two sides of thefilter as a function of the overall mass flowrateW. Experi-ments were performed in the test facility shown inFig. 1, inwhich flowrate is measured with a digital flow meter and�p
is measured with two pressure probes placed up- and down-stream of the filter and connected to a differential pressuregauge. Results are reported inFig. 4 as the continuous line.
Fig. 4. Comparison between the numerically obtained characteristic curveof the filter (×) and the experimental one (+), used to tune the porosityparameters. Conditions at which soot is released correspond to the pointwhere the mass flowrate value is of 164 kg/h. This point is representedhere for the experimental case (�) and for the simulation (�).
To achieve correspondence with experiments, we con-ducted a set of simulations using the geometry sketchedin Fig. 2 and varying the value ofDp (i.e., the averagegrain size of the porous ceramic) in Eqs. (7). This proce-dure allows to obtain the permeability coefficients� and� required by the numerical code to impose the poros-ity conditions (i.e., distributed pressure loss). Simulationswere first performed using a tentative value ofDp (foundin technical literature) which gave, for the different val-ues of the mass flowrate imposed at inlet (i.e., from 105 to640 kg/h) an approximate characteristic curve. Using thesedata, we made successive adjustments ofDp and, by furthersimulations, we tried to reproduce as accurately as possi-ble the experimental curve. Final result, reported inFig. 4,shows a good agreement with experiments. To perform La-grangian tracking, we used instead a fixed mass flowrate ofW = 164 kg/h (4.556× 10⁻² kg/s), included in the inter-val used to tune porosity parameters. Corresponding pointis marked on the characteristic curve ofFig. 4with differentsymbols (representing the experimental and the numericalvalue).
3.2. Fluid velocity profiles
Particle behavior is dominated by the flow field. Specifi-cally, fluid velocity in different regions of the micro-channelmay determine differences in particle deposition and trap-ping, due to locally non-uniform particle flows. Furthermore,the cross-wall flowrate may heavily affect those particleswhose dynamics are dominated by the drag force. For thisreason, as preliminary observations on the flow field we de-cided to examine (i) velocity profiles at differentzpositionsalong the entire 4-micro-channel filter-element, and (ii) thecross-wall flowrate variations alongz coordinate.

F. Sbrizzai et al. / Chemical Engineering Science 60 (2005) 6551–6563 6557
We expect the gas flow leaving progressively a dirty chan-nel to be transferred through the porous walls to the ad-jacent clean channels, giving place to a progressively de-creasing mass flowrate in the former and a correspondingincrease in the latter while proceeding along thez coordi-nate. However, we have no experimental evidence on howthe cross-wall (or through-wall) flowrate varies along a chan-nel nor on the shape of velocity profiles inside the channels.There are several works on flow in square channels show-ing presence of counter rotating corner vortices (Gavrilakis,1992) which may influence particle deposition. However, theporous wall boundary condition changes strongly the veloc-ity distribution and few words are necessary to describe thephenomenon.
In Fig. 5(a), axial velocity profiles in the meridian plane ofa pair of complementary channels (dirty channel, below andclean channel, above) are shown. Profiles refer to differentvalues of thezcoordinate and more profiles are concentratedat closerz positions where velocity changes are steeper,i.e., at channel inlet and outlet. Shown profiles correspondto an overall flowrate (across the filter section) of 4.556×10⁻² kg/s (164 kg/h), i.e., to the normal working conditions,characterized by an average velocity over the filter sectionarea of 3 m/s. In the dirty channel, we observe an initially flatvelocity profile (close to the inlet section—Fig. 5(a)) thatadjusts to a parabolic Poiseuille profile proceeding down-stream, with almost constant centerline velocity. At about80% of the channel length, centerline velocity decreasesabruptly. In the clean channel we observe profile variationscomplementary to those observed in the dirty one, with aslowly increasing parabolic profile which suddenly grows atabout 80% of the channel length. Flow rate across the chan-nel walls is thus strongly non-uniform in the axial direction.
In Fig. 5(b) the through-wall flowrate along the pair ofchannels is shown. Two peaks are visible at the inlet and atthe outlet of the channels, respectively, and the amplitudeof the peak at outlet is about 1.5 times that of the inlet. Theinitially flat velocity profiles observed inFig. 5(a) involvehigher near-wall velocities (i.e., an higher near-wall flow)which in turn causes an initially high wall-flow which de-creases progressively proceeding alongz, as the profile ad-justs to Poiseuille parabolic law. On the other hand, a certainpressure rise is observed proceeding toward the plugged end,and it causes a rapid growth of the through-wall flow, pro-ducing the second peak. The fluid transfer across the wallsof the filter is thus non-uniform and shows a higher peak incorrespondence of the final section, a smaller one at the inletof the channel and a minimum in the middle. This behavioris bound to influence particle deposition along the filter andis partially responsible for non-uniform particle concentra-tions observed in the deposition process.
3.3. Particle deposition
In the previous sections we have identified some of themain characteristics of the flow field developing in the micro-
channels; knowing that these are able to affect particle dis-persion and deposition along the channels, we want to iden-tify which ones, among those we cited, play the major role.To this purpose, we examined the behavior ofO(104) soot-representative particles with density� = 1000 kg/m3 anddiameter ranging from 0.2 to 2�m. In our simulations grav-ity is neglected and deposition is controlled by drag andinertia; for this reason density does not enter as a param-eter in the particle equation of motion (11) but appears incombination with particle diameter. We run one simulationfor a set of larger, 2�m diameter particles and two dis-tinct simulations for a set of smaller 0.2�m particles, toexamine separately the influence of Brownian motion andof the partial slip with the air molecules accounted by theCunningham factor.Table 1 reports the data of the threesimulations. Aim of these simulations is to verify if thereare and which are the locations for preferential particledistribution.
The position at which particle deposit for the three dif-ferent simulations is shown inFig. 6. Figs. 6(a)–(c), onthe left, show the position at which particles impact on theporous walls.Figs. 6(a)–(c) have been obtained adding thedata obtained for each of the four channel sides. Since al-most all particles impact the wall with low velocity, this pic-ture is representative of particle deposition probability andthus of soot accumulation in the channel for the 2�m sim-ulation, for the 0.2�m slip case and for the 0.2�m no-slipcase, respectively.Figs. 6(d)–(f) represent in a more quan-titative way the evolution of particle deposition along thechannel length.Figs. 6(d)–(f) show the deposition efficiencyand have been computed by integrating particle concentra-tion number alongx andy directions for different values ofz in a dirty channel. They also represent the probability den-sity function (PDF) of the deposited particle concentrationnumberN/N0 as a function of the axial coordinatez. FromFig. 6it is clearly visible that particles preferentially depositat the end of the channel. This effect is modulated by par-ticle inertia, being more pronounced for the larger particles(seeFigs. 6(a) and (b)). This tendency may be explainedlooking atFig. 5(b): small particles follow the through-wallflow very closely and reach the wall, where the flowrateis larger, precisely at the end of the channel. ObservingFig. 5(b), we noticed a large wall flowrate at the channel in-let. However, virtually no particle deposit at the channel inletdue to inward effect: particle paths bend after the inlet andreach a condition ofvena contracta(not shown here) whichbrings particle trajectory farther from the wall. ExaminingFigs. 6(a)–(c), we notice that smaller 0.2�m particles de-posit more uniformly on the channel walls, compared to thelarger 2�m particles. Smaller and larger particles share thegeneral trend to deposit along the corners. The dashed line inFigs. 6(d)–(f) represents the rescaled shape of the through-wall velocity profile shown inFig. 5(b). The behavior ofthe through-wall flow is qualitatively very similar to particledeposition efficiency only in the second half of the chan-nel. This indicates that not only the through-wall flowrate

6558 F. Sbrizzai et al. / Chemical Engineering Science 60 (2005) 6551–6563
Fig. 5. Axial-velocity profiles along two adjacent channels of the filter (a) and normalized flowrate across the wall alongz coordinate (b).
Table 1Particle parameters and forces considered in Lagrangian tracking simulations
Simulation no. �p (kg/m3) Forces dp (m) p (s)
I 1000 drag, inertia 2× 10⁻⁶ 1.15× 10⁻⁵
II 1000 drag, inertia 2× 10⁻⁷ (no-slip) 1.15× 10⁻⁷
III 1000 drag+slip, inertia, Brownian 2× 10⁻⁷ (slip) 1.15× 10⁻⁷
controls particle deposition, but also thevena contractacon-dition, which causes particle paths to bend inward, prevent-ing deposition in the initial part of the channel. It is inter-esting to notice that the rapid increase of the through wallflowrate in the final part of the channel—due to pressurerise in correspondence of the plug—is the cause of higherdeposition observed here.
It is interesting now to examine the influence of the Brow-nian motion and of the Cunningham slip factor on particledeposition. ObservingFigs. 6(b) and (e) againstFigs. 6(c)and (f) we hardly notice any difference which shows a cleartrend. We thus examined the trajectory of single particles re-leased from the same position in the two cases of no Brown-ian motion and no-slip, and with Brownian motion and slip.We plot the trajectory of twelve selected particles inFig. 7.We chose particles which deposit in different locations alongthe channel wall. Lines refer to the no Brownian motion andno-slip case, whereas symbols refer to the Brownian mo-
tion and slip case. We notice slight differences but randomlydistributed. For instance, in case 1 and 12 particles depositfarther in the slip case, whereas they deposit nearer in cases2 and 6.
For filter design optimization, it is very important to quan-tify global different behavior of the different size particles(0.2 and 2�m particles) and for the different modellingapproaches (Brownian and slip, or not). We try to do thiscomparison inFig. 8, where we show the differences in thedeposition location for the three cases examined.Fig. 8(a) iscomputed by subtracting the deposition PDF for the 0.2�mno-slip case from the deposition PDF for the 2�m case;Fig. 8(b) is computed by subtracting the deposition PDF forthe 0.2�m slip case from the deposition PDF for the 2�mcase, andFig. 8(c) is computed by subtracting the deposi-tion PDF for the 0.2�m slip case from the deposition PDFfor the 0.2�m no-slip case.Figs. 8(a) and (b) are largelysimilar, indicating that smaller particles tend to deposit more

F. Sbrizzai et al. / Chemical Engineering Science 60 (2005) 6551–6563 6559
Fig. 6. Particle accumulation and probability density function of particle concentration number inside the filter dirty channel. Lagrangian tracking ofO(104) particles was used. Dispersions shown refer to soot particles of 2�m (a) and 0.2�m (b) and (c) diameter, respectively. Cunningham slip factorand the effects of Brownian motion are taken into account for the 0.2�m particles in (b) only.
preferentially in the initial part of the channel comparedto the larger particles. InFig. 8(c) we observed no distincttrend, indicating that slip and Brownian motion are just ran-dom noise to particle deposition (difference distribution inFig. 8(c) is in fact similar to a white noise random distri-bution, such as that used to model Brownian term—Li andAhmadi, 1993).
In Fig. 9 we show the correlation between the through-wall fluid velocity and particle preferential deposition.Point-line profiles shown inFig. 9(a) demonstrate the lo-cal through-wall flowrate measured at 5 different positionsalong the channel, corresponding to 20%, 40%, 60%, 80%and 100% of the channel length, respectively. Histogramrepresentation ofFigs. 9(b)–(d) show the particle concen-tration number, measured at the same positions ofFig. 9(a),for the 2�m particles (b) and for the 0.2�m particles slipcase (c) and no-slip case (d). Axisz is parallel to the channelaxis, as shown inFig. 2 and quantities are evaluated along
the x direction (corresponding statistical quantities evalu-ated along they direction will give the same values). Thex coordinate is normalized through the channel sidel and,due to the symmetry of domain, only half of the channel isrepresented in the figure.
Fig. 9(a) shows that the through-wall flowrate has apeak in correspondence of the corner area, where higherparticle concentrations are also observed, as visible inFigs. 9(b)–(d). The presence of an higher wall flowrate incorrespondence of the corner can be explained by consider-ing that, being through-wall flow a function of the pressuredifference across the wall, broadly constant in the spanwisedirection, furthermore being the region of the corner ad-jacent to two clean channels, wall-normal velocity vectorsin correspondence of a corner are given by the sum of thex and y components. For this reason higher wall-normalvelocities are present in this region and cause higher wallflowrate (and higher deposition).

6560 F. Sbrizzai et al. / Chemical Engineering Science 60 (2005) 6551–6563
Fig. 7. Sample of twelve 0.2�m particle trajectories (p1–p12) showingthe effect of the Cunningham slip factor and of the Brownian term onparticle trajectories. Particles are released at the same position—withvelocity equal to that of fluid in the same point—for two independentsimulations with different assumptions, i.e., one neglecting the two terms(no-slip case) and accounting for Stokes drag and inertia only, and theother (slip case) accounting for the Cunningham correction factor in thedrag coefficient and the Brownian term.
3.4. Discussion on the influence of Brownian term
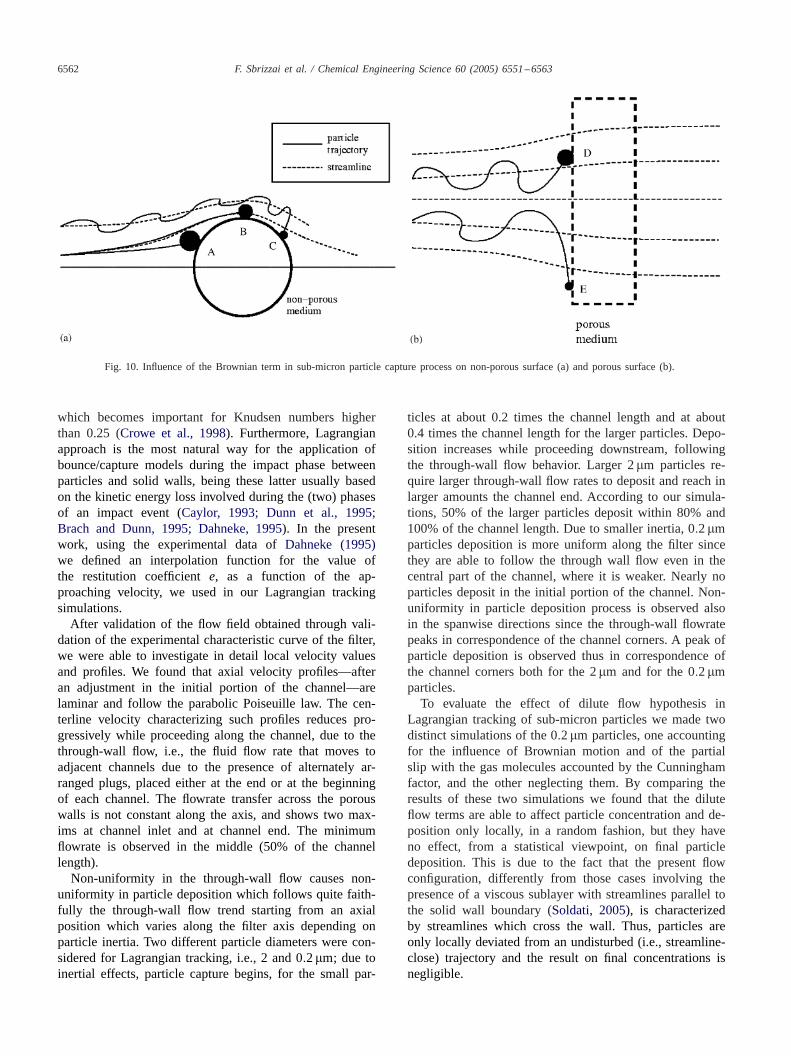
It is known (see, e.g.,Chang and Whang, 1997; Chinjuet al., 2001; Chang et al., 2002; Kim and Zydney, 2004among others) that the influence of the Brownian term inthe deposition process of particles with size smaller thanO(1)�m becomes important. Specifically, Brownian diffu-sion is the fundamental mechanism by which particles arecaptured on solid surfaces, e.g., in the viscous sublayer ofa boundary-layer, where streamlines are parallel to the wallboundary, as sketched inFig. 10(a). As shown inFig. 10(a),different inertia particles deposit following three distinctmechanisms: (A) inertial impact, dominating the depositionprocess of the larger inertia particles; (B) interception,which play a role for intermediate inertia particles and (C)Brownian diffusion, that becomes important for sub-micronparticles, which otherwise tend to slip over the solid bound-ary. An aerosol particle under the effect of the drag force(and inertia) only, due to its small inertia, tend to follow thewall-parallel streamlines of the viscous sublayer and thereis no reason for it to hit the wall, unless a transverse force,such as the random Brownian motion, is applied. In thecase of the micro-porous filter channels object of this paper,even though particles are very small we found the Brown-ian effect negligible on particle deposition. The explanationfor this fact is found on the specific flow configuration en-countered in this type of problem, in which streamlines arenot parallel to the solid surface (actually, a porous surfacewhich is seen as a solid wall for the particles but as a per-meable medium for the flow) but generally they cross it.Separation mechanism for the present flow configuration isthus different from that found in case of non-porous wallsshown inFig. 10(a), and is sketched inFig. 10(b). As wecan note from this figure, particles follow the streamlineswith distorted path-lines because the Brownian effect. How-
Fig. 8. Difference between the probability density function of particleconcentration numbers reported inFigs. 6(a)–(c), measured along thechannel. Difference between 2�m PDF and two different 0.2�m PDFsare reported in (a) and (b); (c) shows the difference between the two0.2�m PDFs.
ever, since streamlines cross the ‘solid’ boundary, the effectof the Brownian term is a “random” shift in the impactinglocation, substantially not able to affect final particle con-centration from a macroscopic viewpoint. For this reason,in the case of particle-laden flow crossing a porous mediumpresented here, even if transported particles are in the

F. Sbrizzai et al. / Chemical Engineering Science 60 (2005) 6551–6563 6561
Fig. 9. Through-wall velocity profile (a) and deposition of particles on the walls in correspondence of 5 different portions of a dirty micro-channel.Thethree different particle sets are: (b) 2�m; (c) 0.2�m slip case; (d) 0.2�m no-slip case. Velocity and concentration profiles refer to 20%, 40%, 60%, 80%and 100% of the channel length, respectively.
sub-micron range, we can assume that drag and possiblyinertia still dominate particle deposition.
4. Conclusions
The soot produced by diesel engines is characterized byparticles having diameter ofO(102 nm), i.e., being partof the so-called PM10 and PM2.5, which are possiblyresponsible for lung-damaging and carcinogenic effects(Saracco et al., 1999; Kagawa, 2002; Fino et al., 2003).To reduce emissions of such pollutants, porous-ceramics-based particulate filters are employed in the exhaust lineof vehicles. In the present work, a numerical approachto investigate the behavior of sub-micron diesel soot par-ticles in the micro-channels of a wall-flow-type filter ispresented.
A lack of literature on theoretical approaches to particu-late filtration by means of porous materials exist, and fewnumerical approaches describing the dispersion mechanismsfor sub-micron particles are available both in wall-flow andin other types of filter. We thus chose to model particlebehavior through a Lagrangian approach, using the flowfield obtained by a commercial finite-volume Navier–Stokessolver (Star-CD) and validated through experimental data,measured on a recent type of silicon carbide (SiC) filter. TheErgun equation has been used to model the porous materialof the filter and porosity parameters were fitted to obtain thebest agreement with experimental data, in terms of pressureloss.
Lagrangian approach is a suitable way to model particlebehavior and to introduce specific terms in the equationof motion, such as the Cunningham correction factor (slipfactor) for the drag coefficient and a Brownian force term,
6562 F. Sbrizzai et al. / Chemical Engineering Science 60 (2005) 6551–6563
Fig. 10. Influence of the Brownian term in sub-micron particle capture process on non-porous surface (a) and porous surface (b).
which becomes important for Knudsen numbers higherthan 0.25 (Crowe et al., 1998). Furthermore, Lagrangianapproach is the most natural way for the application ofbounce/capture models during the impact phase betweenparticles and solid walls, being these latter usually basedon the kinetic energy loss involved during the (two) phasesof an impact event (Caylor, 1993; Dunn et al., 1995;Brach and Dunn, 1995; Dahneke, 1995). In the presentwork, using the experimental data ofDahneke (1995)we defined an interpolation function for the value ofthe restitution coefficiente, as a function of the ap-proaching velocity, we used in our Lagrangian trackingsimulations.
After validation of the flow field obtained through vali-dation of the experimental characteristic curve of the filter,we were able to investigate in detail local velocity valuesand profiles. We found that axial velocity profiles—afteran adjustment in the initial portion of the channel—arelaminar and follow the parabolic Poiseuille law. The cen-terline velocity characterizing such profiles reduces pro-gressively while proceeding along the channel, due to thethrough-wall flow, i.e., the fluid flow rate that moves toadjacent channels due to the presence of alternately ar-ranged plugs, placed either at the end or at the beginningof each channel. The flowrate transfer across the porouswalls is not constant along the axis, and shows two max-ims at channel inlet and at channel end. The minimumflowrate is observed in the middle (50% of the channellength).
Non-uniformity in the through-wall flow causes non-uniformity in particle deposition which follows quite faith-fully the through-wall flow trend starting from an axialposition which varies along the filter axis depending onparticle inertia. Two different particle diameters were con-sidered for Lagrangian tracking, i.e., 2 and 0.2�m; due toinertial effects, particle capture begins, for the small par-
ticles at about 0.2 times the channel length and at about0.4 times the channel length for the larger particles. Depo-sition increases while proceeding downstream, followingthe through-wall flow behavior. Larger 2�m particles re-quire larger through-wall flow rates to deposit and reach inlarger amounts the channel end. According to our simula-tions, 50% of the larger particles deposit within 80% and100% of the channel length. Due to smaller inertia, 0.2�mparticles deposition is more uniform along the filter sincethey are able to follow the through wall flow even in thecentral part of the channel, where it is weaker. Nearly noparticles deposit in the initial portion of the channel. Non-uniformity in particle deposition process is observed alsoin the spanwise directions since the through-wall flowratepeaks in correspondence of the channel corners. A peak ofparticle deposition is observed thus in correspondence ofthe channel corners both for the 2�m and for the 0.2�mparticles.
To evaluate the effect of dilute flow hypothesis inLagrangian tracking of sub-micron particles we made twodistinct simulations of the 0.2�m particles, one accountingfor the influence of Brownian motion and of the partialslip with the gas molecules accounted by the Cunninghamfactor, and the other neglecting them. By comparing theresults of these two simulations we found that the diluteflow terms are able to affect particle concentration and de-position only locally, in a random fashion, but they haveno effect, from a statistical viewpoint, on final particledeposition. This is due to the fact that the present flowconfiguration, differently from those cases involving thepresence of a viscous sublayer with streamlines parallel tothe solid wall boundary (Soldati, 2005), is characterizedby streamlines which cross the wall. Thus, particles areonly locally deviated from an undisturbed (i.e., streamline-close) trajectory and the result on final concentrations isnegligible.

F. Sbrizzai et al. / Chemical Engineering Science 60 (2005) 6551–6563 6563
Acknowledgements
Support to this work by the “Centro Ricerche Fiat” ofOrbassano (TO - ITALY) is gratefully acknowledged. Oneauthor (FS) thankfully acknowledges ATA (AssociazioneTecnica dell’Automobile) for support during this research.
References
Ahmadi, G., Chen, Q., 1998. Dispersion and deposition of particles in aturbulent pipe flow with sudden expansion. Journal of Aerosol Science29 (9), 1097–1116.
Ambrogio, M., Saracco, G., Specchia, V., 2001. Combining filtration andcatalytic combustion in particulate traps for diesel exhaust treatment.Chemical Engineering Science 56, 1613–1621.
Ambrogio, M., Saracco, G., Specchia, V., van Gulijk, C., Makkee, M.,Moulijn, J.A., 2002. On the generation of aerosol for diesel particulatefiltration studies. Separation and Purification Technology 27, 195–209.
Brach, R.M., Dunn, P.F., 1995. Macrodynamics of microparticles. AerosolScience and Technology 23, 51–71.
Brach, R.M., Dunn, P.F., 1998. Models of rebound and capture foroblique microparticle impacts. Aerosol Science and Technology 29 (5),379–388.
Caylor, M.J., 1993. Ph.D. Dissertation, University of Notre-Dame, Notre-Dame, IN, USA.
Chang, Y.-I., Whang, J.-J., 1997. Theoretical simulation of the collectionefficiencies of brownian particles. Colloids and Surfaces A 125,137–148.
Chang, Y.-I., Chen, S.-C., Chern, D.-K., 2002. Hydrodynamic field effecton brownian particles deposition in porous media. Separation andPurification Technology 27, 97–109.
Chinju, H., Nagasaki, S., Tanaka, S., Sakamoto, Y., Takebe, S., Ogawa, H.,2001. Effect of flow field on colloid deposition in filtration process ofpolystyrene latex particles through columns packed with glass beads.Journal of Nuclear Science and Technology 38 (8), 645–654.
Crowe, C., Sommerfeld, M., Tsuji, Y., 1998. Multiphase Flows withDroplets and Particles. CRC Press, Boca Raton, FL, USA.
Dahneke, B., 1995. Particle bounce or capture search for an adequatetheory: I. Conservation-of-energy model for a simple collision process.Aerosol Science and Technology 23 (1), 25–39.
Dunn, P.F., Brach, R.M., Caylor, M.J., 1995. Experiments on the low-velocity impact of microspheres with planar surfaces. Aerosol Scienceand Technology 23, 80–95.
Fan, F.-G., Ahmadi, G., 1995. Analysis of particle motion in the near-wallshear layer vortices—application to the turbulent deposition process.Journal of Colloid and Interface Science 172, 263–277.
Fan, F.-G., Ahmadi, G., 2000. Wall deposition of small ellipsoids fromturbulent air flows—a Brownian dynamics simulation. Journal ofAerosol Science 31 (10), 1205–1229.
Fino, D., Fino, P., Saracco, G., Specchia, V., 2003. Innovative meansfor the catalytic regeneration of particulate traps for diesel exhaustcleaning. Chemical Engineering Science 58, 951–958.
Gavrilakis, S., 1992. Numerical simulation of low Reynolds numberturbulent flow through a straight square duct. Journal of FluidMechanics 244, 101–112.
Gupta, D., Peters, M.H., 1985. Journal of Colloid and Interface Science104, 375.
Johnson, K.L., Kendall, K., Roberts, A.D., 1971. Proceedings of the RoyalSociety of London A 324, 301–313.
Johnson, K.L., Pollock, H.M., 1994. The role of adhesion in the impactof elastic spheres. Journal of Adhesion Science Technology 8 (11),1323–1332.
Kagawa, J., 2002. Health effects of diesel exhaust emissions—a mixtureof air pollutants of worldwide concern. Toxicology 181–182, 349–353.
Kim, M.-m., Zydney, A.L., 2004. Effect of electrostatic, hydrodynamic,and Brownian forces on particle trajectories and sieving in normal flowfiltration. Journal of Colloid and Interface Science 269, 425–431.
Li, A., Ahamadi, G., 1993. Deposition of aerosols on surfaces in aturbulent channel flow. International Journal of Engineering Science 31,435–451.
Ounis, H., Ahmadi, G., McLaughlin, J.B., 1991. Brownian diffusion ofsub micron particles in the viscous sublayer. Journal of Colloid andInterface Science 147, 233.
Saracco, G., Badini, C., Specchia, V., 1999. Catalytic traps for dieselparticulate control. Chemical Engineering Science 54, 3035–3041.
Sbrizzai, F., Verzicco, R., Pidria, M.F., Soldati, A., 2004. Mechanisms forselective radial dispersion of microparticles in the transitional regionof a confined turbulent round jet. International Journal of MultiphaseFlow 30, 1389–1417.
Shams, M., Ahmadi, G., Rahimsadeh, H., 2000. A sublayer model fordeposition of nano- and micro-particles in turbulent flows. ChemicalEngineering Science 55, 6097–6107.
Sharipov, F., Seleznev, V., 1998. Data on internal rarefied gas flows.Journal of Physical and Chemical Reference Data 27 (3), 657–706.
Soldati, A., 2005. Particles turbulence interactions in boundary layers.Zamm-Zeitschrift fur Angewandte Mathematik und Mechanik 85,683–699.
Wall, S., John, W., Wang, H.-C., 1990. Measurement of kinetic energyloss for particles impact surfaces. Aerosol Science and Technology 12,926–946.