appositional bone formation in canine bone: a quantitative
TRANSCRIPT
J. Anat., Lond. (1964), 98, 4, 665-677 665With 1 plate and 3 text-figuresPrinted in Great Britain
Appositional bone formation in canine bone: a quantitativemicroscopic study using tetracycline markers
BY W. R. LEEInstitute of Orthopaedics, University of London*
INTRODUCTION
The rate at which bone is laid down in the formation of secondary osteones incanine compacta was first investigated by Vincent in 1955, using oral lead acetateas an intravital microscopic bone marker. Although the compound was of con-siderable toxicity, this and later work by Vincent & Nguette (1957) and Ponlot(1960) showed that the linear bone formation rate, or 'appositional growth rate'was higher in the early stages of osteone formation than it was towards the end.Marshall, Jowsey & Rowland (1959) studied the growth process by autoradiographsof 45Ca deposited in growing canine osteones and from the distribution of the isotopein relation to time following injection concluded that appositional growth rate wasproportional to the diameter of the vascular canal of the osteone. Soon afterMilch, Rall & Tobie (1957) had reported the ability of the tetracycline antibioticsto behave as intravital stains of bone-forming surfaces, Harris (1960) and Frost(1960) showed that these drugs could be used as high-resolution bone markers inthe quantitative study of appositional growth rate, the great advantage of thetechnique being that it could be extended to the investigation of human boneformation. The drugs form a yellow fluorescent complex in the calcification frontof the growing bone surface (Ghosez, 1959; Harris, Jackson & Jowsey, 1962) andthis can be detected in undecalcified sections of bone by fluorescence microscopy.When the drugs are administered as single therapeutic doses at known time intervals,the osteones which had formed in the marker interval contain a correspondingseries of clear fluorescent lines, the microscopic distance between which can beeasily measured. This method of 'labelling' new bone formation has been used tomeasure osteone formation time in the puppy (Vanderhoeft, Kelly & Peterson, 1962)and to demonstrate the depression by corticosteroids of osteoblastic activity inthe periosteum of the rat diaphysis (Stanisavljevic, Roth, Villaneuva & Frost,1962).Before the technique could be applied to the study of human bone formation it
appeared necessary to develop a quantitative technique and to obtain a mathe-matical expression for the rate of appositional growth. It was also of interest toanalyse the growth process in different parts of the skeleton, including cancellousbone, in animals of different age.
* Present address: Department of Morbid Anatomy, Westminster School of Medicine,London, S.W.I.
Anat. 9844

666 W. R. LEE
MATERIALS AND METHODS
Three animals were used in the investigation: a puppy bitch aged 3 months(dog P), a bitch aged 1-2 years (dog N),* and an old dog of unknown age (dog G).All were well nourished and were fed on a standard diet. The young animals receivedtwo single intravenous doses of demethylchlortetracycline (20 mg./kg.) with a10-day interval between doses: they were killed 2 days after the second dose. Theold dog received two doses of oxytetracycline (50 mg./kg.) at an interval of 21 days:it was killed 4 days after the second dose.Each cadaver was skinned, eviscerated, and the soft tissues were dissected from
the skeleton, which was then fixed in neutral formol saline. Blocks of bone of1-2 cm. dimensions were taken from dogs P and N at the skeletal sites given inTables 3 and 4. The femoral head, femoral condyle, iliac crest and vertebral bodieswere cut longitudinally, the remainder transversely. The older animal, dog G, wasused for a preliminary experiment and only results from transverse sections of themid-shaft of the femur were included in this study. The blocks were embedded inpolymethyl methacrylate and sections of approximately 100 It in thickness werecut on a milling machine and prepared for microscopy by grinding them to approxi-mately 15 ,u between ground-glass plates (Jowsey, 1955). Unstained sections weremounted in 'Fluorfree' (G. T. Gurr) for fluorescence microscopy. Sections for histo-logical study were stained by the periodic acid-Schiff technique (McManus, 1946),counterstained with tartrazine and mounted in 'Xam' (G. T. Gurr).The apparatus for fluorescence microscopy was mounted on an optical bench as
described by Kuper & May (1960). The light source was a Mazda 250 watt mercuryvapour lamp and the primary filter system, a combination of the Corning 57-59 andthe Chance OB 10, transmitted light ofmaximum intensity between 410 and 440 mswavelength. When a glass ultraviolet filter (M 1683, Cooke, Troughton & Sims) wasused as a secondary filter to transmit light greater than 520 m/t, the bright yellowfluorescence of the tetracycline complex was seen against the light green auto-fluorescence of bone and marrow and the dark green osteone canals and marrowspaces. A one-sixth in. objective and a calibrated x 6 monocular microscope eyepiecemicrometer were used to measure the linear distances between the markers.
RESULTS
Description of the material and evaluation of the tetracyclines as bone markersIn the compact bone of the adult dogs and the puppy the secondary osteones
which had been growing throughout the marker period contained two fluorescentrings, while those osteones which had started or ended growth between the admini-stration of the drugs showed only one marker (PI. 1, fig. 1). Initial examinationrevealed that the width of the tetracycline markers was between 4 and 10 , andthis appeared to depend upon the rate of growth and the obliquity of the marker inthe plane of the section. Measurement of appositional growth in secondary osteones
* These dogs were used as part of another experiment to investigate bone formation and calciumaccretion. Lee, W. R., Marshall, J. A. & Sissons, H. A. (in preparation).

Appositional bone formation in canine bone 667was made from the maximal fluorescence at the mid-points of the markers in twoplanes at right-angles (Text-fig. 1).The variation in distance between the markers in different osteones was consider-
able; the markers in the almost fully formed osteones could hardly be separated,
*~ Tetracycline
Eyepiecemicrometerscale
Text-fig. 1. To show the measurement of appositional growth rate in concentric osteones.
0v
00
0
0L.
0
L-
Ez
10 30 50 70 90 110 130 150 170 19020 40 60 80 100 120 140 160 180 200
Diameter of outer marker (is)
Text-fig. 2. A histogram to show the distribution of the outer marker diameter in 100forming osteones in the femoral compacta of dog G. The slow-growing osteones in whichthere was minimal separation were not used for appositional growth measurement andwere not included in the histogram.
44-2
I
668 W. R. LEEwhile in the earliest stage of osteone formation there was a wide separation (PI. 1,fig. 1). In the old animal there was a decline in growth rate from a maximum ofabout 2 , per day to a complete cessation of growth and it was apparent, when thesize distribution of 25 measured osteones was examined, that there was a markedpreponderance of the slower-growing osteones with less separation between themarkers and a smaller outer marker diameter (Text-fig. 2).The problem in quantitative measurement was therefore mainly one of sampling,
since a mean value for a population of osteones could be weighted by a consciousor subconscious bias to the measurement of osteones in early or late stages ofdevelopment.
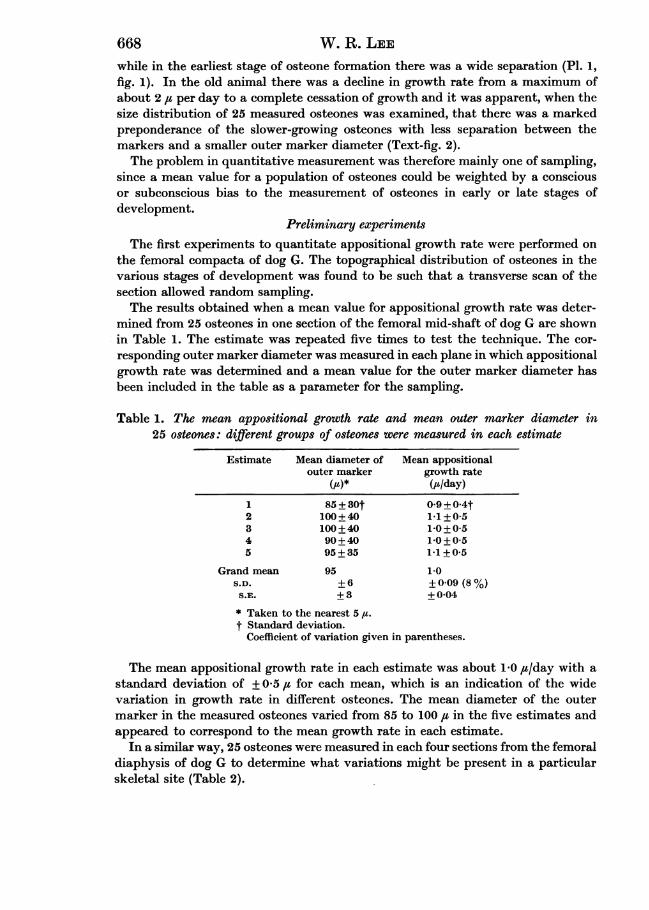
Preliminary experimentsThe first experiments to quantitate appositional growth rate were performed on
the femoral compacta of dog G. The topographical distribution of osteones in thevarious stages of development was found to be such that a transverse scan of thesection allowed random sampling.The results obtained when a mean value for appositional growth rate was deter-
mined from 25 osteones in one section of the femoral mid-shaft of dog G are shownin Table 1. The estimate was repeated five times to test the technique. The cor-responding outer marker diameter was measured in each plane in which appositionalgrowth rate was determined and a mean value for the outer marker diameter hasbeen included in the table as a parameter for the sampling.
Table 1. The mean appositional growth rate and mean outer marker diameter in25 osteones: different groups of osteones were measured in each estimate
Estimate Mean diameter of Mean appositionalouter marker growth rate
(W)* (#/day)
1 85 + 30t 0-9 +0-4t2 100+40 1*1+0-53 100+40 1-0+0-54 90+40 1*0+0-55 95+35 1-1+0-5
Grand mean 95 1.0S.D. + 6 + 0-09 (8%)S.E. +3 +0-04* Taken to the nearest 5 /t.t Standard deviation.
Coefficient of variation given in parentheses.
The mean appositional growth rate in each estimate was about 10 ju/day with astandard deviation of + 0' 5 #t for each mean, which is an indication of the widevariation in growth rate in different osteones. The mean diameter of the outermarker in the measured osteones varied from 85 to 100 ptt in the five estimates andappeared to correspond to the mean growth rate in each estimate.
In a similar way, 25 osteones were measured in each four sections from the femoraldiaphysis of dog G to determine what variations might be present in a particularskeletal site (Table 2).

Appositional bone formation in canine bone
Table 2. The mean appositional growth rate in four sections from the femoraldiaphysis of dog G (25 osteones were measured in each section)
Section Mean diameter of Mean appositionalouter marker growth rate
(#/day)G.E. 2 80+30t 0 9±+04tG.E.3 95+40 1*1+0-5G.E. 5 85 +40 1*0+0-5G.E. 6 95+40 1-0+0-6
Grand mean 90 1.0S.D. +8 + 0-1S.E. +4 + 0-05
* Taken to the nearest 5 At.t Standard deviation.
The results show that, within the limits of the technique, appositional growth ratewas of a constant range in this particular part of the skeleton.
Experiment to determine the appositional growth rate in a variety of skeletal sites ina 1- to 2-year-old dog (N) and a puppy (dog P)
The experiment on dogs N and P was performed to investigate appositionalgrowth rate in compact and cancellous bone. One section from each of a widevariety of skeletal sites (Tables 3 and 4) was used since the previous experiments hadshown no variation in the individual site. The measurement of appositional growthin cancellous bone was made more difficult by 'flaring' of the markers which arosewhen the plane of section had cut the growing surface obliquely. In some trabe-culae the markers were clearly defined and these were selected for measurement(P1. 1, fig. 2). Since growth on any individual surface was uneven, the maximumdistance between a given pair of markers was measured in order to achieve uni-formity.Compact bone containing osteones suitable for measurement was present in
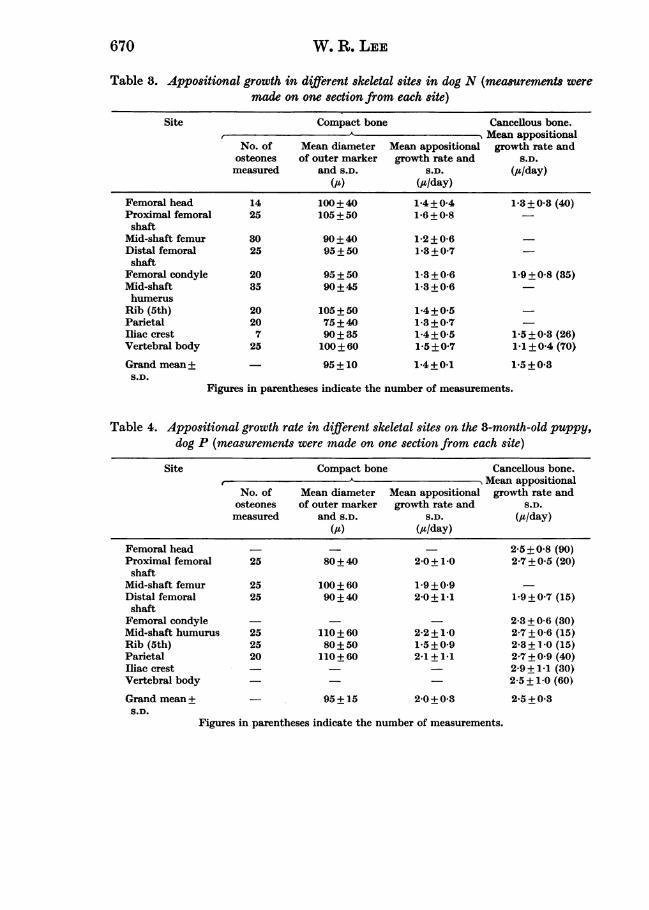
each skeletal site designated in dog N but sufficient cancellous bone was found inonly four sites (Table 3). The range of appositional growth in compact bone variedslightly; the mean values from seven of the ten anatomical regions were between1-3 and 1-4 j/tday, while lower and higher values were obtained in populations inwhich the mean outer marker diameter was correspondingly higher or lower. Thissuggested either that the sampling was not entirely random or that osteonedimensions vary in different bones. The values for cancellous bone in the femur,vertebral body and iliac crest were more variable and tended to be higher thanfigures for appositional growth in the compacta; this was more likely to be areflection of the selective measurement of maximum growth distances rather thana true biological difference.The values for appositional growth rate in the 3-month-old puppy (dog P) are
shown in Table 4. In the six skeletal sites of dog P where it was possible to measureappositional growth in compact bone, the mean values extended from 1-5 to 2 2 p/daywith a grand mean of 2-0 + 0-3 it/day. Of particular note were the low values
669
670 W. R. LEE
Table 3. Appositional growth in different skeletal sites in dog N (measurements weremade on one section from each site)
Site Compact bone Cancellous bone.IFA
, Mean appositionalNo. of Mean diameter Mean appositional growth rate andosteones of outer marker growth rate and S.D.measured and S.D. S.D. (des/day)
(At) (#/day)
Femoral headProximal femoralshaft
Mid-shaft femurDistal femoralshaft
Femoral condyleMid-shafthumerusRib (5th)ParietalIliac crestVertebral body
Grand mean+S.D.
Figures in parentheses indicate the number of measurements.
Table 4. Appositional growth rate in different skeletal sites on the 3-month-old puppy,dog P (measurements were made on one section from each site)
Site Compact bone Cancellous bone.No. Mean appositionalNo. of Mean diameter Mean appositional growth rate and
osteones of outer marker growth rate and S.D.measured and S.D. S.D. (#/day)
(A) (is/day)
Femoral headProximal femoralshaft
Mid-shaft femurDistal femoralshaftFemoral condyleMid-shaft humurusRib (5th)ParietalIliac crestVertebral body
Grand mean +S.D.
Figures in parentheses indicate the number of measurements.
1425
3025
2035
20207
25
100+40105+50
90 + 4095 +50
95 + 5090 + 45
105 + 5075 + 4090 + 35100+60
95+10
1*4+0-41.6+0.8
1-2+0-61*3+0_7
1-3+0-61-3+06
1*4+0*51-3+0*71*4+0-51*5+0-7
1'4+0.1
1.3±0-3 (40)
1*9+0*8 (35)
1*5+0*8 (26)1*1±0-4 (70)
1-5+0-3
25
2525
252520
80 + 40
100+ 6090 + 40
110+6080 +50110+60
95+15
2-0+ 10
1-9+0_92-0+1-1
2-2+1 01*5+0*92-1+1-1
2-0+0-3
2-5±0-8 (90)2*7 + 0*5 (20)
1 9_0-7 (15)
2-3±0-6 (30)2-7_0-6 (15)23 +±1*0 (15)2-7+0-9 (40)2*9+1*1 (30)2-5 _1*0 (60)
2'5+0-3
Appositional bone formation in canine bone(15 + 9 0 is/day) obtained in the rib where the anatomical structure was such thatmany osteones had a smaller cement-line diameter than at other skeletal sites.An unexpected problem arose in the sections from the proximal and distal
femoral shaft of dog P. In most instances it was easy to recognize secondaryosteones (P1. 1, fig. 3) but in the region of the linea aspera it was almost impossibleto distinguish between primary and secondary osteones (P1. 1, fig. 4). The valuesobtained in these sites might consequently be expected to differ from those in theremainder of the skeleton, but in fact they showed no marked discrepancy.
In cancellous bone in nine different parts of the skeleton of dog P the range ofvalues for appositional growth rate was from 1 9 to 27 ,u/day with a grand mean of2 5 + 0,3u/day. The apparently greater values for appositional growth rate incancellous bone was again, as in dog N, likely to be a reflection of the selectivemeasuring technique.
The use of the regression line as an index of appositional growth rateThe results obtained in the preliminary studies of appositional growth rate
showed that the process was of wide but constant range in each part of the skeletonwhich was studied. The use of a mean value and a standard deviation to expressthe range of the process in a population of osteones did not appear to be a satis-factory mathematical expression for a growth process which declined to zero, anddid not seem to be entirely satisfactory for the detection of subtle changes in growthrate which might be present in experiments designed to investigate, for example,the influence of dietary or hormonal factors on osteoblastic activity.
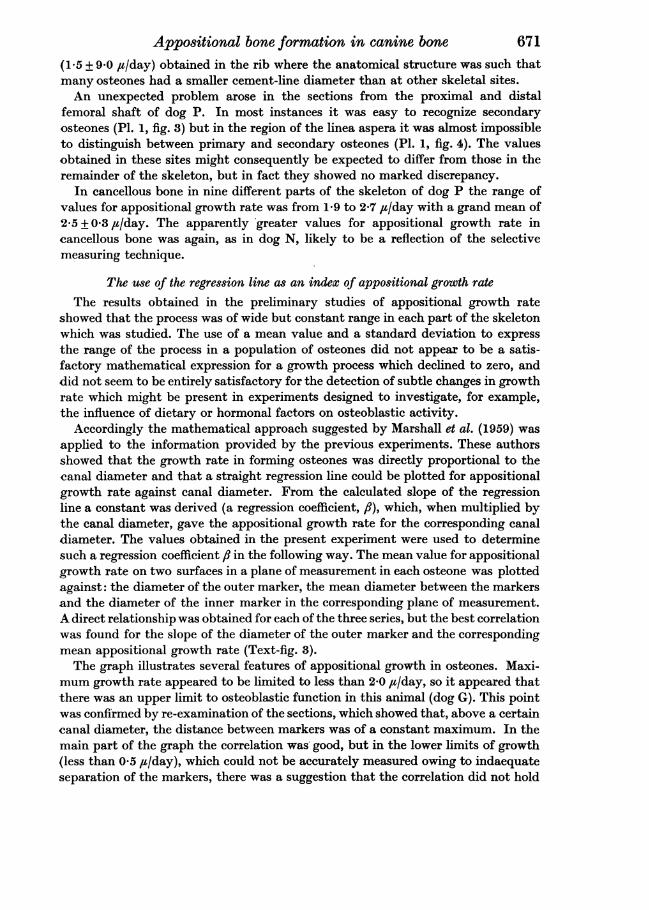
Accordingly the mathematical approach suggested by Marshall et al. (1959) wasapplied to the information provided by the previous experiments. These authorsshowed that the growth rate in forming osteones was directly proportional to thecanal diameter and that a straight regression line could be plotted for appositionalgrowth rate against canal diameter. From the calculated slope of the regressionline a constant was derived (a regression coefficient, fi), which, when multiplied bythe canal diameter, gave the appositional growth rate for the corresponding canaldiameter. The values obtained in the present experiment were used to determinesuch a regression coefficient ft in the following way. The mean value for appositionalgrowth rate on two surfaces in a plane of measurement in each osteone was plottedagainst: the diameter of the outer marker, the mean diameter between the markersand the diameter of the inner marker in the corresponding plane of measurement.A direct relationship was obtained for each of the three series, but the best correlationwas found for the slope of the diameter of the outer marker and the correspondingmean appositional growth rate (Text-fig. 3).The graph illustrates several features of appositional growth in osteones. Maxi-
mum growth rate appeared to be limited to less than 20 It/day, so it appeared thatthere was an upper limit to osteoblastic function in this animal (dog G). This pointwas confirmed by re-examination of the sections, which showed that, above a certaincanal diameter, the distance between markers was of a constant maximum. In themain part of the graph the correlation was' good, but in the lower limits of growth(less than 0 5 u/day), which could not be accurately measured owing to indaequateseparation of the markers, there was a suggestion that the correlation did not hold
671

672 W. R. LEE
150I-0
E 125
0
0° 1000
0E 75
50
25
0
0
0 * E
0
Y = 76x+13
r=0-870
0
. * 0
. "'000, 0
0 5 1.0 1-5 2-0Appositional growth rate (u/tday)
Text-fig. 3. A graph to show the linear relationship between the appositional growthrate and the outer marker diameter in 100 osteones in the femoral compacta of dog G.
in this phase of the growth process, which declined at a slower rate than might beexpected. Nevertheless, it seemed reasonable to regard the correlation as sufficientfor a linear regression curve to be calculated (Goulden, 1960) according to theformula
D = mg+d,
when D is the diameter of the outer marker (iu), m is the slope of the line, g is theappositional growth rate on one surface (4/day), d is the intercept of the line on they-axis (mi), and r is the correlation coefficient for the slope m. The constant ,?(Marshall et al. 1959) is the reciprocal of m and can be used in the formula
g = /3(D-d)if it is required to calculate the appositional growth rate on one surface for anymarker diameter. Values for each of these indices have been calculated from thedata provided by the preliminary experiment (see Table 1) and are shown in Table 5.Values for m, d, ft and r are given in Table 5 and show that the repeatability wasgood and that similar values were obtained in five sections from the femoraldiaphysis. The value of d, of approximately 10 /z, corresponds to the radius of the

Appositional bone formation in canine bone 673vascular canal in fully formed osteones and the correlation coefficient, for eachregression line, was greater than 0 90.
Since the regression line indices were of a high order of agreement and this methodof handling the data appeared to provide a possible means of expressing appositionalgrowth rate, the technique was extended to the data provided by dogs N and P.For the purposes of comparison only the results obtained in the three long boneswill be given (see Table 6).
Table 5. Values obtained for the measurement of m, d, r, and f8 in five estimates onone section andfrom four other sections from the femoral diaphysis of dog G
m d (lz)Estimation
12345
Section1234
EL
fi
7682777676
148
101412
0.0180-0120.0130.0130.013
76 13 0-01380 8 0-01374 10 0-01471 20 0-014
m = the slope of the regression line.d = the intercept of the slope on the y-axis (,u).r = the correlation coefficient./? = the regression coefficient.
7
0900940-920-92093
0-920-920-910-95
Table 6. Values of m, fi, d and r obtained in three long bones of dogs N and P
Mean outer Appositional Slope of Reciprocal Intercept Correlationmarker growth rate regression of of slope coefficientdiameter (it/day) line regression d rD(#) m line
fi
Proximalfemoral shaft
Mid-shaftfemur
Distalfemoral shaftHumerusRib
Dog N (1-2 years)105+50 1*6+0-8 65
90+40
95+50
1-2+0-6 65
0-015 -15 0-09
0-015 +15 0 94
1*3+0*7 78 0 014 -3 0-86
90+45 1-2+0 7 62 0-016 +5 0*84105+50 1-4+0-5 74 0-014 +2 0-75
Dog P (3 months)80+40 2*0+1-0 33
100+ 60
90+40
0 030 +13 0-91
1*9+0-9 57 0 018 +10 0-87
2 0+1-1 37 0-027 +15 0-90
110+60 2-2+1-0 54 0*019 -5 0-8480+50 1-5+0 9 51 0-020 -1.0 0-77
Proximalfemoral shaft
Mid-shaftfemur
Distalfemoral shaftHumerusRib
674 W. R. LEEThe values for m, fi, dand r obtained in the five different skeletal sites show slightly
more variation than those seen in dog G. The values in the old dog (N) are moreconsistent, those for , varying only slightly around a mean value of 0-015 andvalues for m were in the region of 70. The correlation was fairly good, four of thefive regression lines having a correlation coefficient greater than 0'80. In dog Pthe slope of the regression line was lower with a much wider range than in the olderanimal; the values for ft in the proximal and distal ends of the femur were 0 030and 0-027 respectively, about 50% higher than the remaining sites, in which therewas close agreement. The most tempting explanation for this discrepancy is thatprimary osteones (see above and PI. 1, fig. 4) were included in the measurementsand it is the growth properties of these anatomically and functionally different boneunits which was responsible for the difference. In spite of the discrepancy thecorrelation coefficients were greater than 0-80 for each bone.The point at which the regression line cuts the ordinate, d, is of interest,
because theoretically this should correspond to the osteone canal radius, which isusually accepted as about 10 Iz. Within the limits of experimental error and bio-logical variation the values for d are of this order.
Quantitative measurement of appositional growth in secondary osteones has beenexpressed as the osteone completion time in other published work. For comparisonthe results obtained in this investigation can be given as an approximate osteonecompletion time by assuming a cement line radius of about 80 ,u (from Cohen &Harris, 1958) and a vascular canal radius of 10 ,t. Taking the mean appositionalgrowth rate from the femoral diaphysis of each animal the mean osteone completiontimes in dogs G, N and P were 10, 8 and 5 weeks respectively.
DISCUSSION
The distribution of tetracycline markers in secondary osteones in canine compactahas demonstrated a pattern of growth which for the purpose of discussion can bedivided into at least two phases. In the initial phase, according to Ponlot (1960),there is a rapid formation of bone to smooth over the lacunae of the resorptioncavity and to convert eccentric cavities to a more concentric canal: measurementof the distance between the markers in osteones in this phase of growth suggeststhat there is an upper limit to the rate of appositional growth which is independentof the size of the vascular canal. In the second phase of osteone formation, apposi-tional growth rate appears to be directly related to the diameter of the osteonecanal, as originally observed by Vincent (1955) and later confirmed by Marshallet al. (1959). In the present investigation a good correlation was obtained betweenthe linear distance between the markers and the diameter of the markers, whichadds support to the previous work. This finding suggests that, in the second phase,bone formation is controlled either by the space available for cells on the canalsurface or by the decreasing flow of blood along the canal as the osteone forms; itis probable that both factors are of importance. In the final phase, when the canaldiameter approaches 20 gz, the growth rate could not be measured owing to inade-quate separation between the markers, so that the factors which are involved in thecessation of growth remain obscure. If the second phase is continuous to the end
Appositional bone formation in canine bone 675of osteone formation, then the rate of appositional growth, like so many otherbiological processes, decreases exponentially.
Since appositional growth in a population of osteones varies between a maximumand zero the main problem in quantitation is the mathematical expression of theprocess. If the measured distance between the markers in a sample of the populationof labelled osteones is used to provide a mean value for appositional growth rate,the value thus derived has no satisfactory parameter to ensure that the samplingis random. Nevertheless, this method exposes a difference between the threeanimals used in the present investigation, appositional growth in the puppy beingapproximately 2-0 ,/tday, approximately 1-5 fl/day in a 1- to 2-year-old dog andapproximately 1.0 fl/day in an old dog. The range appeared to be constant for eachanimal in the skeletal sites studied. Values for cement line diameter and osteone canaldiameter can be converted to the mean time required for osteone formation: thiswas found to be 5, 8 and 10 weeks respectively in the three animals, in agreementwith a value of 6 + 2 weeks for young dogs given by Marshall et al. (1959) and Vincent(1955) and 4 weeks for the puppy by Vanderhoeft et al. (1962).The calculation of a regression line for the growth rate against marker diameter,
as suggested by Marshall et al. (1959), seems a logical means of providing an indexof the growth process. The reciprocal of the slope of the regression line (f8) appearsto be a convenient index in an experimental system designed to test the effect ofvarious agents on osteoblastic activity. This method exposed the effect of age onappositional growth in the three animals: for the puppy, f8 was approximately0-020, for the 1- to 2-year-old dog 0-015, and for the old animal 0-013, these valuesbeing of the same order as the value of 0-015 obtained by Marshall et al. for a youngdog. While consistent values for , were obtained in the two older animals, thetechnique appeared less reliable in the analysis of appositional growth in the puppycompacta. The rapid remodelling in the compacta of the young animal has beenthe subject of recent reports by Vanderhoeft et al. (1962) and Marotti (1963), whohave used tetracycline in the study of the topographical distribution of new boneformation. By employing the quantitative microscopic techniques described byFrost (1961) these investigators have measured the total quantity of new bone in acomplete transverse section of the long bones. Both reports have illustrated therapid and intense remodelling which takes place in particular regions of the longbones, e.g. the linea aspera, where the distribution between primary periosteal,primary endosteal and secondary osteones is not always clear. Growth in theselarge and frequently irregular cavities appears to be unlike that seen in the moreorderly process of the adult animal. Vanderhoeft et al., who gave as many as sixsingle doses of tetracycline at 3-weekly intervals, were unable to agree entirely withthe observations of Marshall et al., because they could not see diminishing distancesbetween markers in all the labelled osteones. In addition these authors reportedthat the osteone formation time was more rapid in the proximal limb bones than inthe metatarsals, which were, unfortunately, not included in the present investigation.For these reasons the puppy does not appear to provide a suitable experimentalsystem for the study of the factors governing osteoblastic activity.The measurement of appositional growth rate in cancellous bone was unsatis-
factory, because the tetracycline markers on many growing surfaces were 'flared'
676 W. R. LEEand oblique to the cut surface. Measurement of the maximum distance betweenclear markers revealed that the rate of appositional growth on trabeculae had asimilar range to that seen in the early stage of osteone formation and was compar-able in the different skeletal sites in which it was measured. The investigation shedlittle light on the factors which control remodelling in spongy bone, where the newbone formation appeared to lack orientation.The precision and clarity of the tetracycline markers in compact bone holds
promise that the technique will be of great value in the quantitative and qualitativeinvestigation of bone formation in the human being and the experimental animal.Since each member of the tetracycline series has individual fluorescent properties,the individual bone markers can be identified (Harris et al. 1962; Undenfriend,1962). Stanisavljevic et al. (1962) have shown that the individual rat can be usedto provide a control and an experimental period by studying the distance betweenthe tetracycline markers in the diaphyseal periosteum: it is hoped that the tech-niques developed in the present investigation will permit similar experiments tobe performed in the study of appositional growth in secondary osteones.
SUMMARY
1. Two tetracycline markers have been used in the microscopic measurement ofthe linear growth rate on bone surfaces of compact and cancellous bone from theskeletons of three dogs. The tetracycline markers were seen as clear yellow fluor-escent lines in undecalcified sections of bone and the appositional growth rate wasmeasured with a calibrated eyepiece micrometer.
2. The results showed that the range of appositional growth rate in secondaryosteones and on the trabeculae of the spongiosa was wide but appeared to beconstant for a given animal: lower values were obtained in the older animals. Themean appositional growth rate in a puppy was about 20 ,u/day, in a 1- to 2-year-olddog 1-5 it/day, and in an old dog 1.0 fl/day.
3. The wide variation in appositional growth rate in a population of osteoneswas found to be the result of a decline in growth rate during the process of osteoneformation, and a mathematical analysis has shown a direct relationship betweenappositional growth rate and the diameter of the marker rings in the labelledosteone. For a population of osteones, a regression coefficient /? can be obtainedwhich should be of use in the investigation of the factors controlling osteoblasticfunction.
My thanks are due to Dr H. A. Sissons, at whose suggestion the work was carriedout, and for his advice and encouragement. I am grateful to Dr J. H. Marshall, whocollaborated in this and other experimental work and who provided some of theoriginal ideas upon which the work was based. Dr Ruth Porter (Lederle Ltd.) andDr A. M. Brunton (Pfizer Ltd.) gave generous supplies of the tetracyclines whichwere required for the investigation. Lederle Laboratories Ltd. also provided a granttowards the expenses incurred. I must also thank Mr Watson and the staff of theBruckston Browne Animal Farm for the care they gave to the dogs used for theexperimental work.

Journal of Anatomy, Vol. 98, Part 4
(Facing p. 677)
Plate I
W. R. LEE
Appositional bone formation in canine bone 677
REFERENCES
COHEN, J. & HARRIS, W. H. (1958). The three-dimensional anatomy of Haversian systems.J. Bone Jt Surg. 40A, 419-484.
FROST, H. M. (1960). Lamellar osteoid mineralised per day in man. Henry Ford Hosp. Bull.8, 267-272.
FROST, H. M. (1961). Measurement of the biological half-life of bones with the aid of tetracyclines.Henry Ford Hosp. Bull. 9, 87-96.
GHOSEZ, J. P. (1959). La microscopic de fluorescence dans l'6tude du remaniement haversien.Arch. Biol., Lisge, 70, 169-178.
GOuLWON, C. H. (1960). Methods of Statistical Analysis. New York and London: John Wiley andSons Inc.
HARRIS, W. H. (1960). A microscopic method of determining rates of bone growth. Nature, Lond.,188, 1038-1039.
HARRIS, W. H., JACKSON, R. H. & JOWSEY, J. (1962). In vivo distribution of tetracycline. J. BoneJt Surg. 44A, 1308-1320.
JOWSEY, J. (1955). The use of the milling machine for preparing bone sections for microradio-graphy and microautoradiography. J. sci. Instrum. 32, 159.
KUPER, S. W. A. & MAY, J. R. (1960). The detection of acid-fast organisms in tissue sections byfluorescence microscopy. J. Path. Bact. 79, 59-68.
MAROTTI, G. (1963). Quantitative studies of bone reconstruction. Acta anat. 52, 291-333.MCMANUS, J. F. S. (1946). Histological demonstration of mucin after periodic acid. Nature, Lond.,
158, 202.MARSHALL, J. H., JOWSEY, J. & RowLAND, R. E. (1959). Microscopic metabolism of calcium in
bone. IV. Ca45 deposition and growth rate in canine osteones. Radiat. Res. 10, 243-257.MILCH, R. A., RALL, D. P. & TOBIE, J. E. (1957). Bone localisation of the tetracyclines. J. nat.
Cancer Inst. 19, 87-93.PONLOT, R. (1960). Le Radiocalcium dans l'1Atude des Os. Brussels: Arscia.STANISAVLJEVIC, S., ROTH, H., VILLANEUVA, A. R. & FROST, H. M. (1962). Effect of adrenal
corticoids on lamellar bone formation in the rat diaphysis. Henry Ford Hosp. Bull. 10, 179-184.UNDENFRIEND, S. (1962). Fluorescence Assay in Biology and Medicine. New York: Academic
Press.VANDERHOEFT, P. J., KELLY, P. J. & PETERSEN, L. F. A. (1962). Determination of growth rates
in canine bone by means of tetracycline-labelled patterns. Lab. Invest. 11, 714-726.VINCENT, J. (1955). Recherches sur la Constitution de l'Os Adult. Brussels: Arscia.VINCENT, J. & NGUETrE, M. (1957). Les remaniements de l'os compact marqu6 a l'aide de plomb.
Rev. beige Path. 26, 161-168.
EXPLANATION OF PLATE
Fig. 1. Growing osteones which contain fluorescent chlortetracycline markers in the femoralcompacta of dog G (u.v. light x 70). Note the greater distance between the markers in the osteonesin the early stages of growth.Fig. 2. Cancellous bone containing two fluorescent demethylehlortetracycline markers in the iliaccrest of dog N (u.v. light x 40). Note that in only a few trabeculae are the markers clear enoughfor accurate measurement.
Fig. 3. Femoral diaphyseal compacta of dog P containing two demethylchlortetracycline markers(u.v. light x 35).Fig. 4. Part of a transverse section of the proximal femoral shaft of dog P (u.v. light x 100).Note the problem of distinction between primary and secondary osteones.