applying matsy to predict new optimisation strategies · pdf filefragment index collate index...
TRANSCRIPT

© 2015 Optibrium Ltd.Optibrium™, StarDrop™, and Nova™ are trademarks of Optibrium Ltd. Matsy™ is a trademark of NextMove Software Ltd.
Applying Matsy to predict new optimisation strategies
14th April 2015

© 2015 Optibrium Ltd.
Todays speakers
• Noel O’Boyle – NextMove Software Limited– Senior Software Engineer
– PhD in Computation Chemistry
– Postdoctoral positions at Cambridge University, CCDC and University College Cork
• Ed Champness – Optibrium Limited– Chief Scientific Officer
– Formerly GlaxoWellcome, Camitro and BioFocus
– Co-founded Optibrium
2

Beyond matched pairsApplying Matsy to predict new
optimisation strategies…
Noel O’BoyleNextMove Software
Optibrium WebinarCambridge, Apr 2015
Using Matched Molecular Series as a Predictive Tool To Optimize Biological Activity J. Med. Chem. 2014, 57, 2704.

How to choose what compound to make next?
• Based on experience on related projects
– What worked last time?
• By observing an activity trend, inferring a SAR relationship, and extrapolating
– Aka ‘chemical intuition’
• Our suggestion:
– Take advantage of the wealth of experience and trends contained in 60K med chem papers
– ‘evidence-based medicinal chemistry’

Matched pairs & series

Matched (Molecular) Pairs
[Cl, F]1.6
3.5
Coined by Kenny and Sadowski in 2005*Easier to predict differences in the values of a property than it is to predict the value itself
* Chemoinformatics in drug discovery, Wiley, 271–285.
Matched Pair usage
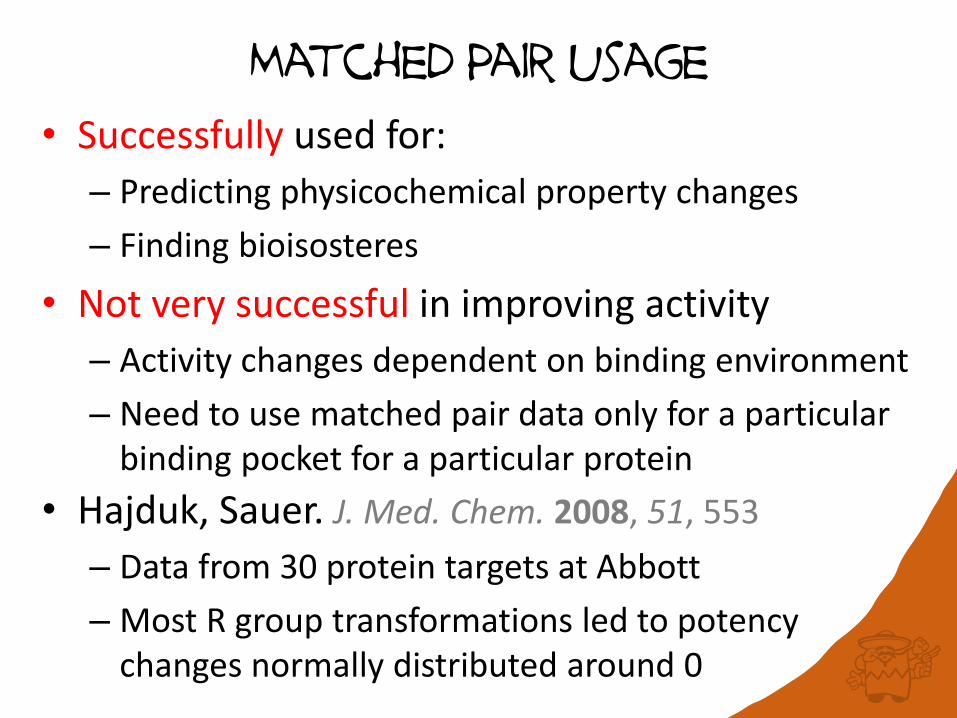
• Successfully used for:
– Predicting physicochemical property changes
– Finding bioisosteres
• Not very successful in improving activity
– Activity changes dependent on binding environment
– Need to use matched pair data only for a particular binding pocket for a particular protein
• Hajduk, Sauer. J. Med. Chem. 2008, 51, 553
– Data from 30 protein targets at Abbott
– Most R group transformations led to potency changes normally distributed around 0

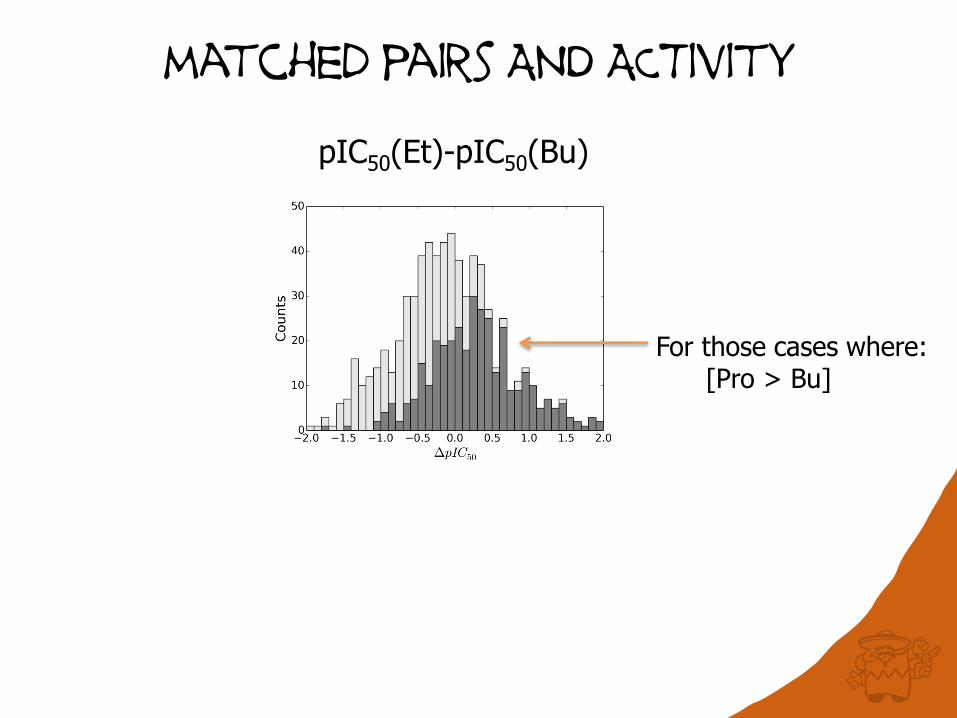
pIC50(Et)-pIC50(Bu)
matched pairs AND ACTivity
matched pairs AND ACTivity
pIC50(Et)-pIC50(Bu)
For those cases where:[Pro > Bu]

matched pairs AND ACTivity
pIC50(Et)-pIC50(Bu)
For those cases where:[Pro < Bu]

Matched Series of length 2= Matched Pair
[Cl, F]
“Matching molecular series” introduced by Wawer and Bajorath, J. Med. Chem. 2011, 54, 2944

Matched Series of length 3
[Cl, F, NH2]

Ordered Matched Series of length 3
3.5
2.1
1.6
pIC50
[Cl > F > NH2]
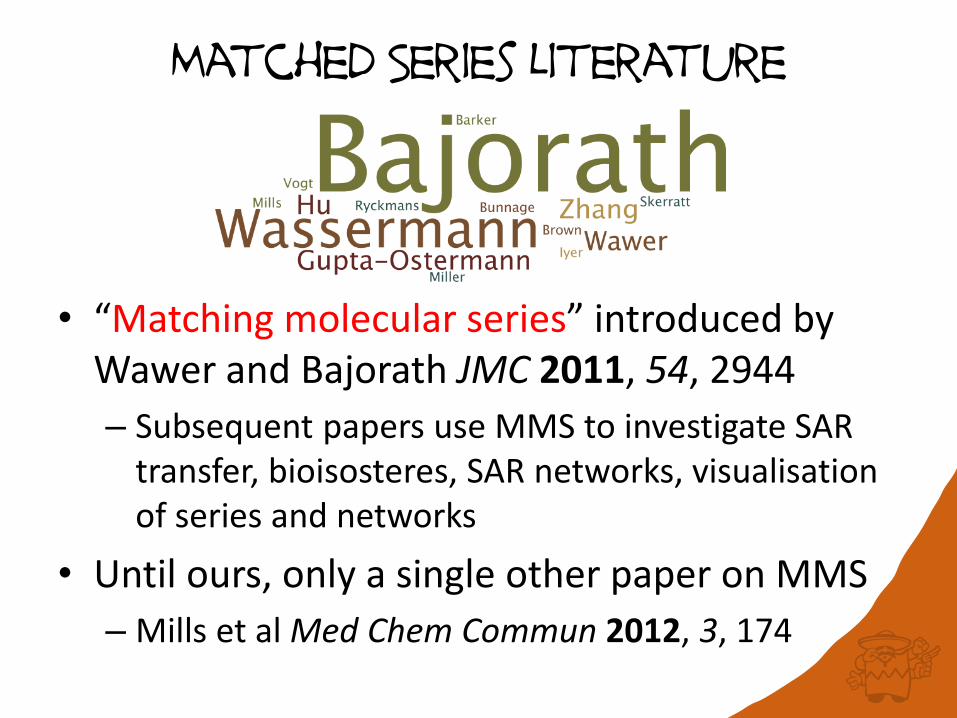
Matched Series Literature
• “Matching molecular series” introduced by Wawer and Bajorath JMC 2011, 54, 2944
– Subsequent papers use MMS to investigate SAR transfer, bioisosteres, SAR networks, visualisation of series and networks
• Until ours, only a single other paper on MMS
– Mills et al Med Chem Commun 2012, 3, 174

+
+
+
Algorithm to find matched Series
Fragment
Index
Collate
Index(Scaffold)
Matched Series
• Hussain and Rea JCIM 2010, 50, 339
– Fragment molecules at acyclic single bonds
• Single-cut only, scaffold >= 5, R group <= 12, preserve stereochemistry at break point
– Index each fragment based on the other
• A matched series will be indexed together
Matched Series

ChEMBL Bioactivity database
• ChEMBL 20 – Feb 2014
– 60k papers
• 94% from Bioorg. Med. Chem. Lett., J. Med. Chem., J. Nat. Prod., Bioorg. Med. Chem., Eur. J. Med. Chem., Antimicrob. Agents Chemother., Med. Chem. Res.
– PK data from AstraZeneca, NTD screening data from Novartis, GSK, and others
– 1.7 million compounds with 13.5 million activities
– 1.1 million assays against 11k targets
Gaulton et al. Nucleic Acids Res. 2012, 40, D1100

Length 2: 242,103 234,512Length 3: 60,182 58,410Length 4: 28,049 27,180Length 5: 15,991 15,510Length 6: 10,669 10,346
ChEMBL19ChEMBL20

SAR Transfer

CHEMBL768956COX-2 inhibition
CHEMBL772766COX-1 inhibition
R Group CHEMBL768956 (pIC50) CHEMBL772766 (pIC50)
SMe ?? 5.92
NH2 ?? 5.88
OMe 6.68 5.59
Me 6.10 4.82
Cl 5.92 4.75
F 5.82 4.59
Et 5.81 4.54
CF3 5.70 <4.00
H 5.62 4.26
COOH 4.23 <3.60
0.93 rank order correlation
Potential SAR transfer
Rank order

Strengths and weaknesses
• High confidence in predictions if sufficiently long series with correlated activities (or their rank order)
– Not always able to find such a series
– For short series will typically find 10s/100s/1000s of matching series with low confidence
• Suited to pairwise comparison within focused dataset
– Dense SAR matrix from target with well-explored SAR

Preferred ORDERS in Matched series

Preferred orders: Halides (N=2)
For an ordered matched series (i.e. A>B>C>…), there are N! ways of arranging the R Groups:
Would expect 9098 for each assuming the order is random
– We can calculate enrichment
Series Observations*
F > H 9639
H > F 8558
*Dataset is ChEMBL20 IC50 data for binding assays (transformed to pIC50 values)

Preferred orders: Halides (N=2)
For an ordered matched series (i.e. A>B>C>…), there are N! ways of arranging the R Groups:
Would expect 9098 for each assuming the order is random
– We can calculate enrichment
Series Enrichment Observations
F > H 1.06* 9639
H > F 0.94* 8558
*Significant at 0.05 level according to binomial test after correcting for multiple testing (Bonferroni with N-1)

Preferred orders: Halides (N=3)
Series Enrichment Observations
Cl > F > H 1.90* 1455
H > F > Cl 1.06 811
F > Cl > H 0.89* 685
Cl > H > F 0.77* 587
F > H > Cl 0.76* 582
H > Cl > F 0.63* 480

Preferred orders: Halides (N=4)Series Enrichment Observations
Br > Cl > F > H 5.36* 256
Cl > Br > F > H 3.14* 150
H > F > Cl > Br 1.53* 73
Br > Cl > H > F 1.40 67
F > Cl > Br > H 1.36 65
Cl > F > Br > H 0.96 46
… … …
H > F > Br > Cl 0.77 37
… … …
H > Br > F > Cl 0.48* 23
Cl > H > F > Br 0.48* 23
Cl > F > H > Br 0.48* 23
H > Cl > F > Br 0.42* 20
Br > F > H > Cl 0.40* 19
F > H > Br > Cl 0.40* 19
H > Cl > Br > F 0.38* 18
F > Br > H > Cl 0.36* 17
Br > H > F > Cl 0.17* 8
N=2: Max = 1.06, Min = 0.94N=3: Max = 1.90, Min = 0.63N=4: Max = 5.36, Min = 0.17
Longer series exhibit greater preferences
If [H>F>Cl] is observed, will Br increase activity further?141 observations of [H>F>Cl]but only 8 where [Br>H>F>Cl]

Matsy:Prediction using Matched Series

Find R Groups that increase activity
A > B
Query A > B > CC > A > BD > A > B > CD > A > C > BE > D > A > B…
R Group Observations
Obs that
increase
activity
% that
increase
activity
D 3 3 100
E 1 1 100
C 4 1 25
… … …
In-house

Example

Example II
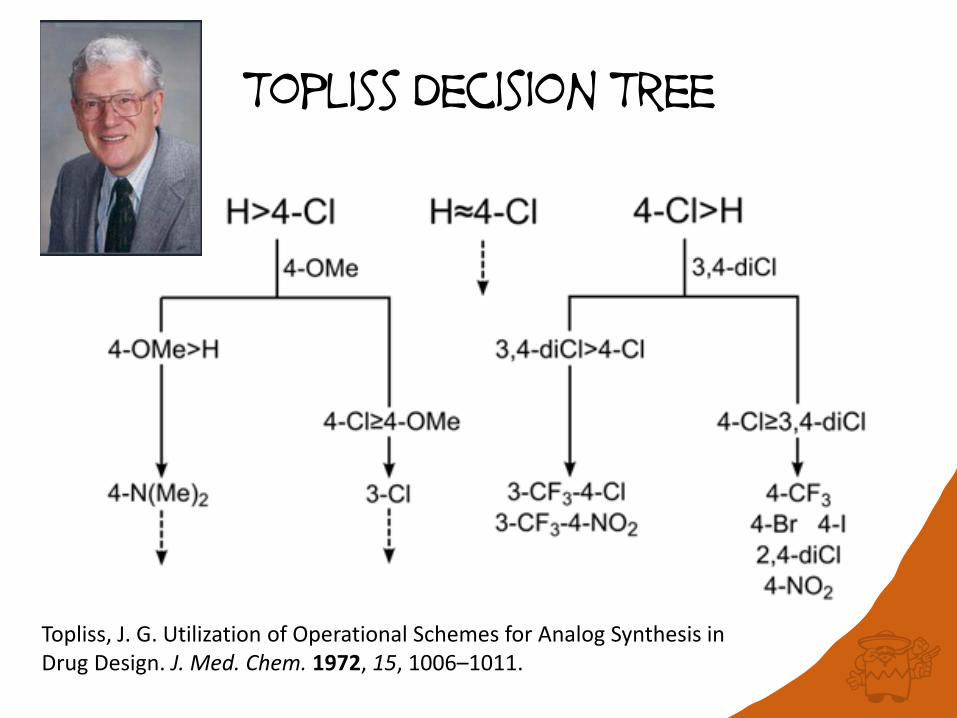
Topliss Decision Tree
Topliss, J. G. Utilization of Operational Schemes for Analog Synthesis in Drug Design. J. Med. Chem. 1972, 15, 1006–1011.

Topliss Decision Tree

Topliss Decision Tree
(9th)

Topliss Decision Tree

Topliss Decision Tree
(1st if lower cutoff)

Topliss Decision Tree

Topliss Decision Tree
(17th)

Matsy Decision Tree (One of Many)

4-Cl > H
KinasesTarget-specific
ΔLiPE > 0Incorporate metrics
Modifying the predictions for

In summary
• Longer matched series (N>2) show an increased preference for particular activity orders
• This can be exploited to predict R groups that will increase activity
– Predictions are typically based on data from a range of targets and structures
• Completely knowledge-based
– Can link predictions to particular targets/structures
– Predictions refined based on new results

How to choose what compound to make next?
• Based on experience on related projects
– What worked last time?
• By observing an activity trend, inferring a SAR relationship, and extrapolating
– Aka ‘chemical intuition’
• Our suggestion:
– Take advantage of the wealth of experience and trends contained in 60K med chem papers
– ‘evidence-based medicinal chemistry’

Beyond Matched PairsApplying Matsy to predict new optimisation
strategies
Using Matched Molecular Series as a Predictive Tool To Optimize Biological
ActivityJ. Med. Chem. 2014, 57, 2704.
AcknowledgementsRoger SayleJonas Boström, AstraZeneca
StarDrop IntegrationJames ChisholmSam Dowling

Demonstration

© 2015 Optibrium Ltd.
StarDropMatched Series Analysis
• Developed in collaboration with NextMove Software
• Identifies chemical substitutions that are most likely to improve target activity
• Goes ‘beyond’ matched pair analysis
– Uses data from longer matched series to make more relevant predictions for your chemical series
• Two methods implemented within StarDrop’s Nova Module
– Matsy™
– SAR transfer
• Based on ChEMBL activity database
– Can be extended with matched series from your in-house database (provided as a service by NextMove)
43

© 2015 Optibrium Ltd.
For more information…
• Noel O’Boyle– [email protected]
– www.nextmovesoftware.com
• Nick Foster– [email protected]
– www.optibrium.com/stardrop
• A recording of the webinar will be made available as soon as possible on the Optibrium Community website at:– www.optibrium.com/community
Thank you for joining us today for our webinar!
44