applying macro-prudential instruments cross country...
TRANSCRIPT

Srobona MitraSenior Economist, MCM
2016 FED-IMF-WB Seminar for Senior Bank Supervisors from Emerging Economies
Washington, DC – October 19, 2016
Applying Macro-Prudential Instruments—Cross Country Experiences

Roadmap
Use of MAP Tools
Evidence from Cross-Country Studies
Evidence from Six Case Studies
Evidence from Loan-by-Loan (Micro) Supervisory Data
2

Use of MAP Tools
3
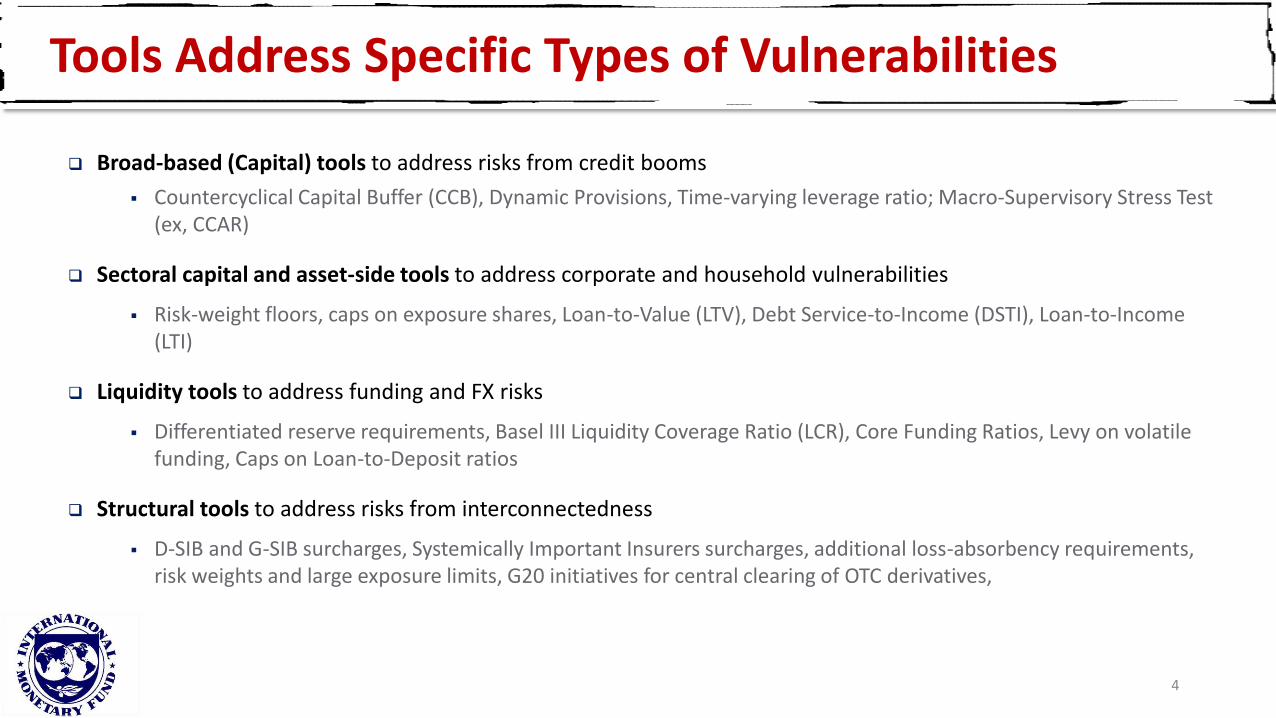
Tools Address Specific Types of Vulnerabilities
Broad-based (Capital) tools to address risks from credit booms
Countercyclical Capital Buffer (CCB), Dynamic Provisions, Time-varying leverage ratio; Macro-Supervisory Stress Test (ex, CCAR)
Sectoral capital and asset-side tools to address corporate and household vulnerabilities
Risk-weight floors, caps on exposure shares, Loan-to-Value (LTV), Debt Service-to-Income (DSTI), Loan-to-Income (LTI)
Liquidity tools to address funding and FX risks
Differentiated reserve requirements, Basel III Liquidity Coverage Ratio (LCR), Core Funding Ratios, Levy on volatile funding, Caps on Loan-to-Deposit ratios
Structural tools to address risks from interconnectedness
D-SIB and G-SIB surcharges, Systemically Important Insurers surcharges, additional loss-absorbency requirements, risk weights and large exposure limits, G20 initiatives for central clearing of OTC derivatives,
4
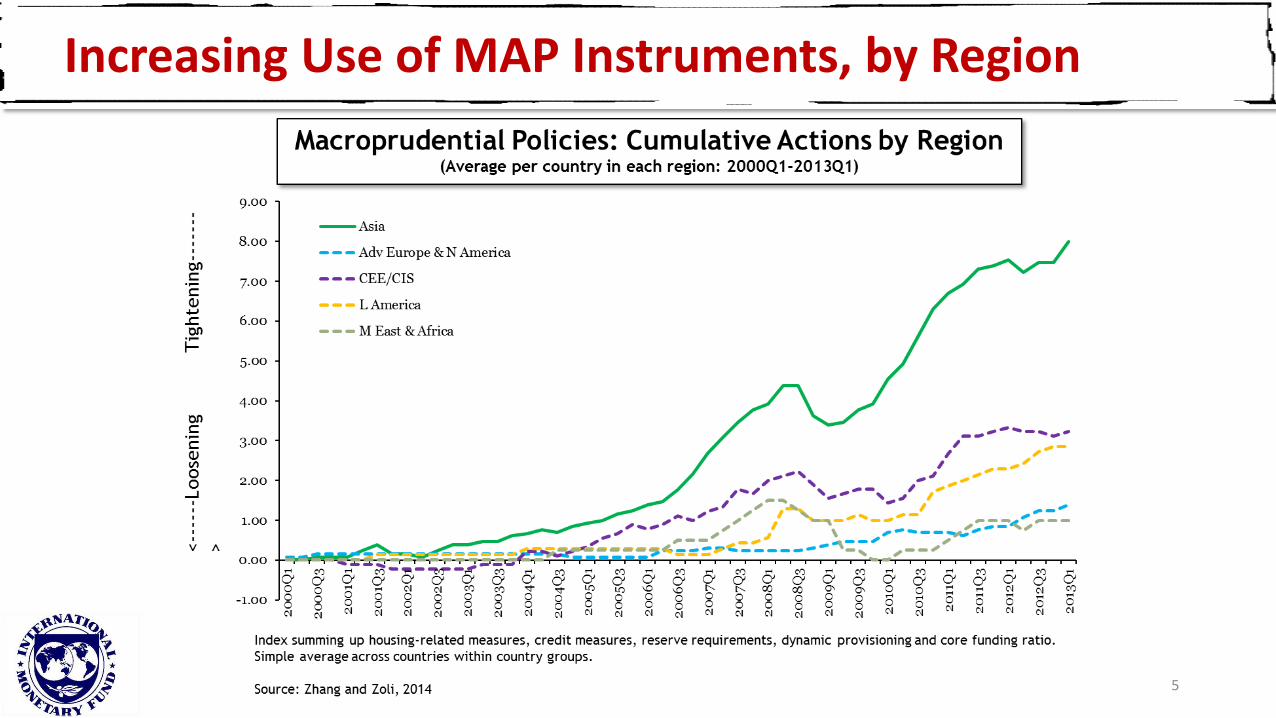
Increasing Use of MAP Instruments, by Region
5

Increasing Use of MAP Instruments, by Type
0
10
20
30
40
50
60
1/1/
1990
7/1/
1991
1/1/
1993
7/1/
1994
1/1/
1996
7/1/
1997
1/1/
1999
7/1/
2000
1/1/
2002
7/1/
2003
1/1/
2005
7/1/
2006
1/1/
2008
7/1/
2009
1/1/
2011
7/1/
2012
1/1/
2014
7/1/
2015
Advanced Economies
0
10
20
30
40
50
60
1/1/
1990
7/1/
1991
1/1/
1993
7/1/
1994
1/1/
1996
7/1/
1997
1/1/
1999
7/1/
2000
1/1/
2002
7/1/
2003
1/1/
2005
7/1/
2006
1/1/
2008
7/1/
2009
1/1/
2011
7/1/
2012
1/1/
2014
7/1/
2015
All Other Economies
-40
-20
0
20
40
60
80
100
120
140
1/1/
1990
7/1/
1990
1/1/
1991
7/1/
1991
1/1/
1992
7/1/
1992
1/1/
1993
7/1/
1993
1/1/
1994
7/1/
1994
1/1/
1995
7/1/
1995
1/1/
1996
7/1/
1996
1/1/
1997
7/1/
1997
1/1/
1998
7/1/
1998
1/1/
1999
7/1/
1999
1/1/
2000
7/1/
2000
1/1/
2001
7/1/
2001
1/1/
2002
7/1/
2002
1/1/
2003
7/1/
2003
1/1/
2004
7/1/
2004
1/1/
2005
7/1/
2005
1/1/
2006
7/1/
2006
1/1/
2007
7/1/
2007
1/1/
2008
7/1/
2008
1/1/
2009
7/1/
2009
1/1/
2010
7/1/
2010
1/1/
2011
7/1/
2011
1/1/
2012
7/1/
2012
1/1/
2013
7/1/
2013
1/1/
2014
7/1/
2014
1/1/
2015
7/1/
2015
1/1/
2016
7/1/
2016
World
LTV, DSTI, Loan Restrictions
Sector Specific Capital Buffer/ Risk Weights
General Capital Requirements, Countercyclical Capital Buffer, Dynamic Loan-Loss Provisioning
Liquidity Requirements, Limits on FX Positions
Sources: 2011 IMF Survey, BIS database (Shim et al., 2013, “Database for policy actions on housing markets”), ESRB database, central bank, BCBS and FSB websites, IMF papers, Article IVs, FSAPs and
survey with IMF desk economists. The database covers 64 countries, of which 32 are advanced economies according to IMF (World Economic Outlook) classification.
Cumulative Usage of Macroprudential Tools
6

7
LTV Usage as Countercyclical Tool
8
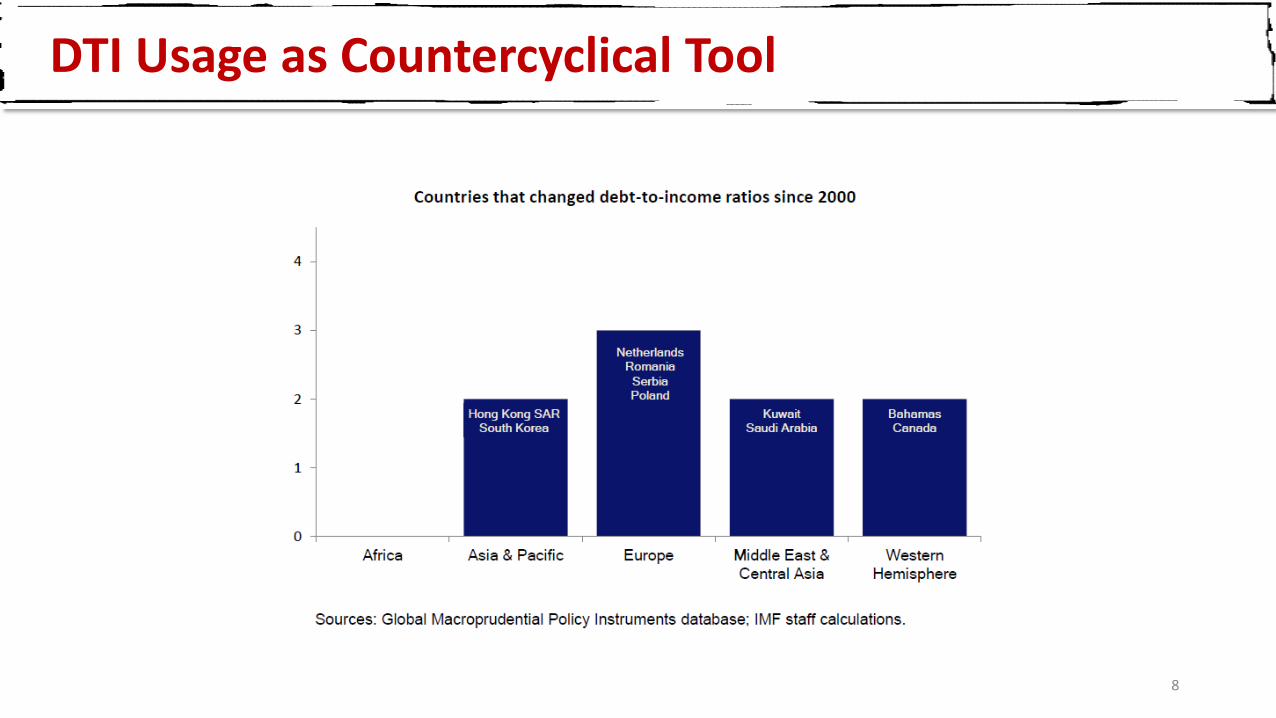
DTI Usage as Countercyclical Tool

9
Range of LTV Across Countries

10
Range of DSTI Across Countries
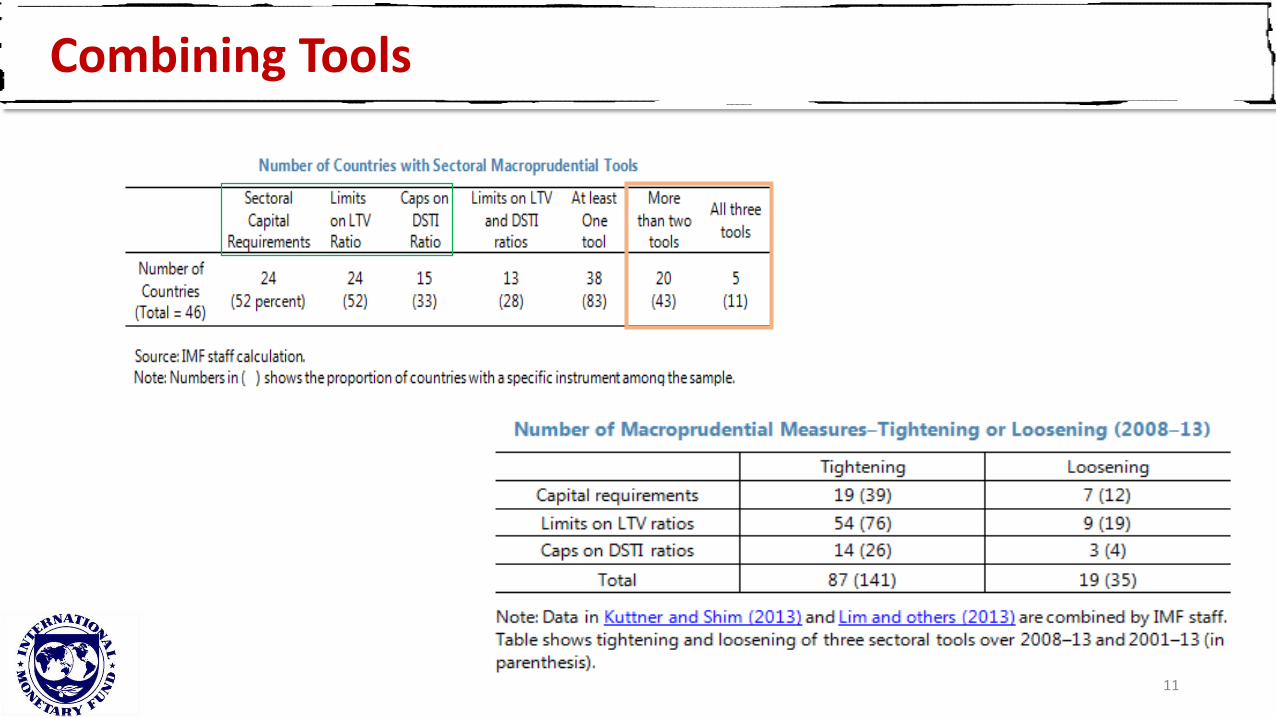
Combining Tools
11

Effectiveness: Evidence from Cross-Country Studies
12
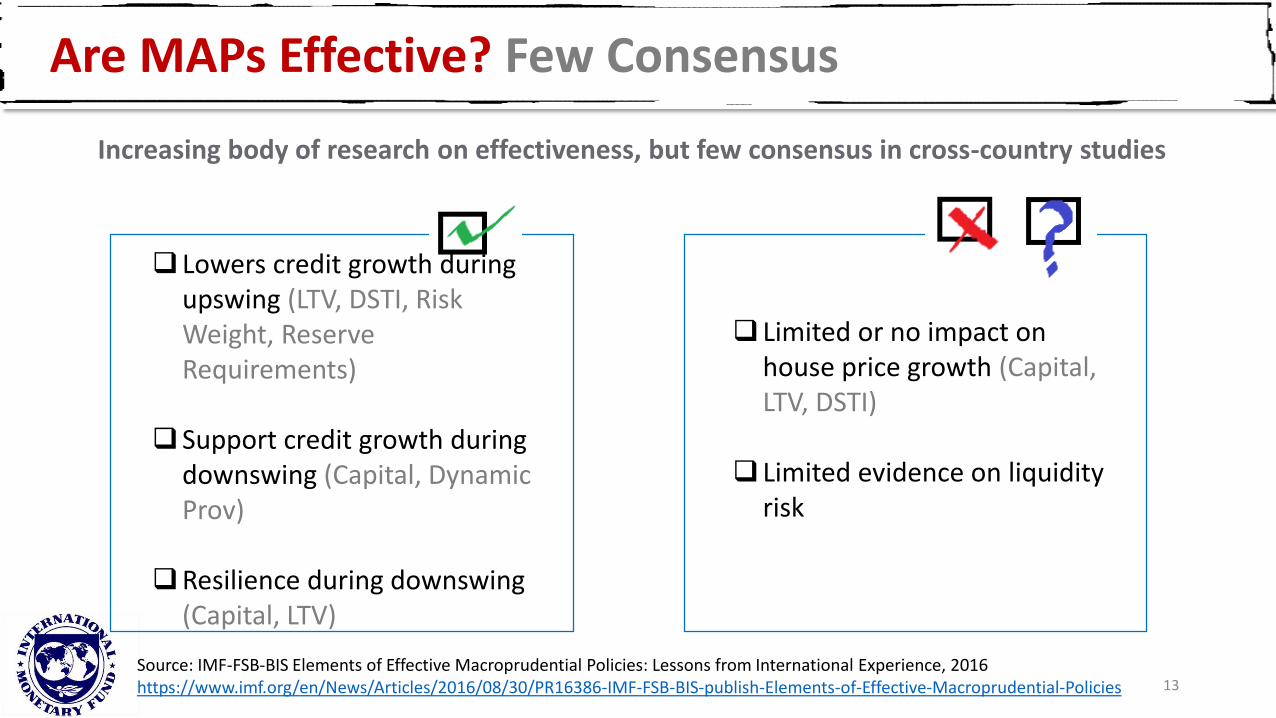
Are MAPs Effective? Few Consensus
Increasing body of research on effectiveness, but few consensus in cross-country studies
Source: IMF-FSB-BIS Elements of Effective Macroprudential Policies: Lessons from International Experience, 2016https://www.imf.org/en/News/Articles/2016/08/30/PR16386-IMF-FSB-BIS-publish-Elements-of-Effective-Macroprudential-Policies
Lowers credit growth during upswing (LTV, DSTI, Risk Weight, Reserve Requirements)
Support credit growth during downswing (Capital, Dynamic Prov)
Resilience during downswing (Capital, LTV)
Limited or no impact on house price growth (Capital, LTV, DSTI)
Limited evidence on liquidity risk
13

Impact on House Price Levels in CESE, by Instrument
Source: Vandenbussche et al, 2015, Macroprudential Policies and Housing Prices: A New Database and Empirical Evidence for Central, Eastern, and Southeastern Europe, JMCB 47(1) http://onlinelibrary.wiley.com/doi/10.1111/jmcb.12206/epdf 14
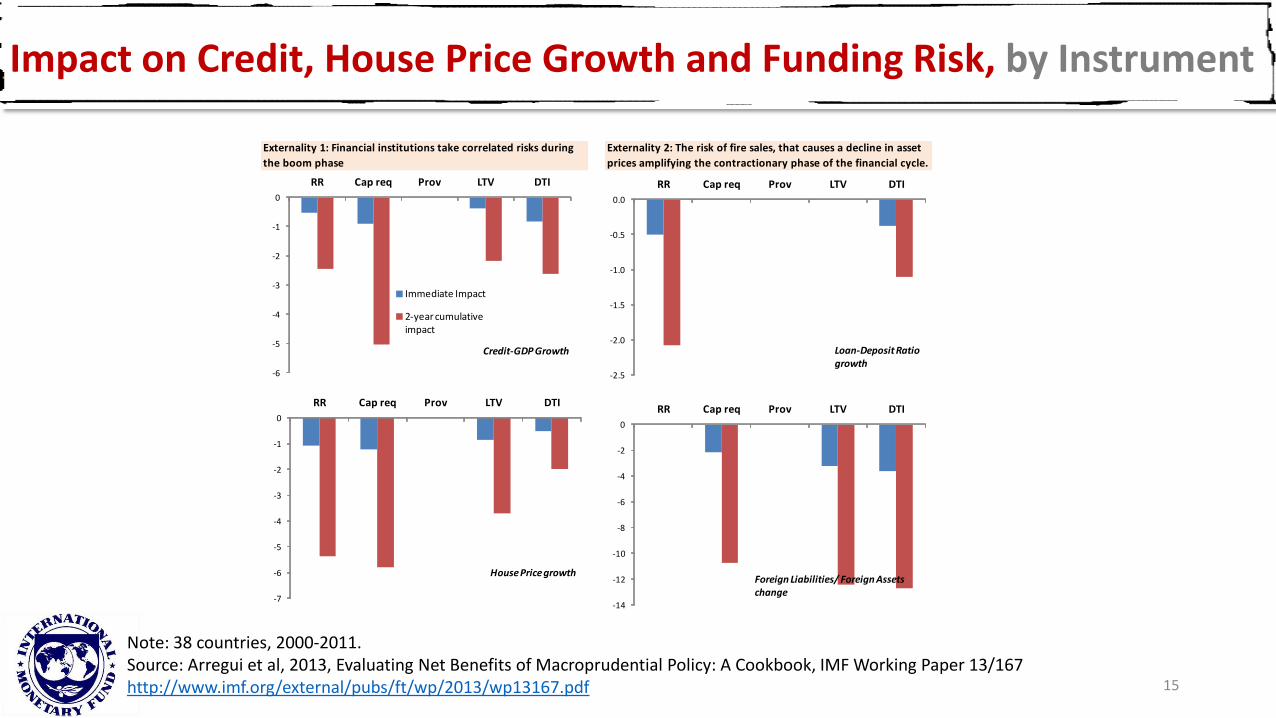
Impact on Credit, House Price Growth and Funding Risk, by Instrument
Note: 38 countries, 2000-2011.Source: Arregui et al, 2013, Evaluating Net Benefits of Macroprudential Policy: A Cookbook, IMF Working Paper 13/167http://www.imf.org/external/pubs/ft/wp/2013/wp13167.pdf
Externality 1: Financial institutions take correlated risks during
the boom phase
Externality 2: The risk of fire sales, that causes a decline in asset
prices amplifying the contractionary phase of the financial cycle.
-6
-5
-4
-3
-2
-1
0
RR Cap req Prov LTV DTI
Immediate Impact
2-year cumulative impact
Credit-GDP Growth
-2.5
-2.0
-1.5
-1.0
-0.5
0.0
RR Cap req Prov LTV DTI
Loan-Deposit Ratio growth
-7
-6
-5
-4
-3
-2
-1
0
RR Cap req Prov LTV DTI
House Price growth
-14
-12
-10
-8
-6
-4
-2
0
RR Cap req Prov LTV DTI
Foreign Liabilities/ Foreign Assets change
15
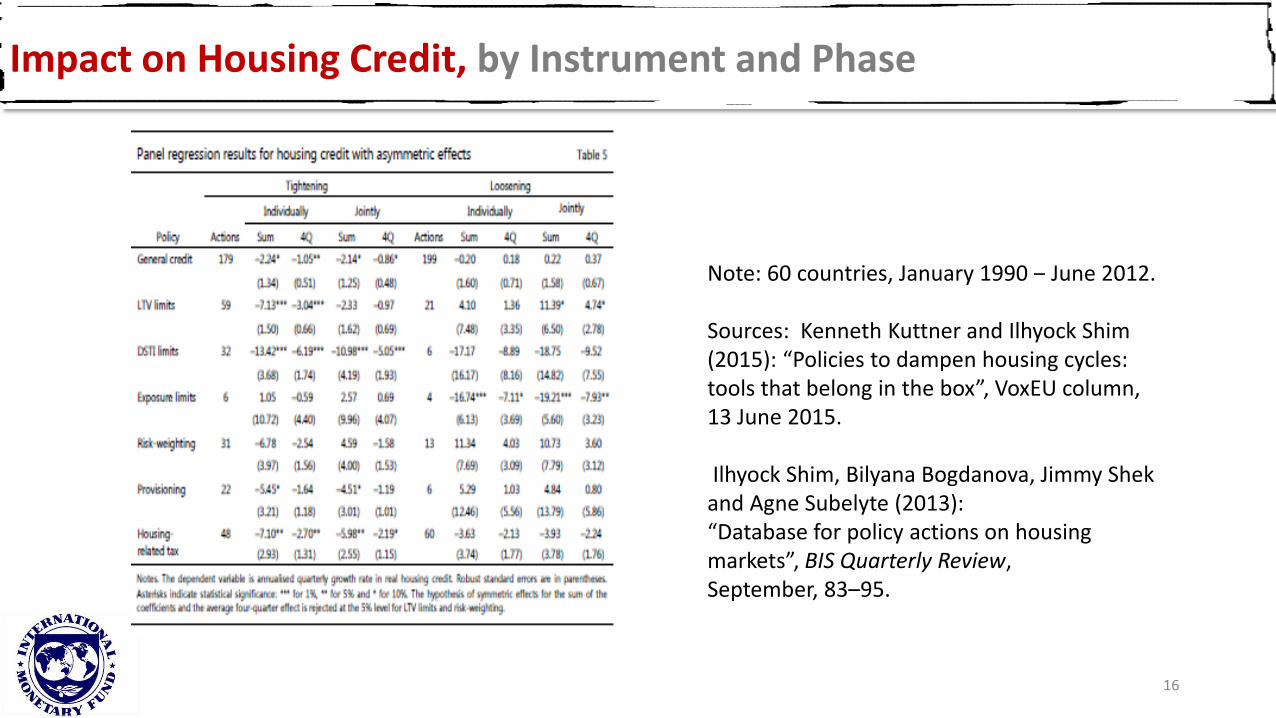
Impact on Housing Credit, by Instrument and Phase
Note: 60 countries, January 1990 ‒ June 2012.
Sources: Kenneth Kuttner and Ilhyock Shim (2015): “Policies to dampen housing cycles:tools that belong in the box”, VoxEU column, 13 June 2015.
Ilhyock Shim, Bilyana Bogdanova, Jimmy Shekand Agne Subelyte (2013):“Database for policy actions on housing markets”, BIS Quarterly Review,September, 83–95.
16

Effectiveness: Evidence from 6 Country CasesLTV and DTI Limits: Going Granular
17

Summary of 6 Case Studies, Time-Series Evidence
Source: Jacome and Mitra, 2015, LTV and DTI Limits: Going Granular, IMF Working Paper 15/154, https://www.imf.org/external/pubs/ft/wp/2015/wp15154.pdf
Asia Europe Latin America
Advanced Hong Kong SAR
Korea
EmergingMalaysia Poland
RomaniaBrazil
18
• Worked with six central banks
• Country experiences with limits on LTV and DTI Monitoring &
Triggers How Much to
Tighten? Enforcement Effectiveness
Monitoring & Triggers
Countries use granular data Property sector, banks, nonbanks, households, speculative activities and more
Vintages of NPLs: by LTV, loan tenor, income levels
They combine micro information with macro data to create indicators to monitor systemic risks
With a strong eye on whether there could be debt-servicing difficulties in the future
Mortgage loan growth + longer loan tenors + high LTVs, or with rising number of multiple mortgage loans, send out an alert
19

How Much to Tighten?
20
No magic number, microdata helps
LTVs: 60–85%, DTIs: 30–50%
Varies by type of loan (FX, overseas income, maturity, speculative prone area)
Changes (mostly discretionary, chasing leakages)
Numerator of LTV changes (some countries add other debts)
Numerator of DTI changes (debt service on mortgage loans vs. debt service on all loans)
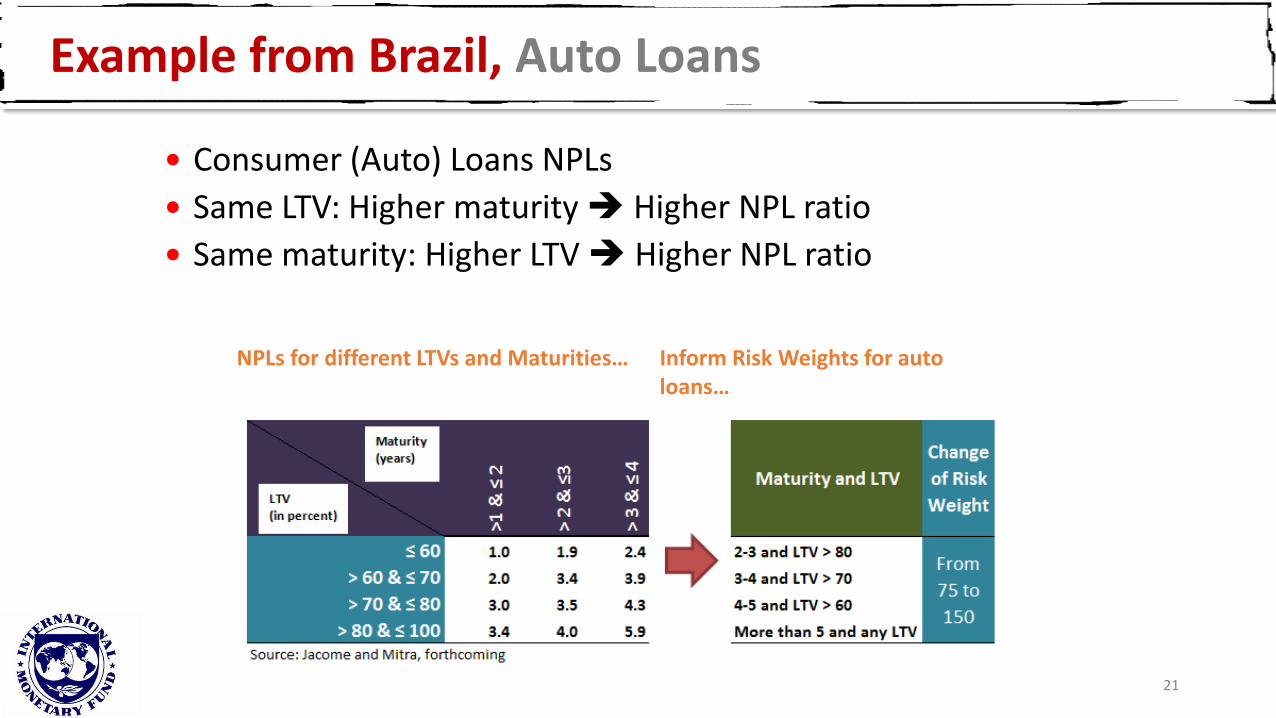
Example from Brazil, Auto Loans
21
Consumer (Auto) Loans NPLs
Same LTV: Higher maturity Higher NPL ratio
Same maturity: Higher LTV Higher NPL ratio
NPLs for different LTVs and Maturities… Inform Risk Weights for auto loans…

Example from Romania, NPLs, Income, LTVs
22

Enforcement Difficult, Immediate Application Helps
23
Coped with diverse sources of leakages Non-regulated entities (bring to regulation, cooperation)
Modifying loans to meet standards (ensure DTI entire life)
Cross-border mortgage lending (supranational authorities)
Foreign bank branches (become subsidiaries in both countries)
Other policies to deal with leakages Applied right after the announcement
Complement with other policies

Effectiveness: Mixed Results
24
Effective in reducing loan-growth and improving debt-servicing performances
Not effective in curbing house price growth
When countries faced strong capital flows into banks
Or high demand for houses from cross-border sources
Better results when measures were targeted (speculative properties)
To analyze effectiveness need to use rich micro data

Panel Evidence: Small, Limited Impact
25
• Effect of 10pp Lower LTV Limit on Mortgage Credit Level (percent) 𝛥𝐶𝑖𝑡 = 𝛼0 + 𝛼𝑖 +
𝑠=1
30
𝛽𝑖𝛥𝐿𝑇𝑉𝑖𝑡−𝑠 +
𝑖=1
24
𝜌𝑖𝛥𝐶𝑖𝑡−𝑖 + 𝑒𝑖𝑡
• 5 economies
• Reduced form; lags take into account other policy actions and persistent impacts
• 10pp lower LTV limit leads to maximum cumulative impact of lowering credit growth by 0.7percent
• No impact on house prices
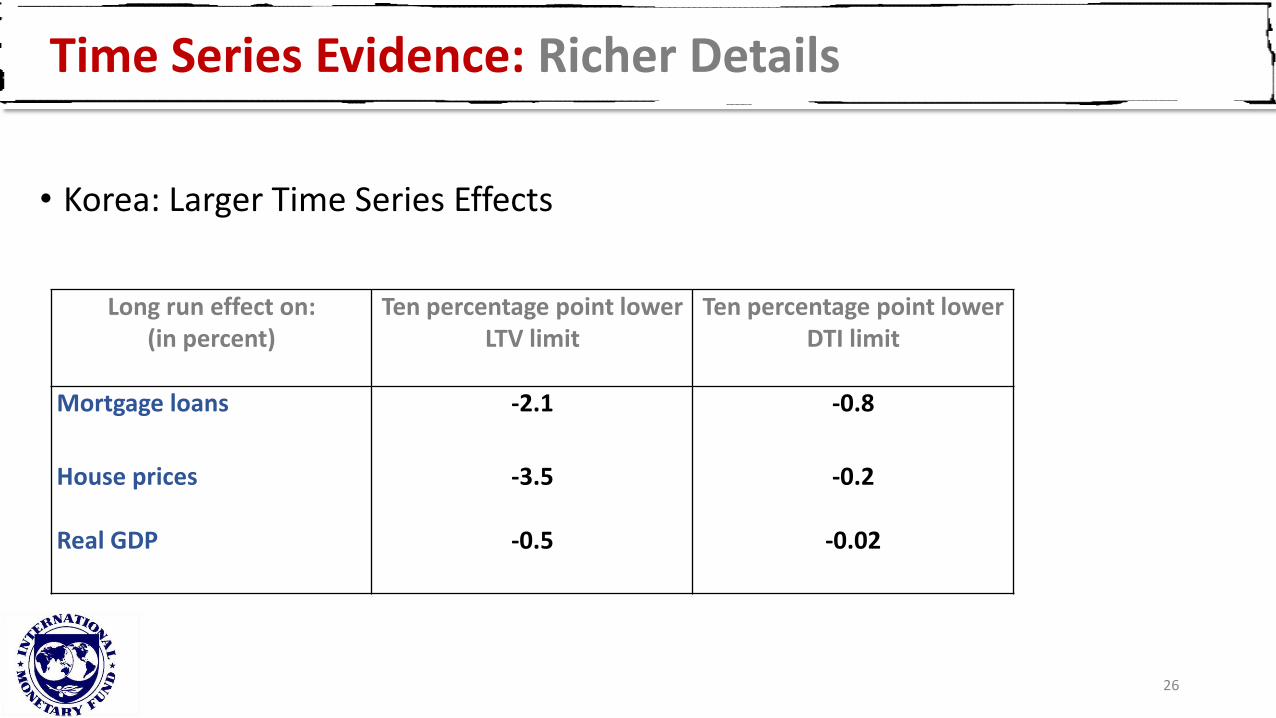
Time Series Evidence: Richer Details
26
• Korea: Larger Time Series Effects
Long run effect on:(in percent)
Ten percentage point lower LTV limit
Ten percentage point lower DTI limit
Mortgage loans -2.1 -0.8
House prices
Real GDP
-3.5
-0.5
-0.2
-0.02
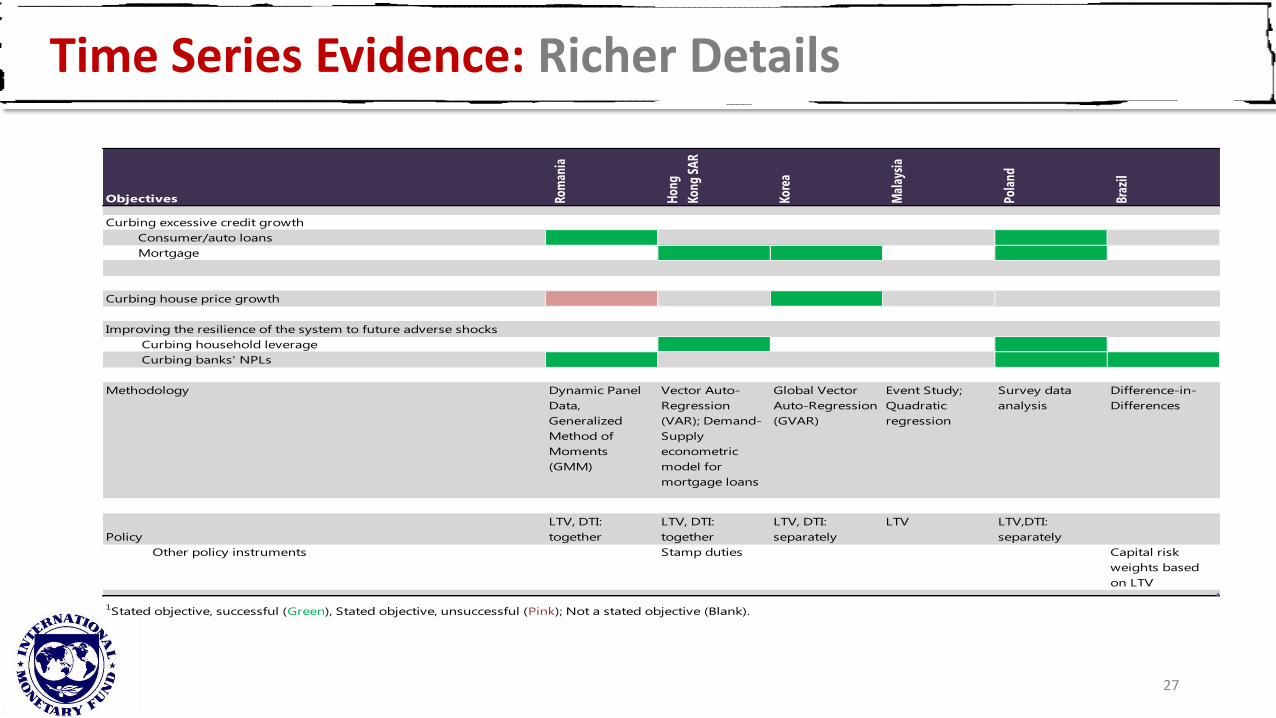
Time Series Evidence: Richer Details
27
Objectives Rom
ania
Hon
g
Kong
SA
R
Kore
a
Mal
aysi
a
Pola
nd
Braz
il
Curbing excessive credit growth
Consumer/auto loans x X
Mortgage X X
Curbing house price growth X
Improving the resilience of the system to future adverse shocks
Curbing household leverage X X
Curbing banks' NPLs X X X
Methodology Dynamic Panel
Data,
Generalized
Method of
Moments
(GMM)
Vector Auto-
Regression
(VAR); Demand-
Supply
econometric
model for
mortgage loans
Global Vector
Auto-Regression
(GVAR)
Event Study;
Quadratic
regression
Survey data
analysis
Difference-in-
Differences
Policy
LTV, DTI:
together
LTV, DTI:
together
LTV, DTI:
separately
LTV LTV,DTI:
separately
Other policy instruments Stamp duties Capital risk
weights based
on LTV
1Stated objective, successful (Green), Stated objective, unsuccessful (Pink); Not a stated objective (Blank).
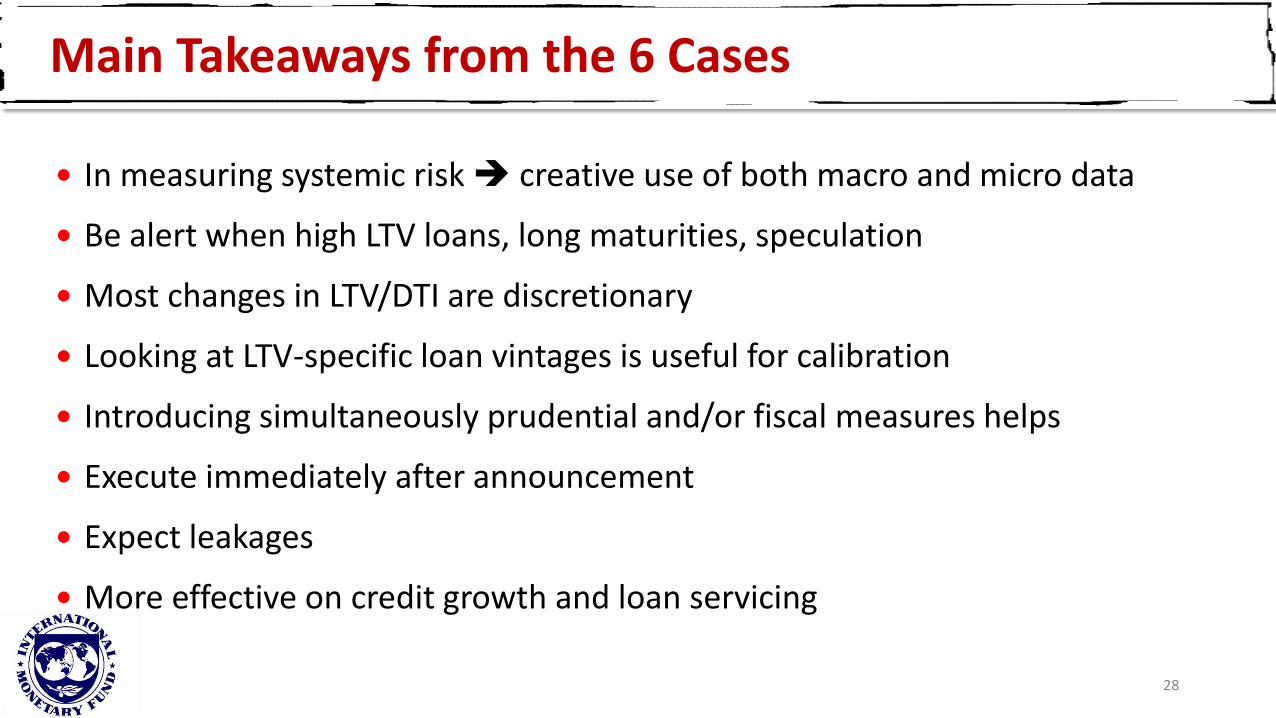
Main Takeaways from the 6 Cases
28
In measuring systemic risk creative use of both macro and micro data
Be alert when high LTV loans, long maturities, speculation
Most changes in LTV/DTI are discretionary
Looking at LTV-specific loan vintages is useful for calibration
Introducing simultaneously prudential and/or fiscal measures helps
Execute immediately after announcement
Expect leakages
More effective on credit growth and loan servicing
Effectiveness: Evidence from Micro DataIndia and Ireland
29
India
Used loan-level data on over a million loans disbursed in India between 1995 and 2010…
…to understand how changing regulation impacted mortgage lending and risk.
Changes in risk weights on mortgages with different LTV ratios when risk weights on mortgages disbursed at LTV ratios at and just under 75% are relatively lower, the
subsequent delinquency rates on these mortgages are relatively higher, after accounting for interest rates at loan issuance.
Source: Campbell JY, Ramadorai T, Ranish B. The Impact of Regulation on Mortgage Risk: Evidence from India. American Economic Journal: Economic Policy 2015;7 (4) http://scholar.harvard.edu/campbell/publications/how-do-regulators-influence-mortgage-risk-evidence-emerging-market
30

Ireland
Originating LTV and LTI, and difference in default rates between first-time buyers and others.
Difference increases as LTV increases upto 85 percent
Difference falls as levels of Loan-to-Income ratio increase
31
Source: Kelly, Malley and O’Toole, 2014, Do first time buyers default less? Implications for macro-prudential policy? Central Bank of Ireland Economic Letters.https://www.centralbank.ie/publications/Documents/Economic%20Letter%20-%20Vol%202014,%20No.%2014.pdf
Summary
Use of MAP Tools
Increasing and Extensive
Evidence from Cross-Country Studies
Few Consensus on Effectiveness, works on credit growth, resilience in crisis
Evidence from Six Case Studies
Use of both micro and macro data for monitoring and calibrating
Helped in credit growth, debt servicing
Evidence from Loan-by-Loan (Micro) Supervisory Data
Lower risk weights raise delinquencies in India
First time property buyers not necessarily more risky than others
32
Thank you
33