applying information analytics to enhance rural water management efficiency and sustainability
DESCRIPTION
Seminar Session 1TRANSCRIPT

India Water Week – April 11 2013
Paper # 188
Applying Information Analytics to Enhance Rural Water Management Efficiency and Sustainability
INDIA WATER WEEK April 11 2013Sustainable and Efficient Community Water Supply in Rural Areas
Ravi Sewak Safe Water NetworkHew Crooks Safe Water NetworkNithya Rajamani IBM Research IndiaGeoff Riggs IBM CanadaCecilia Laverty IBM USA
Business Analytics for Rural India
Community-owned and operated Safe Water Station

India Water Week – April 11 2013
Business Challenges Plant downtime, or sub-optimal performance Problems often are detected only after they have happened Engineer site visits are expensive and difficult to organize Data is critical to ensure kiosk equipment is functioning properly Sales and consumer data critical for strategic planning
Derelict Infrastructure Excessive cost of repairs or replacement
Business Analytics for Rural India
Result
India Water Week – April 11 2013
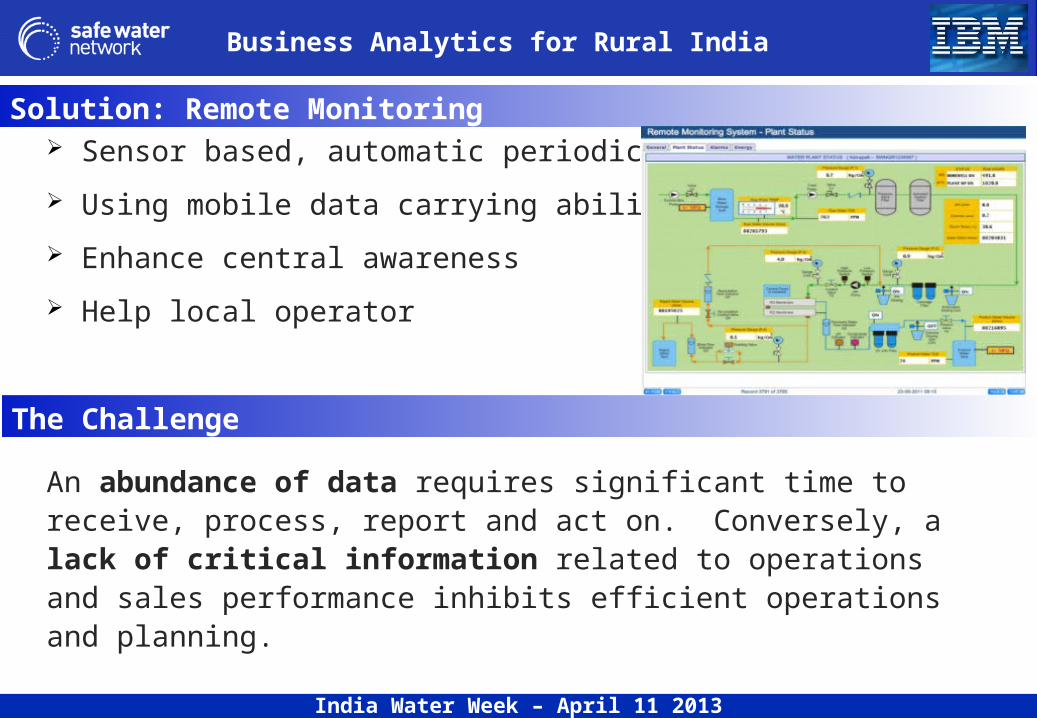
Solution: Remote Monitoring Sensor based, automatic periodic updates Using mobile data carrying ability Enhance central awareness Help local operator
An abundance of data requires significant time to receive, process, report and act on. Conversely, a lack of critical information related to operations and sales performance inhibits efficient operations and planning.
Business Analytics for Rural India
The Challenge

India Water Week – April 11 2013
Project Objectives
Provide analytics capability that is accessible, affordable, scalable and more powerful and flexible Support more efficient decentralized water provisioning by applying enterprise-class technological capabilities and techniques to ‘small-data’ operations Introduce a new level of information management capabilities to SWN staff
Analytics application to give tools for Village-level information management that would facilitate operational insight and efficiency.
Business Analytics for Rural India
Vision

India Water Week – April 11 2013
What Gets Measured, Gets Managed Better information leading to better performance
More Time for High Value TasksReactive processes impair performance and increase costs
Foundational Data Model A well-modelled data repository to facilitate efficient information management
Affordable, Scalable, Accessible, Sustainable Address the skills and needs of the users, and consider environmental and business constraints
Skills and Tools for FutureTo efficiently process new information sources, aligned with their available resources, budget and organizational objectives
Principles & Benefits
Business Analytics for Rural India

India Water Week – April 11 2013
Multiple data points exist even in small/rural water distribution kiosks Operational Dashboard, Customizable Analytics and Reports
Project Overview
The Safe Water Network Analytics application is an integration and optimization layer which leverage, not replaces, the existing data and system resources presently being used.
Business Analytics for Rural India

India Water Week – April 11 2013Confidential 7
Kureb
Jookal
Average
Project Summary: Jul-12 Summary and CommentVillage: Obeyeyie
District: Ga WestPopulation 2,500Distance from Accra 1.5 hoursInauguration May-09
Capacity (L/H) 2,700Effective Capacity 1,300,000 L per monthRemote Kiosks NoneDelivery 1 Truck
HH Penetration 44%HH Penetration (500m) 114%
2012 2011 Diff. % 2012 2011 Diff. % Actual Target ResultREVENUE 2,138 1,270 868 68% 17,542 10,720 6,822 64% Overall Plant Utlization 40% 70% FailDIRECT OPERATING COST 1,511 517 994 192% 12,424 7,848 4,577 58% Downtime (% of 360) 4% 7% PassEBITDA 627 753 -126 -17% 5,117 2,872 2,245 78% Wastage 1% 5% Pass EBITDA Margin 29.3% 59.3% 29.2% 26.8%WHG FEES/EXPENSES 1,250 1,150 100 9% 8,750 8,050 700 9%EBITDA (After WHG) -623 -397 738 57% -3,633 -5,178 1,545 43% HH Penetration 44% 45% Fail
Margin -29.1% -31.3% -20.7% -48.3% HH Penetration (500m) 114% 75% PassOperating MetricsVolume Sold (L) 508,220 253,520 254,700 100% 4,195,720 2,303,620 1,892,100 82% Water Quality PassAverage Price/20L 0.08 0.10 -0.02 -16% 0.08 0.09 -0.01 -10%Op Cost & Fees/20L 0.11 0.13 -0.02 -17% 0.10 0.14 -0.04 -27%EBITDA/20L -0.02 -0.03 0.01 -22% -0.02 -0.04 0.03 -61%
Though it is tied with Oduman as our smallest community (about 2,000), Obeyeyie has a strong source and does a lot of bulk sales and delivery. As a result it has been a consistent performer at the highest per capita volume level of any of our sites. A remote kiosk is scheduled to be completed by mid-August.
July results were positive, up 100% over the previous year; this represented a meaningful acceleration in growth rate after months of continued decline.
Operating & Consumer MetricsFinancial Performance Current Month Year to Date
76,923
12,308 9,488 4,923
-
20,000
40,000
60,000
80,000
100,000
120,000
Site Support to WHG
Additonal Storage Tanks
Generators/Upgrades
Initial Turnkey Site
Total Project Cost : 103,642(US$ 67,367)
- 100,000 200,000 300,000 400,000 500,000 600,000 700,000 800,000 900,000
Jan Feb Mar Apr May Jun Jul Aug Sep Oct Nov Dec
Obeyeyie Volume (L)
2011 2012 Budget 2012 Actual -
500,000
1,000,000
1,500,000
2,000,000
2,500,000
Q1 Q2 Q3 Q4
Obeyeyie YoY Comparison (L)
2009
2010
2011
2012
179,520 239,220
74,000
269,000
-
100,000
200,000
300,000
400,000
500,000
600,000
2011 2012
Volume Breakdown
Delivery
RK3
RK2
RK1
Main Site
Analysis
Business Analytics for Rural India

India Water Week – April 11 2013Confidential 8
Locally Operated
Business Analytics for Rural India
The looks

India Water Week – April 11 2013
“Together, we solve water!”
Business Analytics for Rural India
Thanks