applying cocomo ii - jean monnet university€¦ · · 2010-10-18applying cocomo ii - a case...
TRANSCRIPT

Master Thesis Software Engineering Thesis no: MSE-2004-19 August 2004
School of Engineering Blekinge Institute of Technology Box 520 SE – 372 25 Ronneby Sweden
Applying COCOMO II - A case study
Darko Milicic
ii
This thesis is submitted to the School of Engineering at Blekinge Institute of Technology inpartial fulfillment of the requirements for the degree of Master of Science in SoftwareEngineering. The thesis is equivalent to 20 weeks of full time studies.
Contact Information: Author(s): Darko Milicic E-mail: [email protected]
External advisor(s): Drazen Milicic RKS AB Address: Amiralsgatan 17, SE-211 55 Malmö Phone: +46 40 698 53 00
University advisor(s): Conny Johansson Department of Software Engineering
School of Engineering Blekinge Institute of Technology Box 520 SE – 372 25 Ronneby Sweden
Internet : www.bth.se/tek Phone : +46 457 38 50 00 Fax : + 46 457 271 25

1
ABSTRACT
This thesis presents the work based on the software cost estimation model COCOMO II, which was applied to a case study object derived from a software organization that had a completed project at its disposal. One of the most difficult phases in software development is the planning process and the ability to provide accurate cost estimations for a project. A competitive market calls for delicate and strategic excellence in management issues such as project plans. While software estimations may by straightforward in perception it is intricate in actuality. COCOMO II is allegedly one of the top contenders for the number one tool to utilize in software cost estimations, based on available literature, and it is an important ingredient for managing software lines of business. The original model was initially published by Dr. Barry Boehm in 1981, but as the software field moved rapidly into new-fangled processes and techniques, the need to cope with this evolutionary change resulted in a revised and novel edition of the model. The industry project subjected to this case study acts as a source of data for the model to use as input parameters, and this procedure is systematically explicated in a data collection exposition. Validation and application of parameters as well as the model is later on applied as a foundation for subsequent discussions. Characteristics such as calibration and prediction accuracy in the estimation model are moreover scrutinized in order to base farther conclusions on.
Keywords: cost, effort, estimation, COCOMO

2
CONTENTS
ABSTRACT........................................................................................................................................... 1
CONTENTS........................................................................................................................................... 2
READING GUIDELINES.................................................................................................................... 4
ABBREVIATIONS ............................................................................................................................... 5
1 INTRODUCTION .............................................................................................................................. 6
1.1 MOTIVATION AND CONTEXT .................................................................................................. 6 1.2 FIELD EXPERIENCE................................................................................................................. 8 1.3 AIMS AND OBJECTIVES........................................................................................................... 8 1.4 RESEARCH QUESTIONS........................................................................................................... 8 1.5 RESEARCH APPROACH ........................................................................................................... 9 1.6 PURPOSE OF THE THESIS......................................................................................................... 9 1.7 CHAPTER SUMMARY .............................................................................................................. 9
2 THE CASE STUDY OBJECT AND APPROACH ......................................................................... 10
2.1 ORACLE PL/SQL.................................................................................................................. 11 2.2 4GL...................................................................................................................................... 11
2.2.1 Oracle Forms .................................................................................................................. 12 2.3 CASE STUDY METHODOLOGY .............................................................................................. 12
2.3.1 Diagnosing Problem Areas ............................................................................................. 12 2.3.2 Prediction and Evaluation .............................................................................................. 13 2.3.3 Data Collection Approach .............................................................................................. 13
2.4 CHAPTER SUMMARY ............................................................................................................ 13
3 MODEL DEFINITION ................................................................................................................... 14
3.1 DEFINITIONS AND ASSUMPTIONS ......................................................................................... 14 3.2 SIZING .................................................................................................................................. 14
3.2.1 Assessing Size.................................................................................................................. 15 3.3 EFFORT ESTIMATION............................................................................................................ 15
3.3.1 Scale Factors................................................................................................................... 16 3.3.2 Cost Drivers .................................................................................................................... 16
3.4 CHAPTER SUMMARY ............................................................................................................ 16
4 DATA COLLECTION ..................................................................................................................... 17
4.1 SCALE FACTORS................................................................................................................... 17
3
4.1.1 Precedentedness (PREC) ................................................................................................ 17 4.1.2 Development Flexibility (FLEX) ..................................................................................... 18 4.1.3 Architecture / Risk Resolution (RESL)............................................................................ 18 4.1.4 Team Cohesion (TEAM).................................................................................................. 20 4.1.5 Process Maturity (PMAT) ............................................................................................... 21
4.2 COST DRIVERS ..................................................................................................................... 25 4.2.1 Product Factors .............................................................................................................. 25 4.2.2 Platform Factors ............................................................................................................. 27 4.2.3 Personnel Factors ........................................................................................................... 29 4.2.4 Project Factors ............................................................................................................... 31
4.3 CHAPTER SUMMARY ............................................................................................................ 33
5 DATA VALIDATION AND APPLICATION ................................................................................. 34
5.1 DATA VALIDATION .............................................................................................................. 34 5.1.1 Scale Factors................................................................................................................... 34 5.1.2 Effort Multipliers............................................................................................................. 35 5.1.3 SLOC............................................................................................................................... 36
5.2 DATA APPLICATION ............................................................................................................. 37 5.3 CHAPTER SUMMARY ............................................................................................................ 39
6 RESEARCH FINDINGS................................................................................................................. 40
6.1 ANOMALIES.......................................................................................................................... 40 6.2 SIZING IMPLICATIONS........................................................................................................... 41 6.3 CALIBRATION....................................................................................................................... 41 6.4 COST DRIVERS (PART I)........................................................................................................ 43
6.4.1 Risk Resolution................................................................................................................ 44 6.4.2 KPAs................................................................................................................................ 44
6.5 COST DRIVERS (PART II) ...................................................................................................... 45 6.5.1 Management.................................................................................................................... 45 6.5.2 Task Assignments ............................................................................................................ 45
6.6 ASSESSMENT OF ESTIMATION PRECISION............................................................................. 46 6.7 RECOMMENDATION.............................................................................................................. 46 6.8 CHAPTER SUMMARY ............................................................................................................ 46
7 EPILOGUE ...................................................................................................................................... 47
7.1 CONCLUSION ........................................................................................................................ 48
REFERENCES.................................................................................................................................... 50
APPENDIX .......................................................................................................................................... 53

4
READING GUIDELINES CHAPTER 1 – INTRODUCTION
This chapter provides background information to the subject of software cost estimations and outlines the aims, objectives and research questions along with the purpose of the thesis.
CHAPTER 2 – THE CASE STUDY OBJECT AND APPROACH
Encapsulated here is the case study object which referees to the completed project that besides from the estimation model constitute the main sources of exploited information. Also the approach to the investigation is presented in order to give an intimation of the mode of procedure for the study
CHAPTER 3 – MODEL DEFINITION
COCOMO II is briefly presented to give the reader an overview of the model as a foundation for subsequent chapters to build upon. The chapter furthermore depicts some implications of sizing a software system.
CHAPTER 4 – DATA COLLECTION
This chapter encloses the data collection of the case study and has been designed based on the COCOMO II model parameter retrieval. The parameters are mainly presented with a table and explanatory text along with an appurtenant rationale part that explains the motivation for a certain setting.
CHAPTER 5 – DATA VALIDATION AND APPLICATION
Gathered data from previous chapter is here evaluated to assess the consistency and validity of it. Since the model has previously been defined, the application of data to COCOMO II is made. This chapter hence merges the two previous ones into a more comprehensive reproduction. The mode of procedure for sizing the application is also delineated here. Preliminary estimates are applied devoid of data validation for ensuing discussions.
CHAPTER 6 – RESEARCH FINDINGS
Research findings are disclosed in this chapter and are based on empirical as well as literature studies. The software cost estimations are here generated with the data validation in mind. Sizing implications are furthermore presented and its influences on estimated effort, along with a calibration technique.
CHAPTER 7 – EPILOGUE
As a finishing part, the author of this thesis here presents conclusions based on the research.

5
ABBREVIATIONS
• 4GL Fourth Generation Language • ACAP Analyst Capability • APEX Applications Experience • CASE Computer-Aided Software Engineering • CMM Capability Maturity Model • COCOMO Constructive Cost Model • COTS Commercial Off The Shelf • CPLX Product Complexity • DATA Data Base Size • DOCU Documentation Match to Life-Cycle Needs • EM Effort Multiplier • FLEX Development Flexibility • FPA Function Point Analysis • KPA Key Process Area • LCA Life Cycle Architecture • LTEX Language and Tool Experience • PCAP Programmer Capability • PCON Personnel Continuity • PDR Product Design Review • PLEX Platform Experience • PM Person Month • PMAT Process Maturity • PREC Precedentedness • PVOL Platform Volatility • RELY Required Software Reliability • RESL Architecture / Risk Resolution • RUSE Developed for Reusability • SCED Required Development Schedule • SCM Software Configuration Management • SEI Software Engineering Institute • SF Scale Factor • SITE Multisite Development • SLOC Source Line of Code • SQA Software Quality Assurance • STOR Main Storage Constraint • TEAM Team Cohesion • TIME Execution Time Constraint • TOOL Use of Software Tools

6
Introduction
Chapter
“If I have seen farther it is by standing on the on the shoulders of giants.”
Sir Isaac Newton
1.1 Motivation and Context One of the most difficult phases in the software development process is the ability
to give accurate time estimations for a project. The reasons for this are numerous. At an early stage – when in fact the estimates are most crucially needed – there is simply not enough information to provide for a sufficient answer. Guesstimates are most likely to appear. This is an early and unnecessary risk to be exposed to. But why are precise time estimations needed and so important? To answer this question a scenario is staged and the following assumptions are made. A project manager has been given the task to provide upper management with an educated approximation on how much resources are required for the upcoming project. The competitive market calls for a swift reaction, giving minimal time to consider all possible concerns. After intense consultations and research on the characteristics of the project at hand, an estimate is provided and management gives the go-ahead. Since the cost proposal was presented prior to many other companies – also in pursuit for the contract – and at a lower expense, the customer decides to employ the hypothetical company. A disastrous consequence can now jeopardize the entire situation. Employees will be forced to work for free due to over commitment from the project manager and responsible for the estimations. Overruns in the budget appear and development is endangered as the customer start to ponder about canceling it due to rapidly decreasing finances. This is the penalty for underestimating the cost. There is yet another outcome from negotiating for a contract. Due to poor skills in software cost estimations, an unnecessarily high proposal is presented to the customer who chooses to employ some of the less expensive companies. Cost overestimation is equally as disastrous since both of the scenarios have extremely unwanted outcomes.
There are usually two kinds of similar problems connected to these situations. Project management consequentially ensnares them selves in a dilemma when negotiating for a contract. Competition in the software industry makes vendors try to cut corners in the development in order to get the buyers attention. The risk involved in this deceit is overwhelming. If failing to manage the risk taking, over commitment is a fact and software developers will perhaps invests time without fanatical compensation (Boehm 1981:30). However, proposing a cost that might as well be reasonable for the vendors might not be as accepted by the client. It is a difficult task finding a proper balance between risk taking and assuring the survival for the software organization. This is why the importance of accurate time estimations is stressed. Relying on precise measurements, historical data etc. provides for a powerful tool to

7
rely on when creating a basis for the projects. Effort estimation is however a complex process that requires dealing with issues such as identifying key parameters involved. This thesis elucidates the Constructive Cost Model (COCOMO) II that addresses some commonly reoccurring reasons for inaccurate estimations. An investigation conducted on 115 different organizations revealed that many companies have moderately or very unsatisfactory estimates due to the undermentioned causes extracted from Pfleeger (2001:99). Most of them are issues dealt with by the model under investigation in this case study.
• frequent requests for changes by users • overlooked tasks • users’ lack of understanding of their own requirements • insufficient analysis when developing an estimate • lack of coordination of systems development, technical services,
operations data administration, and other functions during development • lack of adequate method or guidelines for estimation
Several aspects of the project were noted as key influences on the estimate:
• complexity of the proposed application system • required integration with existing systems • complexity of the programs in the system • size of the system expressed as number of functions or programs • capabilities of the project team members • project team’s experience with the application • anticipated frequency or extent of potential changes in user requirements • projects team’s experience with the programming language • database management system • number of project team members • extent of programming or documentation standards • availability of tools such as application generators • team’s experience with the hardware
An interview assignment in a Software Project Management course revealed that none of 15 inquired project managers had any formal and/or defined (i.e. parametric, algorithmic etc.) approach for estimating effort required in software development. This finding was rather alarming since the software engineering discipline is somewhat based upon formal and defined methods in all stages of the development process. Computer-Aided Software Engineering (CASE) tools are utilized by organizations in order to capture requirements, organize documentation, test the code, keep track of changes, generate test data, support group meetings, and so fourth. Pfleeger (2001:100) infers that such tools are in fact sometimes required by the customer or as a part of a company’s standard software development process. With regards to this fact, is seems exceedingly illogical not to incorporate a tool for estimating resources needed. It is an investment that can give an extra edge in a competitive market. As more and more data points (projects) are collected, these can be used to calibrate the model, a resource that is somewhat lost when conducting educated guesses.
Ashley (1995:219) ascertains that there is a quantity of main principles associated with estimates. It should be taken into consideration that estimates are dynamic and should be revised as more information becomes available or when requirements change. In addition, the process needs to incorporate the use of historical data from similar projects in order to assess the estimate and establishing its plausibility. A technique for measuring the effectiveness of the estimate process – in terms of how well estimates congregate to the actual value – should moreover be included. Ashley

8
(1995:219) continues stressing the importance of repeatability and traceability. The assumptions and calculations made needs to be recorded which enable a learning process from previous estimates. Hence, the estimation procedure should provide a feedback mechanism for improvement purposes.
1.2 Field Experience As a software engineering master’s student, opportunities to participate in some
team projects have presented themselves in the past and have provided valuable experience from a time estimation point of view. The last and probably most valuable gave a chance to utilize the Delphi technique (Pfleeger 2001:102) when making estimates for the testing phase. Those estimations were commenced individually, thence excluding the risk of influencing each other in any manner. The next step was to compare the results and sure enough, it was surprising to find each others estimates and the assumptions that led to these. However – after giving discussions – adjusting some of the extreme values facilitated the conformance to a more reasonable mean. This was a positive aspect of exchanging knowledge. If satisfying with the sentiment of the individual estimates, the result would have been a completely different one.
Attempts to estimate effort with the use of historical data has also been an issue. A problem with academic projects is that they are varied in nature, thence it has been difficult to reuse data collected from earlier reporting systems and evaluations. Differentiating project characteristics such as; unknown domains, programming language and team size has made the task of analyzing the results ambiguous. The benefits – if any – of calibrating a cost model with data points is an issue that is intended to be scrutinized later on and further elaborated in section 1.4. Putnam and Myers (1992:362) define calibration as establishing the value of a parameter by measuring all the other factors in a situation and specifically, measuring the variables of completed projects – size, effort, time – that solve the software equation.
1.3 Aims and Objectives An objective of this master thesis is to establish the accuracy in COCOMO II by
applying the model to a completed project preformed in a software development company. An aim is to assess the estimations resulting from COCOMO II by comparing them to actual outcome. The expected outcome is to ascertain the validity of the model and if the result exhibits accuracy in the model, this will act as a promotion for COCOMO II. Potential shortcomings will be scrutinized if the model somewhat fails in its accuracy.
1.4 Research Questions
• How accurate is COCOMO II precision? Since this investigation already has an accomplished project at its disposal, the effort outcome of it will act as comparator (see section 6.6).
• How significant is the calibration of the model? COCOMO II allows calibration of the model with historical data. Additional to the 161 projects currently in the COCOMO II database, the model can be tailored to fit the data of the project characteristics and practices defining it (see section 6.3).
• What parameter is the most influential for the outcome of the result? The software cost estimator utilized in this research provides numerous inputs that account for different impacts on the result. In order for the outcome to be precise, the need to correctly establish this factor is of importance (see section 6.2).

9
• Is the model preferable as a software cost estimator for the company? Perhaps the time estimations currently adopted are sufficient and inaccurate estimations are not potential risks. COCOMO II can conform to present conditions and provide higher precision or not. The thesis has however the intention to convey if the model is suitable for the company (see section 6.6 and 6.7).
1.5 Research Approach A case study in a software organization will act as methodology for this
investigation. The characteristics in the project and application will be defined in order to apply COCOMO II. An interview with the Consultant Manager- and Senior Consultant (external advisor) for the company will constitute for the elicitation of the scale factors and effort multipliers. The initial idea was to count function points on the project application however, there are some implications of counting function points on Oracle SQL forms application development. The project uses a non-procedural fourth generation language called SQL Forms and the Function Point Analysis (FPA) has to cope with this circumstance in order for the size metric to be established (Lewis and Oliver 1992). The size can however be ascertained using direct counting of the actual application code at hand. Since COCOMO II eventually relates Unadjusted Function Points (UFPs) to Source Lines of Code (SLOC) it appears to be a potential source of miscalculation. The decision was therefore to directly count SLOC hence avoiding possible inaccuracy in the assessment of UFPs in the FPA.
1.6 Purpose of the Thesis The main purpose of this thesis is to contribute to the validity assessment of the
COCOMO II model. As a preparatory work for this research, an Advanced Software Engineering course was conducted with the aim to evaluate different time estimation models. By comparing SLIM, PRICE-S, FPA, Estimation by Analogy, Wolverton and COCOMO II, the analysis of that study concerned evaluating characteristics and techniques used in the models. The aim was to define strengths and weaknesses involved. Eventually concluding that COCOMO II was the model to pursuit in further elaborations, the journey has withal momentarily discontinued here. Decisive factors where COCOMO’s underlying information models combined with the integration of cost drivers, effort multipliers and exponential scale factors. In addition, tailoring estimation models to process strategies such as early prototyping, and utilizing a Bayesian calibration that has a strong theoretical foundation to justify its result added to the conviction. Now the goal is to truly go in-depth and exploit the characteristics of the model in order to assess an equitable appraisement. At disposal is a completed industrial project with documented results. This is truly preferable over an educational project that otherwise might have had the potential to distort the results of the study.
1.7 Chapter Summary The introduction to this thesis revealed several aspects of software cost estimation,
both from the author’s point of view as well as literature perspectives. It has provided a number of implications of software management decisions that require consideration. Issues concerning poor estimates were presented in order to elucidate the consequence of such, together with an outline of main concerns that organizations exhibited as influential factors for inadequate estimations. Aims, objectives and research questions were made available to set up the work so that concluding chapters can attempt to unravel the difficulties enclosed in these. As a final point the purpose of the thesis was given in order to explicate interesting and important connections to this research.

10
The Case Study Object and Approach
Chapter
“Little by little, one travels far.”
J.R.R. Tolkien
The software development project dealt with in this case study was conducted in a
commercial environment with an external customer financing the software development. Software engineering consultants from the supplier’s organization primarily compiled the project with some additional technical experts from a subcontractor. Domain experts and software engineers from the customer’s organization enlarged the collection. The project had 26 project members altogether and was conducted over a period of 12 months. This resulted in a total development effort of 9938 person hours. The project team members were highly motivated in doing a good job without exceeding the agreed boundaries (Milicic and Wohlin 2004).
The project and organization specializes in utilizing a technical environment based on the Oracle platform development. The clients were created in a 4GL tool (Oracle Forms Developer) while the business logic principally was implemented as function oriented store procedure components, generally referred to as code packages in Oracle PL/SQL. As the development environment plays an important role in the understanding of constraints in attributes and the applicability of them as COCOMO parameters, a brief overview will be provided in following sections. It has immense implications from a technical perspective; however from an estimating point of view the choice of environment plays a trifling role. Nevertheless, the research aspect calls for a meticulous description of all implications.
Several of the software engineers were involved in creating a tailor made business application framework prior to the project. This construction of standard functionality served as a base platform upon which future customer specific applications can be instanced. The application framework runs as a standardized application with a common set of functionality created to be generally applicable for several applications within the problem domain. But the framework was not initially intended as such. An application rather founded the original idea so the architecture and general application structure was therefore available immediately at project start. Quite a lot of the software engineers were familiar with the environment – both from a technical and a domain perspective – already from get go. The project task was mainly to extend the domain specific business application framework as well as set up the already implemented components to fulfill the current set of requirements. It should not be confused with a pure deployment project were parameter setting is in focus. Even though the project was based on an application framework it should still be characterized as a software development project. The software development process used is best characterized as an iterative approach with three overall functional increments as depicted in Gilb (1988) and Kruchten (2000). In addition, the PPS project steering model (TietoEnator 2003) was adopted to supervise and organize the project.

11
2.1 Oracle PL/SQL PL/SQL which is Oracle’s procedural extension to industry-standard SQL is
divided into two separate versions. The first is part of the Oracle server and the other is a separate engine embedded in a number of Oracle tools. They are especially similar to each other in, among others, the sense of having the same programming structures, syntax and logic mechanisms. However in contrast, PL/SQL has extensions for Oracle Forms as the language expanse to suite the requirements of the particular tool. Concepts similar to modern programming languages exist, such as variable and constant declarations, control structures, exception handling, and modularization. Since PL/SQL is a block-structured language, blocks can be entirely separate or nested within another. As illustrated and derived from Connolly and Begg (2002:253), Figure 1 depicts a PL/SQL block having up to three parts:
• an optional declaration part in which variables, constants, cursors, and exceptions
are defined and possibly initialized • a mandatory executable part, in which the variables are manipulated • an optional exception part, to handle any exception raised during execution
Figure 1. General structure of a PL/SQL block.
The language safely extends SQL enabling the key strength of providing a stored
procedural language that is robust and secure (Oracle PL/SQL 2004). Such characteristics enable a platform for high-performing enterprise applications which are primarily beneficial for the prevailing circumstances.
2.2 4GL Fourth generation languages (4GL) are mainly shorthand programming languages
but there is yet no particular consensus about what constitutes a 4GL. Main characteristics are that operations that usually require hundreds of lines in a third-generation language (3GL) commonly necessitate considerably smaller quantity in a 4GL. The user does not need to identify steps for a certain task, but instead defines parameters for the tools that utilize them in order to generate an application. Interesting from a software cost estimation perspective is that 4GL is claimed to improve productivity by a factor of ten as 4GL is expected to rely on much higher-level components, all at the expense of limiting the problems. Connolly and Begg (2002:42) sheds some light on that the scope of 4GL includes:
• presentation languages, such as query languages and report generators • specialty languages, such as spread sheets and database languages
[DECLARE Optional --- declarations] BEGIN Mandatory --- executable statements [EXCEPTION Optional --- exception handlers] END; Mandatory

12
• application generators that define; insert update, and retrieve data from the database to build applications
• very high-level languages that are used to generate application code
2.2.1 Oracle Forms Oracle Forms developer creates default code behavior based on database
designation as relationships and check constraints automatically are identified which saves time and effort for the developer (Oracle9i Forms 2004). Forms additionally enable an interactive facility for swiftly creating data input and display layouts. The developer has an integrated set of builders which consent developers to rapidly assemble complicated database-forms and business logic with negligible cost. Forms generators allow users to delineate what screens should look like, information to display, and the location on the screen. Such development environments endow with grand features for the making of applications from database definitions with negligible implementation time. Connolly and Begg (2002:42) accentuates that it in addition might consent to the conception of derived attributes, utilizing arithmetic procedures and/or aggregates, as well as specifying validation control for data input. Application development is preformed in a declarative fashion meaning that e.g. wizards guide developers throughout regular activities such as defining data sources etc, and 4GL properties enables definitions of object attributes which consequentially saves the developer immense coding time. Object orientation is a concept that also Oracle Forms cope with in that components can be created, inherited and eventually reused between dissimilar applications to minimize redundant implementation.
2.3 Case Study Methodology A fundamental building block in a case study is the providing information. The
first step is hence to become familiar with this information and begin to revise it. This comprises the prevailing and manifesting circumstances and the ability to cope with them. Since practically every aspect of the technical development is quite new-fangled knowledge, the ability to adapt to e.g. the development tools and language is of importance. Easton (1982:9) advises that information ought to be ordered to aid in the understanding of it. As can be seen later on, COCOMO II has a really structured mode of procedure that will enforce the organization of information. Information contained in the case study object also needs evaluation but even though some information is not valid, precise, and/or relevant, every aspect will be scrutinized in order to assess its aptitude. As a direct consequence, the requisite to extrapolate from given circumstances is of the essence if any distinctions are to be made.
2.3.1 Diagnosing Problem Areas A problem is defined by Easton (1982:9) as the difference between what is – or
will be – and what the situation is preferred to be. In this step, the endeavor to disclose such differences in the case state of affairs will be the central source of predicaments. The introduction to this thesis attempted to give a preview of this dilemma. Determining the precise size of the application will probably be more intricate than initially imagined. Problems can merely be symptoms of additional fundamental tribulations and sometimes problems are caused by a number of reasons. In the case study object the 4GL environment complicates issues even more and basic problems will lead to a number of symptoms. These relationships will however be unraveled in this phase and hitches will be interrelated to each other in order to precisely encapsulate potential risks. Decisions about prioritizing are encapsulated in this step

13
since all problems are not equally as important and allocating the same resources. Easton (1982:10) delineates that this phase produces a number of alternatives hence; some procedure of ranking alternatives in terms of their level should be introduced. With the above-mentioned strategy, major strategic alternatives will most certainty be examined first and upon decision completion, it will then make sense to examine tactical alternatives.
2.3.2 Prediction and Evaluation One aspect to bear in mind when choosing among optional resolutions is to predict
the consequences of alternatives. Easton (1982:10) associates two particular warnings with this step; ascertaining the prediction of all possible outcomes in view of the fact that particular solutions may introduce additional problems, and balancing risk with particular actions and the uncertainty coupled with it – a somewhat delicate adjustment that has to be examined. Furthermore, evaluating amongst alternatives are decisions about approaching tribulations from different angles, hence, benefits and shortcomings for each solution should be delineated. Concurring with Easton (1982:10), the concluding step in this phase is when choices about above-mentioned are made as it is a direct consequence of alternatives- comparison, elaboration, qualification, and quantification.
2.3.3 Data Collection Approach The data elicitation from the project and organization will basically be performed
in steps of two. The first step will be conducted in an interview and will involve the extraction of Scale Factors (SF) and Effort Multipliers (EM). By the means this research is in the form of a case study is by utilizing the project data and then applying it to the model. There are no actual observations to be made, instead COCOMO II has a number of predefined parameters and therefore limits the case study approach to these two steps. The second step will be to ascertain the size of the development project i.e. size of the product. Scale factors are in Boehm (2000:30) defined as “accounting for the relative economies or diseconomies of scale encountered for software projects of different size”. They are selected on the basis and rational that they significantly afflict effort with a source of exponential variation on a project’s productivity deviation. The 17 effort multipliers are utilized to regulate the nominal effort, Person Months (PM), to reflect upon the software project in progress (Boehm 2000:40). Determining the size of the project application product entails adaptation to a SLOC definition checklist for counting source statement. It is thence appended as a last part of the thesis. Boehm (2000:15) advocates that the objective is to assess the quantity of “intellectual work” put into software development. Defining a source line of code is highly complicated in view of the fact that conceptual differences manifest themselves in accounting for executable statements and data declarations in various languages.
2.4 Chapter Summary Encapsulated in this chapter was the case study object which referees to the
completed project that besides from the estimation model constitute the main sources of exploited information. Thence, the surrounding environment was depicted to farther enlighten about the key characteristics revolving around this work. Each uniqueness needs to be coped with as they eventually will play an important role in the data collection of this research. Also the approach to this investigation was presented in order to give an intimation of the mode of procedure for the study.

14
Model Definition
Chapter
“I am not young enough to know everything.”
Oscar Wilde
COCOMO II helps in the reasoning about cost implications of software decisions
that needs to be made, and for effort estimates when planning a new software development activity (Boehm 2000:1). The model uses historical projects as data points by adding them to a calibration database which is then calibrated by applying statistical techniques. The post-architecture model is utilized once the project is ready to be developed and sustain a fielded system meaning that the project should have a life-cycle architecture package which provides comprehensive information on cost driver inputs and enables more accurate cost estimates. All further references to COCOMO II can be assumed to be in regard to the post-architecture model.
3.1 Definitions and Assumptions For the Rational Unified Process (RUP) model, all software development activities
such as documentation, planning and control, and configuration management (CM) are included, while database administration is not. For all models, the software portions of a hardware-software project are included (e.g., software CM, software project management) but general CM and management are not (Boehm 2000:326). COCOMO II estimates utilizes definitions of labor categories, thus they include project managers and program librarians, but exclude computer center operators, personnel-department personnel, secretaries, higher management, janitors, etc. A person-month (PM) consists of 152 working hours and has by Boehm (2000:326) been found consistent with practical experience with the average monthly time off (excluding holidays, vacation, and sick leave).
3.2 Sizing It is of outmost importance for good model estimations to have a sufficient size
estimate. Boehm (2000:14) elucidates that determining size can be challenging and COCOMO II only utilizes size data that influences effort thus, new code and modified implementations is included in this size baseline category. Normal application development is typically composed of new code; code reused from other sources – with or without modifications – and automatically translated code. Adjustment factors capture the quantity of design, code and testing that was altered. It also considers the understandability of the code and the programmer familiarity with the code.
15
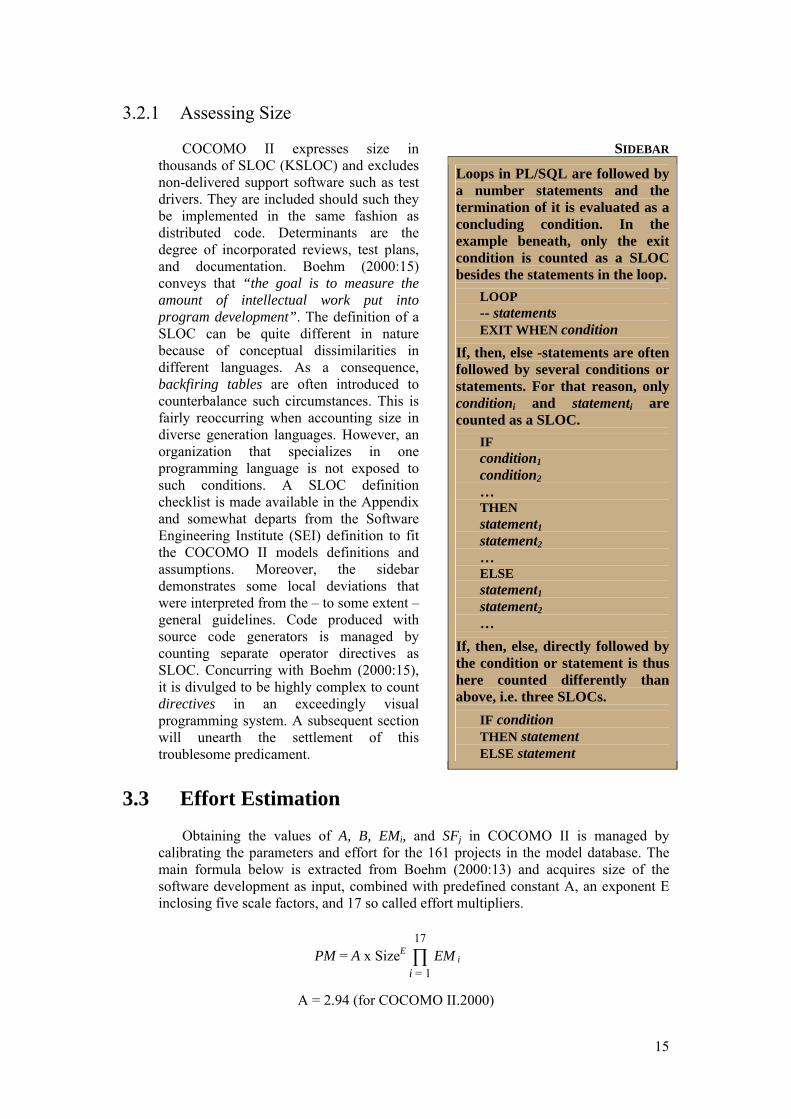
3.2.1 Assessing Size COCOMO II expresses size in
thousands of SLOC (KSLOC) and excludes non-delivered support software such as test drivers. They are included should such they be implemented in the same fashion as distributed code. Determinants are the degree of incorporated reviews, test plans, and documentation. Boehm (2000:15) conveys that “the goal is to measure the amount of intellectual work put into program development”. The definition of a SLOC can be quite different in nature because of conceptual dissimilarities in different languages. As a consequence, backfiring tables are often introduced to counterbalance such circumstances. This is fairly reoccurring when accounting size in diverse generation languages. However, an organization that specializes in one programming language is not exposed to such conditions. A SLOC definition checklist is made available in the Appendix and somewhat departs from the Software Engineering Institute (SEI) definition to fit the COCOMO II models definitions and assumptions. Moreover, the sidebar demonstrates some local deviations that were interpreted from the – to some extent –general guidelines. Code produced with source code generators is managed by counting separate operator directives as SLOC. Concurring with Boehm (2000:15), it is divulged to be highly complex to count directives in an exceedingly visual programming system. A subsequent section will unearth the settlement of this troublesome predicament.
SIDEBAR
Loops in PL/SQL are followed by a number statements and the termination of it is evaluated as a concluding condition. In the example beneath, only the exit condition is counted as a SLOC besides the statements in the loop.
LOOP -- statements EXIT WHEN condition
If, then, else -statements are often followed by several conditions or statements. For that reason, only conditioni and statementi are counted as a SLOC.
IF condition1 condition2 … THEN statement1 statement2 … ELSE statement1 statement2 …
If, then, else, directly followed by the condition or statement is thus here counted differently than above, i.e. three SLOCs.
IF condition THEN statement ELSE statement
3.3 Effort Estimation Obtaining the values of A, B, EMi, and SFj in COCOMO II is managed by
calibrating the parameters and effort for the 161 projects in the model database. The main formula below is extracted from Boehm (2000:13) and acquires size of the software development as input, combined with predefined constant A, an exponent E inclosing five scale factors, and 17 so called effort multipliers.
17 PM = A x SizeE ∏ EM i i = 1
A = 2.94 (for COCOMO II.2000)

16
The predefined constant estimates productivity in PM/KSLOC for the case where a project’s economies and diseconomies of scale are in balance. Productivity alters as the exponent changes for the reason that of non-linear effects on size. The constant is originally set when COCOMO II is calibrated to the project database which reflects a global productivity average (Boehm 2000:29).
3.3.1 Scale Factors The application size exponent is aggregated of five scale factors (SF) that describe
relative economies or diseconomies of scale that are encountered for software projects of dissimilar magnitude. A project exhibits economies of scale if the exponent is less than one i.e. effort is non-linearly reduced. Economies and diseconomies of scale are in balance should the exponent hold a value of one. A project exhibits diseconomies of scale if the exponent is more than one i.e. effort is non-linearly increased (Boehm 2000:30).
5 E = B + 0.01 ∑ SF j j = 1
B = 0.91 (for COCOMO II.2000)
Boehm (2000:30) selected the scale factors in a foundation on the underlying
principle that they have a significant exponential effect on effort or productivity disparity. As seen from the above formula, the five scale factors are summed up and utilized to establish a figure for the scale exponent.
3.3.2 Cost Drivers Cost drivers are characteristics of software development that influence effort in
carrying out a certain project. Unlike the scale factors, cost drivers are selected based on the rationale that they have a linear affect on effort. There are 17 effort multipliers (EM) that are utilized in the COCOMO II model to regulate the development effort. What will be exposed in the subsequent chapter is that every multiplicative cost driver is assigned the same rating level with the distinction being the combination of assigned weights. Annotated by Boehm (2000:36) is the possibility to assign transitional rating levels and weights for the effort multipliers. They are furthermore leveled to establish a mean value that supplementary reflects upon a more reasonable figure. Even though the model specifies a finite number of cost drives, COCOMO II endows the user to definer its own set of effort multipliers to better correspond to prevailing circumstances in any given development. Cost drivers are rated and founded on a sturdy rationale that they autonomously give details on a considerable source of effort and/or productivity discrepancy. Nominal levels do not impact effort whilst a value beneath/over one decreases/increases it.
3.4 Chapter Summary COCOMO II is based on a number of assumptions that have to be considered in
order to predict effort in a straight-forward fashion. Key parameters are the application size in terms of KSLOC, five scale factors that have a non-linear affect on effort, and 17 cost drives that are selected based on the rational that they have a linear dependency on the time estimate. This chapter furthermore gave a taster to the implications of sizing a software system which moreover was delineated in the sidebar.
17
Data Collection
Chapter
“In the middle of difficulty lies opportunity.”
Albert Einstein
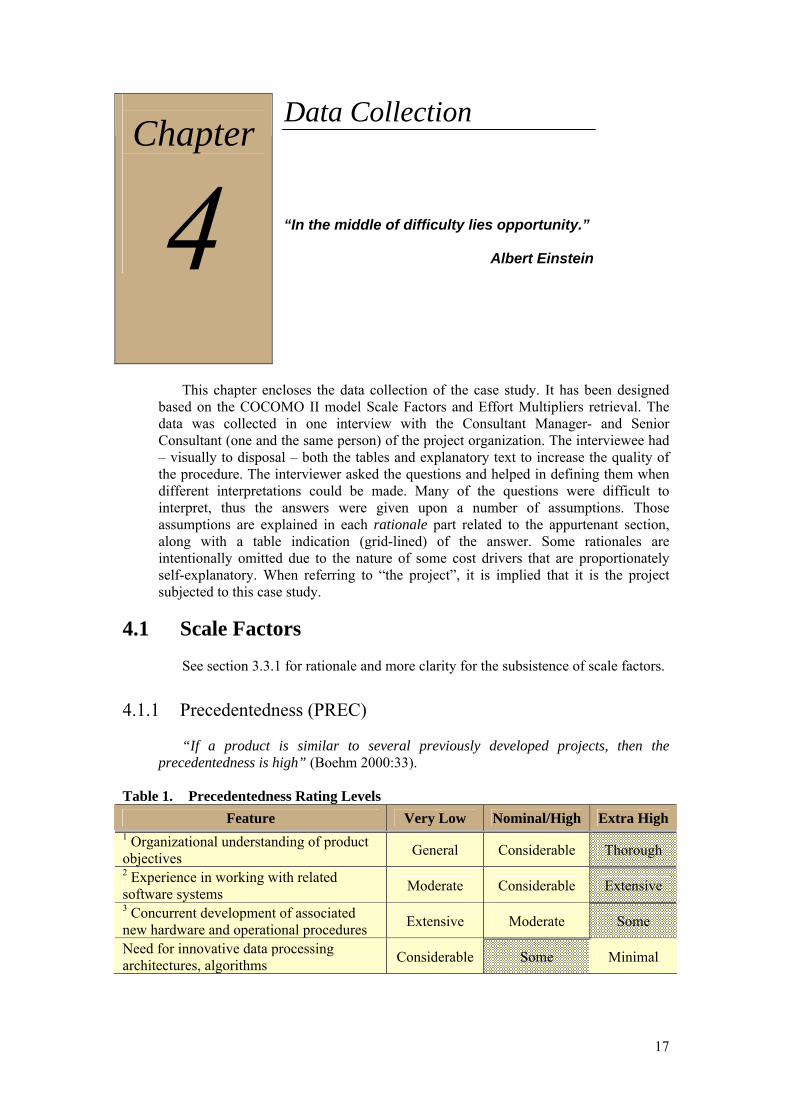
This chapter encloses the data collection of the case study. It has been designed
based on the COCOMO II model Scale Factors and Effort Multipliers retrieval. The data was collected in one interview with the Consultant Manager- and Senior Consultant (one and the same person) of the project organization. The interviewee had – visually to disposal – both the tables and explanatory text to increase the quality of the procedure. The interviewer asked the questions and helped in defining them when different interpretations could be made. Many of the questions were difficult to interpret, thus the answers were given upon a number of assumptions. Those assumptions are explained in each rationale part related to the appurtenant section, along with a table indication (grid-lined) of the answer. Some rationales are intentionally omitted due to the nature of some cost drivers that are proportionately self-explanatory. When referring to “the project”, it is implied that it is the project subjected to this case study.
4.1 Scale Factors See section 3.3.1 for rationale and more clarity for the subsistence of scale factors.
4.1.1 Precedentedness (PREC) “If a product is similar to several previously developed projects, then the
precedentedness is high” (Boehm 2000:33).
Table 1. Precedentedness Rating Levels Feature Very Low Nominal/High Extra High
1 Organizational understanding of product objectives General Considerable Thorough 2 Experience in working with related software systems Moderate Considerable Extensive 3 Concurrent development of associated new hardware and operational procedures Extensive Moderate Some
Need for innovative data processing architectures, algorithms Considerable Some Minimal
18
Rationale 1. The organization has an extensive relationship with this customer and related
products. Since developers are working at the client’s location, it decidedly assists in the understanding of product objectives.
2. The system is an extension of an application framework that was developed prior to the project in order to increase productivity. Application frameworks are constructed by using it as a basis and extending it with application-specific functionality as elaborated in Bosch (2000:238) and cross-checked in Johnson and Foote (1988). Because the project organization is in similar problem domains, this approach is desirable. Hofmeister et al. (2000:9) excogitates that frameworks are not domain specific, but they are specific to an execution platform.
3. New component are added to the framework concurrently with the application development if required. The scope is those kinds of operational procedures.
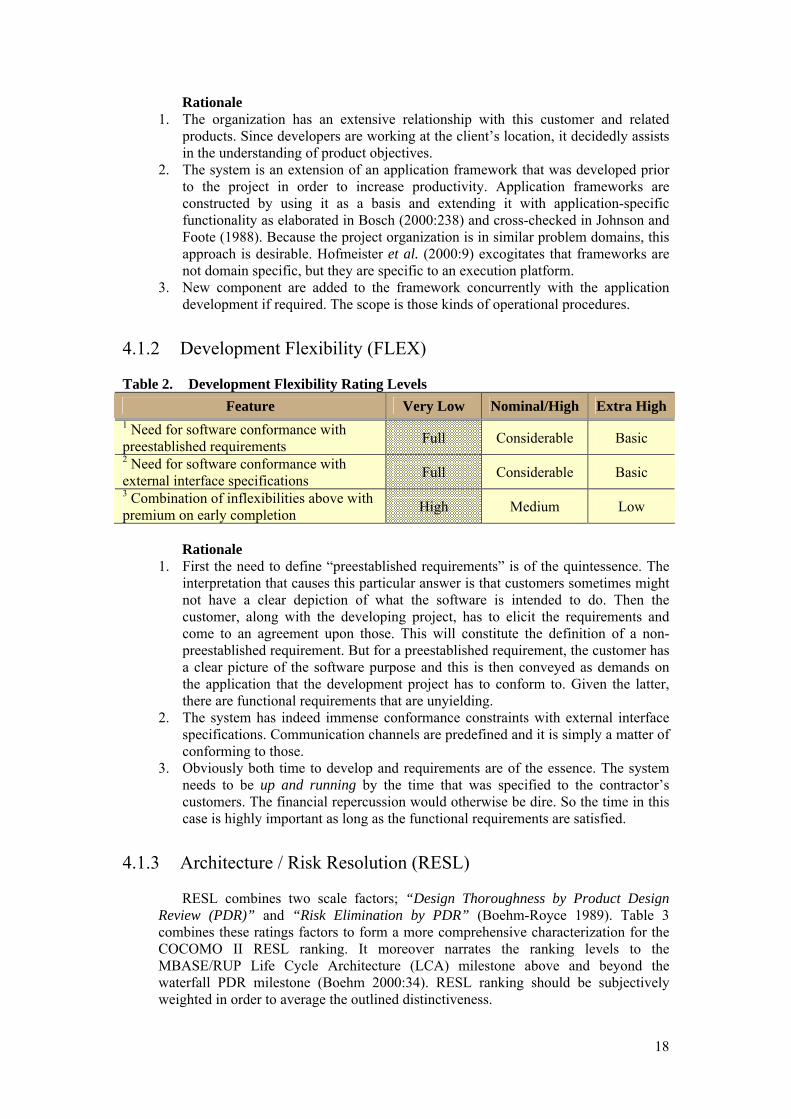
4.1.2 Development Flexibility (FLEX)
Table 2. Development Flexibility Rating Levels Feature Very Low Nominal/High Extra High
1 Need for software conformance with preestablished requirements Full Considerable Basic 2 Need for software conformance with external interface specifications Full Considerable Basic 3 Combination of inflexibilities above with premium on early completion High Medium Low
Rationale
1. First the need to define “preestablished requirements” is of the quintessence. The interpretation that causes this particular answer is that customers sometimes might not have a clear depiction of what the software is intended to do. Then the customer, along with the developing project, has to elicit the requirements and come to an agreement upon those. This will constitute the definition of a non-preestablished requirement. But for a preestablished requirement, the customer has a clear picture of the software purpose and this is then conveyed as demands on the application that the development project has to conform to. Given the latter, there are functional requirements that are unyielding.
2. The system has indeed immense conformance constraints with external interface specifications. Communication channels are predefined and it is simply a matter of conforming to those.
3. Obviously both time to develop and requirements are of the essence. The system needs to be up and running by the time that was specified to the contractor’s customers. The financial repercussion would otherwise be dire. So the time in this case is highly important as long as the functional requirements are satisfied.
4.1.3 Architecture / Risk Resolution (RESL) RESL combines two scale factors; “Design Thoroughness by Product Design
Review (PDR)” and “Risk Elimination by PDR” (Boehm-Royce 1989). Table 3 combines these ratings factors to form a more comprehensive characterization for the COCOMO II RESL ranking. It moreover narrates the ranking levels to the MBASE/RUP Life Cycle Architecture (LCA) milestone above and beyond the waterfall PDR milestone (Boehm 2000:34). RESL ranking should be subjectively weighted in order to average the outlined distinctiveness.

19
Table 3. RESL Rating Levels
Characteristic Very Low Low Nominal High Very
High Extra High
1 Risk Management Plan identifies all critical risk items, establishes milestones for resolving them by PDR or LCA.
None Little Some Generally Mostly Fully
2 Schedule, budget, and internal milestones through PDR or LCA compatible with Risk Management Plan.
None Little Some Generally Mostly Fully
3 Percent of development schedule devoted to establishing architecture, given general product objectives.
5 10 17 25 33 40
4 Percent of required top software architects available to project.
20 40 60 80 100 120
5 Tool support available for resolving risk items, developing and verifying architectural specs.
None Little Some Good Strong Full
6 Level of uncertainty in key architecture drivers: mission, user interface, COTS, hardware, technology, performance.
Extreme Significant
Considerable
Some Little Very Little
7 Number and criticality of risk items.
> 10 Critical
5-10 Critical
2-4 Critical
1 Critical > 5 Non-
Critical
< 5 Non-
Critical Rationale
1. According to the LCA definition provided above, the architecture should be establish i.e. it is completed. The inquiry implies that all critical risk items should be resolved by the time both design and architecture is concluded. However, the project does not conduct risk resolution in this fashion.
2. When elaborating on this characteristic it can be said that if the properties are compatible with the risk management plan, then it should be enough resources assigned to the risk handling – e.g. through PDR or LCA – or else it is simply a statement that is written down on paper, but in practice there are not any measures taken to deal with the issues.
3. It gets a bit intricate here since the entire architecture is established prior to the initialization of the project. As mentioned earlier, the project already had an application framework at its disposal. An entire project was devoted to the task of setting up this architecture. In more traditional development this phase is interconnected with the actual project. Larman (1997:434) points it out as a guiding principle of successful projects. Instead of using this approach, a foundation (predefined architecture) has already been laid that enables the production of similar concepts.
4. The project was staffed with more than enough top software architects.
20
5. The query is a bit misplaced in reference to this case study as it is not those types of risks that are a part of the project. The risks are more in the line of e.g. the customer does not produce the required hardware in time which makes an immediate impact on the software installation date.
6. The project and organization specializes in utilizing Oracle’s environment with those development tools it offers. The level of uncertainty in key architecture drivers is thus little.
7. To answer this question a definition of a critical risk is needed. The project uses the term “showstoppers” that are problems that can bring the development to a complete halt. This is one example of a critical risk. Nicholas (2001:315) delineates a catastrophic risk as a measure of the impact, subdivided into three categories: technical; cost; and schedule. Should the following combination occur: technical goals might not be achievable; cost increase in excess of 50 percent; and unacceptable large schedule slip, then the risk falls under this category.
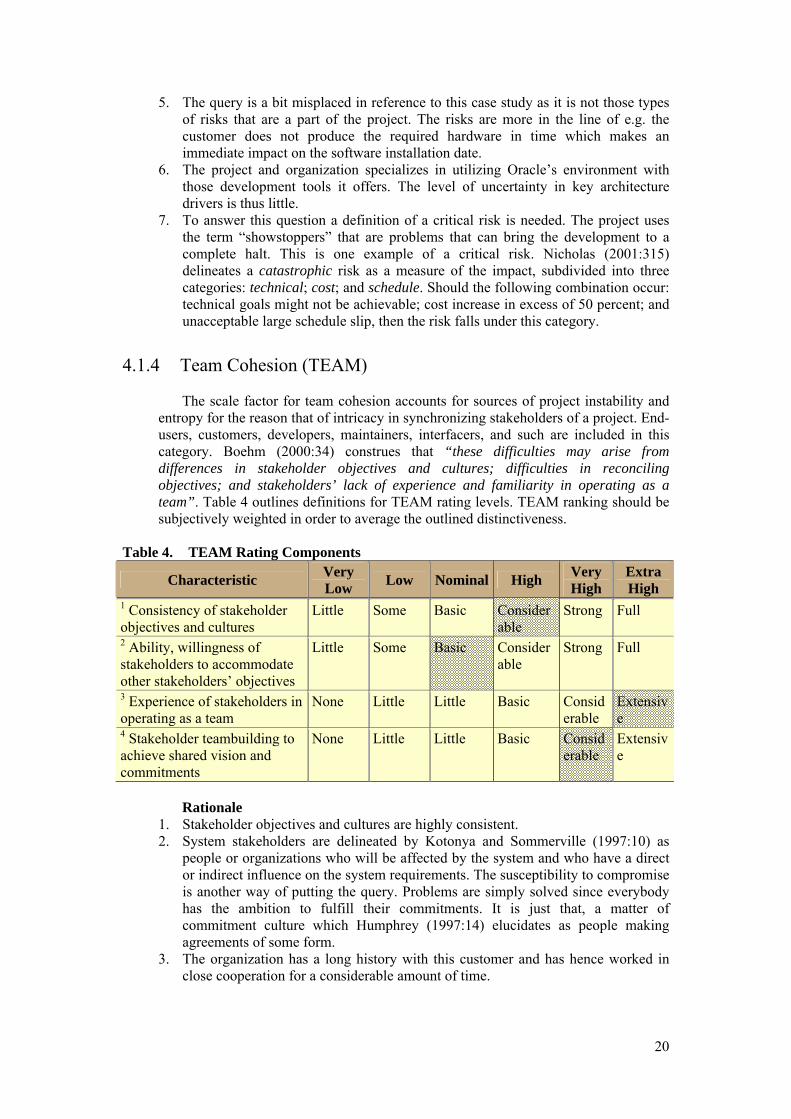
4.1.4 Team Cohesion (TEAM) The scale factor for team cohesion accounts for sources of project instability and
entropy for the reason that of intricacy in synchronizing stakeholders of a project. End-users, customers, developers, maintainers, interfacers, and such are included in this category. Boehm (2000:34) construes that “these difficulties may arise from differences in stakeholder objectives and cultures; difficulties in reconciling objectives; and stakeholders’ lack of experience and familiarity in operating as a team”. Table 4 outlines definitions for TEAM rating levels. TEAM ranking should be subjectively weighted in order to average the outlined distinctiveness.
Table 4. TEAM Rating Components
Characteristic Very Low Low Nominal High Very
High Extra High
1 Consistency of stakeholder objectives and cultures
Little Some Basic Considerable
Strong Full
2 Ability, willingness of stakeholders to accommodate other stakeholders’ objectives
Little Some Basic Considerable
Strong Full
3 Experience of stakeholders in operating as a team
None Little Little Basic Considerable
Extensive
4 Stakeholder teambuilding to achieve shared vision and commitments
None Little Little Basic Considerable
Extensive
Rationale
1. Stakeholder objectives and cultures are highly consistent. 2. System stakeholders are delineated by Kotonya and Sommerville (1997:10) as
people or organizations who will be affected by the system and who have a direct or indirect influence on the system requirements. The susceptibility to compromise is another way of putting the query. Problems are simply solved since everybody has the ambition to fulfill their commitments. It is just that, a matter of commitment culture which Humphrey (1997:14) elucidates as people making agreements of some form.
3. The organization has a long history with this customer and has hence worked in close cooperation for a considerable amount of time.

21
4. Teambuilding is somewhat of a company policy. In other respects the atmosphere is highly professional. Although the concept might have been more extensive in other organizations, it has probably been an effect of the favorable times.
4.1.5 Process Maturity (PMAT) Determining PMAT is a procedure structured around the SEI Capability Maturity
Model (CMM) and should be considered for the time period that project start. PMAT can be determined as a result of an organized evaluation based on the CMM model, and is explicated in Table 24 (Boehm 2000:34). The organization does not have a certified CMM level, thus the key process area questionnaire is applied.
4.1.5.1 Key Process Area Questionnaire The Key Process Area (KPA) questionnaire is organized around 18 KPA’s in SEI
CMM (Paulk et al. 1995). Determining PMAT is a procedure of deciding percentage of compliance in every KPA (Boehm 2000:34). The level of compliance is established by averaging the scores of the goals for each KPA.
Table 5. KPA Rating Levels
Key Process Areas (KPA)
Alm
ost A
lway
s1
Freq
uent
ly2
Abo
ut H
alf3
Occ
asio
nally
4
Rar
ely
if Ev
er5
Doe
s N
ot A
pply
6
Don
’t K
now
7
Requirements Management
A1 System requirements allocated to software are controlled to establish a baseline for software engineering and management use.
√
A2 Software plans, products, and activities are kept consistent with the system requirements allocated to software.
√
Software Project Planning
B1 Software estimates are documented for use in planning and tracking the software project.
√
B2 Software project activities and commitments are planned and documented.
√
B3 Affected groups and individuals agree to their commitments related to the software project.
√
Software Project Tracking and Oversight
C1 Actual results and performances are tracked against the software plans
√
C2 Corrective actions are taken and managed to closure when actual results and performance deviate significantly from the software plans.
√
C3 Changes to software commitments are agreed to by the affected groups and individuals.
√
Software Subcontract Management D1 The prime contractor selects qualified software subcontractors. √
D2 The prime contractor and the subcontractor agree to their commitments to each other.
√
D3 The prime contractor and the subcontractor maintain ongoing communications.
√
D4 The prime contractor tracks the subcontractor’s actual results and performance against its commitments.
√
Software Quality Assurance (SQA) E1 SQA activities are planned. √

22
Key Process Areas (KPA)
Alm
ost A
lway
s1
Freq
uent
ly2
Abo
ut H
alf3
Occ
asio
nally
4
Rar
ely
if Ev
er5
Doe
s N
ot A
pply
6
Don
’t K
now
7
E2 Adherence of software products and activities to the applicable standards, procedures, and requirements is verified objectively.
√
E3 Affected groups and individuals are informed of software quality assurance activities and results.
√
E4 Noncompliance issues that cannot be resolved within the software project are addressed by senior management.
√
Software Configuration Management (SCM) F1 SCM activities are planned. √ F2 Selected workproducts are identified, controlled, and available. √ F3 Changes to identified work products are controlled. √
F4 Affected groups and individuals are informed of the status and content of software baselines.
√
Organization Process Focus
G1 Software process development and improvement activities are coordinated across the organization.
√
G2 The strengths and weaknesses of the software processes used are identified relative to a process standard.
√
G3 Organization-level process development and improvement activities are planned.
√
Organization Process Definition
H1 A standard software process for the organization is developed and maintained.
√
H2 Information related to the use of the organization’s standard software process by the software projects is collected, reviewed, and made available.
√
Training Program I1 Training activities are planned. √
I2 Training for developing the skills and knowledge needed to perform software management and technical roles is provided.
√
I3 Individuals in the software engineering group and software-related groups receive the training necessary to perform their roles.
√
Integrated Software Management
J1 The project’s defined software process is a tailored version of the organization’s standard software process.
√
J2 The project is planned and managed according to the project’s defined software process.
√
Software Product Engineering
K1 The software engineering tasks are defined, integrated, and consistently performed to produce the software
√
K2 Software work products are kept consistent with each other. √
Intergroup Coordination
L1 The customer’s requirements are agreed to by all affected groups. √
L2 The commitments between the engineering groups are agreed to by the affected groups.
√
L3 The engineering groups identify, track, and resolve intergroup issues.
√
Peer Reviews M1 Peer review activities are planned. √
M2 Defects in the software work products are identified and removed. √
Quantitative Process Management N1 The quantitative process management activities are planned. √

23
Key Process Areas (KPA)
Alm
ost A
lway
s1
Freq
uent
ly2
Abo
ut H
alf3
Occ
asio
nally
4
Rar
ely
if Ev
er5
Doe
s N
ot A
pply
6
Don
’t K
now
7
N2 The process performance of the project’s defined software process is controlled quantitatively.
√
N3 The process capability of the organization’s standard software process is known in quantitative terms.
√
Software Quality Management
O1 The project’s software quality management activities are planned. √
O2 Measurable goals of software product quality and their priorities are defined.
√
O3 Actual progress toward achieving the quality goals for the software products is quantified and managed.
√
Defect Prevention P1 Defect prevention activities are planned. √ P2 Common causes of defects are sought out and identified. √
P3 Common causes of defects are prioritized and systematically eliminated.
√
Technology Change Management Q1 Incorporation of technology changes are planned. √
Q2 New technologies are evaluated to determine their effect on quality and productivity.
√
Q3 Appropriate new technologies are transferred into normal practice across the organization.
√
Process Change Management R1 Continuous process improvement is planned. √
R2 Participation in the organization’s software process improvement activities is organization wide.
√
R3 The organization’s standard software process and the project’s defined software processes are improved continuously.
√
1. Almost always is checked when the goals are consistently achieved and are well
established in standard operating procedures (over 90 percent of the time). 2. Frequently is checked when the goals are achieved relatively often, but sometimes are
omitted under difficult circumstances (about 60 to 90 percent of the time). 3. About half is checked when the goals are achieved about half of the time (about 40 to 60
percent of the time). 4. Occasionally is checked when the goals are sometimes achieved, but less often (about 10
to 40 percent of the time). 5. Rarely if ever is checked when the goals are rarely if ever achieved (less than 10 percent
of the time). 6. Does not apply is checked when knowledge is obtained about the project or organization
and the KPA, but KPA does not apply to the circumstances. 7. Do not know is checked when uncertainties about the KPAs are present.
Rationale
A1. A decisive factor here is that the organization is conducting business on a consultant basis. This should imply that they often trust the contractor to have a functional system development environment. It is thence mostly the customer’s responsibility to manage system requirements (e.g. setting up the development environment). Since this is a customer issue, the organization does thus not have much involvement. They rely on selling a service and their competence, not the actual product.
B3. Commitment culture is the query here, and of course the involved personnel do take full responsibility. At the same time they are dedicated to do their tasks.
24
D. The case study object diminutively works with subcontractors however, when they actually do, the organization has a high level of commitment culture and communication.
E1. SQA is planned with respect to system test. It is more frequently occurring but conceivably unstructured when problems arise.
E2. The organization does not make those kinds of comparisons with any given standard, i.e. such measures are not conducted.
E3. Given that SQA activities and results are present, then the affected groups and individuals are informed. They are not that common though.
F1. It is highly dependant on which customer the organization is cooperating with i.e. it is habitually the contractor decision whether or not to perform SCM.
F4. Communication is an important matter irrespective of formal processes. The interviewee assess that they are particularly advanced in this concern. It is also somewhat associated with the viewpoint of the development process. The organization has a small number of processes that are formalized or systemized. On the other hand, the associates conduct business on an exceedingly professional level with an exceptional quality in communication etc.
G1. Software process development and improvement activities are segments that the organization does not adopt. It is more likely that this is coped with on an individual basis.
J1. There are only a few organization standards, but the ones that exist are adopted in a standard fashion. It is also not that common to apply an entire model. From that perspective, a formal process is per definition not employed in its entire form, but rater adapted to the project characteristics. Then again, there are sometimes circumstances that do not require an organization standard process at all.
K1. It all depends on the specifying level. That is, activities are always communicated and mediated. Otherwise, tasks could hardly be performed at all since no one would know what to do. But neither is e.g. large checklists produced to define work tasks.
K2. As mentioned earlier, they do not produce software in a product line fashion. The business revolves around providing services and competence. Thus, keeping software work products consistent with each other is not a concern that is relevant. E.g. when a product is delivered to the customer it is more or less abandoned there. Because this case study revolves around a service providing organization, it is frequently the case that different projects tend to get dissimilar domains. Fresh knowledge and competence that is gathered from every project is more likely to be managed than software work products.
M1. Peer-reviewing is conducted in an informal fashion i.e. documentation and such activities associated with planning are not present.
N. The organization possesses valuable knowledge regarding process management but is not restricted to its constraints and guidelines.
O1. On a project basis the mode of procedure is somewhat different. The reason is because that it is highly dependant on witch consultants that are involved. Some consultants present planned quantitative process management activities and some do not at all. So the answer is hence an accumulated average to witch extent it exists in the organization.
O2. Quality goals are by Krause et al. (2002) characterized as e.g. effectiveness, productivity, safety, and satisfaction in requirements; obtaining and controlling software product quality by probabilistic model for defect prediction etc. Nicholas (2000:131) concurs with the defect aspect of Krause and emphasizes that quality often is associated with it. The organization does not have a lot of quality goals, at the very utmost number of defects that can subsist. The term is regularly attuned with process goals and this is a concern that the organization does not need to cope with.
O3. It is principally interconnected with the fact that the company has few quality goals. P1. Defect prevention activities such as reviews etc. prior to system tests. P2. That is if some fault systematically generates failures, it is investigated and prevented.

25
P3. Within the project the answer would have been about half but since CMM involves the organization it is less frequent.
Q1. Incorporation of technology changes are planned to this extent in view of the fact that the organization competence is continuously augmented. The company does not have new systems to espouse in this regard. Should a new product emerge, then they simply adopt the newfangled technology. More traditional software businesses might have an entire product line of earlier software solution to upgrade to state-of-the-art. Thus, such organizations tend to reside with old systems for quite some time. This case study object – on the other hand – solves such matters with improving their competence when needed.
Q3. Transferring new technologies into normal practice across the organization is fairly simple in this case since it is merely a subject of knowledge management.
R1. As mentioned earlier, this organization has relatively few processes. This reasoning also applies for R2.
4.2 Cost Drivers See section 3.3.2 for rationale and more clarity for the subsistence of cost drivers.
4.2.1 Product Factors “Product factors account for variation in the effort required to develop software
caused by characteristics of the product under development” (Boehm 2000:41). COCOMO II presupposes that a product that is complex also has high reliability requirements, or incorporates the use of an outsized testing database and thus requires additional time for completion.
4.2.1.1 Required Software Reliability (RELY) RELY is a measure to which degree the application must perform its projected
function over a certain period of time (Boehm 2000:41). Its rating schemes are explicated in Table 6.
Table 6. RELY Cost Driver RELY Descriptors
slight inconvenience
low, easily recoverable losses
moderate, easily recoverable losses
high financial loss
risk to human life
Rating Levels Very Low Low Nominal High Very High Extra
High Effort Multipliers 0.82 0.92 1.00 1.10 1.26 n/a
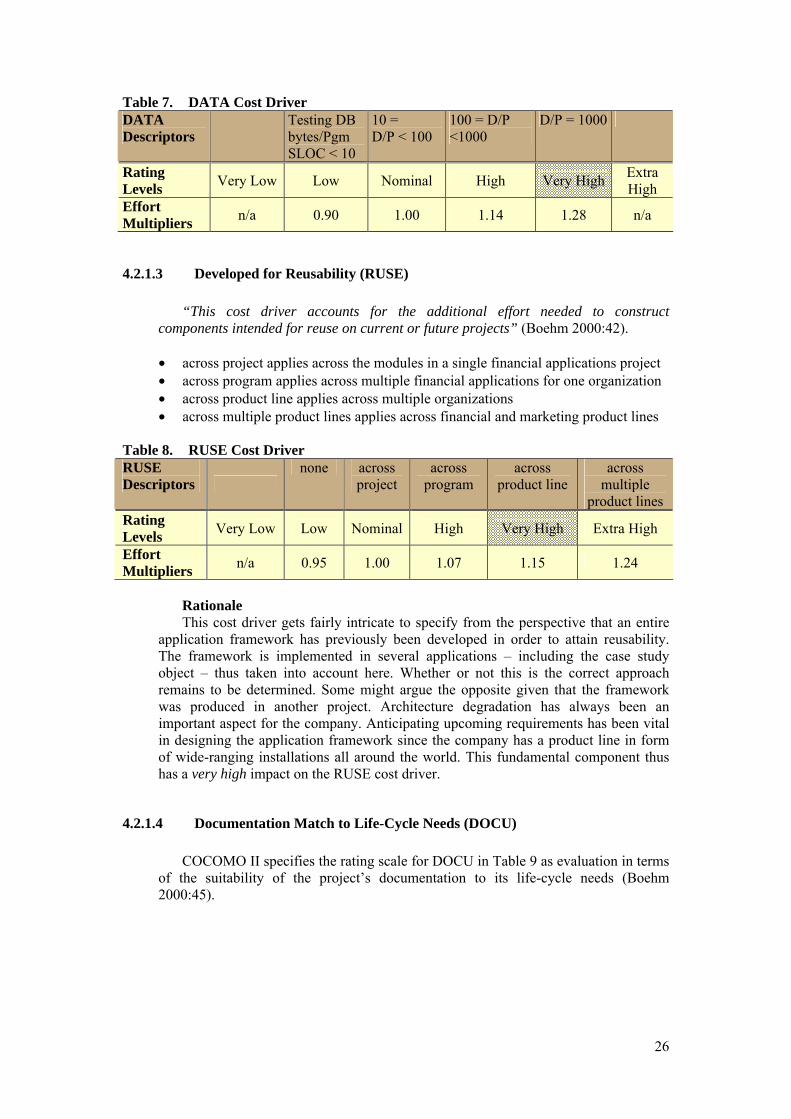
4.2.1.2 Data Base Size (DATA) The DATA cost driver delineated in Table 7 captures the influence test data
requirements have on program development. Its rating is assessed by calculating the ratio of bytes in the testing database to SLOC in the program (Boehm 2000:42). The basis for this cost driver is that database size is important for the reason that of the resources required for generating test data.
26
Table 7. DATA Cost Driver DATA Descriptors
Testing DB bytes/Pgm SLOC < 10
10 = D/P < 100
100 = D/P <1000
D/P = 1000
Rating Levels Very Low Low Nominal High Very High Extra
High Effort Multipliers n/a 0.90 1.00 1.14 1.28 n/a
4.2.1.3 Developed for Reusability (RUSE) “This cost driver accounts for the additional effort needed to construct
components intended for reuse on current or future projects” (Boehm 2000:42).
• across project applies across the modules in a single financial applications project • across program applies across multiple financial applications for one organization • across product line applies across multiple organizations • across multiple product lines applies across financial and marketing product lines
Table 8. RUSE Cost Driver RUSE Descriptors
none across project
across program
across product line
across multiple
product lines Rating Levels Very Low Low Nominal High Very High Extra High
Effort Multipliers n/a 0.95 1.00 1.07 1.15 1.24
Rationale This cost driver gets fairly intricate to specify from the perspective that an entire
application framework has previously been developed in order to attain reusability. The framework is implemented in several applications – including the case study object – thus taken into account here. Whether or not this is the correct approach remains to be determined. Some might argue the opposite given that the framework was produced in another project. Architecture degradation has always been an important aspect for the company. Anticipating upcoming requirements has been vital in designing the application framework since the company has a product line in form of wide-ranging installations all around the world. This fundamental component thus has a very high impact on the RUSE cost driver.
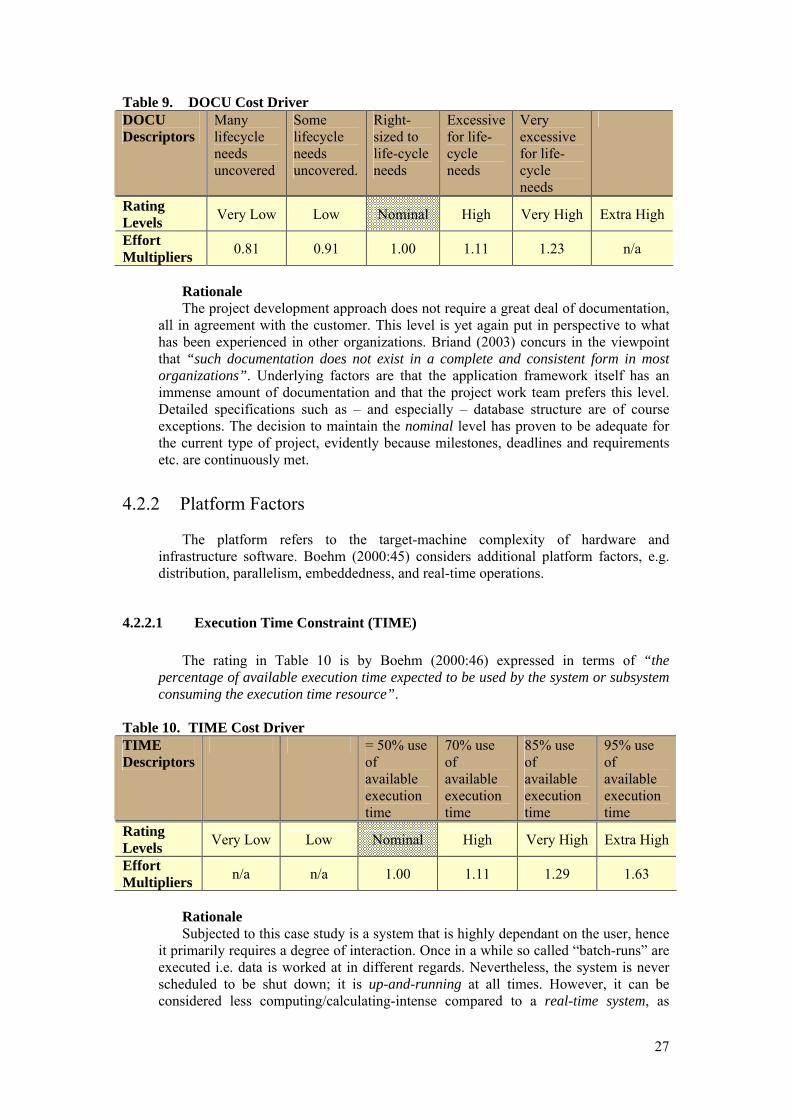
4.2.1.4 Documentation Match to Life-Cycle Needs (DOCU) COCOMO II specifies the rating scale for DOCU in Table 9 as evaluation in terms
of the suitability of the project’s documentation to its life-cycle needs (Boehm 2000:45).
27
Table 9. DOCU Cost Driver DOCU Descriptors
Many lifecycle needs uncovered
Some lifecycle needs uncovered.
Right-sized to life-cycle needs
Excessive for life-cycle needs
Very excessive for life-cycle needs
Rating Levels Very Low Low Nominal High Very High Extra High
Effort Multipliers 0.81 0.91 1.00 1.11 1.23 n/a
Rationale The project development approach does not require a great deal of documentation,
all in agreement with the customer. This level is yet again put in perspective to what has been experienced in other organizations. Briand (2003) concurs in the viewpoint that “such documentation does not exist in a complete and consistent form in most organizations”. Underlying factors are that the application framework itself has an immense amount of documentation and that the project work team prefers this level. Detailed specifications such as – and especially – database structure are of course exceptions. The decision to maintain the nominal level has proven to be adequate for the current type of project, evidently because milestones, deadlines and requirements etc. are continuously met.
4.2.2 Platform Factors The platform refers to the target-machine complexity of hardware and
infrastructure software. Boehm (2000:45) considers additional platform factors, e.g. distribution, parallelism, embeddedness, and real-time operations.
4.2.2.1 Execution Time Constraint (TIME) The rating in Table 10 is by Boehm (2000:46) expressed in terms of “the
percentage of available execution time expected to be used by the system or subsystem consuming the execution time resource”.
Table 10. TIME Cost Driver TIME Descriptors
= 50% use of available execution time
70% use of available execution time
85% use of available execution time
95% use of available execution time
Rating Levels Very Low Low Nominal High Very High Extra High
Effort Multipliers n/a n/a 1.00 1.11 1.29 1.63
Rationale Subjected to this case study is a system that is highly dependant on the user, hence
it primarily requires a degree of interaction. Once in a while so called “batch-runs” are executed i.e. data is worked at in different regards. Nevertheless, the system is never scheduled to be shut down; it is up-and-running at all times. However, it can be considered less computing/calculating-intense compared to a real-time system, as

28
described in Burns and Wellings (2001:7). In conclusion; even though the system is available at all times, it can periodically be idle with the exception of data arrangement.
4.2.2.2 Main Storage Constraint (STOR) Table 11 extracted from Boehm (2000:46) specifies a rating that represents the
degree of main storage constraint imposed on a software system or subsystem.
Table 11. STOR Cost Driver STOR Descriptors
= 50% use of available storage
70% use of available storage
85% use of available storage
95% use of available storage
Rating Levels Very Low Low Nominal High Very High Extra High
Effort Multipliers n/a n/a 1.00 1.05 1.17 1.46
Rationale Data storage constraints are not big issues for this application. A vast amount of
data is persistently accrued. The system conforms to the principle of retrieving and accessing previously processed information. Additional disks are brought in should the database become used to its maximal limit. No compromises can what so ever be made in the expense of the database size. In addition, some natural data wastage is a reoccurring phenomenon.
4.2.2.3 Platform Volatility (PVOL) PVOL in Table 12 is implies the complexity of hardware and software products
calls on to perform its tasks. “The platform includes any compilers or assemblers supporting the development of the software system” (Boehm 2000:47). Development of e.g. software as OS formulates the platform as the computer hardware. Development of e.g. database management system originates the platform as hardware and OS. Network text browser development specifies the platform as the network, computer hardware, the operating system, and the distributed information repositories.
Table 12. PVOL Cost Driver PVOL Descriptors
Major change every 12 mo.; Minor change every 1 mo.
Major: 6 mo.; Minor: 2 wk.
Major: 2 mo.; Minor: 1 wk.
Major: 2 wk.; Minor: 2 days
Rating Levels
Very Low Low Nominal High Very High Extra
High Effort Multipliers n/a 0.87 1.00 1.15 1.30 n/a
Rationale As mentioned in the case study description, the project (and organization) is
specialized in working with the Oracle platform. Updates in project applications are fairly rare in relation to new platform version introductions. I.e. the case study object has primarily been developed using Oracle8i and Oracle9i. Even though 10g editions

29
are recently marketed, the application henceforth executes on versions it was developed with. Should defect issues in the platform be revealed and new editions are made available, then of course such minor updates are made. When enough new versions of Oracle have been marketed e.g. support of earlier versions is not longer available etc, decisions about modernizing are arranged. Some updates are thus deliberately disregarded in favor for the latest one.
4.2.3 Personnel Factors Personnel factors have the strongest affect on effort required to develop software
compared to other cost drivers. “These ratings are most likely to change during the course of a project reflecting the gaining of experience or the rotation of people onto and off the project” (Boehm 2000:47). Personnel factors rank the development team’s capability and experience but exclude the individual aspect.
4.2.3.1 Analyst Capability (ACAP) ACAP considers personnel who work on requirements, high-level design and
detailed design hence, accompanying attributes are analysis and design ability, efficiency and thoroughness, and the ability to communicate and cooperate (Boehm 2000:47). Table 13 does not reflect on the level of experience of the analyst. APEX, LTEX, and PLEX are used in the rating of this attribute.
Table 13. ACAP Cost Driver ACAP Descriptors
15th percentile
35th percentile
55th percentile
75th percentile
90th percentile
Rating Levels Very Low Low Nominal High Very High Extra
High Effort Multipliers 1.42 1.19 1.00 0.85 0.71 n/a
Rationale Analysts devoted to this project are some of the best in the business. Systems have
been installed in various locations around the world and these analysts have always been involved. The interviewee adds that it is thence not likely that better personnel subsist in the domain. They are in other words exceptional.
4.2.3.2 Programmer Capability (PCAP) Evaluating PCAP should be founded on the capability of the programmers as a
team rather than as individuals hence, associated factors ought to be ability, efficiency and thoroughness, and the ability to communicate and cooperate (Boehm 2000:48). Table 14 does not reflect on the level of experience of the programmer. APEX, LTEX, and PLEX are used in the rating of this attribute.
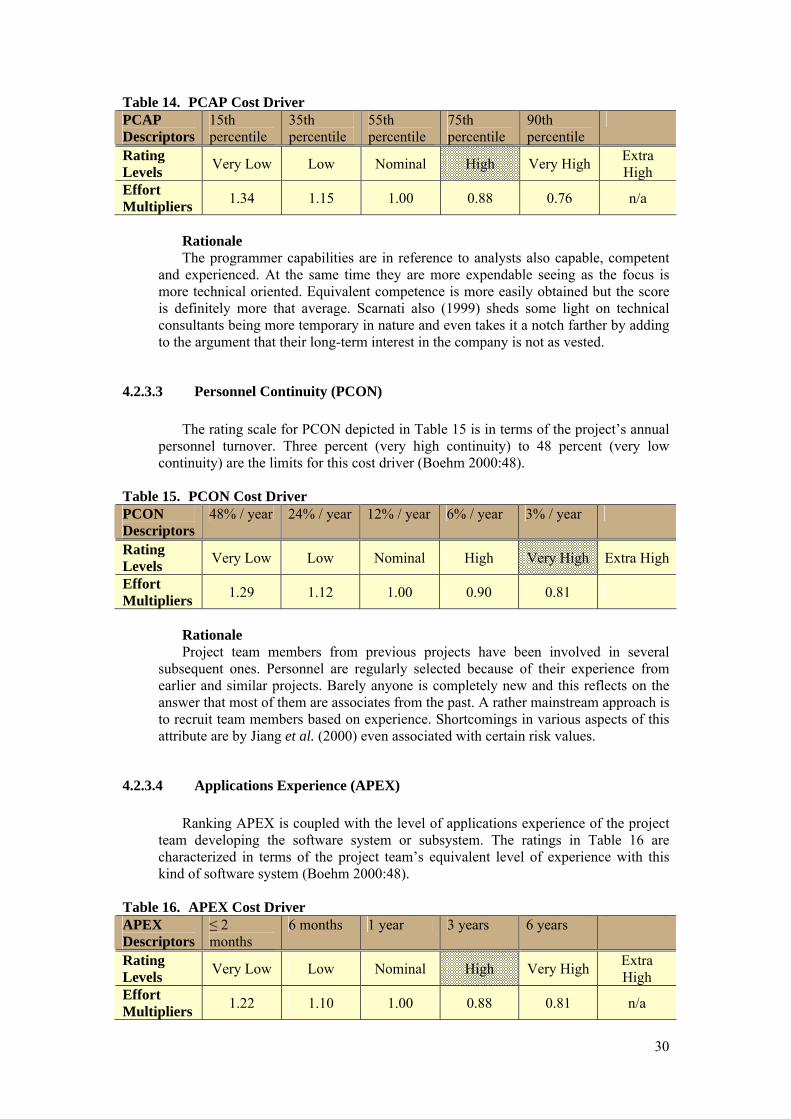
30
Table 14. PCAP Cost Driver PCAP Descriptors
15th percentile
35th percentile
55th percentile
75th percentile
90th percentile
Rating Levels Very Low Low Nominal High Very High Extra
High Effort Multipliers 1.34 1.15 1.00 0.88 0.76 n/a
Rationale The programmer capabilities are in reference to analysts also capable, competent
and experienced. At the same time they are more expendable seeing as the focus is more technical oriented. Equivalent competence is more easily obtained but the score is definitely more that average. Scarnati also (1999) sheds some light on technical consultants being more temporary in nature and even takes it a notch farther by adding to the argument that their long-term interest in the company is not as vested.
4.2.3.3 Personnel Continuity (PCON) The rating scale for PCON depicted in Table 15 is in terms of the project’s annual
personnel turnover. Three percent (very high continuity) to 48 percent (very low continuity) are the limits for this cost driver (Boehm 2000:48).
Table 15. PCON Cost Driver PCON Descriptors
48% / year 24% / year 12% / year 6% / year 3% / year
Rating Levels Very Low Low Nominal High Very High Extra High
Effort Multipliers 1.29 1.12 1.00 0.90 0.81
Rationale Project team members from previous projects have been involved in several
subsequent ones. Personnel are regularly selected because of their experience from earlier and similar projects. Barely anyone is completely new and this reflects on the answer that most of them are associates from the past. A rather mainstream approach is to recruit team members based on experience. Shortcomings in various aspects of this attribute are by Jiang et al. (2000) even associated with certain risk values.
4.2.3.4 Applications Experience (APEX) Ranking APEX is coupled with the level of applications experience of the project
team developing the software system or subsystem. The ratings in Table 16 are characterized in terms of the project team’s equivalent level of experience with this kind of software system (Boehm 2000:48).
Table 16. APEX Cost Driver APEX Descriptors
≤ 2 months
6 months 1 year 3 years 6 years
Rating Levels Very Low Low Nominal High Very High Extra
High Effort Multipliers 1.22 1.10 1.00 0.88 0.81 n/a
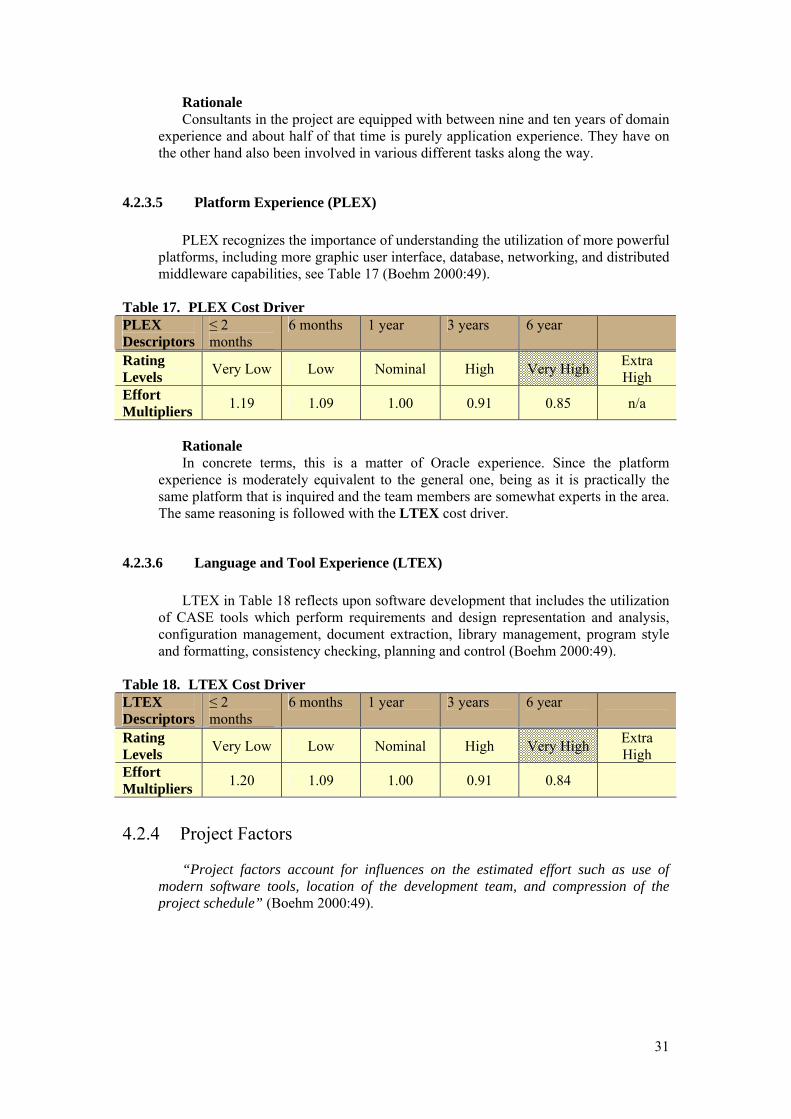
31
Rationale Consultants in the project are equipped with between nine and ten years of domain
experience and about half of that time is purely application experience. They have on the other hand also been involved in various different tasks along the way.
4.2.3.5 Platform Experience (PLEX) PLEX recognizes the importance of understanding the utilization of more powerful
platforms, including more graphic user interface, database, networking, and distributed middleware capabilities, see Table 17 (Boehm 2000:49).
Table 17. PLEX Cost Driver PLEX Descriptors
≤ 2 months
6 months 1 year 3 years 6 year
Rating Levels Very Low Low Nominal High Very High Extra
High Effort Multipliers 1.19 1.09 1.00 0.91 0.85 n/a
Rationale In concrete terms, this is a matter of Oracle experience. Since the platform
experience is moderately equivalent to the general one, being as it is practically the same platform that is inquired and the team members are somewhat experts in the area. The same reasoning is followed with the LTEX cost driver.
4.2.3.6 Language and Tool Experience (LTEX) LTEX in Table 18 reflects upon software development that includes the utilization
of CASE tools which perform requirements and design representation and analysis, configuration management, document extraction, library management, program style and formatting, consistency checking, planning and control (Boehm 2000:49).
Table 18. LTEX Cost Driver LTEX Descriptors
≤ 2 months
6 months 1 year 3 years 6 year
Rating Levels Very Low Low Nominal High Very High Extra
High Effort Multipliers 1.20 1.09 1.00 0.91 0.84
4.2.4 Project Factors “Project factors account for influences on the estimated effort such as use of
modern software tools, location of the development team, and compression of the project schedule” (Boehm 2000:49).

32
4.2.4.1 Use of Software Tools (TOOL) TOOL incorporates the process of using CASE tools support for the development
which reflects upon the capability, maturity, and integration of them, see Table 19 (Boehm 2000:50).
Table 19. TOOL Cost Driver TOOL Descriptors
edit, code, debug
simple, frontend, backend CASE, little integration
basic lifecycle tools, moderately integrated
strong, mature lifecycle tools, moderately integrated
strong, mature, proactive life-cycle tools, well integrated with processes, methods, reuse
Rating Levels Very Low Low Nominal High Very High Extra
High Effort Multipliers 1.17 1.09 1.00 0.90 0.78 n/a
Rationale Traditional system development tools are utilized in the project. None that can be
considered immense automated or/and integrated, unless 4GL is included. The latter is chosen not to be counted for this cost driver.
4.2.4.2 Multisite Development (SITE) Determining the SITE cost driver rating involves the assessment and judgement-
based averaging of site collocation and communication support as described in Table 20 (Boehm 2000:50).
Table 20. SITE Cost Driver Collocation Descriptors
International
Multi-city and Multi-company
Multi-city or Multi-company
Same city or metro. area
Same building or complex
Fully collocated
Communications Descriptors
Some phone, mail
Individual phone, FAX
Narrow band email
Wideband electronic communication.
Wideband elect. comm., occasional video conf.
Interactive multimedia
Rating Levels Very Low Low Nominal High Very High Extra High
Effort Multipliers 1.22 1.09 1.00 0.93 0.86 0.80

33
4.2.4.3 Required Development Schedule (SCED) The rating for SCED is defined in terms of the percentage of schedule stretch-out
or acceleration with respect to a nominal schedule for a project requiring a given amount of effort. Table 21 delineates that accelerated schedules produces more effort in initializing phases in order to eliminate risks and refine the architecture, but more effort in concluding processes to achieve more system tests and documentation. Stretch-outs in schedule are by Boehm (2000:50) not considered as adding to or decreasing the effort in developing software.
Table 21. SCED Cost Driver SCED Descriptors
75% of nominal
85% of nominal
100% of nominal
130% of nominal
160% of nominal
Rating Level Very Low Low Nominal High Very High Extra
High Effort Multiplier 1.43 1.14 1.00 1.00 1.00 n/a
Rationale The case study project was carried out in a normal fashion i.e.; no extra effort was
put into commencing activities so that time would be gained in the favor of concluding processes or risk elimination etc. The plan that was produced in the beginning was followed accordingly.
4.3 Chapter Summary This chapter enclosed the data collection of the case study and was designed based
on the COCOMO II model scale factors and effort multipliers retrieval. Scale factors are an aggregation of five different aspects on software development namely; Precedentedness (PREC), Development Flexibility (FLEX), Architecture/Risk Resolution (RESL), Team Cohesion (TEAM), and Process Maturity (PMAT). PREC is founded on the rationale that if a product is similar to several previously developed projects, then the precedentedness is high. FLEX elucidates the need for software conformance with preestablished requirements and with external interface specifications, whereas RESL identifies issues concerning risk management plans and architectural matters. TEAM on the other hand accounts for sources of project instability and entropy for the reason that of intricacy in synchronizing stakeholders of a project, and finally, PMAT was determined using a structure around the SEI CMM. However when an organization does not have a certified CMM-level, the Key Process Area (KPA) questionnaire is utilized which is organized around 18 KPA’s in the SEI CMM.
Cost drivers are a composition of four special views of software development that drives the cost. Product factors account for the degree of complexity in products and associated reliability requirements. The system’s complexity of hardware and infrastructure software is referred to by platform factors. Personnel factors have the strongest affect on effort required to develop software. They rank the development team’s capability and experience but exclude the individual perspective. Influences on estimated cost e.g. utilization of CASE tools, the location of development personnel, and compression of the project schedule is accounted for by project factors.

34
Data Validation and Application
Chapter
“Obstacles cannot crush me. Every obstacle yields to stern resolve. He who is fixed to a
star does not change his mind.”
Leonardo da Vinci
After gathering project information it is now time to evaluate the data to assess the
consistency and validity. Also, since the model has previously been defined, the next step is to apply the data to COCOMO II. This chapter hence merges the two previous ones into a more comprehensive reproduction.
5.1 Data Validation More samples than one interviewee would be preferable when collecting data to
the model. However, those kinds of resources were not possible to obtain. Under better circumstances, observations over a period of time in the organization and project would possibly result in more accurate information. The outcome of the predictions is thus highly risk associated with this one sample. On the other hand, the source is in a position to have sufficient knowledge about the present circumstances. The following sections have the intention to scrutinizing these uncertainties. When introducing various anomalies in the text, they are intentionally left out for discussion in subsequent chapter. The purpose of the evaluation and application is to estimate effort in an initializing step.
5.1.1 Scale Factors COCOMO II defines PREC as being high if the product is similar to several
previously developed projects. A company investigation revealed that prior to the initialization of the project at it all started with a few consultants working with the customer at a consultant basis, thus developing in a consultant commission fashion. The organization pondered over the possibility that these kinds of systems could be somewhat interesting for similar customers around the world. A direct consequence of these visions was that the current application under development started to progress in a rather expected direction and an application framework was produced out of the initial system to diminish the redundancy in future development. With these aspects in mind, an extra high PREC in general is well justified.
The data collection revealed a very low FLEX with the motive being that the system has indeed immense conformance constraints with external interface specifications etc. Should the customer specify that a service needed to be part of the system, then that could not be negotiated with. Solutions when dealing with such issues was e.g. hard implementation, which enables same functionality in time but will
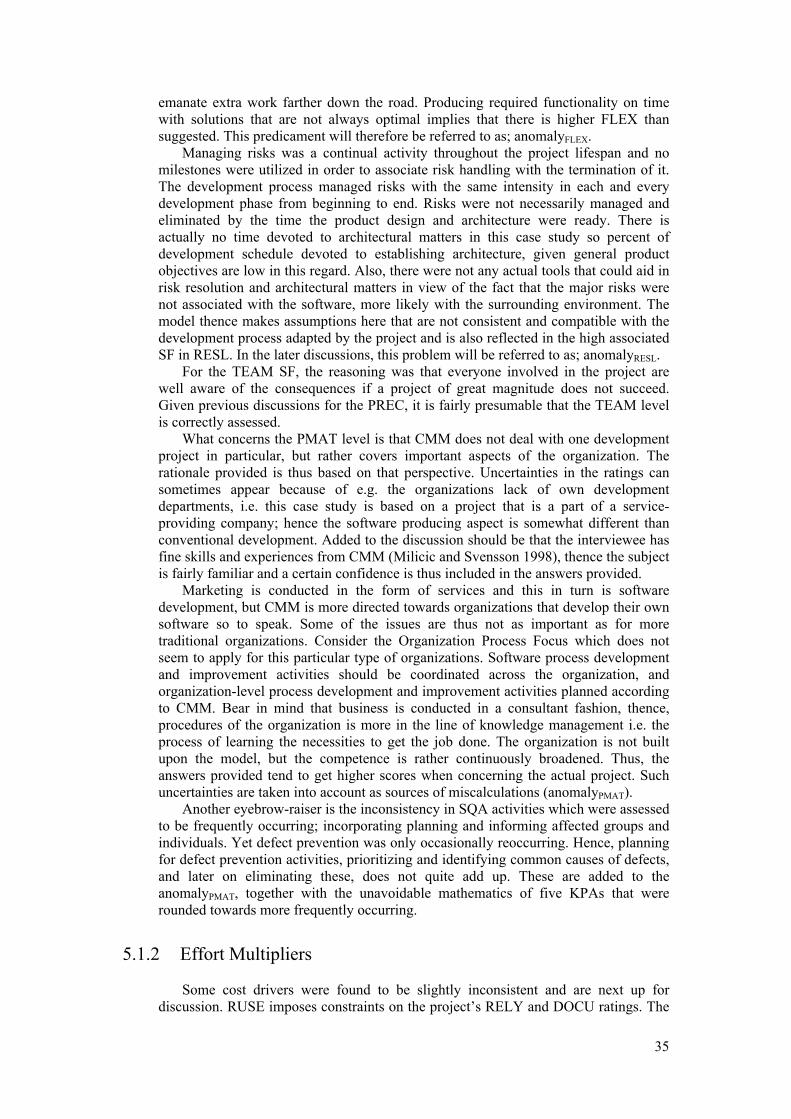
35
emanate extra work farther down the road. Producing required functionality on time with solutions that are not always optimal implies that there is higher FLEX than suggested. This predicament will therefore be referred to as; anomalyFLEX.
Managing risks was a continual activity throughout the project lifespan and no milestones were utilized in order to associate risk handling with the termination of it. The development process managed risks with the same intensity in each and every development phase from beginning to end. Risks were not necessarily managed and eliminated by the time the product design and architecture were ready. There is actually no time devoted to architectural matters in this case study so percent of development schedule devoted to establishing architecture, given general product objectives are low in this regard. Also, there were not any actual tools that could aid in risk resolution and architectural matters in view of the fact that the major risks were not associated with the software, more likely with the surrounding environment. The model thence makes assumptions here that are not consistent and compatible with the development process adapted by the project and is also reflected in the high associated SF in RESL. In the later discussions, this problem will be referred to as; anomalyRESL.
For the TEAM SF, the reasoning was that everyone involved in the project are well aware of the consequences if a project of great magnitude does not succeed. Given previous discussions for the PREC, it is fairly presumable that the TEAM level is correctly assessed.
What concerns the PMAT level is that CMM does not deal with one development project in particular, but rather covers important aspects of the organization. The rationale provided is thus based on that perspective. Uncertainties in the ratings can sometimes appear because of e.g. the organizations lack of own development departments, i.e. this case study is based on a project that is a part of a service-providing company; hence the software producing aspect is somewhat different than conventional development. Added to the discussion should be that the interviewee has fine skills and experiences from CMM (Milicic and Svensson 1998), thence the subject is fairly familiar and a certain confidence is thus included in the answers provided.
Marketing is conducted in the form of services and this in turn is software development, but CMM is more directed towards organizations that develop their own software so to speak. Some of the issues are thus not as important as for more traditional organizations. Consider the Organization Process Focus which does not seem to apply for this particular type of organizations. Software process development and improvement activities should be coordinated across the organization, and organization-level process development and improvement activities planned according to CMM. Bear in mind that business is conducted in a consultant fashion, thence, procedures of the organization is more in the line of knowledge management i.e. the process of learning the necessities to get the job done. The organization is not built upon the model, but the competence is rather continuously broadened. Thus, the answers provided tend to get higher scores when concerning the actual project. Such uncertainties are taken into account as sources of miscalculations (anomalyPMAT).
Another eyebrow-raiser is the inconsistency in SQA activities which were assessed to be frequently occurring; incorporating planning and informing affected groups and individuals. Yet defect prevention was only occasionally reoccurring. Hence, planning for defect prevention activities, prioritizing and identifying common causes of defects, and later on eliminating these, does not quite add up. These are added to the anomalyPMAT, together with the unavoidable mathematics of five KPAs that were rounded towards more frequently occurring.
5.1.2 Effort Multipliers Some cost drivers were found to be slightly inconsistent and are next up for
discussion. RUSE imposes constraints on the project’s RELY and DOCU ratings. The

36
RELY rating should be at most one level below the RUSE rating. The DOCU rating should be at least nominal for nominal and high RUSE ratings and at least high for very high and extra high RUSE ratings (Boehm 2000:42).
Now recollect the data collection from section 4.2 and find that the RELY rating was established to high, whilst DOCU was nominal, and RUSE very high. According to the COCOMO II constraints, the RELY and RUSE levels are consistent, but RELY and DOCU are in conflict. The model thus assumes that the difference between these cost drives is in strong correlation with each other. However, this was not the interpretation from the data collection, but the dependency will be analyzed as the anomalyDOCU.
ACAP disclosed as a rating of extra high and is thus out of range of the applied rating level. Since this effort multiplier deviate significantly and falls out of scope, suspicions of subjectivity in the rational are raised. A direct reflection of it was that the level should indeed be extra high if better personnel not likely subsist in the domain. However, when evaluating the ACAP description, it is defined as analysis and design ability, efficiency and thoroughness, and the ability to communicate and cooperate. This is not reflected in the information provided. An anomalyACAP is thus introduced that can have some effects on the effort estimation.
One cost driver is intentionally left without any calibration to it – Product Complexity (CPLX). Complexity is divided into five areas: control operations, computational operations, device-dependent operations, data management operations, and user interface management operations (Boehm 2000:42). As seen from Table 22, this can have an effort estimate impact that varies from a factor of 0.73 to 1.74.
Table 22. CPLX Cost Driver Rating Level Very Low Low Nominal High Very High Extra High EM 0.73 0.87 1.00 1.17 1.34 1.74
The reason for the exclusion of this cost driver is coupled with the unreasonable
information that needs to be established for the correct assessment to be made. Component complexity ratings levels are defined in terms of: control operations; computational operations; device-dependent operations; data management operations; and user interface management operations. These together enclose definitions such as:
• multiple resource scheduling with dynamically changing priorities • difficult and unstructured numerical analysis: highly accurate analysis of
noisy, stochastic data, and complex parallelization • device timing-dependent coding, micro-programmed operations,
performance-critical embedded systems • highly coupled, dynamic relational and object structures, and/or natural
language data management • widget set development and extension, natural language interface
Not only are they difficult to interpret, they are exhaustingly time consuming to
correctly establish. It entices the user to perform a guesstimate. Rater than doing so, an anomalyCPLX will scrutinize the impacts of miscalculations in the effort multipliers.
5.1.3 SLOC Implications of establishing the size parameter in this case study has been twofold.
The application was developed using a 3GL and a 4GL language and it has caused some difficulties at both fronts. A frequent question is what defines a line of source code. The COCOMO II model definition in the Appendix defines a logical line of code. Clark et al. (1998) however excogitates that the data collected exhibits local
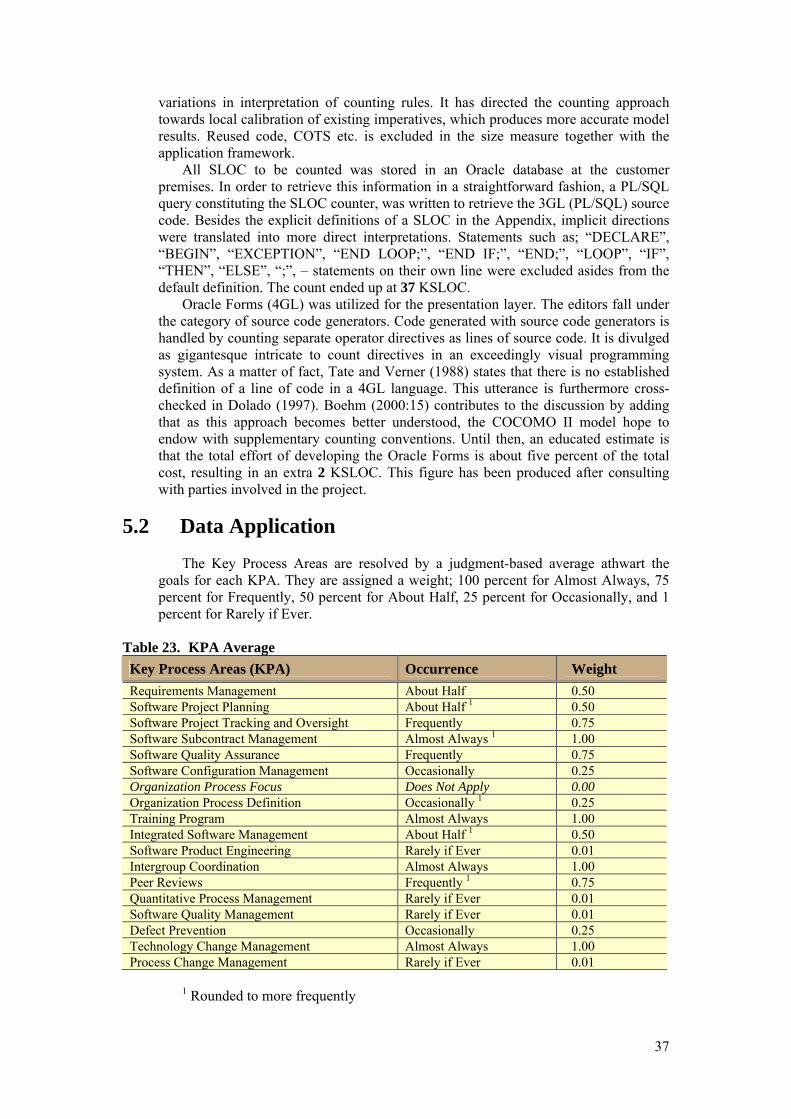
37
variations in interpretation of counting rules. It has directed the counting approach towards local calibration of existing imperatives, which produces more accurate model results. Reused code, COTS etc. is excluded in the size measure together with the application framework.
All SLOC to be counted was stored in an Oracle database at the customer premises. In order to retrieve this information in a straightforward fashion, a PL/SQL query constituting the SLOC counter, was written to retrieve the 3GL (PL/SQL) source code. Besides the explicit definitions of a SLOC in the Appendix, implicit directions were translated into more direct interpretations. Statements such as; “DECLARE”, “BEGIN”, “EXCEPTION”, “END LOOP;”, “END IF;”, “END;”, “LOOP”, “IF”, “THEN”, “ELSE”, “;”, – statements on their own line were excluded asides from the default definition. The count ended up at 37 KSLOC.
Oracle Forms (4GL) was utilized for the presentation layer. The editors fall under the category of source code generators. Code generated with source code generators is handled by counting separate operator directives as lines of source code. It is divulged as gigantesque intricate to count directives in an exceedingly visual programming system. As a matter of fact, Tate and Verner (1988) states that there is no established definition of a line of code in a 4GL language. This utterance is furthermore cross-checked in Dolado (1997). Boehm (2000:15) contributes to the discussion by adding that as this approach becomes better understood, the COCOMO II model hope to endow with supplementary counting conventions. Until then, an educated estimate is that the total effort of developing the Oracle Forms is about five percent of the total cost, resulting in an extra 2 KSLOC. This figure has been produced after consulting with parties involved in the project.
5.2 Data Application The Key Process Areas are resolved by a judgment-based average athwart the
goals for each KPA. They are assigned a weight; 100 percent for Almost Always, 75 percent for Frequently, 50 percent for About Half, 25 percent for Occasionally, and 1 percent for Rarely if Ever.
Table 23. KPA Average Key Process Areas (KPA) Occurrence Weight Requirements Management About Half 0.50 Software Project Planning About Half 1 0.50 Software Project Tracking and Oversight Frequently 0.75 Software Subcontract Management Almost Always 1 1.00 Software Quality Assurance Frequently 0.75 Software Configuration Management Occasionally 0.25 Organization Process Focus Does Not Apply 0.00 Organization Process Definition Occasionally 1 0.25 Training Program Almost Always 1.00 Integrated Software Management About Half 1 0.50 Software Product Engineering Rarely if Ever 0.01 Intergroup Coordination Almost Always 1.00 Peer Reviews Frequently 1 0.75 Quantitative Process Management Rarely if Ever 0.01 Software Quality Management Rarely if Ever 0.01 Defect Prevention Occasionally 0.25 Technology Change Management Almost Always 1.00 Process Change Management Rarely if Ever 0.01
1 Rounded to more frequently

38
An Equivalent Process Maturity Level (EMPL) is computed as five times the average compliance level of all rated KPAs. Does Not Apply is not counted and the number of KPAs is thus summed up to 17.
17 EMPL = 5 x ( ∑ KPA% i / 100 ) / 17 i = 1
The EMPL was calculated to 2.51, reflecting on an equivalent CMM Level 2,
derived from Table 24.
Table 24. PMAT Ratings for Estimated Process Maturity Level (EPML) PMAT Rating Maturity Level EPML
Very Low CMM Level 1 (lower half) 0 Low CMM Level 1 (upper half) 1 Nominal CMM Level 2 2 High CMM Level 3 3 Very High CMM Level 4 4 Extra High CMM Level 5 5
Table 25 demonstrates the weights for each SF in a particular level (Boehm
2000:32). Next to each SF are the choices (in parenthesis) made in the data collection section 4.1. A calculated average for every SF will constitute as parameter in order to determine E, in the equation below.
Table 25. Scale Factors for COCOMO.II Early Design and Post-Architecture Models Scale Factors (SFj)
Very Low Low Nominal High Very High Extra High
PREC thoroughly unprecedented
6.20 (0)
largely unprecedented
4.96
somewhat unprecedented
3.72 (0.5)
generally familiar
2.48 (0.5)
largely familiar
1.24
thoroughly familiar
0.00 (3)
FLEX rigorous
5.07 (3)
occasional relaxation
4.05
some relaxation
3.04 (0)
general conformity
2.03 (0)
some conformity
1.01
general goals
0.00 (0)
RESL1 little (20%)
7.07 (2)
some (40%)
5.65 (2)
often (60%)
4.24 (0)
generally (75%)
2.83 (1)
mostly (90%)
1.41 (1)
full (100%)
0.00 (1) TEAM very difficult
interactions
5.48 (0)
some difficult interactions
4.38 (0)
basically cooperative interactions
3.29 (1)
largely cooperative
2.19 (1)
highly cooperative
1.10 (1)
seamless interactions
0.00 (1) (Weighted average of “Yes” answers to CMM Maturity Questionnaire) The estimated Equivalent Process Maturity Level (EPML) or
PMAT
SW-CMM Level 1 Lower
7.80
SW-CMM Level 1 Upper
6.24
SW-CMM Level 2
4.68
SW-CMM Level 3
3.12
SW-CMM Level 4
1.56
SW-CMM Level 5
0.00 1. % significant module interfaces specified, % significant risks eliminated. Averaging SF1, SF2, SF3, and SF4, generates the subsequent values: 0.78PREC,
5.07FLEX, 4.24RESL, and 1.65TEAM. Equivalent CMM Level 2 corresponds to 4.68PMAT.

39
5 E = B + 0.01 ∑ SF j j = 1
B = 0.91 (for COCOMO II.2000)
The exponent E in the effort estimation equation calculates to 1.07 in the equation
above, reflecting on that the project exhibits diseconomies of scale. Table 26 is a cost driver overview that reflects on the data collection of rating levels made in section 4.2.
Table 26. Cost Driver Overview Cost Driver Rating Level Effort Multiplier RELY High 1.10 DATA Very High 1.28 RUSE Very High 1.15 DOCU Nominal 1.00 TIME Nominal 1.00 STOR Low n/a PVOL Low 0.87 ACAP Extra High n/a PCAP High 0.88 PCON Very High 0.81 APEX High 0.88 PLEX Very High 0.85 LTEX Very High 0.84 TOOL Nominal 1.00 SITE (Very Low) and (Extra High) 1.01 (0.5x1.22 + 0.5x0.80) SCED Nominal 1.00 CPLX Nominal 1.00
Calibrating EM1-17 (Table 26), results in a product of 0.64 that deviates
significantly from the default nominal value of 1.00. The remaining consideration, Size, has previously been established to 39 (KSLOC), and is thus applied together with preestablished parameters in the following formula.
17 PM = A x SizeE ∏ EM i i = 1
A = 2.94 (for COCOMO II.2000)
COCOMO II generates an estimate of 95.9 PM that is multiplied with the assumed
152 PH (Person-hours) per PM, as discussed in section 3.1. Those factors subsequently produce a product of 14577 PH for the entire project.
5.3 Chapter Summary Validating the collected data expounded that more samples would be preferable in
order to correctly assess the true figures used as parameters for the model. Anomalies were also introduced to unravel inconsistencies in interpreting COCOMO II definitions. The mode of procedure for sizing the application was delineated and local variations demonstrated explicit construes. An outcome of this chapter concluded preliminary estimates – applied devoid of anomaly alteration – that are scrutinized in ensuing discussions.

40
Research Findings
Chapter
“There are a million ways to lose a work day, but not even a single way to get one back.”
Tom DeMarco
As seen form the model and data application, the estimated effort of 95.9 PM now
needs to be put in perspective of the actual effort. Recall from the case description that the true figure was actually 9938 PH. COCOMO II withal assumes a PM to be 152 PH, and as a result the actual PM is hence 65.4 (9938 / 152). The model thus estimates an additional 47 percent effort, which can not be considered as especially precise. Please note that the default calibration of A (2.94) has been applied, and will perhaps require altering. But before this relationship is analyzed, lets se how the anomalies has impacted the estimate.
6.1 Anomalies AnomalyFLEX implied that there could be more FLEX than initially assessed.
Altering this SF one level generates a new SF with the value 4.05 (instead of 5.07). COCOMO II also made assumptions about risk resolution and architecture that was brought together in anomalyRESL. Therefore the initial value of 4.24 is modified to 2.83. A different PMAT could not be obtained no matter how the KPAs within the scope of anomalyPMAT were adjusted. It is thus left at its original status. By conforming to the models recommendations about the dependencies of RELY and DOCU encapsulated in anomalyDOCU, the nominal effort multiplier is changed to 1.11.
The rating scale for COCOMO II is subjectively leading to inconsistencies across different organizations and the rating of the personnel factors ACAP, was shown to be particularly susceptible to this unwanted variation. AnomalyACAP suggests that the effort multiplier is changed to a lower rank from the preliminary N/A to 0.71. The observant reader has probably notice that by lowering the grade of analyst capabilities suddenly decreases the effort of developing the software – a highly remarkable feature that the model needs to either specify differently or, to make an evaluation of such consequences.
Applying this adjusted data to the model all of the sudden generates an exceedingly accurate precision. PM has now, instead of the original 95.9 PM, shifted into an effort of 69.1 or in other words, only six percent additional to the actual effort. Still, the anomalyCPLX is yet to be applied and the interval of the factors 0.73 to 1.74 produces a variation in effort from 50.4 PM to 120.2, which drastically impacts the calculations. These worst-case scenarios are however dismissed by the organization consultants as fairly unreasonable and concur in the nominal viewpoint that was originally appraised.
41
6.2 Sizing Implications One of the problems with effort estimation models are that they are at an early
stage in the software engineering process dependant on knowing actual size on the system before it can be expressed in e.g. SLOC. Vliet (2000:169) emphasis that in such cases the time estimation problem is simply transferred into a size estimation problem. Studies accomplished by Musilek et al. (2002) presents the conclusions that the most significant input to the COCOMO II model is size. This parameter can be viewed as a special cost driver in that it has an exponential dependency on the effort. The aggregation of the five scale factors constitutes this behavior.
COCOMO II supports the use of either function points or source lines of code. However, the model does not recommend using SLOC as a general productivity metric. Different languages to develop software result in higher productivity at higher language levels. This is typically the case in this investigation. That is why the SLOC checklist has been extended using local interpretations of the implicit definitions to produce a more realistic count. Nonetheless, the model promotes the use of function points as a general sizing parameter for estimation. What can be misleading is that pure function points gives the same cost, schedule or quality estimate for a program with the same functionality developed using different language levels. Function point-based estimations – and SLOC for that matter – needs to use some form of backfiring to account for the difference in implementation languages. This is not necessarily true for an organization that always uses the same programming level. That is why the organization subjected to this case study is part of the exception. They specialize in the Oracle platform and might as well use the SLOC metric as long as they are aware of the implications when relating it to dissimilar projects. The use of pure function points as the sizing metric for estimation is hence equally accepted in the same sense as SLOC under these productivity metric circumstances.
Because size in SLOC is clearly dependant on the choice of programming language, it can lead to complicatedness in characterizing the actual amount of functionality in a software system, and in appraising developer efficiency. Stutzke (2000) conveys that the effort of producing software is established by more than merely the effort of the tangible implementation procedure. Considerable resources are depleted in documenting, designing, and testing.
The promotion of backfiring tables has also been excogitated by Reifer (2002). In that study, empirically developed backfiring ratios converting web objects to SLOC was elaborated. For example, if the web objects were done in Java, they would have an equivalent assumed conversion ratio of 32 Java lines per web object. Backfiring is thence important because of the differences in programming levels. Reifer (2002) reported that the accuracy increased by as much as 12 percent in two out of five application domains when calibrating this parameter to current environment.
6.3 Calibration Calibrating the model locally to the environment is an essential activity. Studies of
the data used to calibrate COCOMO II parameters have shown the model to be significantly more accurate when calibrated to an organization. Boehm (2000:176) recommends that at least A be calibrated to the local development environment to increase the model’s accuracy. There are several techniques to calibrate the constant which Table 27 demonstrates it in its simplest form, or for more advanced calculations, a statistical regression tool is utilized. A calibration objective is to capture the activity and productivity allocation of the local environment into consideration. The procedure described below uses natural logs. Boehm (2000:175) advises that at least five data points from projects should be used in the calibration.

42
The input required is the actual effort, PMactual, which was expended between the end of requirements analysis and system integration and test. End-product size, SFs, and EMs are also needed for the unadjusted estimated to be created using the effort estimation equation devoid of the constant A. Natural logs are seized of the real effort together with the unadjusted estimate and for each data point, the differentiation between the log of tangible cost and of the unadjusted effort are established. Averaging the differences determines the constant A by obtaining the anti-log of the mean value. Since this case study revolves around only one project, the point made is somewhat overkill. Undermentioned should however be the mode of procedure for future (if any) data points.
Table 27. Local Calibration
PM actual KSLOC EMi E Unadjusted
Estimate ln
(PMactual)
ln (Unadjusted
Estimate) Difference
65.4 39 0.64 1.07 32.6 4.18 3.48 0.7 Calibration in this fashion demonstrates that as a substitute for utilizing the
COCOMO II constant with the value of 2.94, a locally adjusted constant of 2.01 gives the exact precision when estimating effort for the software developed in this case study. Anomalies expressed the obvious impacts of potential inaccurate data collection; sizing implications gave another perspective of imprecision in the cost estimate; and calibration has withal provided for a third source of miscalculation. All three parameters are necessary to take into account when pinpointing errs in the model application.
There are generally some grave pitfalls in calibrating a model in this fashion since the input data requires revalidation prior to model utilization. It can otherwise taint the result in a negative manner. Data points used for calibration must be of high quality and the environment fairly static. Anomalies in section 6.1 demonstrated the impact of the estimator and the source of data. This issue can not be stressed enough. Jensen (2001) concurs with that a slightly different bias on some parameters significantly changes the outcome of the effort. Another issue is that small data sets reduce the trustworthiness of the calibration. Formulating statistically legitimate inferences like in this case study – using few data points of completed software projects – is highly advised from. Christensen and Ferens (2000) elaborate the same argumentation in their study. Delineated above was inter alia an example of the modus operandi for five or more data points. Rather than using this approach for upcoming project, the anomalies should be closely investigated further. Potential samples gathered in the future (i.e. next four projects) should be used for validation purposes only. This technique has become an increasingly acceptable alternative for conventional statistical practices (Christensen and Ferens 2000).
Calibration is still necessary for realistic software estimates as long as the data is properly validated. Important properties in software effort estimates are the skills, training, and user experience. Musilek et al. (2002) claimed that the determinant for COCOMO II is the size measure. Nevertheless, experience as an estimator has an equal if not greater impact on the outcome of the model. If the project attributes are appraise as correct once and further left as is to found coming estimates on, it will be a major source of miscalculations. Jensen (2001) deduces that apposite validation diminishes inaccuracy in the tool itself and that quality of the effort estimate can primarily be increased by the user alone. Calibration can entice the user to alter the model without paying enough attention to the quality of project parameters. Seeing as mistakes introduced by improperly using a model, it endows for the phenomena that calibration can compensate for inadequate application.

43
6.4 Cost Drivers (Part I)
The three scale factors FLEX, RESL, and TEAM recognize management controllables by which a project can decrease diseconomies of scale by diminishing sources of project turbulence, entropy, and rework. Table 28 shows that the most influential factor is PMAT and is thus treated as of more importance than organizations that for example works in similar or the same problem domain from one project to the next. It can be viewed on as highly remarkable since organizations that specialized in a particular domain would have the better knowledge and thus produce the software with less effort. With the remaining three scale factors set to an equal level, this is not the case. Noted should be that the parameters of COCOMO II were calibrated to 161 data points using a Bayesian statistical approach blending empirical data with expert opinion (Boehm 2000:141). This case study has not studied implications of isolated parameters; the latter refection is hence highly subjective and hypothetical. Strong points associated with Bayesian calibration are that data-determined and expert-determined cost estimations are balanced to produce a weighted estimate; together with that the practice has an elaborate theoretical foundation. There are a number of contributing factors to a project’s delivery time and effort. Development productivity was found to be affected by additional factors that were found to fall under categories in subsequent discussion.
Personnel attributes in Table 31 refer to the level of skills that are possessed by the personnel. The skills in question are general professional ability, programming ability, experience with the development environment and familiarity with the project domain. In the line of expectations, these attributes are the most influential on the projects development effort followed by product factors (see Table 29). Such refer to the constraints and requirements placed upon the project to be developed. Project attributes in Table 32 – the constraints and conditions under which project development takes place – would preferably be higher rated than platform attributes (see Table 30) that refers to the limitations placed upon development effort by the hardware and operating system being used to run the project. It is however noted that the lower minimum in project factors will slightly reduce the effort required compared to platform factors.
Table 28. Scale Factors SF Min Max PREC 0.00 6.20 FLEX 0.00 5.07 RESL 0.00 7.07 TEAM 0.00 5.48 PMAT 0.00 7.80
E 0.91 1.23
Table 29. Product Factors EM Min Max RELY 0.82 1.26 DATA 0.90 1.28 RUSE 0.95 1.24 DOCU 0.81 1.23 CPLX 0.73 1.74
∏ 0.41 4.28 Table 30. Platform Factors EM Min Max TIME 1.00 1.63 STOR 1.00 1.46 PVOL 0.87 1.30
∏ 0.87 3.09 Table 31. Personnel Factors EM Min Max ACAP 0.71 1.42 PCAP 0.76 1.34 PCON 0.81 1.29 APEX 0.81 1.22 PLEX 0.85 1.19 LTEX 0.84 1.20 ACAP 0.71 1.42
∏ 0.18 6.07
Table 32. Project Factors EM Min Max TOOL 0.78 1.17 SITE 0.80 1.22 SCED 1.00 1.43
∏ 0.62 2.04

44
6.4.1 Risk Resolution Table 3 in the data collection defined the RESL levels by – among others – the
number and criticality of risk items. Risk calculation according to Ferguson (2004) defines risks as a function and product of the two factors; probability and impact value. The highest risks are associated with the probability of 0.95 percent and an impact value of 81 that aggregates a product of 76.95, whereas the lowest risks have a correlated value of 0.05 points. The latter is a product of probability being 0.05 percent and impact value is in possession of only one point. Conclusions from the study accomplished by Ferguson (2004) presented that the standard usage is the computation of the highest 20 project risks. Large projects with over three years and more than 500 people was an exception to that rule. 20 risks otherwise seemed as a sufficient number to track. Because COCOMO II associates this level with a very low risk resolution, it seems reasonable to relate it with a low rating instead. More than 20 critical risks should therefore be the criteria for a very low level. Ferguson (2004) denotes that there is an important reasons for recommending the consideration of 20 risks, namely that such quantity have a minimum probability of five percent, that corresponds to risk correlations of 100 percent which is the recommended cancellation level (characterized as show-stoppers in this case study). Risk managers settling on investigating ten risks merely handle a project risk score possessing the lowest amount of 50 points.
6.4.2 KPAs Process maturity is the SF that has most influence on development cost. Since it is
an exponential effect, it is viewed as encompassing an economies or diseconomies of scale influence on development effort. This will significantly distinguish itself on projects as they grow larger. Lower maturity level processes will experience an exponential increase in effort. By all means, all SF have this influence on effort, but since COCOMO II associates PMAT with a SF up to 7.8, the model makes such assumptions that a weak process maturity has the most – interrelated to other SFs – impact on development. Advanced levels of the CMM are exceedingly organizational focused according to Clark (1996). Well reflected in the data collection was that the KPAs actually tended to get better scores when dealing with project issues. The company was in fact not especially organization oriented. This was however not to be seen as a negativism, it was merely how the business was conducted i.e. in a consultant fashion. Projects with outsized applications are consequentially influenced additionally by these heavily weighted KPAs. COCOMO II obviously needs some revising at this level in order to better fit organizations with these characteristics. In other words, the organization in this project case study and CMM/COCOMO II has different aspect on a well functional organization. Another interesting aspect that was covered by Curtis et al. (2003) is that at the fourth level of CMM, organizations begin to attain insightful knowledge about the impact of personnel capabilities, practices and performance of such. One of the reasons that the project subjected to this case study acquired lower ratings on e.g. processes was for the reason that there were not many organization standards to implement, all in the lines of previous discussion about how business was conducted. The conclusion therefore is that the COCOMO II model needs some kind of backfiring tables for this estimate also. It is admittedly difficult to introduce such on this level nonetheless; it is highly unreasonable to assume that all development companies produce software in this predefined standard. There are noticeably alternative development approaches that need to be incorporated in the PMAT levels for the model to be generally accepted.

45
6.5 Cost Drivers (Part II) Previous discussions enclosed existing cost drivers. This section elaborates upon
two potential and additional influences that allegedly also have a significant impact on the software development process. There is no attempt to rank them in terms of weights. It would be extremely presumptions to base some sort of conclusions based on solely one case. The discussion is thus deliberately on a higher level to reflect on hypothetical regards that COCOMO II perhaps should take into account. It is however recommended that management issues should be consider as an EM, whilst task assignments constitute a SF. Management has scarcely an exponential effect on effort although it can improve process quality, not actually produce software more rapidly. Task assignment conceivably would have that effect in the view of the fact that interrupted activities have an adjusting time effect.
6.5.1 Management Jensen (2004) claims that poor management can increase software costs by an
immense factor. Each of subsequent (in increasing impact order) mismanagement properties has habitually been accountable for doubling software development effort; personnel, tools, systems, and management. COCOMO II does not incorporate a factor for management quality, but in its place makes assumptions that the development project will be managed in a straightforward fashion. This shortcoming is somewhat significant in other estimating tools as well (Jensen 2004). The model does however place a significant importance in the development technique. Jensen (2004) reports that by neglecting management approaches, high effort estimates are generated in modern organizations and produces calculated approximations that are small in inadequately managed software business. Seeing as competitive pressure forces organizations to reorganize their procedures to develop software, an additional cost driver is well motivated in regard to this attribute.
6.5.2 Task Assignments Team task assignments emerge as having an important influence on the overall
success of software projects. Hale and Parrish (2000) propose task assignment amendments that can aid in the tuning of existing estimation models. Noteworthy enhancements as such increase the prediction ability of COCOMO II by augmenting it with this factor. Development cost was found to decrease while intensity increased seeing as uninterrupted activities significantly improves productivity. Hale and Parrish (2000) further elucidates that high productivity necessitate single-minded work time. Each interruption allocates additional resources before personnel can single-mindedly concentrate on the suspended activity. Software development effort was also found to increase with concurrency i.e. degree of team cooperation. For example, when project personnel develop software independently, the team spent less effort on completing an activity. The latter might be a consequence of poor discipline or an innate inclination of development personnel that has as preference to conduct activities alone. Fragmentation was another observation that imposed restrictions on development effort. This could be seen as interrelated with abovementioned concurrency, nevertheless, Hale and Parrish (2000) reports that the implementation effort increases as time is partitioned over an abundant number of dissimilar tasks. In other words, software development that necessitates personnel to shift between activities limits the productive work. So a task assignment cost diver may be fully motivated in this case, although it might be somewhat complicated to correctly assess prior to actual development.

46
6.6 Assessment of Estimation Precision Cost estimations in the case study object were a process that began by breaking
down the project into modules. Expert opinion was provided in the estimates by someone who with capable insight was able to endow with a reasonable approximation. Current effort estimations presented accuracy within one percent of the actual cost, calculated by means of mean magnitude of relative error (MMRE). This grand total demonstrates accuracy within three percent of the actual effort. Remember that this should be put into perspective of six percent of the actual effort that COCOMO II produced, however with the default calibration. COCOMO II.2000 was tested with 161 data points. The accuracy was demonstrated as within 30 percent of actual 75 of the time for effort, for the general calibration, and within 30 percent of actual 80 of the time for effort, when each organization’s data was separately calibrated to its own coefficient value (Boehm 2000:141). Predictions preformed in this case study and by the project’s current process out-preformed the model (when tested to the 161 data points). In all fairness, the statistics are an overall mean value that does not reveal individual data point accuracy. Nonetheless, it ones again express the urge to calibrate the model to given circumstances in organizations and projects. Although the point is somewhat distorted given the accuracy provided, it can be a general conclusion to always bear in mind.
6.7 Recommendation A foundation for the organization and their future cost estimations has been laid
with the work presented in this thesis. It is highly advisable to incorporate the use of COCOMO II since the project did not conduct any formal metric, parametric and/or calibration technique to justify their estimations. The model demonstrated precise accuracy in the predictions when various anomalies were soughed out. One remarkable concern is that the projects did not have a rough estimate for the application size. Cook and Leishman (2004) delineates that many project in fact lack this important metric and stresses the importance of adequate sizing measures. Budlong and Szulewski (1996) convey that set of practices contained by a mature organization’s ordinary software engineering process include software metrics and software cost estimation techniques. COCOMO II is perhaps not suited for every type of project since the model has its own particular strengths and weaknesses (Stutzke 1996). With the data collection, validation, and application, established this thesis; the base for further evaluation is enabled. Stutzke (1996) accentuates that processes defined by projects and organizations are documented in order to apply them consistently, for educational purposes, evaluated for correctness and completeness, and as a final point improved.
6.8 Chapter Summary Findings in this research disclosed preliminary estimates by an additional 47
percent effort with the default calibration. Anomalies evinced a vast degree of inconsistency hence, by considering their deviation the model generated an exceedingly accurate precision; only six percent additional to the actual effort. This should be put into perspective of three percent of the actual effort made by the project personnel. Sizing implications divulged this metric as the most significant parameter to take into account when estimating cost. As it turns out, the effort estimation difficulties are transferred into sizing problem. A calibration technique demonstrated that as a substitute for utilizing the COCOMO II constant, a locally adjusted constant of 2.01 gives the exact precision. Literature findings furthermore recommended management issues and task assignments as important factors to consider as additional parameters.

47
Epilogue
Chapter
“You have your way. I have my way. As for the right way, the correct way, and the only
way, it does not exist.”
Friedrich Nietzsche
Admittedly revealed in this work and by studies accomplished by Jones (2002) is
that while software cost estimation may be simple in concept, it is difficult and complex in reality. Collecting the data was fairly effortless but inaccuracy was exhibited when applying it to the model. Whether or not the miscalculations were encapsulated in the anomalies remains unfolded, however it is however highly presumable. Difficulties and complexities accompanied in successful effort estimates surpass capabilities in the majority of software project managers (Jones 2002). The calibration process was mostly applied in order to demonstrate the flexibility in COCOMO II. It was discouraged when less than five data points were available. In the view of the fact that this method of estimation is error prone, the conclusions are thus to place vital importance in the anomalies. An inadequacy of COCOMO II is that the rating of numerous scale factors and cost drivers are subjective. The subjectivity applies for time estimates in general meaning that the same set of prerequisites would perhaps have differed considerably if done by another person given that all other factors are consistent. Another conclusion is however that those development organizations that calibrates the database with their own data provides for the most accurate results of parametric models.
It has previously been established by Musilek et al. (2002) that the size input of the model is the most critical parameter. It was narrowly accompanied by the effort multipliers EMi whose impact slightly differed. Surprisingly the scale factors (SFj) enclosed in the exponent E, exhibited only relative low impact on the accuracy of the estimates. It can be viewed as unexpected from the perspective that the parameter has an exponential dependency on the effort. It would imply that the cost for developing software can rapidly decrease given the accurate circumstances. However, the sum of the scale factors are, before adding the calibrated B (0.91 for COCOMO II.2000) first multiplied by a factor of 0.01, which exceptionally decreases its impact.
Sources of miscalculation have proven to be threefold. Jensen (2003) excogitates that estimating methods can produce incorrect or misleading estimates. The facts based on the conjecture was among others errs in the sizing, volatility in- and experience of the development environment together with communication difficulties. This case study somewhat concurs with those finding. Sizing the application was relatively effortless but the consequences of potential misinterpretations made in the source code counter could have dire influences. The data collection generated a number of anomalies that revealed the difficulties in correctly assessing those parameters. As a final point, the default calibration could have been the third source of miscalculation. All three perspectives are potential deceptions that are difficult to dissolve. That is why the experience of COCOMO II users is of outmost importance and data points are of priceless nature.
48
7.1 Conclusion A function point analysis was early on dismissed as a source of miscalculations
when in fact the project already had a complete system. The implications of this decision have both had its benefits and deficiencies. It would admittedly been difficult to count e.g. the varieties of each unique data or user control type that enters the external boundary of the software system being measured. This is a straightforward directive that the function point analysis requires being unsolved. However, when settling on to count source lines of code, the 4GL environment caused problems that the function point analysis better could have coped with. If applying COCOMO II in the future, the project organization in this case study needs to resolve those issues for better accuracy.
COCOMO II has proven to be an invigorating, flexible, and precise model to utilize in cost estimations in that it urges the user to be creative but at the same time also responsible. Considering that one effort multiplier single-handedly can impact the effort product with the assigned factor e.g. if the factor is as low as half of a point, then the effort is consequently halved. On a more disparaging note, an effort multiplier assigned a value of two points doubles the cost. These are conceivable and extreme values, albeit they annotate the crucial impact that cost drivers possess. Henceforth, it expresses an arduous predicament that estimators of the model are exposed to. Also consider that COCOMO II endows the user to define its own set of effort multipliers. They should therefore not be taken into action without serious thought to them first. Also management and work activity issues have been discussed. They can have an additional averred impact on effort, hence it would have been interesting observations how these attributes could be tailored and weighted to fit the model based on multiple data points, something that falls out of scope of this research due to conceded inadequate resources.
Another important aspect about COCOMO II is that is helps the user to negotiate tradeoffs between inter alia, cost and performance witch includes e.g. functionality, efficiency or reliability, and other qualities revolving around such attributes. Because the model has a number of parameters that enable the user to tradeoff development effort with time of delivery, or cost versus required reliability, the management can systematically consider the implications of each preference. The model is also perfectly open in that every algorithm, equation and tables are fully explained so the user always know what it is that can be traded off. If a cost driver setting is changed in the model, the direct consequences on the effort are evident.
Motivations, rationale and assumptions behind the application of parameters are all described in appurtenant sections. Assumptions are thus implied in the model application, so further elaborations on explanatory guidelines need supplementary revision to reduce inaccuracy and subjectivity. Conspicuously, they were affirmed to be incommensurate at diverse application areas and subsequently led to the introduction of various anomalies. Those consequently had an affirmed and adverse impact that profoundly tainted the development effort into an irreconcilable estimate.
What can be further said about the calibration process is that the adjusted constant, A, can be fully sufficient to for better precision. Only the future can tell whether or not additional data points conform to the postulation of COCOMO II. What can be said in the present time is that should the procedure not be fully satisfactory, then yet another calibration technique needs attention, namely the one of the B constant. It can very well be the case that upcoming predictions all will fall out of applicable usage. So conclusions of such quandaries are that the second constant can be to blame. It is however assured that the first step taken in this research is well enough. Calibration on several frontiers would otherwise surely obscure any conclusions at all. In other words, if the model was adjusted at numerous points of attack, it would have been even more difficult to pin-point the errors in the analysis. What pertains to the Bayesian

49
calibration is that this theoretical foundation combines expert opinion with empirical data. The vigor of such utilization is that data- and expert-determined estimates are equilibrated to generate a biased estimate. Expert judgment is thus eradicated and it is refinements like this that makes the model supplementary convincing.
COCOMO II aids in that it copes with the rapid change that is seen in the software field today. The model assists users to cope with project that are in their infancy and in progress of being developed. COCOMO II inputs existing objectives for the system under development in terms of the desires functions, performance, quality and also the environment that is going to be utilized. The personnel, processes, and team experience are all properties that the model takes into account. Having established these requirements, the user can then proceed into building the actual product. Should discrepancy still remain the user is left with the choice of re-scoping the necessities. The parameters enable this modification. Functionality can in such cases be deferred initially if the product must be build faster and/or cheaper. The capability of personnel involved in the project has also shown its impact on development. Likewise, decisions of better tools usage or proceeding toward more process mature are all aspects consider by the model. In addition, every time a project and product is finished, an entire new project data point can be use to recalibrate the model based on more recent experiences.
One might ponder the fact that the estimates generated in this research were based upon best possible circumstances and thereby produced a result that could be considered precise. Since the case object was a completed project, all metrics and information were available right from the start. In here lies the dilemma. One among other perspectives of COCOMO II is to know the internal structure of code constituting the system. Such knowledge is truly difficult to obtain in early stages of software development when indeed accurate time estimations are most crucially needed. Estimates generated with this model can be accurate provided that parameters can be correctly established, something that can be somewhat difficult to initially and straightforwardly produce.
As a few last words the author would like to draw the reader’s attention to the more harsh conditions for the software industry in recent times. The competitive market calls for delicate and strategic excellence in management issues such as project plans. Overruns in budget were everyday occurrences in the past decade, something that the future will not tolerate to the same extent. The perceptive project manager will doubtlessly adapt to current conditions and realize the potentials that parametric cost estimation models grant. Recall from the introduction that there are mainly two worst case scenarios associated with estimating effort in software development. They depicted the consequences of underestimating and overestimating cost. Both have equally disastrous outcomes and none of these are desirable in any fashion. Now the clarification of such poor decisions is clearer since COCOMO II manages numerous perspectives of software development. Magnificent features in the model consent the user to define its own set of parameters, calibrate them to the local environment, and as a final point apply them with marvelous precision. For every project that is completed, an extra data-point is added to the database with additional confident in return. This undoubtedly well outperforms all other estimating techniques in that every step, parameter, and rationale is effusively documented hence the user can discern what decisions led to which result and why. Referring back to the severe conditions in software businesses, a project manager utilizing any other less elaborated model or technique would be ensnared in a solemn predicament when faced with competitive forces equipped with such supremacy. COCOMO II endows with this preeminence. Many other estimating models and techniques do not. Hopefully this thesis delineates COCOMO II, with its possibilities, as a top contender in software cost estimations tools.

50
REFERENCES Ashley, Nicholas (1995) Measurement as a Powerful Software Management Tool,
McGraw-Hill, Maidenhead Berkshire. Boehm, Barry W. (1981) Software Engineering Economics, Prentice Hall, New
Jersey. Boehm, Barry W. (2000) Software Cost Estimation with COCOMO II, Prentice
Hall, New Jersey. Boehm, B.; Royce, W. (1989) ‘Ada COCOMO and the Ada Process Model’
Proceedings, Fifth COCOMO Users' Group Meeting, Software Engineering Institute, Pittsburgh, PA, November 1998.
Bosch, Jan (2000) Design and Use of Software Architectures: Adopting and
evolving a product-line approach, Pearson Education Limited, Harlow. Briand, L.C. (2003) ‘Software Documentation – How much is enough?’ Software
Maintenance and Reengineering, 13-15. Budlong, Faye C.; Szulewski, Paul A. (1996) ‘Tailoring a Software Process for
Software Project Plans’, The Journal of Defense Software Engineering, 9(4), 24-28. Burns, Alan; Wellings, Andy (2001) Real-Time Systems and Programming
Languages, 3rd Edition, Pearson Education Limited, Harlow. Christensen, David S.; Ferens, Daniel V. (2000) ‘Does Calibration Improve
Predictive Accuracy?’, The Journal of Defense Software Engineering, 13(4), 14-17. Clark, B.K. (1996) ‘Cost modeling process maturity – COCOMO 2.0’, Aerospace
Applications Conference, 3(3), 347-369. Clark, B.; Devnani-Chulani, S.; Boehm B, (1998) ‘Calibrating the COCOMO II
Post-Architecture model’, Software Engineering, 477-480. Connolly, Thomas; Begg, Carolyn (2002) Database Systems: A Practical
Approach to Design, Implementation and Management, 3rd Edition, Pearson Education Limited, Essex.
Cook, Dr. David A.; Leishman, Theron R. (2004) ‘Lessons Learned From
Software Engineering Consulting’, The Journal of Defense Software Engineering, 17(2), 4-6.
Curtis, Dr. Bill; Hefley, Dr. William E.; Miller, Sally A. (2003) ‘Experiences
Applying the People Capability Maturity Model’, The Journal of Defense Software Engineering, 16(4), 9-13.
Dolado, J.J. (1997) ‘A study of the relationships among Albrecht and Mark II
Function Points, lines of code, 4GL and effort’, The Journal of Systems and Software, 37(2), 161-173.

51
Easton, George (1982) Learning from Case Studies, Prentice-Hall, London. Ferguson, Robert W. (2004) ‘A Project Risk Metric’, The Journal of Defense
Software Engineering, 17(4), 12-15. Gilb, T. (1988) Principles of Software Engineering Management, Addison-Wesley
Publishing Company. Hale, Joanne; Parrish, Allen (2000) ‘Enhancing the COCOMO Estimation
Models’, IEEE Software, 17(6), 45-50. Hofmeister, Christine; Nord, Robert; Soni, Dilip (2000) Applied Software
Architecture, Addison Wesley Longman, Inc., Reading, Massachusetts. Humphrey, Watts S. (1997) Managing Technical People: Innovation, Teamwork,
and the Software Process, Addison Wesley Longman, Inc. Jensen, Dr. Randall (2001) ‘Software Estimating Model Calibration’, The Journal
of Defense Software Engineering, 14(7), 13-15. Jensen, Dr. Randall W. (2003) Lessons Learned From Another Failed Software
Contract, The Journal of Defense Software Engineering, 16(9) 25-27. Jensen, Dr. Randall W. (2004) ‘Extreme Software Cost Estimating’, The Journal
of Defense Software Engineering, 17(1), 27-30. Jiang, James J.; Klein, Gary; Means, Thomas L. (2000) ‘Project risk impact on
software development team performance’, Project Management Journal, 31(4), 19-26. Johnson, R.; Foote, B. (1988) ‘Designing Reusable Classes’, Journal of Object-
Oriented Programming, 1(2), 22-5. Jones, Capers (2002) ‘Software Cost Estimation in 2002’, The Journal of Defense
Software Engineering, 15(6), 4-8. Kotonya, Gerald; Sommerville, Ian (1997) Requirements Engineering: Processes
and Techniques, John Wiley and Sons Ltd, Chichester, West Sussex. Krause, P.; Freimut, B.; Suryn, W. (2002) ‘New directions in measurement for
software quality control’, Software Technology and Engineering Practice, 129-143. Kruchten, P. (2000) The Rational Unified Process: An Introduction, 2nd Edition,
Addison Wesley Longman, Inc. Larman, Craig (1997) Applying UML and patterns: An introduction to object-
oriented analysis and design, Prentice Hall, New Jersey. Lewis, Y. Renee; Oliver, Dr. Paul (1992) ‘An Adaptation of Function Point
Analysis and COCOMO for Estimating the Cost of Oracle SQL*Forms Application Development’, ACM 30th Annual Southeast Conference, 463-466.

52
Milicic, D.; Svensson, P. (1998) ‘Sparks To A Living Quality Organisation – A total quality approach towards improvements’, unpublished M.Sc thesis, Department of Software Engineering, Blekinge Institute of Technology.
Milicic, D.; Wohlin C. (2004) ‘Distribution patterns of effort estimations’, to be
presented at EuroMicro 2004 Rennes France, pending IEEE pubication. Musilek, P.; Pedrycz, W.; Nan Sun; Succi, G. (2002) ‘On the sensitivity of
COCOMO II software cost estimation model’, Proceedings of the Eighth IEEE Symposium on Software Metrics. Soc, 13-20.
Nicholas, John M. (2001) Project Management for Business and Technology:
Principles and Practice, 2nd edition, Prentice-Hall, New Jersey. Oracle PL/SQL, available from Internet
<http://otn.oracle.com/tech/pl_sql/index.html> (10 April 2004) Oracle9i Forms, available from Internet
<http://otn.oracle.com/products/forms/htdocs/9iforms_fov.htm> (10 April 2004) Paulk, M.; Weber, C.; Curtis, B.; Chrissis, M. (1995) The Capability Maturity
Model: Guidelines for Improving the Software Process, Addison-Wesley. Pfleeger, Shari Lawrence (2001) Software Engineering: Theory and Practice, 2nd
edition, Prentice-Hall, New Jersey. Putnam, Lawrence H; Myers, W. (1992) Measures for Excellence, Prentice-Hall,
New Jersey. Reifer, Donald J. (2002) ‘Estimating Web Development Costs – There are
differences’, The Journal of Defense Software Engineering, 15(6), 13-17. Scarnati, James T. (1999) ‘Beyond Technical Competence – The art of leadership’,
Career Development International, 4(6), 325-335. Stutzke, Richard D. (1996) ‘Software Estimating Technology – A survey’, The
Journal of Defense Software Engineering, 9(5), 17-22. Stutzke, Dr. Richard D. (2000) ‘Software Estimation – Challenges and Research’,
The Journal of Defense Software Engineering, 13(4), 9-12. Tate, Graham; Verner, June (1988) ‘Estimating Size and Effort in Fourth-
Generation Development’, IEEE Software, 5(4), 15-37. TietoEnator Corp. (2003) ‘PPS – A guide to professional management’,
TietoEnator Corp., Kista. Vliet, H.V. (2000) Software Engineering: Principles and Practice, 2nd edition,
John Wiley and Sons, Ltd, Chichester.

53
APPENDIX
COCOMO II SLOC Checklist Definition Checklist for Source Statements Counts
Definition name: Logical Source Statements Date: (basic definition) Originator: COCOMO II
Measurement unit: Physical source lines Logical source statements √ Statement type Definition √ Data array Includes Excludes
When a line or statement contains more than one type, classify it as the type with the highest precedence.
1 Executable Order of precedence: 1 √ 2 Nonexecutable
3 Declarations 2 √ 4 Compiler directives 3 √ 5 Comments
6 On their own lines 4 √ 7 On lines with source code 5 √ 8 Banners and non-blank spacers 6 √ 9 Blank (empty) comments 7 √
10 Blank lines 8 √ How produced Definition √ Data array Includes Excludes 1 Programmed √ 2 Generated with source code generator √ 3 Converted with automated translators √ 4 Copied or reused without change √ 5 Modified √ 6 Removed √ Origin Definition √ Data array Includes Excludes 1 New work: no prior existence √ 2 Prior work: taken or adapted from
3 A previous version, build, or release √ 4 Commercial, off-the-shelf software (COTS), other than libraries √ 5 Government furnished software (GFS), other than reuse libraries √ 6 Another product √ 7 A vendor-supplied language support library (unmodified) √ 8 A vendor-supplied operating system or utility (unmodified) √ 9 A local or modified language support library or operating system √ 10 Other commercial library √ 11 A reuse library (software designed for reuse) √ 12 Other software component or library √
Usage Definition √ Data array Includes Excludes 1 In or as part of the primary product √ 2 External to or in support of the primary product √ Delivery Definition √ Data array Includes Excludes 1 Delivered:
2 Delivered as source √ 3 Delivered in compiled or executable form, but not as source √
4 Not delivered: 5 Under configuration control √ 6 Not under configuration control √
Functionality Definition √ Data array Includes Excludes 1 Operative √ 2 Inoperative (dead, bypassed, unused, unreferenced, or unaccessible):
3 Functional (intentional dead code, reactivated for special purposes) √ 4 Nonfunctional (unintentionally present) √
Replications Definition √ Data array Includes Excludes

54
Definition Checklist for Source Statements Counts Definition name: Logical Source Statements Date: (basic definition) Originator: COCOMO II
1 Master source statements (originals) √ 2 Physical replicates of master statements, stored in the master code √ 3 Copies inserted, instantiated, or expanded when compiling or linking √ 4 Postproduction replicates—as in distributed,
redundant, or reparameterized systems √ Development status Definition √ Data array Includes Excludes
Each statement has one and only one status, usually that of its parent unit. 1 Estimated or planned √ 2 Designed √ 3 Coded √ 4 Unit tests completed √ 5 Integrated into components √ 6 Test readiness review completed √ 7 Software (CSCI) tests completed √ 8 System tests completed √ Language Definition √ Data array Includes Excludes
List each source language on a separate line. 1 Separate totals for each language √ Clarifications Definition √ Data array Includes Excludes
(general) 1 Nulls, continues, and no-ops √ 2 Empty statements, e.g. “;;” and lone semicolons on separate lines √ 3 Statements that instantiate generics √ 4 Begin...end and {...} pairs used as executable statements √ 5 Begin...end and {...} pairs that delimit (sub)program bodies √ 6 Logical expressions used as test conditions √ 7 Expression evaluations used as subprograms arguments √ 8 End symbols that terminate executable statements √ 9 End symbols that terminate declarations or (sub)program bodies √ 10 Then, else, and otherwise symbols √ 11 Elseif statements √ 12 Keywords like procedure division, interface, and implementation √ 13 Labels (branching destinations) on lines by themselves √ Clarifications Definition √ Data array Includes Excludes
(language specific) Ada
1 End symbols that terminate declarations or (sub)program bodies √ 2 Block statements, e.g. begin...end √ 3 With and use clauses √ 4 When (the keyword preceding executable statements) √ 5 Exception (the keyword, used as a frame header) √ 6 Pragmas √
Assembly 1 Macro calls √ 2 Macro expansions √
C and C++ 1 Null statement, e.g. “;” by itself to indicate an empty body √ 2 Expression statements (expressions terminated by semicolons) √ 3 Expression separated by semicolons, as in a “for” statement √ 4 Block statements, e.g. {...} with no terminating semicolon √ 5 “;”, “;” or “;” on a line by itself when part of a declaration √ 6 “;” or “;” on a line by itself when part of an executable statement √ 7 Conditionally compiled statements (#if, #ifdef, #ifndef) √ 8 Preprocessor statements other than #if, #ifdef, and #ifndef √
CMS-2
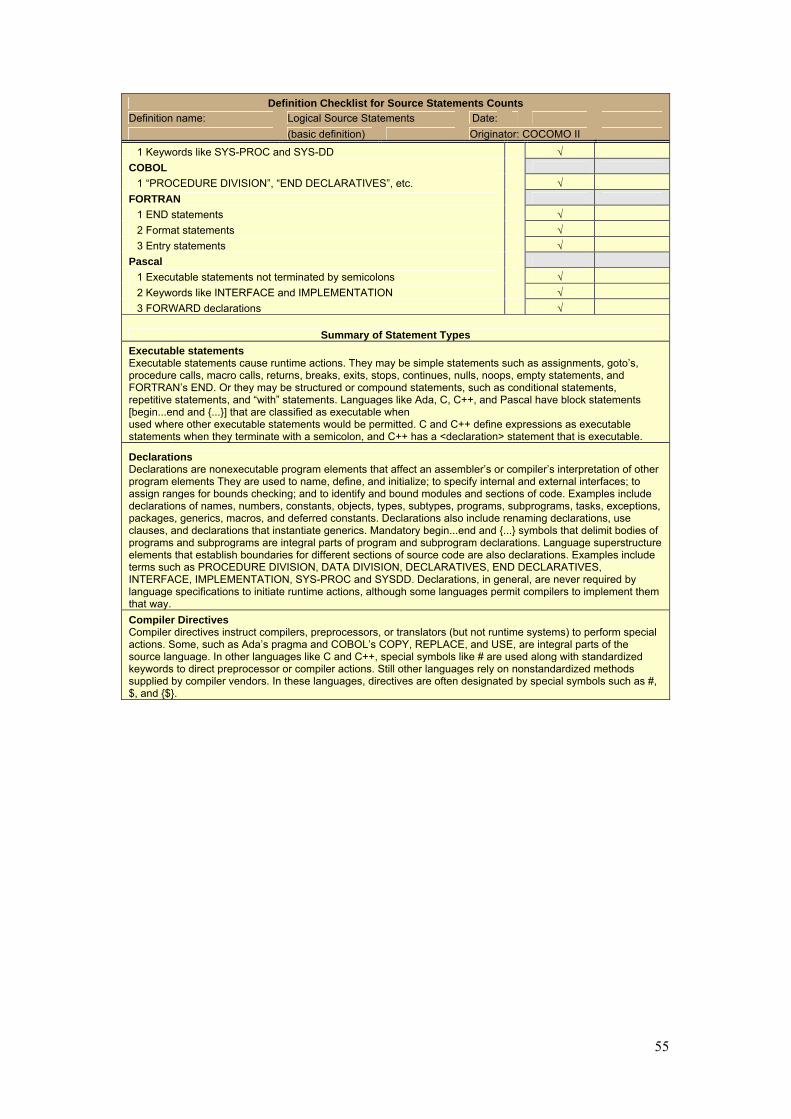
55
Definition Checklist for Source Statements Counts Definition name: Logical Source Statements Date: (basic definition) Originator: COCOMO II
1 Keywords like SYS-PROC and SYS-DD √ COBOL
1 “PROCEDURE DIVISION”, “END DECLARATIVES”, etc. √ FORTRAN
1 END statements √ 2 Format statements √ 3 Entry statements √
Pascal 1 Executable statements not terminated by semicolons √ 2 Keywords like INTERFACE and IMPLEMENTATION √ 3 FORWARD declarations √
Summary of Statement Types Executable statements Executable statements cause runtime actions. They may be simple statements such as assignments, goto’s, procedure calls, macro calls, returns, breaks, exits, stops, continues, nulls, noops, empty statements, and FORTRAN’s END. Or they may be structured or compound statements, such as conditional statements, repetitive statements, and “with” statements. Languages like Ada, C, C++, and Pascal have block statements [begin...end and {...}] that are classified as executable when used where other executable statements would be permitted. C and C++ define expressions as executable statements when they terminate with a semicolon, and C++ has a <declaration> statement that is executable.
Declarations Declarations are nonexecutable program elements that affect an assembler’s or compiler’s interpretation of other program elements They are used to name, define, and initialize; to specify internal and external interfaces; to assign ranges for bounds checking; and to identify and bound modules and sections of code. Examples include declarations of names, numbers, constants, objects, types, subtypes, programs, subprograms, tasks, exceptions, packages, generics, macros, and deferred constants. Declarations also include renaming declarations, use clauses, and declarations that instantiate generics. Mandatory begin...end and {...} symbols that delimit bodies of programs and subprograms are integral parts of program and subprogram declarations. Language superstructure elements that establish boundaries for different sections of source code are also declarations. Examples include terms such as PROCEDURE DIVISION, DATA DIVISION, DECLARATIVES, END DECLARATIVES, INTERFACE, IMPLEMENTATION, SYS-PROC and SYSDD. Declarations, in general, are never required by language specifications to initiate runtime actions, although some languages permit compilers to implement them that way. Compiler Directives Compiler directives instruct compilers, preprocessors, or translators (but not runtime systems) to perform special actions. Some, such as Ada’s pragma and COBOL’s COPY, REPLACE, and USE, are integral parts of the source language. In other languages like C and C++, special symbols like # are used along with standardized keywords to direct preprocessor or compiler actions. Still other languages rely on nonstandardized methods supplied by compiler vendors. In these languages, directives are often designated by special symbols such as #, $, and {$}.