applying biochar - memorial university · applying biochar to ... additional aerobic or humic phase...
TRANSCRIPT

2013-14 STRATEGIC PARTNERSHIPHARRIS CENTRE STUDENT RESEARCH FUND2013-14 HARRIS CENTRE RBC WATER RESEARCH AND OUTREACH FUND2013-14 APPLIED RESEARCH FUND
APPLYING BIOCHAR TO REDUCE LEACHATETOXICITY & GREENHOUSEGAS PRODUCTION IN MUNICIPAL SOLID WASTE (MSW)
JOINAL ABEDINLABRADOR INSTITUTE, MEMORIAL UNIVERSITY SEPTEMBER 2017
2015-16 HARRIS CENTRE - MMSB WASTE MANAGEMENT APPLIED RESEARCH FUND

Applying Biochar to Reduce Leachate Toxicity and Greenhouse Gas Production in Municipal Solid Waste (MSW)

1. Acknowledgement
The author thankfully acknowledges the support from Harris centre through its MMSB Waste Management Applied Research Fund. This research project was also partially funded by the Atlantic Canada Opportunities Agency (ACOA), the NL Department of Business, Tourism, Culture and Rural Development, and Memorial University of Newfoundland. The Town of Happy Valley-Goose Bay allowed us to conduct our experiment at the municipal landfill and provided equipment and labour to prepare the experimental site.

2. Executive Summary
Landfilling is the most popular waste disposal method worldwide. Landfilling is more economical than other methods (e.g. composting and recycling) as it requires less infrastructure and no specialized collection services. However, despite our heavy reliance on landfills and all their perceived benefits, they also pose environmental concerns to surrounding communities. Many landfill sites suffer from vermin, odours, windborne litter, and uncontrolled burning. Excess rainwater percolating through waste layers becomes contaminated by waste materials and can potentially pollute groundwater and surface water if landfills are built without engineered liners or leachate collection systems. When organic waste is buried in a landfill, a complex series of biological and chemical reactions occurs over time as the waste decomposes and four distinct phases are reported: (1) an initial aerobic phase; (2) an anaerobic acid phase producing organic acids and alcohols; (3) an initial methanogenic phase; and (4) a stable methanogenic phase. An additional aerobic or humic phase of decomposition may appear if the rate of oxygen diffusion into the landfill exceeds the rate of microbial oxygen depletion. Therefore, the composition of landfill leachate and its effect on natural water body depends not only on the types of wastes that have been buried in the landfill, but also on the age of the burials. Bacterial activity in landfills generates greenhouse gases (GHG) composed primarily of methane (50 to 55%), carbon dioxide (45 to 50%), and less than 1 percent other organic or inorganic gases. Methane is a potent GHG, with approximately 25 times the global warming potential of carbon dioxide (CO2), making landfilling a significant contributor to global warming.
There are a number of water quality parameters, such as pH, DO (dissolved oxygen), COD (chemical oxygen demand), BOD (biochemical oxygen demand), TOC (total organic carbon), and nutrient and metal concentrations, that are employed by regulatory agencies to evaluate the suitability of water, depending on whether the water is to be used for drinking, irrigation, industrial applications, or recreation, or as habitat for natural aquatic organisms. Regulatory agencies use these parameters to develop standards and guidelines depending on the intended users and uses of the water. The guidelines specify maximum and minimum values for the relevant parameters to establish ranges in which water must fall. Water sample quality is then determined based on whether it meets all of the requirements. Biochar is persistent in the natural environment, and therefore potentially provides long-lasting beneficial effects in a number of fields, such as improving soil fertility, decontaminating land, sequestering carbon, and decreasing GHG production. Research on biochar has grown tremendously in the United States, Europe, and elsewhere during the past decade. In recent years a number of researchers from Alberta, Ontario, and Quebec have also explored the potential benefits of biochar for various applications. In Newfoundland and Labrador, in recent years a number of studies have been carried out on biochar, but mostly for improving soil fertility. No research has been done in Labrador to assess biochar’s suitability for managing the harmful effects of landfills. At the same time, due to the development of large-scale hydroelectric projects there is an abundance of waste wood that can be made available for local biochar production. Furthermore, some landfill wastes can themselves be converted to biochar. The results of this project could encourage private sectors to invest in research and development projects to divert biomass from landfills or to make use of the abundant waste wood resulting

from timber clearing in the lower Churchill River valley by Nalcor Energy Corporation.The objective of this study is to investigate the effects of biochar application in landfill-cover for leachate toxicity and GHG emissions.
Collected leachate had high acidity (pH <4.2) and high EC, low DO, and high COD, TOC, and concentrations of nutrients and metals. Some of these parameters were significantly affected by the application of different types of biochar plus sand mixture (Torrefied char (TC)+sand, Slow pyrolysis biochar (SPB)+sand and Fast pyrolysis biochar (FPB)+sand) compared to sand as a cover material. All three types of biochar plus sand treatments significantly decreased TOC, Ba, Fe and Cr concentrations, while FPB plus sand significantly decreased COD, N and Al concentrations. Therefore, among the three types of biochar used in this study, FPB was found to be the best for reducing contaminants from the leachate. In this study we used biochar and sand at 1:1 (V/V) ratio. Further study is required to ascertain whether increased rate or prolonged period of application would increase the efficacy.
Biochar+sand treatments considerably lowered mean CO2 emissions, but the reductions were not statistically significant compared to treatment with sand alone. FPB+sand treatments showed a significant reduction in CH4 emissions. Although the biochar treatments did show reduction in CH4 emissions, they still emitted a fairly significant amount of CH4, in particular for Sand+SPB and Sand+TC treatments. Whether or not an increased dose of biochar would cause further reduction cannot be evaluated from this current study. Despite the fact that biochar treatment did not have significant effects on CO2 or N2O emissions, Sand+FPB can be considered an effective GHG mitigation treatment for organic wastes in landfill sites.
3. Introduction
3.1 Rationale and background:
Solid waste can be considered hazardous or non-hazardous and is classified by source as residential, commercial, institutional, or industrial. Municipal solid wastes (MSW) in particular are non-hazardous wastes generally divided into only two categories: residential and non-residential. Non-residential waste includes industrial, commercial and institutional wastes and waste generated by construction and demolition activities. Different countries and organizations have defined MSW in different ways. According to the US Environmental Protection Agency (EPA), “Municipal Solid Waste (MSW) — more commonly known as trash or garbage—consists of everyday items we use and then throw away, such as product packaging, grass clippings, furniture, clothing, bottles, food scraps, newspapers, appliances, paint, and batteries” (2013). According to the Intergovernmental Panel on Climate Change (IPCC), “Municipal waste

is generally defined as waste collected by municipalities or other local authorities that includes household waste, garden (yard) and park waste; and commercial/institutional waste” (2006).
Solid waste is intimately linked to urbanization and economic development. As standards of living and disposable incomes increase, consumption of goods and services increases, which results in a corresponding increase in the amount of waste generated (Hoornweg and Bahada-Tata, 2012). Canada generates MSW at among the highest rates among countries in the Organisation for Economic Co-operation and Development (OECD), and on a municipal waste generation report card in 2009 it received a “D” grade and ranked last out of 17 OECD countries. In 2008, Canada generated 777 kg per capita of municipal waste, which was well above the 17-country average of 578 kg per capita and more than twice as much as Japan (377 kg/capita) (Conference Board of Canada, 2015). Residential solid waste is mostly organic and on average it makes up a third of total waste disposal in Canada, but this proportion varies widely by province. In Newfoundland and Labrador, residential sources accounted for 53% of waste disposal, compared to 24% in Alberta (Stat Canada 2015). The majority of residential waste is organic in origin. In Canada, waste management is a shared responsibility between federal, provincial/territorial, and municipal governments. The regional and municipal authorities are responsible for collecting and disposing of residential wastes and for managing facilities like landfill sites and incinerators, while the provinces and territories are responsible for approvals, licensing and monitoring of operations (Environment Canada, 2013a). The provincial governments provide frameworks for waste management by setting policies, regulations and standards. The federal government deals with MSW management issues related to sustainable development, toxic substances, international movement, federal lands and operations, and air emissions (including greenhouse gas emissions), and supports province/territories through federal funding programs for research and education. The most effective mode of waste management is not to produce the waste in the first place; secondarily it is to reduce the flow of wastes to landfills through sustainable diversion programs (reusing, recycling and material recovery, composting). Landfilling is the most common waste disposal method worldwide and its use is expected to increase as more developing countries are moving away from open dumping to landfilling (Lou and Nair, 2009). Landfills can accommodate waste materials of any size, shape or weight, and permit the combination of different types of wastes, whereas alternative waste management methods such as composting and incineration perform efficiently only when wastes are more uniform (both physically and chemically). Landfilling is more economical than other methods (e.g. composting and recycling) as it requires less infrastructure and no specialized collection services. Therefore, landfilling remains the most popular method for waste disposal in Canada and is likely to remain so, given its simplicity and flexibility and the immense amount of land available in Canada (Sawell, 1996). However, despite our heavy reliance on landfills and all their perceived benefits, they also pose environmental concerns for surrounding communities. Many landfill sites suffer from vermin, odours, windborne litter, and uncontrolled burning (Sawell, 1996). Landfill leachate is generated when excess rainwater percolates through the waste layers and becomes contaminated by waste

materials. Landfill leachate has the potential to pollute groundwater and surface water because traditionally most landfills were built without engineered liners or leachate collection systems (Kjeldsen et al., 2002). This danger is heightened by the disposal of inappropriate materials into landfills, including household items such as batteries, paint, oil, and medication. When discarded as garbage, leftover portions of these products become household hazardous waste. In some cases, electrical appliances like refrigerators, televisions, computers and cellphones also end up in landfills as e-waste. E-waste is chemically and physically distinct from other forms of municipal or industrial waste as it contains both valuable materials (reusable components) and hazardous materials that require special handling and recycling methods to avoid environmental contamination and harmful effects on human health (Robinson, 2009). When hazardous household waste and e-waste corrode, the heavy metals and toxins present in the waste will travel with the leachate into the surrounding environment (Li et al., 2009). Many landfills or municipalities have drop-off centers for these waste materials, but inappropriate disposal still persists and may cause environmental degradation. When waste is buried in a landfill, a complex series of biological and chemical reactions occurs over time as the waste decomposes. Landfills undergo four phases of bacterial decomposition: (1) an initial aerobic phase; (2) an anaerobic acid phase producing acids (e.g. acetic, lactic and formic acids) and alcohols (e.g. ethanol and methanol); (3) an initial methanogenic phase (anaerobic bacteria use the acids produced in phase 2 to form acetate, and methanogenic bacteria begin to establish themselves); and (4) a stable methanogenic phase (ATSDR, 2001). Recently, an additional aerobic or humic phase of decomposition has been proposed in cases where the rate of oxygen diffusion into the landfill exceeds the rate of microbial oxygen depletion, making the landfill an aerobic ecosystem (Kjeldsen, et al., 2002). Therefore, the composition of landfill leachate and its effect on natural water body not only depends on the type of wastes that were buried in to the landfill but also the age of the burials. A number of water quality parameters are employed to evaluate the suitability of water depending on whether the water is used for drinking, irrigation, industry, or recreation, or as habitat for natural aquatic organisms (Davis and McCuen, 2005). These parameters generally measure three categories of pollution: physical (odour, colour, heat etc.), chemical (inorganic compounds, elements or metals; organic compounds) and biological (e.g. pathogenic organisms). Regulatory agencies use these parameters to develop standards and guidelines depending on the intended users and uses of the water. The guidelines specify maximum and minimum values for the relevant parameters to establish ranges in which water must fall. Water sample quality is then determined based on whether it meets all of the requirements (Davis and McCuen, 2005). For some parameters (such as pH, DO and temperature) a range or minimum value is set, whereas for others (E. coli, COD, BOD, TOC, nutrients, metals) a maximum value is recommended. There are three water quality parameters that are used to assess organic pollutants: TOC, COD and BOD. Sometimes COD is used as an alternative to BOD measurement as it takes less time to measure and the measurements are quite reproducible (Aziz and Tebbutt, 1980). Bacterial activity generates landfill gases (LFG) composed primarily of methane (50 to 55%), carbon dioxide (45 to 50%), and less than 1 percent non-methane organic compounds and trace amounts of inorganic compounds (ATSDR, 2001). Methane is a potent GHG, with approximately 25 times the global warming potential of carbon dioxide (CO2), making landfills a

significant contributor to GHG emissions (Environment Canada, 2013b). GHG emissions from MSW are estimated to account for almost 5% of total global greenhouse gas emissions, and methane from landfills represents 12% of total global methane emissions (Hoornweg and Bahada-Tata, 2012). LFG is produced by the decomposition of waste and is estimated to contribute up to three per cent (23 million tonnes) of Canada’s annual GHG emissions of 720 million tonnes of eCO2 (equivalent CO2) per year (Federation of Canadian Municipalities, 2004). Happy Valley-Goose Bay is the biggest town in Labrador, and its municipal landfill is also used by other nearby communities. The landfill has almost reached the end of its useful life, and its construction and location raise environmental concerns. It is unlined, and its location in a sand pit suggests the possibility of leachate from the landfill contaminating surrounding groundwater. The large grain size of the sand would allow landfill leachate to percolate quickly and easily. Furthermore, the lack of proper disposal sites for hazardous material heightens the toxicity of the leachate and increases the potential for destruction of the natural environment. The expense of constructing and maintaining a lined landfill with an LFG collection system underscores the benefits of a cost-effective waste management system that has potential to address the both leachate and GHG generation. One promising approach is the application of biochar, a solid, carbonaceous product of the thermal conversion of biomass by slow or fast pyrolysis or gasification, which has been found to reduce GHG emissions, sequester carbon, remove contaminants from environmental media, and improve soil fertility by retaining nutrients, increasing cation exchange capacity (CEC), and raising pH (Kookana et al., 2011). Biochar has been shown to adsorb and remediate organic contaminants such as pesticide, dye, phenol, polycyclic aromatic hydrocarbons, benzene, nitrobenzene, etc. (Yu et al. 2009; Zheng et al. 2010; Uchimiya et al., 2012a; Yao et al., 2012), and to remediate inorganic contaminants such as Ni, Cu, Cd, Cr, Zn, Pb, Hg, fluorides, etc. (Mohan et al., 2007; Chen et al., 2011; Kong et al., 2011; Kookana et al., 2011; Beesley et al., 2011; Uchimiya et al., 2012b; Ippolito et al., 2012a; Mohan et al., 2014).
Most of the carbon in biochar is highly stable and can act as an effective carbon sink, thereby sequestering atmospheric CO2 (Sohi et al 2009). A small number of publications also suggest that soil application of biochar can suppress the emission of greenhouse gases other than CO2 (e.g. N2O, CH4). In a laboratory-scale study, Yanai et al (2007) found that biochar produced from municipal bio-waste was able to reduced N2O emissions from soil. Van Zwieten (2009) concluded based on other studies that the capacity for biochar to reduce N2O emissions varies based on the chemical composition of the biochar itself. The authors also cited other studies where the researchers measured reduced CH4 emissions when biochar was applied. Karhu et al. (2011) observed reduced CH4 emission from agricultural soil due to biochar amendment but no statistically significant differences were observed in the CO2 and N2O emissions between the biochar amended and control plots. Results from a column experiment reveal that biochar amendment to landfill cover soil is effective in increasing methane oxidizing bacterial populations and promoting CH4 oxidation and thus has the potential to reduce CH4 emission in landfills (Reddy et al., 2014). Sadasivam and Reddy (2015) from a batch and column adsorption studies reported that biochar-soil mix treatment adsorbed more CH4 compared to soil only treatment.

3.2 Objectives:
In this study we apply biochar to organic solid waste to see whether it has potential to reduce the toxicity of leachate and generation of GHG, particularly in the context of MSW in Happy Valley-Goose Bay, Labrador. The successful completion of this study may help to develop a cheaper and sustainable solution to reduce the contamination of air, land, and water at landfills through reducing GHG emissions and remediating the harmful effects of leachate generated by organic residential solid waste.
4. Research Plan and Methods: A laboratory-scale study was undertaken at the local municipal landfill site, using a number of HDPE rain barrels. The details of site preparation and experimental protocol are as follows: 4.1 Preparation of berm and setting up rain barrels: At first a berm was prepared and the barrels were placed on that berm. This arrangement facilitated easy collection of leachate samples through a drainage tube attached to the bottom of each barrel. Thereafter the barrels were buried partially under soil to secure them firmly in the ground, as shown in the images below.
Picture 1. Photographs showing preparation of berm and setting up rain barrels for experimentation 4.2 Collection of wastes: In Happy Valley-Goose Bay residential wastes are not separated at
source, and therefore organic wastes are mixed with different kinds of materials such as

cardboard and packaging materials, plastic, metal cans, polyethylene bags etc. As separating organic wastes from other wastes was found to be difficult, we decided to collect organic wastes from the local grocery stores and restaurants. The organic wastes that we collected were mainly composed of different kind of fruits (banana, apple, plum, orange, pineapples, grapes, kiwi fruits, water melon, cantaloupe, honeydew melon etc.), vegetables (tomato, potato, sweet potato, carrot, cabbage, celery, onions, broccoli, leafy vegetables etc.) and kitchen wastes from restaurants (readily decomposable organic wastes). We stored all collected wastes on site prior to use in the experiment.
4.3. Experimental Treatments: At the landfill, sand is used as cover material. A layer of day-
cover (i.e. sand) is placed over the waste each day and finally after a certain number of waste and day-cover layers, a final cover is placed. In our experiment we had 4 treatments (i.e. 4 kind of cover materials) as follows:
i) Sand (control) ii) Sand and torrefied char mix (1:1 v/v) iii) Sand and slow-pyrolysis biochar mix (1:1 v/v) iv) Sand and fast-pyrolysis biochar mix (1:1 v/v)
4.4 Experimental setup: On the day when the experiment was set up all the organic wastes
collected from grocery stores and restaurant were cut into smaller pieces and mixed thoroughly to make the waste homogeneous. Before the organic wastes were placed into the barrels, cover materials were prepared by mixing sand with different type of biochar to get the appropriate sand-biochar ratio. Thereafter, a layer of cover material (20 cm deep) material was placed at the bottom of each barrel. After a layer (30 cm) of organic waste another layer (30 cm) of cover material was placed over the waste layer. Each treatment was replicated three times and therefore, altogether we had 12 barrels.
Picture 2. Photograph showing mixing of biochar with sand
4.5 Collection of leachate: Leachate samples were collected through the drainage pipe attached at the base of each barrel. Samples were collected once in every two weeks and altogether five batches of samples were collected. The collected samples were filtered through a vacuum filtration system. HDPE bottles were used for collecting and storing leachate samples.

4.6 Collection of GHGs: A static chamber-based method was followed to capture the emitted GHGs (Luan and Wu, 2015). This gas collection system is composed of a collar, collection chamber and a removable cover with a collection port. The collars, chambers and covers are made of PVC (Polyvinylchloride). The PVC collars had an inner diameter of 26 cm and were permanently inserted (~10 cm) into the cover-materials (sand or sand-biochar mixture) of each barrel two weeks before the start of our air sampling in early July, 2016. The upper part of the collar had a groove and the chamber with the removable cover was placed onto the groove of the collar. Thereafter water was added to the groove to make the system airtight. Each chamber was 50 cm in height and 26.3 cm in diameter, and the cover had two capillary tubes: one was used as a collection port for air sampling and the other helped to maintain the atmospheric pressure inside the chamber while sampling. All of our measurements were conducted during the local time at 10:00-16:00 h. The air samples were taken during a 30-minute period starting from the time when the chamber-cover was placed, with samples being taken at 10-mimute interval. Therefore, during a 30-minute period, we took 4 air samples at 0, 10, 20 and 30 minutes from the chamber. A 30-ml luer-lock syringe fitted with a 4-way stopcock was used to take the air sample.
Picture 3. (a & b) Photographs showing collection of greenhouse gas; c) collar, chamber & cover shown separately; d) chamber with cover placed on collar; e) luer-lock syringe with 4-way stop cock.
4.7 Characterization of biochar:
4.7.1 Electrical conductivity (EC), pH and redox potential (Eh): The biochar samples were hand-ground with a mortar and pestle, sieved through a 2mm sieve, and measured for EC, pH and Eh (Table 1). Biochar pH and Eh were measured by Accumet Basic AB15 benchtop pH/Eh meter. EC was measured using a Sper Scientific Benchtop EC/ TDS/ salinity meter (Model # 860032). A water: biochar ratio of 20:1 (w/V) was used and each sample was subject to 90 minutes of shaking and equilibration time before pH and EC measurement (International Biochar Initiative standards Version 2.1; http://www.biochar-
c d e
a)
b)

international.org/characterizationstandard). Eh readings were recorded (Table 1) immediately after measuring pH and EC.
4.7.2 BET surface area: BET surface area, pore size and pore volume were analyzed (Table 1) using a TriStar II Plus 2.02 surface area and porosity analyzer at the Department of Process Engineering (Courtesy of Professor Kelly Hawboldt), Memorial University.
4.7.3 Thermogravimetric analysis (TGA): TGA was carried out (Table 1) using 2.0-4.0 mg
samples on a TGA TA Instruments model Q500 v 20.10 analyzer at Department of Chemistry (Courtesy of Professor Bob Helleur), Memorial University. Experiments were performed at a constant heating rate of 15 oC/min from room temperature up to 750 °C in an inert environment (pure nitrogen) with a flow rate of 50 mL/min. The temperature was held at 750 °C and the gas was replaced with air (50ml/min) for 15 min to fully oxidize the sample and determine the percent ash. Percent volatiles were determined by the mass percent of the char that volatized between 150-450 °C. Percent moisture was the weight loss from the starting temperature up to 105 °C. Fixed carbon was calculated by 100% - %volatile carbon - % ash - % moisture.
4.7.4 Total elemental analysis (ICP/ ICP-MS): Biochar samples were sent to Activation
Laboratories Ltd., Ancaster, Ontario for total elemental analysis (Pkg code: ultratrace 6). The samples were digested using 4-acid digestion (HF, HClO4, HNO3 and HCl) method and analyzed by ICP-OES (for P and S) and ICP-MS (the rest of the elements). The results of total elemental analysis are shown in Table 2.
Table 1. Comparison of the physicochemical properties of biochar
Properties FPB SPB TCpH 8.8 8.6 5.3Eh (mV) 70 95 162EC (µS/cm) 196 112 119BET surface area (m²/g) 186.8 255.1 1.13Pore volume (cm³/g) 0.071 0.099 NDPore size (Å) 15.49 15.74 NDTGAMoisture (%) 0.01 2.485 1.93Volatile (%) 2.68 3.53 70.55Ash (%) 4.20 2.795 1.24Fixed carbon (%) 93.11 91.19 26.28
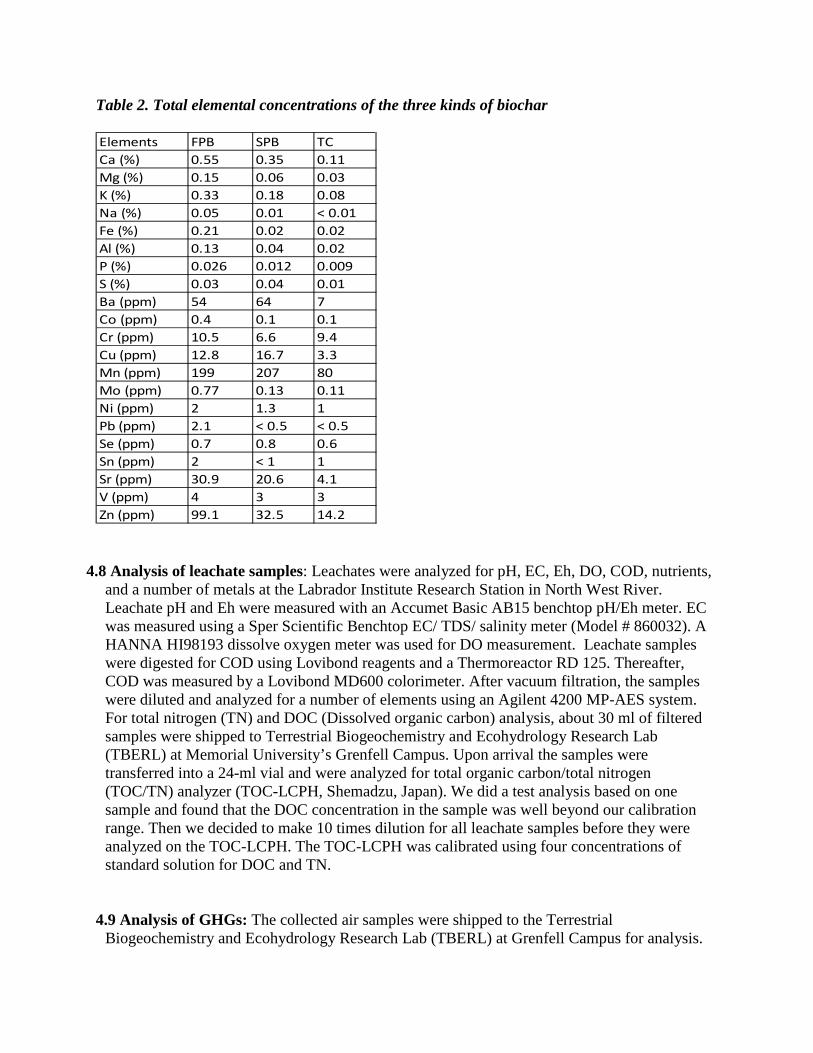
Table 2. Total elemental concentrations of the three kinds of biochar
4.8 Analysis of leachate samples: Leachates were analyzed for pH, EC, Eh, DO, COD, nutrients,
and a number of metals at the Labrador Institute Research Station in North West River. Leachate pH and Eh were measured with an Accumet Basic AB15 benchtop pH/Eh meter. EC was measured using a Sper Scientific Benchtop EC/ TDS/ salinity meter (Model # 860032). A HANNA HI98193 dissolve oxygen meter was used for DO measurement. Leachate samples were digested for COD using Lovibond reagents and a Thermoreactor RD 125. Thereafter, COD was measured by a Lovibond MD600 colorimeter. After vacuum filtration, the samples were diluted and analyzed for a number of elements using an Agilent 4200 MP-AES system. For total nitrogen (TN) and DOC (Dissolved organic carbon) analysis, about 30 ml of filtered samples were shipped to Terrestrial Biogeochemistry and Ecohydrology Research Lab (TBERL) at Memorial University’s Grenfell Campus. Upon arrival the samples were transferred into a 24-ml vial and were analyzed for total organic carbon/total nitrogen (TOC/TN) analyzer (TOC-LCPH, Shemadzu, Japan). We did a test analysis based on one sample and found that the DOC concentration in the sample was well beyond our calibration range. Then we decided to make 10 times dilution for all leachate samples before they were analyzed on the TOC-LCPH. The TOC-LCPH was calibrated using four concentrations of standard solution for DOC and TN.
4.9 Analysis of GHGs: The collected air samples were shipped to the Terrestrial
Biogeochemistry and Ecohydrology Research Lab (TBERL) at Grenfell Campus for analysis.
Elements FPB SPB TCCa (%) 0.55 0.35 0.11Mg (%) 0.15 0.06 0.03K (%) 0.33 0.18 0.08Na (%) 0.05 0.01 < 0.01Fe (%) 0.21 0.02 0.02Al (%) 0.13 0.04 0.02P (%) 0.026 0.012 0.009S (%) 0.03 0.04 0.01Ba (ppm) 54 64 7Co (ppm) 0.4 0.1 0.1Cr (ppm) 10.5 6.6 9.4Cu (ppm) 12.8 16.7 3.3Mn (ppm) 199 207 80Mo (ppm) 0.77 0.13 0.11Ni (ppm) 2 1.3 1Pb (ppm) 2.1 < 0.5 < 0.5Se (ppm) 0.7 0.8 0.6Sn (ppm) 2 < 1 1Sr (ppm) 30.9 20.6 4.1V (ppm) 4 3 3Zn (ppm) 99.1 32.5 14.2

The air samples were then transferred to pre-vacuumed 12-ml vials (Labco, U.K.) for analysis on the Bruker GHG Gas Chromatograph (GC) (Bruker, Canada). The GHG GC is configured with two chromatographic channels. Channel one is equipped with a TCD (Thermal Conductivity Detector) and an FID (Flame Ionization Detector) in series for the analysis of carbon dioxide and methane. The second channel is equipped with an ECD (Electron Capture Detector) for the analysis of nitrous oxide. The GHG GC was calibrated using two concentrations of standard gases before the samples were analyzed. All fluxes were adjusted for field sampling temperature, headspace volume, and chamber area (Holland et al., 1999), and calculated by linear regression using the four time point samples:
F=(dC/dt)*M*V/A
Where F is the GHG flux, dC/dt is the concentration gradient over the sampling period (ppm s-
1), M is the conversion constant for each GHG in the unit of mg m-3 ppm-1, V is the chamber volume and A is the chamber cover area (i.e. V/A is the chamber height in m). Therefore, the unit of calculated flux becomes mg/ m2/second. A one-way ANOVA analysis was employed to examine the effects of the treatments on GHG fluxes.
5. Results and Discussion
5.1 Effect of sand and different types of biochar plus sand on leachate properties:
5.1.1 Effect of treatments on pH: In this study we did not observe huge differences in pH due to application of treatments (Figure 1). The mean pH was highest in sand, followed by sand + TC, sand + FPB and sand + SPB (Table 3). There were higher variations among the replicates for sand and sand + TC treatments compared to the other two treatments. The failure of biochar to increase the pH was not expected, as there have been numerous studies where biochar has been successfully used to increase the pH of the media especially in acidic soil (Kookana et al., 2011; Yuan and Xu, 2011; Deal et al. 2012). As there were no previous studies reporting the appropriate dose of biochar on organic wastes, such results could be due to suboptimal doses of biochar.
Figure 1. Effect of different types of biochar on leachate pH. Error bar shows ±SE.

5.1.2 Effect of treatments on leachate Eh: The redox potential (Eh) of the leachate samples varied with both sampling time and treatments. The highest Eh was measured in sampling 1 irrespective of treatments, and thereafter, Eh continued to decrease in each consecutive sampling, while the most reduction in Eh occurred in the sand-only treatment (Figure 2). The lowest Eh was observed in sampling 5 for all the treatments. Mean leachate Eh values were generally higher in biochar treatments at different sampling times, with the highest value in ‘sand + SPB’ treatment (Table 3), might be due entrapped air in the pore spaces of biochar. In general, there was a negative correlation between pH and Eh (Figure 3).
Figure 2. Effect of different types of biochar on the redox potential (Eh) of leachate. Error bar shows ±SE.
Figure 3. Relationship between pH and Eh in the leachate samples.

5.1.3 Effect of treatments on leachate EC: Measured values for EC decreased with time (Figure 4). However, there was no difference in EC among the treatments at any sampling time (Table 3).
Figure 4. Effect of different types of biochar on the electrical conductivity (EC) of leachate. Error bar shows ±SE. Table 3. Effect of biochar treatments on pH, Eh and EC of leachate samples
5.1.4 Dissolved oxygen (DO): Dissolved oxygen (DO) is an important water quality parameter as it influences aerobic respiration and it regulates oxidation-reduction potential. In polluted water, DO levels are generally low; a higher dissolved oxygen level generally indicates good water quality. The DO was measured in the leachate samples immediately after their collection. Due to a technical issue with our DO meter, DO was not measured in the samples collected at
Treatment pH Eh (mV) EC (mS/cm)sand 4.05 A 61 B 5.29 Asand +TC 3.97 AB 84 B 5.56 Asand +SPB 3.90 B 110 A 5.34 Asand + FPB 3.98 AB 79 B 5.57 Ap value 0.028 0.002 0.818
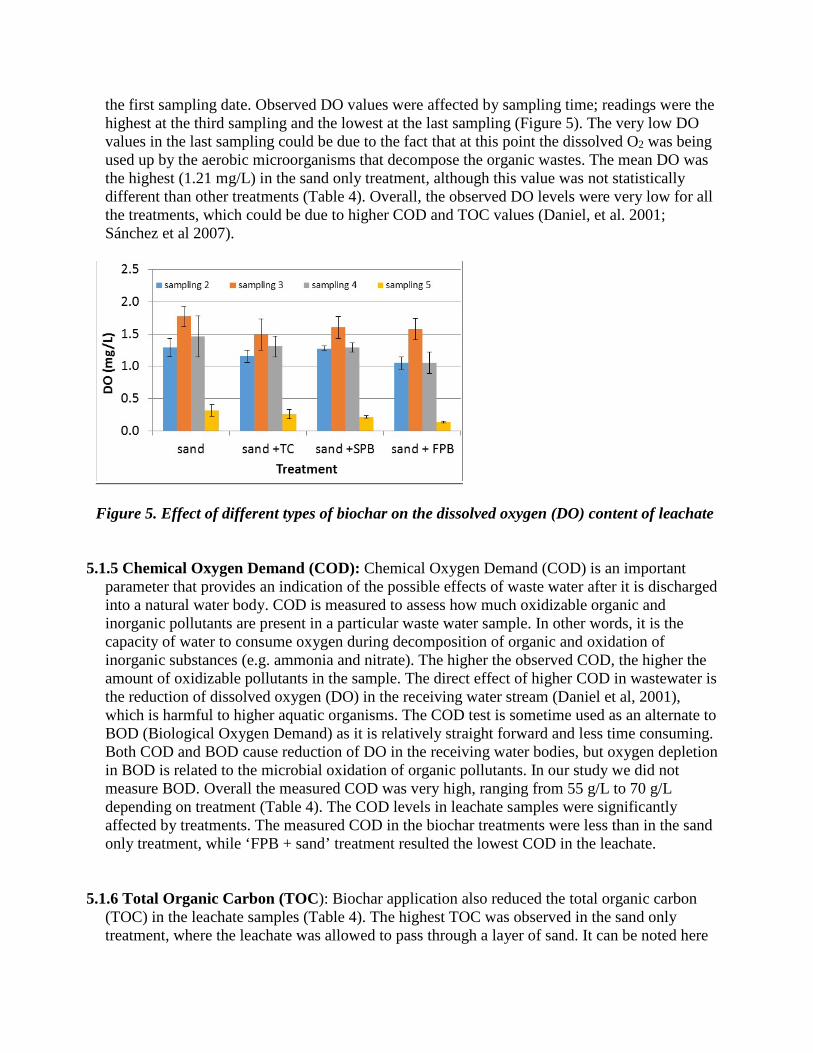
the first sampling date. Observed DO values were affected by sampling time; readings were the highest at the third sampling and the lowest at the last sampling (Figure 5). The very low DO values in the last sampling could be due to the fact that at this point the dissolved O2 was being used up by the aerobic microorganisms that decompose the organic wastes. The mean DO was the highest (1.21 mg/L) in the sand only treatment, although this value was not statistically different than other treatments (Table 4). Overall, the observed DO levels were very low for all the treatments, which could be due to higher COD and TOC values (Daniel, et al. 2001; Sánchez et al 2007).
Figure 5. Effect of different types of biochar on the dissolved oxygen (DO) content of leachate
5.1.5 Chemical Oxygen Demand (COD): Chemical Oxygen Demand (COD) is an important parameter that provides an indication of the possible effects of waste water after it is discharged into a natural water body. COD is measured to assess how much oxidizable organic and inorganic pollutants are present in a particular waste water sample. In other words, it is the capacity of water to consume oxygen during decomposition of organic and oxidation of inorganic substances (e.g. ammonia and nitrate). The higher the observed COD, the higher the amount of oxidizable pollutants in the sample. The direct effect of higher COD in wastewater is the reduction of dissolved oxygen (DO) in the receiving water stream (Daniel et al, 2001), which is harmful to higher aquatic organisms. The COD test is sometime used as an alternate to BOD (Biological Oxygen Demand) as it is relatively straight forward and less time consuming. Both COD and BOD cause reduction of DO in the receiving water bodies, but oxygen depletion in BOD is related to the microbial oxidation of organic pollutants. In our study we did not measure BOD. Overall the measured COD was very high, ranging from 55 g/L to 70 g/L depending on treatment (Table 4). The COD levels in leachate samples were significantly affected by treatments. The measured COD in the biochar treatments were less than in the sand only treatment, while ‘FPB + sand’ treatment resulted the lowest COD in the leachate.
5.1.6 Total Organic Carbon (TOC): Biochar application also reduced the total organic carbon (TOC) in the leachate samples (Table 4). The highest TOC was observed in the sand only treatment, where the leachate was allowed to pass through a layer of sand. It can be noted here

that TOC readings were positively correlated (r = 0.34, p = 0.009) with COD, and such results have also been reported by other researchers (Hill and Spiegel, 1980; Dubber and Gray, 2010).
Table 4. Effect of biochar treatments on DO, COD and TOC of leachate samples
5.1.7 Elemental concentrations: There were variations in the concentrations of elements due to the differing treatments (Table 5). Biochar decreased concentrations for N, P, Ba, Fe, Cr and Al in the leachate samples. The concentrations of these elements were highest in the sand only treatment, although for P the increase was not significant. From an environmental point of view, such decreases of elemental concentrations in leachate are important, as elevated concentrations of nutrients in water diminish its suitability for drinking, irrigation, and industrial purposes. Draining of nutrient- and metal-rich leachates into natural water body may accelerate eutrophication and be hazardous for fish and other aquatic organisms (Kramer, 1987; Camargo and Alonso, 2006; Vaquer-Sunyer, R. and Duarte, 2008; Ansari et al. 2010). The concentrations of Cu and Zn, however, were higher in biochar treatments. This could be due to the liberation of some of the total Cu and Zn from the biochar materials (SPB and SFB).
Table 5. Effect of biochar on elemental concentrations in the leachate samples
Note: ns = not significant at α = 0.05; * = significant at α = 0.05; ** = significant at α = 0.01 and *** = significant at α = 0.001; a = storm sewer discharge limit by City of Toronto (Toronto Municipal Code: Chapter 681, Sewers)
5.1.8 Quality of leachate: In Newfoundland and Labrador, the relevant legislations pertaining to the municipal wastewater effluents are the Water Resources Act (SNL 2002 cW 4.01) and the Environmental Control Water and Sewage Regulations, 2003 (O.C. 2003-231) under the Water Resources Act. Most of the parameters of our study exceeded the limits set for sewage or
Treatment DO (mg/L) COD (g/L O2) TOC (g/L)sand 1.21 A 69 A 16.1 Asand +TC 1.05 A 67 A 12.9 Bsand +SPB 1.1 A 59 AB 12.9 Bsand + FPB 0.96 A 54 B 13.0 Bp value 0.761 0.015 0.091
N P Ca K Mg Na Ba Fe Mn Zn Cu Sr Cr Al
sand 899 A 254 A 239 B 2183 A 194 B 167 B 7.7 A 1305 A 11.7 B 3.5 B 1.7 B 2.60 AB 1.70 A 772 Asand + TC 811 AB 240 A 503 A 2116 A 228 A 280 A 5.1 B 697 B 15.6 A 11.2 A 16.1 A 2.48 AB 0.99 B 585 Bsand + SPB 821 AB 226 A 286 B 2150 A 186 B 220 AB 4.6 B 594 B 10.9 B 8.2 A 9.8 AB 2.37 B 0.82 B 624 ABsand + FPB 761 B 242 A 447 A 2183 A 209 AB 174 B 4.0 B 843 B 14.0 AB 10.5 A 7.9 AB 2.79 A 1.07B 525 Bp * ns *** ns ** * *** ** * ** * * ** *LSD 128 74 208 219 32 88 2.6 494 3.2 4.6 10.0 0.25 0.61 162MAL (mg/L) 12 0.01 5 10 0.05a 0.5 0.3 1.00
Treatmentmg/L

effluent discharging into water bodies. For comparison, maximum allowable limits (MAL) set by the regulation are presented in the Table 5. The pH of leachate samples were between 3.9 and 4.05 whereas the range set by the regulations was between 5.5 and 9.0. The limit for nitrogen set by the regulations was 12 mg/L, whereas nitrogen content in the leachate samples were 60 to 75 times higher. For total phosphorus (elemental), the limit is 0.0005 mg/L while leachate concentrations exceeded 220 mg/L. The exceedance for Fe, Cu and Zn were also remarkable; 60-130 times for Fe, 6-50 times for Cu and 7-22 times for Zn. The concentrations of Cr and Ba also exceeded up to 1.5 times in some of the treatments. There are no limits set for certain parameters, such as EC, COD, TOC, Ca, Mg, K, Na and Sr. Although no limits are set for these parameters, some of them may cause consumer concerns with the aesthetics of their water, such as color, taste, hardness, turbidity, corrosivity etc. Although there were some positive effects of biochar application on the concentrations of N, P, Fe, Al and Cr, they were not good enough to keep the concentrations within the limit. It could be due the fact that the biochar dose that we used for this study was not sufficient to keep the concentrations within the limits. Therefore, further studies are needed to examine how the doses of biochar application would affect the qualities of leachates.
5.2 Landfill GHG emissions affected by different treatments
5.2.1 CO2 emissions:
Figure 6. Effect of sand and different types of biochar plus sand on CO2 emission from organic solid wastes. Error bars show ±SE
Among the four treatments used in this study, sand + FPB treatments had the lowest mean CO2 emission (Figure 6). However, the one-way ANOVA analysis indicated that the CO2 emissions did not have significant differences among the treatments (F=0.667, p=0.585). Our data indicated

that all the three biochar treatments had negative mean emission (i.e. acted as sinks rather than sources) but they are statistically similar despite considerable differences among them. All the measurements also showed that there were small amounts of CO2 emission from each treatment, indicating lower levels of microbial respiration. However, it was not clear if the results would be altered if the measurements were continued over a longer period of time.
5.2.2 CH4 emissions:
Figure 7. Effect of sand and different types of biochar plus sand on CH4 emission from organic solid wastes. Error bars show ±SE
All the biochar treatments had marginally lower CH4 emissions (F=1.72, p=0.173) than that of the ‘sand’ treatment, but only Sand+FPB treatments showed a statistically significant reduction (Figure 7) in CH4 emissions (p=0.039). Although the biochar treatments did have the reduction in CH4 emissions, they still emitted a fairly significant amount of CH4, in particular for Sand+SPB and Sand+TC treatments. Considering that all the biochar treatments did not have significant effects on soil respiration (Figure 6) and N2O emissions (Figure 8), Sand+FPB can be considered as an effective GHG mitigation treatment for the organic wastes in land fill sites. However, it is not clear how changes in environmental conditions, such as moisture, the quality and type of organic waste, and air/soil temperature might change the effects on CH4 emissions over a longer period of time. Moreover, to understand the mechanisms behind the changes in CH4 emissions due to the treatments would require further investigation of the changes in function and structure of methanogenic bacteria in landfill sites.

5.2.3 N2O emissions:
Figure 8. Effect of sand and different types of biochar plus sand on N2O emission from organic solid wastes. Error bars show ±SE
Figure 8 presents the N2O fluxes observed in different treatments. One-way ANOVA analysis suggested that N2O emissions did not differ significantly among the treatments (F=0.687, p=0.573). N2O emissions are primarily linked with nutrient conditions and soil water content, and thus the nutrient contents and water holding capacity of different landfill materials would significantly change the impacts of different treatments on N2O emissions. Further research is required to understand the differences in nutrient and water contents for different landfill materials, and how they would potentially affect GHG emissions.
6. Communications and Outreach The results of this project will be presented at future workshop/seminar and/or will be published in peer reviewed scientific journals in Canada or elsewhere. A copy of this report will also be shared with the Town of Happy Valley-Goose Bay.
7. Conclusion and Recommendations
The collected leachate can be characterized by its high acidity (pH <4.2), EC, COD, TOC, nutrients, metals, and its low DO. Many of these parameters were significantly affected by different cover materials made up of sand and different types of biochar (sand+TC, sand+SPB, and sand+FPB). All three types of biochar plus sand treatments significantly decreased TOC, Ba, Fe and Cr concentrations, while FPB plus sand significantly decreased COD, N and Al

concentrations as well. Therefore, among the three types of biochar used in this study, FPB was found to be the best for reducing contaminants from the leachate. In this study we used biochar and sand at 1:1 (V/V) ratio. Further study is required to establish whether increased doses or prolonged periods of application would increase the efficacy of the treatments.
Biochar+sand treatments considerably lowered mean CO2 emissions, but the reductions were not statistically significant compared to sand alone treatment. FPB+sand treatments showed a significant reduction in CH4 emissions. Although the biochar treatments reduced CH4 emissions, samples still emitted a fairly significant amount of CH4, in particular for Sand+SPB and Sand+TC treatments. Whether increased doses of biochar would cause further reduction cannot be evaluated from this current study. Considering that none of the biochar treatments had significant effects on CO2 and N2O emissions, Sand+FPB can be considered as an effective GHG mitigation treatment for organic wastes in land fill sites.
The results we received through this study were encouraging as we observed significant reduction of a number of contaminants in the leachate and reduction of CH4, a potent GHG in the ‘sand plus biochar’ treatment relative to the sand alone treatment. However, in some cases the effects were not substantial. One should remember that this was a one season study, and much more investigation is needed in regard to waste type (moisture content, nutrient content), waste decomposability (i.e. microbial activities, time for decomposition), biochar-sand ratio and method of application. Therefore, it would be worthwhile to set up long-term studies to examine how treatments could possibly affect biotic and abiotic variables and change the functions and structures of microbial communities in landfill sites to alter the composition of leachates and GHG emissions.
8. References Ansari, A. A., Gill, S. S. and Khan, F. A. (2010). Eutrophication: threat to aquatic ecosystems. In
Eutrophication: causes, consequences and control (pp. 143-170). Springer Netherlands. ATSDR (Agency for Toxic Substances and Disease Registry) (2001). Chapter 2. In Landfill Gas
Primer - An Overview for Environmental Health Professionals. pp. 3-14, ATSDR, Atlanta, USA.
Aziz, J. A and Tebbutt, T. H. Y. (1980). Significance of COD, BOD and TOC correlations in kinetic models of biological oxidation. Water Research, 14(4), 319-324.
Beesley L., Moreno-Jiménez E., Gomez-Eyles J.L., Harris E., Robinson B and Sizmur T (2011). Environmental Pollution 159: 3269-3282.
Camargo, J.A. and Alonso, A. (2006). Ecological and toxicological effects of inorganic nitrogen pollution in aquatic ecosystems: A global assessment. Environment international, 32:831-849.

Chen, X., Chen, G., Chen, L., Chen, Y., Lehmann, J., McBride, M. B. and Hay, A. G. (2011). Adsorption of copper and zinc by biochars produced from pyrolysis of hardwood and corn straw in aqueous solution. Bioresource technology, 102(19), 8877-8884.
Chislock, M. F., Doster, E., Zitomer, R. A. and Wilson, A. E. (2013) Eutrophication: Causes, Consequences, and Controls in Aquatic Ecosystems. Nature Education Knowledge 4(4):10
Daniel, M. H., Montebelo, A. A., Bernardes, M. C., Ometto, J. P., De Camargo, P. B., Krusche, A. V., ... & Martinelli, L. A. (2002). Effects of urban sewage on dissolved oxygen, dissolved inorganic and organic carbon, and electrical conductivity of small streams along a gradient of urbanization in the Piracicaba river basin. Water, Air, and Soil Pollution, 136(1-4), 189-206.
Davis, A. P., & McCuen, R. H. (2005). Water Quality Parameters. In Stormwater Management for Smart Growth, pp 12-36. Springer Netherlands.
Deal, C., Brewer, C.E., Brown, R.C., , Okure, M.A. E., & Amoding, A. (2012). Comparison of kiln-derived and gasifier-derived biochars as soil amendments in the humid tropics. Biomass and Bioenergy, 37, 161-168.
Dubber D and Gray N.F (2010). Replacement of chemical oxygen demand (COD) with total organic carbon (TOC) for monitoring wastewater treatment performance to minimize disposal of toxic analytical waste. Journal of Environmental Science and Health, Part A, 45:1595-1600.
Environment Canada (2013a). Environment Canada website. Link: https://www.ec.gc.ca/gdd-mw/default.asp?lang=En&n=EF0FC6A9-1
Environment Canada (2013b). Technical Document on Municipal Solid Waste Organics Processing. (Cat. No.: En14-83/2013E;ISBN: 978-1-100-21707-9). EPA (2013). (source: http://www.epa.gov/epawaste/nonhaz/municipal/index.htm)
Federation of Canadian Municipalities (2004). Solid Waste as a Resource: Guide for Sustainable Communities (www.fcm.ca)
Hill, D. R. and Spiegel, S. J. (1980). Characterization of industrial wastes by evaluating BOD, COD, and TOC. Journal (Water Pollution Control Federation), 2704-2708.
Holland, E.A., Robertson, G.P., Greenberg, J., Groffman, P.M., Boone, R.D., Gosz, J.R.(1999). Soil CO2, N2O, and CH4 exchange. Standard Soil Methods for Long-term Ecological Research. Oxford University Press, Oxford, pp. 185–201.
Hoornweg, D and Bhada-Tata, P (2012). Urban Development Series Knowledge Papers (publication no. 15) .The World Bank, Washington, DC 20433 USA.
IPCC, 2006. Chapter 2: Waste Generation, Composition and Management Data. In Guidelines for National Greenhouse Gas Inventories (Volume 5 Waste). Institute for Global Environmental Strategies (IGES), Hayama, Japan on behalf of the IPCC
Ippolito, J. A., Laird, D. A. and Busscher, W. J. (2012). Environmental benefits of biochar. Journal of environmental quality, 41(4), 967-972.
Karhu, K., Mattila, T., Bergström, I. and Regina, K. (2011). Biochar addition to agricultural soil increased CH 4 uptake and water holding capacity–results from a short-term pilot field study. Agriculture, Ecosystems & Environment, 140(1), 309-313.
Kjeldsen, P., Barlaz, M. A., Rooker, A. P., Baun, A., Ledin, A. and Christensen, T. H. (2002). Present and long-term composition of MSW landfill leachate: a review. Critical reviews in environmental science and technology, 32(4), 297-336.

Kong, H., He, J., Gao, Y., Wu, H. and Zhu, X. (2011). Cosorption of phenanthrene and mercury (II) from aqueous solution by soybean stalk-based biochar. Journal of agricultural and food chemistry, 59(22), 12116-12123.
Kookana,R.S., Sarmah, A.K., Van Zwieten, L., Krull, E. & Singh, B. (2011). Biochar application to Soil: agronomic and environmental benefits and unintended consequences. Advances in Agronomy, 112, 103-143.
Kramer, D.L. (1987). Dissolved oxygen and fish behavior. Environmental Biology of Fishes, 18 (2): 81-92.
Li, Y., Richardson, J. B., Bricka, R. M., Niu, X., Yang, H., Li, L. and Jimenez, A. (2009). Leaching of heavy metals from E-waste in simulated landfill columns. Waste Management, 29(7), 2147-2150.
Lou, X.F and Nair, J. (2009). The impact of landfilling and composting on greenhouse gas emissions–a review. Bioresource technology, 100(16), 3792-3798.
Luan, J., and Wu, J. (2015). Long-term agricultural drainage stimulates CH4 emissions from ditches through increased substrate availability in a boreal peatland. Agriculture, Ecosystems and Environment, 214: 68-77.
Mohan, D., Sarswat, A., Ok, Y. S. and Pittman, C. U. (2014). Organic and inorganic contaminants removal from water with biochar, a renewable, low cost and sustainable adsorbent–a critical review. Bioresource technology, 160, 191-202.
Mohan Jr D., Pittman C.U., Bricka M., Smith F., Yancey B., Mohammad J., Steele P.H., Alexandre-Franco M.F., Gomez-Serrano V and Gong H (2007). Journal of Colloid and Interface Science. 310:57–73.
Reddy, K. R., Yargicoglu, E. N., Yue, D. and Yaghoubi, P. (2014). Enhanced microbial methane oxidation in landfill cover soil amended with biochar. Journal of Geotechnical and Geoenvironmental Engineering, 140(9), 04014047.
Robinson, B. H. (2009). E-waste: an assessment of global production and environmental impacts. Science of the total environment, 408(2), 183-191.
Sadasivam, B.Y. and Reddy, K.R. (2015). Adsorption and transport of methane in landfill cover soil amended with waste-wood biochars. Journal of Environmental Management, 158: 11-23.
Sánchez, E., Colmenarejo, M. F., Vicente, J., Rubio, A., García, M. G., Travieso, L. and Borja, R. (2007). Use of the water quality index and dissolved oxygen deficit as simple indicators of watersheds pollution. Ecological Indicators, 7(2), 315-328.
Sawell, S. E., Hetherington, S. A. and Chandler, A. J. (1996). An overview of municipal solid waste management in Canada. Waste management, 16(5-6), 351-359.
Sohi, S., Loez-Capel, E., Krull, E. and Bol, R. (2009). CSIRO Land and Water Science Report 05/09, 64 pp.Kookana, R.S., Sarmah, A.K., Stat Canada (2015). (Source: http://www.statcan.gc.ca/pub/16-201-x/2012000/part-partie3-eng.htm)
The Conference Board of Canada (2015). (http://www.conferenceboard.ca/hcp/details/environment/municipal-waste-generation.aspx)
Uchimiya, M., Cantrell, K. B., Hunt, P. G., Novak, J. M. and Chang, S. (2012b). Retention of heavy metals in a Typic Kandiudult amended with different manure-based biochars. Journal of environmental quality, 41(4), 1138-1149.

Uchimiya, M., Wartelle, L. H. and Boddu, V. M. (2012a). Sorption of triazine and organophosphorus pesticides on soil and biochar. Journal of agricultural and food chemistry, 60(12), 2989-2997.
Van Zwieten, L., Singh, B., Joseph, S., Kimber, S., Cowie, A., Chan, K.Y. (2009). In: Lehmann, J., Joseph, S. (Eds.), Biochar for Environmental Management – Science and Technology. Earthscan, Washington DC, pp. 227–249.
Vaquer-Sunyer, R. and Duarte, C. M. (2008). Thresholds of hypoxia for marine biodiversity. Proceedings of the National Academy of Sciences, 105(40), 15452-15457.
Yanai, Y., Toyota, K., Okazaki, M.(2007). Effects of charcoal addition on N2O emissions from soil resulting from rewetting air-dried soil in short-term laboratory experiments. Soil Science and Plant Nutrition. 53, 181–188.
Yao, Y., Gao, B., Chen, H., Jiang, L., Inyang, M., Zimmerman, A. R., and Li, H. (2012). Adsorption of sulfamethoxazole on biochar and its impact on reclaimed water irrigation. Journal of hazardous materials, 209, 408-413.
Yu, X., Ying, G., & Kookana, R. S. (2009). Reduced plant uptake of pesticides with biochar additions to soil. Chemosphere, 76(5), 665-671.
Yuan, J.-H., & Xu, R.-K. (2011). The amelioration effects of low temperature biochar generated from nine crop residues on an acidic Ultisol. Soil Use and Management, 2011, 27, 110–115.
Zheng, W., Guo, M., Chow, T., Bennett, D. N. and Rajagopalan, N. (2010). Sorption properties of greenwaste biochar for two triazine pesticides. Journal of Hazardous Materials, 181(1), 121-126.