applying a cognitive architecture to hci (pdf) - chil at...
TRANSCRIPT

ACT-R/PM and Menu Selection:
Applying a Cognitive Architecture to HCI
Michael D. Byrne
Department of Psychology
Rice University
6100 Main Street, MS-25
Houston, TX 77005-1892
U.S.A.
+1 713-348-3770 voice
+1 713-348-5221 fax
March 14, 2001
ACT-R/PM for HCI
1

Abstract
Understanding the interaction of a user with a designed device such as a GUI requires clear
understanding of three components: the cognitive, perceptual, and motor capabilities of the user,
the task to be accomplished, and the artifact used to accomplish the task. Computational
modeling systems which enable serious consideration all of these constraints have only recently
begun to emerge. One such system is ACT-R/PM, which is described in detail. ACT-R/PM is a
production system architecture that has been augmented with a set of perceptual-motor modules
designed to enable the detailed modeling of interactive tasks. Nilsen’s (1991) random menu
selection task serves two goals: to illustrate the promise of this system and to help further our
understanding of the processes underlying menu selection and visual search. Nilsen’s original
study, two earlier models of the task, and recent eye-tracking data are all considered. Drawing
from the best properties of the previous models and guided by information from the eye-tracking
experiment, a series of new models of random menu selection were constructed using ACT-
R/PM. The final model provides a zero-parameter fit to the data that does an acceptable, though
imperfect, job of capturing the data.
ACT-R/PM for HCI
2

The Psychology of Human-Computer Interaction (Card, Moran, & Newell, 1983) is often
credited with the creation of the field of human-computer interaction and is, at the very least, one
of its most central early influences. This book introduced the Model Human Processor (MHP) as
an engineering model of human performance and GOMS (for goals, operators, methods, and
selection rules) as a method of task analysis. The conceptual basis for GOMS and, at heart, the
underlying belief about the best way to flesh out the MHP, is production rule systems. Since that
time, the dominant production rule systems have been the ACT family of systems (Anderson,
1983, 1993; Anderson & Lebiere, 1998) and the Soar architecture (Newell, 1990). EPIC (Kieras
& Meyer, 1997) is a more recent, but promising and influential, entry into this arena.
The applicability and success of GOMS and its MHP-inspired extension, CPM-GOMS
(see John & Kieras, 1996, for a review), has clearly indicated that this is a fruitful approach for
desktop-style user interfaces. However, the future of the human-computer interface is not on the
desktop. Increasingly, computers with user interfaces are appearing in tasks where they
previously have not been present, such as automobile navigation systems. These new
applications provide significant challenges, both practical and theoretical, to traditional analyses.
These interfaces are increasingly multi-modal and time-critical. While a 200 ms difference in
execution times for a simple operator in a desktop application may be inconsequential, the same
difference in an in-car navigation system can have serious safety implications. Thus, it is
incumbent on researchers in HCI to develop methods for dealing with the full complexity of
high-performance multi-modal interfaces. Traditional GOMS analysis will not be enough.
This paper presents a theoretical framework and computational modeling system
designed to address such applications. The system is ACT-R/PM, for ACT-R Perceptual-Motor,
and is based on the most recent ACT-R production system architecture (Anderson & Lebiere,
1998). The goal of this paper is to describe the ACT-R/PM system in detail and provide an
example of the kind of analysis and modeling that this architecture enables with a model of an
apparently simple task, the selection of single-character items from a randomly-ordered menu.
While this task is somewhat artificial, it provides some insight into the issues involved in high-
performance user interfaces. Before delving in detail into ACT-R/PM or the menu selection task,
a general framework for analyzing interactive tasks will be described.
ACT-R/PM for HCI
3

1. The Embodied Cognition-Task-Artifact (ETA) Triad
Gray (2000; Gray & Altmann, in press) describes the beginnings of a framework for
understanding interactive behavior, the Cognition-Task-Artifact triad, and the ETA framework is
based on that idea with some modification. The central notion is that interactive behavior of a
user interacting with an interface is a function of the properties of three things: the cognitive,
perceptual, and motor capabilities of the user, termed Embodied Cognition, the Task the user is
engaged in, and the Artifact the user is employing in order to do the task (see Figure 1).
--------- insert Figure 1 about here ----------
As Gray and Altmann describe, traditional disciplines have generally considered these
pairwise rather than as a triad. Computer scientists have traditionally considered the design of
artifacts to support particular tasks, but often ignored constraints imposed by the capabilities and
limitations of the user. Conversely, the experimental psychology community has typically
considered the user, but often with artificial tasks or in context that minimize or eliminate the
role of the artifact. Ethnographic analysis typically considers the context of artifacts and the
tasks, but often overlooks issues rooted in the capabilities and limitations of the human element.
Cognitive modeling forces the analyst to consider all three at once. A modeling system
such as Soar or EPIC provides a description of the capabilities and limitations of the user, but
contains no task or artifact. However, for a simulation model to run based on a such a system, it
must be given both a task to perform and a complete and detailed description of the artifact being
used.
First, interactive behavior depends upon the user’s Embodied Cognition. Gray and
Altmann have referred to this member of the triad simply as “Cognition,” but this route has not
been taken here because it is more than just the cognitive capabilities and limitations of the user
that matter, but the perceptual-motor as well. Traditional AI and cognitive science systems have
made the mistake of treating people as purely cognitive entities. While that may suffice for
abstract tasks such as chess, neglect of perceptual-motor capabilities and limitations will not
serve in high-performance applications such as air traffic control and in-car navigation systems.
ACT-R/PM for HCI
4

As computer systems become increasingly embedded and mobile, the demands they place on our
perceptual-motor systems are likely to become increasingly central to understanding interactive
behavior. Thus, we need theories and applications that pay more than lip service to these issues.
The second component is the Task. Issues in determining the true task to be analyzed are
overlooked with surprising frequency. For example, recent studies of WWW behavior (e.g..
Nielsen, 1997; Tauscher & Greenberg, 1997)—certainly a “hot” topic—have failed to consider
whether the tasks they ask users to do are typical of the tasks users actually try to accomplish in
their normal use of the Web. Optimizing interfaces for tasks for which they are not actually
being employed is a waste of designers’ time and users’ effort. Methods like protocol analysis,
contextual inquiry, and ethnographic analysis can be valuable in understanding the actual tasks in
which users are engaged.
A second important issue is the way by which success in performing a task is measured.
Is it time, user satisfaction, or some other metric? In high-performance systems, time and errors
are likely to be the most central measures with things like user preference and satisfaction less
critical (though still not completely unimportant). Mismatches here can be costly. For example,
Landauer (1995) argues that despite vast proliferation of information technology into the
business world, minimal gains in productivity have been realized because system designers and
purchasers were not sensitive to end-user productivity. Even though this particular situation may
have improved, this is still a critical issue.
In general, HCI researchers are much better at understanding and augmenting the
Artifact. The artifact, in conjunction with the user, determines which operators the user can apply
to reach their goals and often plays a central role in maintaining state information for the task.
The artifact is the component that is most subject to design—it is often much easier to redesign
the device than change the underlying task or change the cognitive, perceptual, or motor
characteristics of the user. The design of the artifact is typically fraught with tradeoffs, such as
the tradeoff between the goal of making information available to the user and limitations of
screen space. In fact, one of the central potential uses of performance analysis such as
computational modeling is to help evaluate such tradeoffs.
One of the important pieces of this framework is fidelity to true artifacts. In computing
ACT-R/PM for HCI
5

systems, the artifact in the analysis is more often than not a piece of software. In that spirit, one
goal of researchers in computational modeling and HCI is the use of the same software both by
users and by the computational cognitive models. This can require solving non-trivial software
integration problems, some of which have been solved in a limited way in ACT-R/PM.
This framework for analysis of interactive behavior is not entirely novel. In particular,
agent-oriented AI researchers have been concerned with many of these issues for some time
(e.g., Agre & Rosenschein, 1996), particularly Cohen, et al.’s (1989) “behavioral ecology”
approach. These approaches are similar, though generally less concerned with understanding
human behavior in a human factors context.
Overall, the approach is intended to be an engineering approach. That is, absolute
precision in prediction, which is the goal of much of the modeling work in cognitive psychology,
is not the goal here. Instead, the goal here is to develop a framework which is capable of
generating predictions within 20% of the true value with as few free parameters as possible.
Obviously, more precise predictive ability will be required for high-performance applications;
however, the initial goal is a system that will provide good predictions with little parameter-
tweaking, and can then be refined as necessary in cases where more precision is required.
2. ACT-R/PM
ACT-R/PM (first presented in Byrne & Anderson, 1998) is an effort to augment a system
that has been remarkably successful at describing and predicting human behavior in primarily
cognitive domains with a perceptual-motor system. This makes the coordination of perception,
action, and cognition, rather than just cognition itself, the central problem. There are several
motivations for such a system. For present purposes, the central motivation is this: real-world
tasks with real-world artifacts depend on these capabilities. Beyond that, the theoretical and
empirical challenges of constructing such a system are themselves formidable and fascinating.
One thing many researchers in cognitive science have failed to keep in mind is that perceptual
and motor capabilities came first; there are plenty of organisms that function quite well with
extremely limited cognitive machinery. By failing to consider the perceptual-motor aspects of
ACT-R/PM for HCI
6

the human system, the baby has been thrown out with the bath water. This does not mean
cognition is unimportant, quite the contrary, the cognitive system has the bulk of the
responsibility in coordinating the three. However, it does mean that the focus of cognitive
analysis will often be slightly different, rather than a pure analyses of problem spaces (as per the
“classic” Newell and Simon paradigm), the analysis will center on control and coordination of
resources that are not always cognitive.
What follows is a detailed description of ACT-R/PM. This level of detail is necessary in
order for the presentation of the models later in the paper to be entirely unambiguous, and there
is no other description of the full system in the literature that is entirely adequate.
--------- insert Figure 2 about here ----------
ACT-R/PM is organized as depicted in Figure 2. In many ways, this system is similar to,
and was certainly heavily influenced by, Kieras and Meyer’s (1997) EPIC system. In ACT-
R/PM, there are four perceptual-motor modules which communicate with central cognition,
which is realized as a production system (in this case ACT-R). Central cognition is more or less
serial (spreading activation processes work in parallel) and each module is itself more or less
serial, but the various components all run in parallel with one another. Thus, the production
system could be retrieving something from long-term declarative memory while the Vision
Module is shifting attention in the visual array and the Motor Module is preparing to press a key.
This is in agreement with the original MHP, which consisted of a collection of serial processors
acting in parallel with one another.
2.1 ACT-R Production System
The first four chapters of The Atomic Components of Thought (Anderson & Lebiere,
1998) thoroughly describe ACT-R, so only a cursory description will be presented here. The
flow of information in ACT-R is summarized in Figure 3, which is adapted from Anderson and
Lebiere (1998). ACT-R has essentially three memories, a declarative memory which contains
chunks, which are facts like “3 + 4 = 7,” a production (or procedural) memory which contains
production rules, IF-THEN condition-action mappings, and a goal stack which also contains
chunks, these encoding intentions. These are all organized around the current goal, which is also
ACT-R/PM for HCI
7

a chunk.
--------- insert Figure 3 about here ----------
Production rules’ IF sides are matched against the current goal and contents of
declarative memory. One of the productions that has its conditions matched is selected to fire.
The basic computational increment is the production cycle, which consists of matching
productions against memory, selecting a production to fire, and then executing the THEN side of
the selected production.
The process of determining which production to fire on a given cycle is called conflict
resolution. This is one of many features that distinguishes ACT-R from EPIC and Soar; in ACT-
R, only one production fires per cycle and in Soar and EPIC all matching productions fire on a
particular cycle. Conflict resolution is based on a rational analysis (e.g., Anderson, 1990) of the
expected utility of a production vs. its costs, which are in terms of time. Conflict resolution will
be considered in more detail in Section 4.2.
Productions may request the retrieval of a chunk from declarative memory, and the time
to complete this operation is a function of the activation of the chunk to be retrieved, which in
turn is a function of the estimated need odds of the chunk, represented by an activation value. A
substantial body of work has gone into the equations which determine chunk activation and that
work has been fruitful in describing human memory (e.g. Anderson & Reder, 1999; Anderson,
Bothell, Lebiere, & Matessa, 1998). References to retrieved chunks are often added to the
current goal, hence the “retrieval result” arrow going from declarative memory to the current
goal in Figure 3.
The goal memory is itself a stack, onto which new goals can be pushed and satisfied
goals popped. Goal structures are important in directing the behavior of the system and are a
useful place to begin an analysis of errors (Gray, 2000; Byrne & Boviar, 1997). Goals that are
popped off the goal stack do not simply vanish into the bit bucket, but rather reside in declarative
memory and are subject to the same activation processes affecting other chunks.
ACT-R is also a learning system. Declarative memories can be compiled into
productions, and both productions and chunks have various numerical quantities associated with
them that can be learned. These quantities are used primarily in the conflict resolution and chunk
ACT-R/PM for HCI
8

matching process. A much more detailed description of ACT-R and its various mechanisms and
parameters can be found in Anderson and Lebiere (1998) and the interested reader is strongly
encouraged to read the first four chapters of that volume.
Finally, communication between central cognition and the perceptual-motor modules
takes two forms. Production actions can request that a particular module perform a certain
command, and modules can modify ACT-R’s declarative memory, primarily by creating
declarative chunks.
The basic time parameter for the production system is 50 ms. That is, a basic production
cycle takes 50 ms, though the cycle can take longer if there are retrievals from declarative
memory involved. Seemingly small differences in the availability of declarative memory
elements can have a large impact on the system’s performance, particularly under multiple-task
conditions (Byrne & Anderson, in press).
2.2 Vision Module
Given the visual nature of most current user interfaces, the Vision Module is fairly
central in modeling most HCI tasks. As one might expect, the Vision Module is used to
determine what ACT-R/PM “sees.” How this is managed by the Vision Module is depicted in
Figure 4. Each object on the display will be represented by one or more features in the Vision
Module’s icon. The Vision Module creates chunks from these features which provide declarative
memory representations of the visual scene, which can then be matched by productions.
Generally, each icon feature maps to one chunk in declarative memory, though this is not always
the case. In particular, text is often represented not at the level of letters, but as a set of primitive
visual features of which the letters are composed (more details on letter features will be provided
in section 4.1).
--------- insert Figure 4 about here ----------
For the Vision Module to create a chunk representing an object, visual attention must first
be directed to the location of that object. In order to do that, the Vision Module supports a
MOVE-ATTENTION operator. However, in order to shift attention to a location, ACT-R/PM
must also have a representation for visual locations. The state of the visual array (the icon) is
ACT-R/PM for HCI
9

reflected in “virtual chunks” which can be matched by the IF side of production rules.When
ACT-R/PM is “looking” for an object on the display, one or more locations may be matched by
this process, depending on the number of objects on the display and the specificity of the chunk
match.
The Vision Module represents basic information about the visual features in the display
such as their location, their color, their size, etc. A production may specify values (or ranges of
values for continuous properties such as location or size) that are acceptable for a match. When a
match is found, the location chunk is no longer virtual; a full-fledged chunk is added to ACT-R’s
declarative memory, and this chunk represents the knowledge that there is something at a
particular location. Note that all locations assume a static observer; the same point on the screen
is always represented with the same coordinates.
This location chunk can then be passed back to the Vision Module along with a request to
move attention to that location. Attention shifts happen asynchronously with respect to the
production system and have a duration that is a settable system parameter but defaults to 135 ms,
based on previous research with the predecessor to ACT-R/PM, the ACT-R visual interface
(Anderson, Matessa, & Lebiere, 1997). If there is anything in the icon still at that location when
the attention shift completes, then a chunk will be created which represents that object (a visual-
object chunk), and that chunk is considered the focus of visual attention.
Being the visual focus has ramifications for the activation of that chunk and its
properties. In particular, the properties of the focus are highly active and should be retrieved
rapidly. Because ACT-R’s declarative memory system is complex, including decay and
associations between declarative chunks, the integration of a visual system and the declarative
memory system is not entirely straightforward. Unlike other simulated visual systems (e.g.
EPIC), it is not possible to simply delete declarative memory elements that represent objects
which are no longer visible. Thus, the visual system has to designate a particular chunk as being
“current” so that the object currently being attended can be discriminated from memories of
other objects.
If there is more than one object at a location when an attention shift completes, then the
Vision Module will encode—create chunks representing—all the objects at that location.
ACT-R/PM for HCI
10

However, only one of those objects can be the focus of visual attention, so one object must be
selected. The selection is based on the properties of the feature that was originally used to
generate the location chunk. Thus, if the request to shift attention is based on a location
originally specified to have a red object, then if there is a red object at the location when a shift
completes, it will tend to be preferred as the focus of attention.
The basic assumption behind the Vision Module is that the visual object chunks are
episodic representations of the objects in the visual scene. Thus, a visual object chunk with the
value “3” represents a memory of the character “3” available via the eyes, not the semantic
THREE which is involved in arithmetic facts—some retrieval would be necessary to make that
mapping. The same thing applies to words and other objects. Note also that there is no “top-
down” influence on the creation of these chunks; top-down effects are assumed to be a result of
ACT-R’s processing of these basic visual chunks, not anything that is done in the Vision
Module. Pylyshyn (1999) provides a compelling argument for such modularity.
The Vision Module also supports rudimentary visual tracking. Once an object has been
attended to, the Vision Module can be told to track it with a START-TRACKING operator. This
will update the location chunk associated with the visual object on every production cycle, which
also provides a simple memory for where the object has been.
2.3 Motor Module
ACT-R/PM’s Motor Module is based directly on the description of EPIC’s Manual Motor
processor found in Kieras and Meyer (1996). While the Vision Module is the most complex
module internally, it is not the most complex in terms of the number of timing parameters and
commands supported. That description best fits the Motor Module. The Motor Module represents
ACT-R/PM’s hands, and therefore supports a wider range of actions, and contains a number of
parameters for representing movement.
Because most output (e.g. key presses and mouse clicks) in using a computer interface
are manual, they will go through the Motor Module. The Motor Module receives commands
from the ACT-R productions to perform actions. In general, movement specification requires
specification of a movement type, called a style (which is specified by the command name) and
ACT-R/PM for HCI
11

one or more parameters, such as the hand/finger that is to make the movement.
When a command is received by the Motor Module, the Motor Module goes through
three phases: preparation, initiation, and execution. In the preparation phase, the Motor Module
builds a list of “features” which guide the actual movement (Rosenbaum, 1980, 1991). The
amount of time that preparation takes depends on the number of features that need to be
prepared—the more that need to be prepared, the longer it takes. Each feature takes 50 ms to
prepare.
The Motor Module has a small buffer which contains the last set of features that it
prepared. The actual number of features that need to be prepared for a new movement depends
upon two things: the complexity of the movement to be made and the difference between that
movement and the previous movement. On one end of the scale, if the Motor Module is simply
repeating the previous movement, then all the relevant features will already be in the buffer and
will not require preparation. On the other hand, a production could request a movement that
requires a full five features and they may not overlap with the features in the Motor Module's
buffer, in which case all five features would need to be prepared.
Movement features are organized into a hierarchy, with the movement style at the top of
the hierarchy. If the movement style changes, then all of the features required for a movement
must be prepared over again. Then, if the movement styles are the same but the hand for the
movement differs, all features at and below the hand level require preparation. Different
movement styles have slightly different hierarchies, but in general the hierarchy is style > hand >
finger > direction = distance. That is, if the style, hand, finger and distance for an aimed
movement do not change, but only the direction changes, only the direction needs to be prepared
anew. If the finger changes, however, three features need to be re-prepared: finger, direction, and
distance. Not all movements have all these levels, for instance, a “punch” movement (described
below) only requires the hand and finger be specified.
When feature preparation is complete, the Motor Module executes the specified
movement. The first 50 ms of movement execution is termed movement initiation. The amount
of time that a movement takes to execute depends on the type and possibly the distance the
movement will traverse. Simple movements have a minimum execution time (also 50 ms, called
ACT-R/PM for HCI
12

the “burst time”) and more complex movements (such as pointing with the mouse) have a longer
execution time based on Fitts’ Law.
The Motor Module can only prepare one movement at a time (though it can be preparing
features for one movement while executing another). If the Motor Module is in the process of
preparing a movement and another request is sent, the later request will be ignored and the Motor
Module is said to be “jammed.” ACT-R/PM prints a notification of this event for the analyst. The
way to avoid jamming the Motor Module is to include a left-hand side test of the Motor
Manager’s state, which is represented in another “virtual chunk.”
The ability to prepare one movement while executing another gives the Motor Module an
elementary ability to pipeline motor operations, and aggressive scheduling of this pipeline can be
an important aspect of high-performance tasks (e.g. Byrne & Anderson, in press; Chong, 1998).
Simple scheduling decisions can have a surprisingly large impact on performance in rapid tasks,
and the issue of scheduling should not to be taken lightly.
The Motor Module includes several movement styles, again based on EPIC’s Manual
Motor Processor. They are:
• Punch. This is a simple downstroke followed by an upstroke of a finger, for pressing a
key that is already directly below a given finger. A punch has two features: the hand (left/right),
and the finger (e.g. ring, middle). The punch takes a total of three bursts to execute: one to
initiate the movement, one to complete the downstroke, and one to complete the upstroke.
However, the key below the finger being punched does not register simply at the bottom of the
downstroke. Instead, there is another parameter which controls how long after movement
initiation begins that the mechanical switch will actually close, which is called the key closure
time. This time is estimated at 10 ms.
A mouse click is simply a punch of the finger that is over the relevant mouse button.
• Peck. This is a directed movement of a finger to a location followed by a keystroke, all
as one continuous movement. This movement style has four features: the hand, the finger, the
direction of the movement, and the distance of the movement. Movement execution time is
governed by a modified version of the Welford (1968) formulation of Fitts’ Law, which is:
ACT-R/PM for HCI
13

time t kd
wM= +
max( , * log . )0 5 [1]
where tM is the minimum aimed movement time (default: 100 ms), k is a constant (75 ms
for a peck), d is the distance to be moved, and w is the width of the target. Thus, no aimed
movement can take less than tM, and other than that the duration is a function of the ratio of the
distance to be moved to the width of the target. In most cases these are keys. Target width is
computed by taking the width of the chord through the target region taken on the line drawn
from the starting point of the movement through the center of the object, as recommended by
MacKenzie (1992).
• Peck-recoil. This is essentially identical to a peck, except that the finger returns to its
original starting position at the end of the movement.
• Ply. Moves a hand, generally the one holding the mouse, to a known location in space.
This movement style has three features: the hand, the direction of the movement, and the
distance of the movement. Movement time for a ply is also governed by Fitts’ Law, but with a
different constant k (100 ms).
Typically, the target of a ply is an object on a display. The object is typically represented
by a visual object chunk, and a reference to that chunk is passed to the Motor Module when a ply
is requested. However, not all movements are made to objects, so the Motor Module will also
accept a chunk representing a visual location.
In order to make modeling more convenient, the Motor Module also accepts a PRESS-
KEY command, which then is translated into the appropriate punch or peck-recoil movement
with the assumption that the hands are in the “home row” position. This also assumes a touch-
typist, so if either assumption is invalid this command need not be used.
2.4 Audition and Speech Modules
The Audition and Speech Modules are somewhat less developed than their Vision and
Motor counterparts, and are not critically important for the menu search task that is the primary
concern of this work. More information about these Modules can be found in Byrne and
ACT-R/PM for HCI
14
Anderson (1998).
2.5 The Artifact
Another critical component of ACT-R/PM is its connection to the artifact. ACT-R/PM is
implemented in Macintosh Common Lisp (MCL) and can directly communicate with many of
the standard interface objects in MCL’s graphics library, such as buttons and text fields. The
Vision Module’s icon is generated by querying the data structures of the interface objects, and
ACT-R/PM generates keystrokes and mouse movements and clicks to which the interface
responds. In many ways, ACT-R/PM acts as a “virtual user “ and in fact interacts with the same
(or very slightly modified) software that human experimental subjects do. This removes a degree
of freedom in the modeling work, because all ACT-R/PM models use the same kinds of
representations and timings across all models. There is much less opportunity to “hide” the work
of the model in the visual perception or motor output processes.
ACT-R/PM does not currently “see” every single aspect of the display—for example, it
does not distinguish between Helvetica and Times fonts, though it does “know” the fonts have
different sizes—but it sees enough to produce qualitatively and quantitatively realistic behavior.
As described earlier, the display is represented by a set of visual features, and ACT-R/PM “sees”
those features. The Speech Module can communicate with the MacOS’s built-in speech
synthesizer and does produce synthetic speech, though this is not likely to be mistaken for human
speech. Audio perception is more or less entirely simulated, but present interfaces are still
primarily visual. As the underlying computer technology improves, so hopefully will ACT-
R/PM’s abilities in these areas.
This has not been realized in as many languages or designed to be as general as Ritter, et
al.’s (2000) Sim-eye and Sim-hand, but is more perceptually accurate. ACT-R/PM at present
only works with interfaces written in MCL, and requires code-level access to the data structures
representing the display. However, work has been done integrating ACT-R/PM with non-Lisp
based applications via serial communication, and it may be possible in the future to integrate
ACT-R/PM with more general bitmap-based approaches (e.g. Zettlemoyer & St. Amant, 1999;
see also St. Amant & Riedl, this issue). At the moment, however, ACT-R/PM’s integration with
ACT-R/PM for HCI
15

the Artifact is somewhat limited.
2.6 Summary
ACT-R/PM is a production system architecture that has been augmented with a set of
perceptual-motor modules designed to enable the detailed modeling of interactive tasks which
have cognitive, perceptual, and motor components. This does not represent so much a
modification of ACT-R but an extension of it. ACT-R was chosen as the underlying production
system specifically because we did not want to reinvent a theory of cognition to model
interactive behavior, but instead wanted to build on ACT-R’s successes in areas such as problem
solving and memory.
The process of extending ACT-R with perceptual-motor capabilities introduced a number
of issues, such as the management of declarative memory and vision, as well as new system
parameters. Table 1 presents a summary of the relevant parameters in ACT-R/PM and their
default values. Note that these are actually mean values; ACT-R/PM actually draws each value
from a rectangular distribution which has the parameter as the mean and a coefficient of
variation of 1.3. Randomization may be turned off for debugging purposes, but this is the default
for simulation runs, and generally requires that Monte Carlo simulations be run to obtain
predicted values from models. Stochasticity plays multiple roles. First, the human perceptual-
motor system being modeled is itself noisy. Stochasticity prevents the model from producing
exactly the same response time from trial to trial. Second, averaging over “noisy” Monte Carlo
runs tends to produce smoother responses to change than the sharp discontinuities produced by
non-stochastic models. Third, the system’s behavior when timing is stochastic is not always
identical to that when times are fixed. For a more thorough discussion, see Byrne and Anderson
(in press). While individual modelers are free to change the default parameters, this violates the
spirit of using ACT-R/PM as a predictive tool and changing these parameters is not
recommended practice.
3. Random Menu Selection
ACT-R/PM for HCI
16

In order to both demonstrate the application of ACT-R/PM and the complexity
underlying even simple, rapid tasks that can be found as components of more complex high-
performance tasks such as air traffic control, the task of random menu selection will be
considered. While this exact task is somewhat artificial, designers impose similar searches for
specific targets in displays that appear randomly-ordered. For example, consider the display of
options when using an automated teller machine when on an international trip. The interface is
likely to be unfamiliar, and even well-known options (e.g. “withdraw from checking”) can
generate searches through options that are ordered more or less arbitrarily.
First, the task itself and the original data from Nilsen (1991) will be described. Two
models of this task already exist, one using ACT-R/PM’s predecessor, ACT-R with the visual
interface (Anderson, et al. 1997), and one based on EPIC (Hornof & Kieras, 1997). Both of those
models will be described, and then an eye-tracking experiment first presented in Byrne,
Anderson, Douglass, and Matessa (1999) and its results will be described. This raises a number
of issues with both of the models. Because all of these are discussed elsewhere, presentation of
each item will be kept as brief as possible.
In light of the previous models and new eye-tracking data, a new model of the task based
on ACT-R/PM will be presented. This model is slightly different in spirit from the other models
and explores the issue of learning in this task.
3.1 The Nilsen Experiment (Nilsen, 1991)
Menus of one form or another have been a central feature of the user interface for some
time (see Norman, 1991 for a review). Mouse-based pull-down (requiring that the mouse button
be held down) and click-down (which stay open once clicked until another click occurs) menus
are more recent advances that have become ubiquitous in the modern graphical user interface.
Nilsen (1991, Experiment 2) performed an experiment which provided detailed enough
data to constrain computational cognitive modeling. In this experiment, users were presented
with a single digit on the screen and a “Go” button. They clicked the button, and then searched
for that digit in a menu of randomly-ordered digits that appeared as a result of the button click.
This procedure is shown in Figure 5. Users first saw the display in panel (a), then clicked in the
ACT-R/PM for HCI
17

“Go” box, and saw a display like the one in panel (b). Nilsen used three menu lengths, 3, 6, and
9.
--------- insert Figure 5 about here ----------
Results of the experiment are displayed in Figure 6. Users’ response time is an
approximately linear function of serial position in the menu, with each successive position being
approximately 100 ms slower than the last. This suggests that search is serial through the menu,
and no “pop-out” effects are occurring (Triesman & Gelade, 1980).
The exception to the linear slope is serial position 1, or the first menu position. Time for
this position is slightly higher than response time for position 2. This will be termed the “Nilsen
effect.” There also appears to be a small overall effect of menu length, with longer menus being
slower.
--------- insert Figure 6 about here ----------
The data further suggest that Fitts’ Law, while an excellent predictor of mouse movement
time, is not a good characterization of the menu search process. Users took much longer and had
steeper slope as a function of target position than would be predicted by Fitts’ law. Thus, it was
argued by Nilsen that the bulk of the time users spend on this task is time for visual search.
3.2 The ACT-R Visual Interface Model (Anderson, Matessa, & Lebiere, 1997)
This model was originally presented in Anderson, Matessa, and Lebiere (1997) and a
revised model and some new data were presented in Anderson, Matessa, and Lebiere (1998). The
model is fairly simple, but generates a number of interesting predictions. The model has a visual
system similar to the one in ACT-R/PM and is based on the idea that letters are composed of
primitive visual features. The target letter is attended and a feature in the letter randomly chosen.
A search production then tests for an unattended location that contains that feature with the
lowest y-coordinate (towards the top of the display) and shifts attention to that location. If the
letter there is the target, then the target is clicked. If not, then the search process continues down
the menu. This is represented in two productions, HUNT-FEATURE and FOUND-TARGET:
HUNT-FEATURE
ACT-R/PM for HCI
18

IF the goal is to find a target that has feature Fand there is an unattended object below the current location with feature F
THEN move attention and the mouse to the closest such location
FOUND-TARGET
IF the goal is to find a targetand the target is at the currently attended location L
THEN move the mouse to L and click
This model does a reasonable job of accounting for the slope of the line, but does not
account for the menu length effect or the Nilsen effect. However, because the search is guided by
visual features, it predicts that search for a letter target on a background of numbers should be
faster than search for a number target on a background of numbers. This is because the average
feature overlap is smaller for letter targets than for number targets against a number background,
and thus the search hits fewer distractors on the way to the target. Indeed, Anderson, Matessa,
and Lebiere (1998) found that search for a letter target among numbers is reliably faster than a
search for a number target among numbers.
Assuming that attention shifts manifest themselves in saccades, the ACT-R Visual
Interface model predicts:
(1) Eye movements should be exclusively top-to-bottom. The model never backtracks.
(2) The distance moved on each saccade should vary from trial to trial and menu to
menu—items which do not share features with the target will be skipped over and thus not every
item is examined. In that sense, the search is not exhaustive and many items will be skipped.
(3) The eye should never overshoot the target.
These predictions are empirically testable, but eye-tracking is required to test them.
3.3 The EPIC Model (Hornof & Kieras, 1997)
Hornof and Kieras (1997) present several versions of a model of this task, the final one
presented in the paper is termed the “Parallel Processing Dual Strategy Varying Distance Hybrid
Model,” but for the sake of brevity will simply be referred to as “the EPIC model.” The long title
ACT-R/PM for HCI
19

is a result of this model being a blend of several simpler models.
First, EPIC differs substantially from ACT-R/PM in two critical areas: the visual system
and the cognitive system. The cognitive system in EPIC is also a production system, but is
different in numerous ways. Most relevant to the current concern, EPIC can fire multiple
productions at once. Thus, if more than one item can be placed in working memory by the visual
system, they can all be evaluated in parallel. (This is the “parallel processing” aspect of the
model).
Not surprisingly, EPIC’s visual system allows it to create declarative representations for
multiple objects in parallel, but is limited to items that can be simultaneously foveated. Thus, the
search time will be a function of how many items EPIC can examine in parallel, which will in
turn be a function of how many items can be foveated at once.
Because Nilsen did not record the viewing distance to the monitor, it is not certain how
many menu items users could fit into a 2° fovea (this is EPIC’s foveal diameter). Thus, the EPIC
model is a 15/85 blend of being able to foveate only one item at a time and being able to foveate
three items at one. This is the “varying distance” aspect of the model. The source of the 15/85
ratio is unclear and appears to be a free parameter in the model.
--------- insert Figure 7 about here ----------
The EPIC model is also a 50/50 blend of two search strategies, random and systematic.
These two strategies are described in Figure 7, which are based on figures in the original Hornof
and Kieras (1997) paper. This is the “dual strategy” aspect of the model. Systematic searches
move exclusively from top to bottom, while random searches proceed starting anywhere and
moving anywhere. It is not clear from the Hornof and Kieras (1997) paper whether the results are
based on averaging the results from the two strategies or whether the model randomly selects
which strategy to use before each trial, or what the basis for that selection would be if it did so.
Again, the source of the 50/50 ratio is unclear and this also appears to be a free parameter in the
model.
Regardless, this model makes a number of predictions about eye movements:
(1) Eye movement patterns should conform to a pattern that consists of 50% sequential
top-to-bottom searching, and 50% randomly-ordered searching.
ACT-R/PM for HCI
20

(2) In cases of serial top-to-bottom search, the users’ eyes should move down the menu a
constant distance in each saccade, which is exhaustive in that every item of the menu from item 1
to the target item is examined.
(3) The eye should “overshoot” the target item by one saccade with some regularity,
since users are examining multiple items in parallel.
This model is substantially more complex than the ACT-R Visual Interface model, but
does do a better job of accounting for the original data. It does predict both the length effect and
the Nilsen effect. However, this model does not make use of feature information and thus does
not predict that searches for letters with number distractors should be faster.
3.4 Eye-tracking Data (Byrne, Anderson, Douglass, & Matessa, 1999)
Because the two models were somewhat mixed in regard to how well they accounted for
the reaction time data and they both make very specific predictions about eye movements, Byrne
et al. (1999) conducted an experiment on random menu search and collected not only reaction
time data, but eye-tracking data as well. Some of the results presented here were originally
presented in the original Byrne, et al. (1999) paper and some of the results presented here are
novel. This is not the first time eye-tracking has been employed in a visual search experiment
(e.g. Findlay, 1997; Motter & Belky, 1998a, 1998b; Zelinsky & Sheinberg, 1997; Shen &
Reingold, 1999). Generally, what these experiments have shown is that saccades can indeed be
guided by the features present in non-foveal regions, and that eye-tracking does reveal important
information about the visual search process. The search task used here is not as straightforward
as the ones used in the majority of the previous work (most of them included a very salient color
difference between targets and non-targets), but eye-tracking for this experiment seemed the best
way to differentiate between the two models.
3.4.1 Methods
The task used was very similar to Nilsen’s and the Anderson, Matessa, and Lebiere
(1998) followup. Users were first shown a screen containing a rectangle with the word “Target:”
followed by a target character. When the user clicked on this rectangle, a menu of characters and
a bounding rectangle appeared (see Figure 8). Users then searched for the target item in the menu
ACT-R/PM for HCI
21

and clicked on it. Visual point-of-regard (POR) and mouse position were tracked throughout the
entire trial, and response time and accuracy were also recorded for each trial.
--------- insert Figure 8 about here ----------
11 undergraduate participants were paid for their participation in the study, and had
normal uncorrected vision and were familiar with the use of computer menus.
There were two primary within-subjects factors in the experimental design: menu length
and target location. Three menu lengths were used: 6, 9, and 12 items. Longer menus than those
used in the original Nilsen experiment were used because pilot data showed a general lack of
interesting eye movements for 3-item menus. All target locations were used for each menu
length.
There were other within-subjects factors in the design as well: target type and distractor
type. Targets could be either letters or digits, as could non-target distractors. Thus, there were a
total of 108 trials in the experiment: 6 6-item menu trials (one for each target location) + 9 9-item
menu trials + 12 12-item menu trials X 2 target types X 2 distractor types. The 108 trials were
randomly ordered by the experimental software. Participants also received 36 practice trials with
randomly-chosen values on all factors. There was also a between-subjects manipulation. In one
condition, the “Target” field remained on the screen when the menu appeared (as in Figure 2)
and in the other, the “Target” button disappeared when it was clicked. Because of the time and
effort involved in running the eye-tracking study, not enough data are available to reveal effects
of target type, distractor type, and presence of the target button. Thus, these effects will not be
considered.
The eye tracker used was an ISCAN RK726/RK520 HighRes Pupil/CR tracker with a
Polhemus FASTRACK head tracker. Head-mounted optics and a sampling rate of 120 Hz were
used in this experiment. This system, like many other laboratory eye trackers, works by shining
an infrared light on the eye and taking a video image of the eye. From that image, it is possible to
determine the pupil center and the point on the cornea closest to the camera (the corneal
reflection) and take the vector between them. This vector changes as the eye orients to different
positions on the screen and with calibration to known points, it is possible to compute visual
POR. The magnetic polhemus is used to compensate for head movements. POR reports by the
ACT-R/PM for HCI
22

eye-tracking equipment are typically accurate to within one-half degree of visual angle.
POR and mouse position were recorded approximately every 8 ms by the experimental
software. Stimulus and POR/mouse data for each trial were recorded so that all individual trials
could be “replayed” at various speeds. An experimenter monitored each experimental trial and
recalibrated the eye tracker if there appeared to be sizable disparity between reasonable
expectations about where users would look (in particular, users needed to look at the target on
each trial) and the position reported by the tracker.
Users were seated approximately 30 inches from a 72 ppi computer display. Characters
were 13 pixels high (approximately 0.34° of visual angle) with 26 pixels (approximately 0.69° of
visual angle) separating characters. Thus, simultaneously foveating three characters would
require a fovea of approximately 2.4° visual angle in diameter. (EPIC assumes that the fovea
covers 2° of visual angle and characters must be foveated to be recognized.)
Sampling at 120 Hz, despite short trials, generates a great deal of raw data over 108 trials.
However, from this raw data it is possible to compute where and when fixations have occurred.
This can be done either by assuming that any eye position within a given region for more than
some threshold number of milliseconds is a fixation (dwell-based) or assuming that any period of
time showing relatively low velocity is a fixation (velocity-based). For the current data set, both
methods were initially used and both methods yield approximately the same result. Because the
velocity based method yields slightly less noisy data, the results presented here are based on that
method of post processing. For each trial, the location of each fixation (with location 1 being the
top item in the menu) was recorded.
This experiment is not a completely faithful replication of Nilsen’s original experiment,
in several ways. First, the menu items used here were spaced further apart which was necessary
to make it possible to discriminate fixations on adjacent items. Nilsen’s subjects had many more
trials (1440) than our participants, because wearing the eye-tracking equipment is uncomfortable
over long periods of time and this would have entailed frequent re-calibrations. Third, as
previously mentioned, we did not use the same menu lengths as Nilsen, because eye movements
with pilot subjects for 3-item menus showed little of interest. Further, Nilsen’s original
experiment was all number targets with number distractors; we used a mixture of letters and
ACT-R/PM for HCI
23

numbers for targets and distractors in an attempt to reproduce the results of Anderson, et al.
(1998). Finally, the menus used here were surrounded by a bounding rectangle, unlike the
original Nilsen experiment. This again was done on the basis of pilot data; it was hoped this
manipulation would keep participants’ fixations more “on target” in the horizontal plane.
Of course, because this experiment is not identical to the original Nilsen experiment,
there may be concerns about the applicability of the original EPIC and ACT-R models. On the
other hand, the basic task is virtually identical, and there is no reason to believe that the
fundamental strategy for attentional control adopted by either model would be different under
these conditions. The ACT-R model would clearly not be affected by these changes, though
some of the performance parameters in the EPIC model might change slightly due to the
increased certainty about character spacing and viewing distance.
3.4.2 Results
Results for response time are presented in Figure 9a. Clearly, response time is a function
of target location, with higher locations generating longer response time. This is consistent with
the Nilsen data. However, other aspects of Nilsen’s data set were not reproduced as clearly. First,
the slope of the function for the two larger menu sizes is somewhat shallower, around 75 ms (as
opposed to 103 observed by Nilsen) and is even shallower for 6-item menus. Further, there
appears to be very little main effect of menu size (controlling for position), as opposed to what
Nilsen found. This may be a function of the larger spacing between items used here. A second
distinct possibility is that this is a practice effect (Nilsen’s subjects had more practice). Notice
also that the Nilsen effect is larger here than in the original experiment, and seems to apply to the
second item as well as the first item. Error rates were negligible in all conditions and will not be
discussed.
--------- insert Figure 9 about here ----------
Results for fixations/saccades differ very slightly here from what was presented in the
original Byrne, et al. (1999) paper due to slight differences in how fixations were assigned to
items; the current results use an improved algorithm designed to compensate for systematic bias
introduced by the magnetic head-tracking system. The results for average number of fixations is
ACT-R/PM for HCI
24

presented in Figure 9b. Neither the response time data nor the number of fixations do an
especially good job of discriminating between the ACT-R model and the EPIC model, but they
will provide a basis for comparison with the ACT-R/PM model to be presented later. More
interestingly, the fixation data and the response time data match each other very well. The
overall correlation between the mean response times and the mean number of fixations is r(26) =
0.97, p < 0.001, which suggests that the primary determiner of response time in this experiment
is indeed the visual search process. (This correlation is reduced somewhat when the data are not
aggregated by condition; the overall correlation between number of fixations and response time
for the raw trial data is r(1179) = 0.71, p < 0.001. This is still impressive.)
The most informative data from the perspective of model evaluation come from an
analysis of the direction and distance of the saccades. Recall that the ACT-R model predicts that
the first saccade should go to the first item if it has a feature match. On average, given that the
experiment used both letters and digits as both targets and distractors an equal proportion of the
time, the feature model on which the ACT-R Visual Interface is based predicts that, on average,
the probability of a random character matching a randomly-selected feature is 0.44. Based on
that, it is possible to derive the model’s predictions for the distribution of the landing point of the
first saccade. It is also possible to derive the landing location predicted by the EPIC model.
When the model is executing the systematic strategy, which is half the time, the model should
look at item 1, the top item. However, because users could possibly foveate two items, it is
perhaps more fair to distribute the first fixation equally between items 1 and 2.The other half of
the time the model predicts that the fixation should have a rectangular distribution across the
items. Because of varying menu lengths, this yields a distribution which tails off slightly.
--------- insert Figure 10 about here ----------
Figure 10 presents a histogram of initial saccades, and Table 2 presents the same data
along with the predictions of the ACT-R model and the EPIC model. Neither model fares
particularly well here, the r-squared of the EPIC predictions is 0.37 and the r-squared for the
ACT-R model is 0.52. The ACT-R model is closer because it predicts fewer long initial saccades
but neither model is especially impressive. The apparent bias further down the menu may be
what is referred to as a “global effect” (Findlay, 1982), which is the tendency for the initial
ACT-R/PM for HCI
25

saccade to target the visual center of gravity of the display. This tendency seems to be quite
robust, including in visual search through strings of characters when the target character is cued
(Coeffe & O’Regan, 1987). However, it is unlikely that is the full story, because the effect does
not appear stronger for the longer menus, which obviously have a more distant visual center of
gravity.
Figure 11a presents a histogram of “middle” saccades, all those saccades between the
first one and the last one. Some trials contribute no observations here, but most trials contribute
more than one. Positive distances indicate a saccade down (in the top-to-bottom direction) the
menu, and negative numbers indicate saccades up (in the bottom-to-top direction) of the menu.
This is a clear indictment of the ACT-R model, which predicts zero bottom-to-top saccades. It
instead predicts a distribution identical to what it predicts for the initial saccade, which is
presented in Table 2.
--------- insert Figure 11 about here ----------
The EPIC model makes somewhat more complex predictions here. Roughly 50% of the
saccades should be down one (or two) items, since the model should run the systematic strategy
on half the trials. While the modal saccade distance is indeed a 1, the total proportion is nowhere
near what the EPIC model predicts. The other 50% of the trials should be completely random,
and the distribution of saccades should be approximately rectangular (there should be some
tailing off for extreme positive and negative values, but it should be perfectly symmetric with a
mean of zero). Thus, the distribution should look something like a rectangular distribution with
spike up to 25% for saccades of length 1 and 2 (or 50% at length 1). The empirical distribution
does not seem a good match to the pattern predicted by either ACT-R or EPIC, though the EPIC
model is somewhat closer here.
Figure 11b presents the histogram for the last saccade made on each trial. The ACT-R
model again makes the same prediction, which is again clearly wrong. The EPIC model predicts
a distribution that is 50% one type of saccade and 50% random. For systematic searches, the eye
should overshoot the target since it processes the items looked at in a fixation during the
following saccade. Thus, the terminal fixation under this strategy ought to always be -1 or -2,
and this should be the case on 50% of the trials. On the remaining trials, the distribution should
ACT-R/PM for HCI
26

again be approximately rectangular (at the very least, symmetric), since the saccade will be
completely random. Again the EPIC model’s predictions are better, but neither model is
especially close.
What these data do not reflect, and what is hard to express in a graph, is the experience of
watching all the trials replayed. Watching even a small sample of the over 1000 trials it is
apparent that neither model represents what users actually do. Both models essentially impose a
global strategy which is rigidly followed by users until the end of the trial. The strategy is either
strictly top-to-bottom or entirely random. Individual trials are rarely, though occasionally, strictly
top-to-bottom. Very few trials appear entirely random, either. Users appear to have some
predisposition for top-to-bottom saccades, but by no means is this followed rigidly. However,
when users deviate they rarely appear to be completely random, particularly with the initial
fixation. What the protocols appear to reflect is very local decision-making on the part of the
users, rather than a global strategy which is held throughout the trial.
Overall, the results of the eye-tracking are fairly clear with respect to the models: neither
is a good characterization of the visual search process actually employed by users. It is important
to note that this is not a claim it is impossible to construct a good characterization of the menu
search process with EPIC or ACT-R with the visual interface. Rather, this is an assessment of the
existing models. Certainly, given this new data, it is possible—even likely—that better-fitting
models could be constructed with either system. ACT-R/PM, is, in many ways, itself a synthesis
of the two systems, and the next section of the paper presents a new set of ACT-R/PM models of
this task. However, the goal of these models is not so much to provide the best possible fit to the
data, but attempt to understand how such a local and complex strategy could be developed.
4. An ACT-R/PM Model of Random Menu Selection
The perceptual-motor machinery surrounding ACT-R has changed since the ACT-R
Visual Interface; ACT-R/PM is significantly more complex, but this richness enables ACT-R to
be extended into more sophisticated tasks and with a substantially improved ability to handle
high-performance situations such as multiple-tasking (Byrne & Anderson, 1998; Byrne &
ACT-R/PM for HCI
27

Anderson, in press). Beyond that, however, is the larger promise of ACT-R/PM: that of a full-
fledged cognitive architecture along with sophisticated perceptual-motor machinery.
Probably the best demonstration to date of the power of this union comes from Ehret
(1999). Among other things, Ehret developed an ACT-R/PM model of a fairly simple, but
subtle, experiment. In that experiment, subjects were shown a target color, and asked to click on
a button that would yield that color. The buttons themselves had four types: blank, arbitrary icon,
text label, and color. In the color condition, the task was simple: users just found the color that
matched the target, then clicked the button. In the text label condition, the task was only slightly
more difficult: users could read the labels on the buttons, and select the correct one because the
description matched the color. In the arbitrary icon condition, more or less random pictures
appeared on each icon (e.g. a mailbox). Users had to either memorize the picture to color
mapping, which they had to discover by trial and error, or memorize the location of each color,
since the buttons did not change their function over time. The hardest condition, the blank
condition, users simply had to memorize the mapping between button location and color, which
they had to discover through trial and error. After performing the task for some time, all the
labeling was removed. Not surprisingly, the amount of disruption was different in the different
conditions, reflecting the amount of incidental location learning that went on as subjects
performed the task.
The ACT-R/PM model that Ehret constructed did an excellent job of explaining the
results. The model, through ACT-R’s associative learning mechanisms, also learned the
mappings over time, and learned them about as well as the users, and suffered very similar
disruptions. This was not only a clever experiment and modeling exercise, it also demonstrated
the power of pairing a perceptual-motor system with a cognitive architecture having
connectionist-style subsymbolic learning mechanisms. EPIC includes no learning mechanisms,
and thus could not model these results. It is unclear how a hybrid like EPIC-Soar (Chong, 1998)
would fare, as this kind of incidental and continuous association learning seems much more
naturally suited to ACT-R’s learning mechanisms.
The ACT-R/PM menu models use a different kind of learning than Ehret’s location
learning model, and the reasons for this will be described shortly. First, however, there is the
ACT-R/PM for HCI
28

issue of representation. One of the problems with the original ACT-R visual interface model was
the feature set employed. This set assumes that characters are LED-style, e.g. an “E” would be
represented by several line segments, as in Figure 12, and that the visual system was sensitive to
each of the line segments. This is also the default in ACT-R/PM. However, the characters used in
the experiment were presented in a much more standard typeface (Courier), which includes
curvature and strong diagonals and does not break up the line segments.
--------- insert Figure 12 about here ----------
Alternative feature sets were employed, including a letter feature set generated by
Gibson (1969) and one from Briggs and Hocevar (1975). Given the strategy of the ACT-R
Visual Interface module and all the default timing parameters in ACT-R/PM, it turned out the
various feature sets were in fact all approximately equivalent. All the ACT-R/PM models
described in this paper make use of the Briggs and Hocevar (1975) feature set, which was
extended to include digits.
4.1 The EPIC-Inspired Model
Instead of employing a global strategy like the original ACT-R model or the EPIC model,
a model was constructed with multiple options at the level of each saccade. In this model, the
task is divided into two phases, which includes the initial saccade and all other saccades. The
reason for considering the initial saccade separately is that some protocols show users beginning
(and even occasionally completing) the first saccade before even clicking on the button which
opens the menu. In this case, users clearly are not sensitive to the features of the characters,
because they cannot yet see the characters. This saccade is also clearly not sensitive to the length
of the menu, because they cannot yet tell how long the menu is. In light of this, the initial
saccade was controlled by five productions, each of which simply directed attention to one of the
first five locations. All five productions were allowed to compete on each trial.
For all subsequent saccades, two productions were in competition. These two productions
represented two local strategies: move down to the nearest unseen character with a feature
match, and move to any random unseen character. Thus, this model is much like the EPIC
ACT-R/PM for HCI
29

model, except the decisions are made at the local (saccade) level, rather than the global (trial)
level. The two productions can be described as:
DOWN-NEAREST-HIT
IF the goal is to find a target that has feature Fand there is an unattended object below the current location with feature F
THEN move attention to that location
LOOK-ANYWHERE
IF the goal is to find a targetand there is an unattended object anywhere
THEN move attention to that location
There is also a third production that fires when the target is found which is essentially the
same as the FOUND-TARGET production in the ACT-R Visual Interface model.
Before presenting the results of this model, some discussion of conflict resolution in
ACT-R is required. When multiple productions have their condition satisfied, ACT-R needs to
make a decision about which one to fire. This decision is based on a “rational analysis”
(Anderson, 1990) of costs and benefits. Each production has an expected value, E, which is
computed based on the formula PG - C. P is the estimated probability that if the production fires,
the goal matched in the production will be satisfied. G is the value of the goal, which is by
default 20. C is the cost, in terms of time, of reaching the goal. By default, each production will
have the same PG - C value, but this can change through learning.
ACT-R also includes some degree of stochasticity. On each cycle, the PG - C value is
perturbed with noise that has a mean of zero and is distributed logistically. The probability that
production i will be selected on a particular cycle is a function of its expected gain Ei, according
to the following equation:
p ie
e
E t
E t
j
i
j( )
/
/=∑
[2]
ACT-R/PM for HCI
30

where t is a positive linear function of the standard deviation, σ, of the noise. For more details,
see Anderson and Lebiere (1998). t is thus a free parameter in the model, but the model’s
behavior is relatively stable across variations in this parameter, particularly when this parameter
is constant for both learning and execution. The model’s predictions do not critically depend on
particular values for this parameter as long as it is non-zero. A more or less arbitrary value of t
(0.141) was chosen for all models presented here.
In this particular model, since all productions in competition will have the same expected
gain, then they will all effectively have equal probability. Thus, each one of the five productions
that compete for the first fixation should fire about 20% of the time, and each of the two
productions in competition thereafter should fire 50% of the time. These ratios are not free
parameters, they represent ACT-R’s default behavior.
--------- insert Figure 13 about here ----------
Results of running the EPIC-Inspired model are presented in Figures 13 and 14. A
histogram for the initial saccade was omitted because it is uninteresting—it is essentially a flat
graph with positions 1-5 each getting very close to 20%. Overall the model does a poor job of
accounting for the data. The average absolute error for response time is 24.38% and the average
absolute error for number of fixations is 22.80%. However, the pattern of saccades, while not in
an absolute sense a great fit, is qualitatively much closer than the previous ACT-R or EPIC
models. Like the actual data, the mode for both middle and final fixations is 1 position down the
menu and the positive side of each distribution is somewhat heavier than the negative side.
--------- insert Figure 14 about here ----------
A quantitative look at the saccade predictions versus the data supports this analysis. Since
many of the actual data points are at or near zero, average absolute error percentage is not a good
metric for fit. R-squared will be used instead. The r-squared for the model is 0.82 for the initial
saccade, 0.83 for the middle saccades, and 0.65 for the final saccade. While the fit, particularly to
the reaction time data, is not exceptional, at the level of control of individual saccades, this in an
improved model. Clearly, something resembling a random component is important in capturing
the saccade data.
ACT-R/PM for HCI
31

However, this model makes use of the default conflict resolution parameters. With the
default parameters, when both the DOWN-NEAREST-HIT and LOOK-ANYWHERE
productions match, each one has an approximately equal probability of firing, as do each of the
five productions which determine the destination of the first saccade. It is entirely likely that
these productions are not always equally good, and thus uniform firing probabilities may not be
optimal.
ACT-R has the ability to learn the parameters that control conflict resolution; two of the
three parameters in PG - C are decomposable and can change over time if learning is enabled in
ACT-R. P, the probability of success, is the product of two other quantities, q and r. q is the
probability that the production, if selected in conflict resolution, will fire successfully.
Productions fail when they attempt to retrieve a chunk from declarative memory that are below
the activation threshold. Because this model never attempts such a retrieval, q is always
estimated by the system as 1.0. r is ACT-R’s estimate of the probability that if the production
fires, the goal will eventually be popped successfully. Because no matter which production is
selected, the model eventually does still find the target, r is also stable at 1.0. Thus, P is always
1.0 for this model.
C, however, does not stay constant. C is decomposed into two parameters, a and b, which
are summed to form C, the estimated total cost (in time). a is the time that the production itself
takes to fire. The default time for a production is 50 ms, plus the time taken for any retrievals
from declarative memory. Again, because this model does not make any retrievals from
declarative memory, the a parameter for all the productions in this model does not change. On
the other hand, b is the estimated total time after the production fires until the goal is popped, and
does get learned by this model. This is the “downstream” cost of a production firing, and should
generate within the model a preference for productions which minimize the estimated
downstream cost.
--------- insert Figure 15 about here ----------
Figure 15 presents ACT-R’s estimate of b for each of the initial saccade productions over
5,000 trials. On each of the 5,000 trials, each aspect of the trial was randomly selected: menu
length, target position, target type (digit or letter), and distractor type (digit or letter), so the
ACT-R/PM for HCI
32

environment was similar to the one experienced by the users in Byrne, et al. (1999). Notice the
rapid divergence at early trials, then the convergence around 800, then a slow divergence. The
ATTEND-FIRST-POSITION production is eventually preferred (lowest curve), but this
preference is not clear until after 3,000 trials or so.
The final values of b for each production, and the probability of selection according to
Equation 2 that value represents, are presented in Table 3 (lower values of b mean lower cost,
and therefore higher expectation value and thus higher probability of being selected). The model
learns to favor productions that move shorter distances down the menu on the initial saccade, and
this improves the fit of the model to the initial saccade data (r-squared 0.89), though the model’s
mode is still not correct.
--------- insert Figure 16 about here ----------
The model also learns to prefer the DOWN-NEAREST-HIT production over the LOOK-
ANYWHERE production. Figure 16 presents the learning curve over the first 2,000 learning
trials; the remaining trials are fairly stable. The final b for DOWN-NEAREST-HIT after 5,000
trials was 1.412, for LOOK-ANYWHERE it was 1.509. When both are competing in conflict
resolution, DOWN-NEAREST-HIT should fire 66.5% of the time, and LOOK-ANYWHERE the
remaining 33.5% of the time. The distribution of the middle saccades of the model, which is
presented in Figure 17a, is a slightly worse fit, from an r-squared of 0.83 to 0.81. The distribution
of final saccades is presented in Figure 17b, and the fit again is not exceptional with an r-squared
of only 0.62.
--------- insert Figure 17 about here ----------
The small changes in fit quality for the saccade distributions were accompanied by a
small improvement to the overall reaction time data and the number of fixations. The fit to the
reaction time and fixation data is presented in Figure 18. These fits are still relatively poor
overall (average absolute error for RT data is 21.27%, and 21.28% for the number of fixations),
particularly with targets near the top of the menu. This is because the model is unlikely to reverse
itself if the target is high on the menu and it is initially skipped. On the other hand, this is more
or less a zero-parameter fit.
--------- insert Figure 18 about here ----------
ACT-R/PM for HCI
33

So, while learning does make a small improvement to the performance of the model, the
gains are not large, and the overall fit of the model is still not particularly good. However, the
content of the two productions in the model is somewhat odd. The DOWN-NEAREST-HIT
production specifies three constraints on the next item fixated: it must have greater serial position
than the current item, it must contain the feature randomly selected at the beginning of the trial,
and it must be the nearest (if multiple items match the first two). The competing production,
LOOK-ANYWHERE, has no constraints of any kind. This is not much of an exploration of the
possible strategy space. The next model is an attempt to more thoroughly examine that space.
4.2 The Inclusive Model
As mentioned, the two productions in the previous model are strikingly different.
DOWN-NEAREST-HIT includes three constraints: direction, distance, and feature match.
LOOK-ANYWHERE includes no constraints. These are the only two productions allowed to
compete. However, there are productions that fall in between these two levels of constraint. This
raises an obvious question: what happens when a more complete set of productions is included?
Just such a model was constructed. Besides the five productions which control the initial
saccade, which were identical to those used in the EPIC-Inspired model, this model contains
productions which range in their constraints from the three included in DOWN-NEAREST-HIT
to the zero in LOOK-ANYWHERE. There are three constraints, direction, distance, and feature
match, each of which could be enforced or ignored by each production. Thus, there are 23, or
eight, productions. These eight productions are:
• DOWN-NEAREST-HIT, which is identical to the production in the previous two
models.
• DOWN-NEAREST, which saccades to the previously-unseen item on the menu which
is below the current item and nearest, but ignores whether or not the item is a feature match.
• DOWN-ANY-HIT, which saccades down the menu, and all previously-unseen items
with a feature match are equally likely to be selected.
• DOWN-ANYWHERE, which will randomly select any previously-unseen item below
ACT-R/PM for HCI
34

the current item.
• ANY-NEAREST-HIT, which will saccade to a random previously-unseen item with a
feature match in either direction, but will prefer the one nearest to the current item.
• ANY-NEAREST, which will saccade to the nearest previously-unseen item. If there is a
tie, then the choice will be random.
• ANY-HIT, which will randomly saccade to any previously-unseen item with a feature
match.
• ANYWHERE, which is identical to the LOOK-ANYWHERE production in the
previous model.
The goal was to give the model a large strategy space, and then rather than attempt to
tweak the preferences for various productions by hand to maximize fit, allow the model to learn
the preferences itself. The ACT-R defaults for each production will be a b of 1.0, so they will
initially all have equal probability of firing in any situation in which they all match. As it turns
out, the default behavior of this model is actually not bad. The before-learning fit to the reaction
time and fixation data is presented in Figure 19. The average absolute error for response time is
17.86%, with no fit parameters. The model is too slow at short target locations, but otherwise
not exceptionally poor. The fit to the number of fixation data is also quite good for a zero-
parameter fit. The average absolute error is again within 20%, at 14.46%.
--------- insert Figure 19 about here ----------
Fit to the saccade distributions is not quite as good. Again, the model generates an
approximately uniform distribution across locations 1 through 5 for the initial saccade, and like
the EPIC-Inspired model this generates an r-squared of model to data of 0.82. Fits to middle and
last saccades, however, are not as encouraging. The model’s saccade behavior is presented in
Figure 20. The fits here generate r-squareds of 0.68 for middle saccades and 0.79 for final
saccades. Thus, while the default behavior of the model is somewhat reasonable in terms of
response time and number of fixations made, those fixations do not appear to be distributed
correctly. In particular, the mode of 1 is far too dominant for the middle saccades.
--------- insert Figure 20 about here ----------
The Inclusive model was run through 5,000 learning trials which were randomized in the
ACT-R/PM for HCI
35

same fashion as the learning trials used in the EPIC-Inspired model. Figure 21 presents the
learning curve for the five productions which participate in conflict resolution for the first
saccade. Again, the curves initially diverge, then re-converge around 1,000 trials, then diverge
and fluctuate thereafter, with no production clearly favored. The most favored production after
5,000 trials targets the first item and should fire 21.9% of the time, while the least favored
production is the one which targets the second item, which should fire 18.0% of the time. Overall
the model develops very little in the way of preference for the initial production, and in fact the
fit to the empirical data is slightly worse (r-squared of 0.76).
--------- insert Figure 21 about here ----------
Learning data for the eight productions which control search after that point are presented
in Figure 22. Here the model clearly develops fairly decisive preferences. b values at the end of
the 5000 trials, and the probabilities they should generate when all eight productions compete,
are presented in Table 4. One of the most striking trends in the learning data is the clear
preference the model generates for productions which specify a feature match. The four
productions which specify a feature match are clearly preferred to the four that do not. However,
the model does not learn that the less-restrictive productions are useless, in fact, the model will
fire one of these four productions approximately a quarter of the time (26.4%).
--------- insert Figure 22 about here ----------
The second preference that is clear is the preference for the ANY-* productions over the
DOWN-* productions. The ANY-* productions are the model’s only way to back up if a
DOWN-* production overshoots, and are flexible in that they can lead either up or down the
menu, so this preference is not wholly surprising. However, given that the EPIC-Inspired model
developed a preference for DOWN-NEAREST-HIT, this might be regarded as at least somewhat
surprising. The effect of the *-HIT appears to override other preferences. The third preference
exhibited by the model, though only a mild preference, is for productions which specify
NEAREST. The model learns to favor short saccades. The reason for this is not entirely clear.
Interestingly, if the only production in the model was the one that was preferred overall,
ANY-NEAREST-HIT, the model would effectively behave like the original ACT-R visual
interface model, because the only unexplored hits would always be down the menu, since the
ACT-R/PM for HCI
36

search begins at the top. However, in the context of the other productions, this is not the behavior
this production generates. The behavior of an ACT-R model, particularly one which learns, is
dependent not only on the most favored production, but the other productions involved in the
competition.
Clearly, learning did influence the behavior of the model. The question, however, is
whether or not this learning made the model behave more like the users. Overall, it appears that
it did. The fit of the Inclusive model after learning to the reaction time and fixation data is
presented in Figure 23. While the model is still too slow for some target positions, particularly
positions 2 and 3, the overall fit is better. The average absolute error has been reduced to
12.96%, which represents a reduction of about one-third. This is a clear improvement. The model
again produces something of a Nilsen effect, though it is still much less pronounced that the
actual data.
--------- insert Figure 23 about here ----------
However, in other areas the model has not improved the fit. Consider the number of
fixations generated by the model vs. those performed by the users. The average absolute error
has risen to 16.77%, which is not bad but is worse than the pre-learning version of the model.
This model clearly makes too few fixations, particularly for targets with high serial positions.
This is probably due to the model’s reliance on feature guidance—the model is still probably
more sensitive to feature guidance than users are.
On the other hand, the fit to the distribution of saccades for the middle and last saccades
is much improved, particularly the middle saccades. Distributions for the middle and last
saccades are presented in Figure 24. The r-squared has risen from 0.68 to 0.84 for the middle
saccades, primarily due to the reduction in the modal value. The mode is still 1, but the
frequency of the mode after learning is much closer to observed frequency. The improvement in
the distribution of final saccades is not as impressive, but the r-squared did rise from 0.79 to
0.84. Overall, the fit of the Inclusive model after learning does appear to be better than the fit
prior to learning, but there are some costs as well.
--------- insert Figure 24 about here ----------
The key to the relative success of this model is the focus on local rather than global
ACT-R/PM for HCI
37

strategies. The eye-tracking data certainly suggests that users do not follow global strategies
from trial to trial, or even within a trial. Instead, local decision-making appears to dominate.
ACT-R/PM is well-suited to modeling decision-making at that level, and this made the modeling
relatively straightforward. The apparently complex strategy adopted by the model is, in fact, a
relatively simple set of preferences among the possible choices in a strategy space. This strategy
space may not entirely exhaust all the possible local decision options, but it does give a sense of
the way ACT-R learns preferences within such a strategy space.
5. General Discussion
The fit of the final model is not perfect. However, the fit is good considering that no
parameters were changed in order to optimize the fit of the model; these fits are essentially zero-
parameter predictions based on the system defaults for both timing parameters and learning
functions. This is also more than just a simple fit to reaction time data; it is a fit of the observed
distribution of eye movements as well. Given the amount of constraint imposed by the rich eye-
tracking data and the absence of parameter fitting, this represents an important step forward in
our ability to model rapid tasks. This model is surely not a perfect model of the task and does not
necessarily invalidate other models, but it suggests that there is great power in considering tasks
like this as being driven by local rather than global strategies, and that learning plays a role in the
development of those strategies. Furthermore, while this exact task is not likely to appear in
many real-world task environments, tasks which require searching more or less arbitrary displays
for more or less arbitrary items are certainly common.
An additional advantage of the ACT-R/PM approach employed here is the avoidance of
free parameters. ACT-R/PM’s default parameters have performed well in other contexts (e.g.
Byrne & Anderson, 1998, in press; Ehret, 1999; Gray, Scholles, & Fu, 2000), and no numerical
parameters were manipulated in order to optimize the fit between model and data. This is in
contrast with the EPIC model of the original Nilsen data, which manipulated two such
parameters (proportion of trials on which three items could be foveated and proportion of trials
using systematic vs. random search). Of course, in constructing production rule models, the
ACT-R/PM for HCI
38
modeler does have a certain amount of freedom in the model selection process itself. The current
paper is an attempt to document a progression through this model-selection process, and the final
model is a result not just of the production rules included in the model, but also of ACT-R’s
learning mechanisms. The learning mechanisms limit the impact of arbitrary inclusion of
productions, since the model can effectively “weed out” ineffective strategies.
This is not to say all the issues have been resolved. This model employs a strategy for
mouse control that is essentially identical to the one employed by the EPIC model, that is, no
mouse movement is initiated until the target character is found. This is simply not the strategy
employed by all users at all times. While this strategy did seem to be the dominant choice for
some users, it certainly was not for others. Mouse control may well be the source of the model’s
slowness for targets at position 2 and 3 and might explain the size of the Nilsen effect in these
data. With longer menus, both in terms of number of items and distance for the mouse to travel,
users may have been more inclined to make an early mouse movement, which would then
overshoot the target and require additional time to correct. The current models do not reflect
differences in mouse control strategies.
Another issue to consider is the learning environment. The model learned in an
environment that closely mimicked the one experienced by users in the experiment, but this is
almost certainly not the same as the environments in which most people generally do most of
their visual searches. In particular, the largest set size employed was only 12 items. Part of the
Nilsen effect may be due to an learning environment which includes many longer searches, and
thus the preference for making saccades further down the menu may be underestimated by the
current model.
There are other issues as well. The selection and predictiveness of the feature set used to
represent the letters almost certainly has some impact on the performance of the model, but
exactly how much and which feature set is the “right” one is still unclear. A detailed discussion
of this issue is beyond the scope of this paper, but several feature sets have been explored with
surprisingly little overall impact on model performance. Reasons for this are not entirely
obvious, but it appears that most of the feature sets that have been used in the psychology
literature are based on character discrimination, not character search, and this may explain why
ACT-R/PM for HCI
39

the feature sets seem somewhat too powerful. The number of unresolved issues with respect to
vision and visual search is large, however, and this is merely one of many questions that remain
unanswered.
However, ACT-R/PM provides an excellent tool for exploring such issues. The ETA
decomposition, paired with a sophisticated modeling system such as ACT-R/PM, should allow
detailed analysis of interactive systems that are much more demanding than simple menu
selection, such as military command and control, civilian air traffic control, in-vehicle navigation
systems, emergency rooms, wearable computers in high-performance tasks, unmanned piloting,
and so on. The range of potential applications is tremendous, and until recently computational
tools have been ill-equipped to meet such challenges. The emergence of systems like ACT-R/PM
and EPIC-Soar provide a sound basis on which to pursue questions, both theoretical and
practical, about the coordination of cognition, perception, and action in interactive tasks and how
that coordination develops over time.
ACT-R/PM for HCI
40

References
Agre, P. E., & Rosenschein, S. J. (Eds.). (1996). Computational theories of interaction and
agency. Cambridge, MA: MIT Press.
Anderson, J. R. (1983). The architecture of cognition. Mahwah, NJ, USA: Lawrence Erlbaum.
Anderson, J. R. (1990). The adaptive character of thought. Hillsdale, NJ: Lawrence Erlbaum.
Anderson, J. R. (1993). Rules of the mind. Hillsdale, NJ: Lawrence Erlbaum.
Anderson, J. R., Bothell, D., Lebiere, C. & Matessa, M. (1998). An integrated theory of list
memory. Journal of Memory and Language, 38, 341–380.
Anderson, J. R., & Lebiere, C. (1998) The atomic components of thought. Mahwah, NJ:
Lawrence Erlbaum.
Anderson, J. R., Matessa, M., & Lebiere, C. (1997). ACT-R: A theory of higher level cognition
and its relation to visual attention. Human-Computer Interaction, 12, 439–462.
Anderson, J. R., Matessa, M., & Lebiere, C. (1998). The visual interface. In J. R. Anderson & C.
Lebiere (Eds.) The atomic components of thought (pp. 143–168). Mahwah, NJ: Lawrence
Erlbaum.
Anderson, J. R., & Reder (1999). The fan effect: New results and new theories. Journal of
Experimental Psychology: General, 128, 186-197.
Briggs, R., & Hocevar, D. J. (1975). A new distinctive feature theory for upper case letters.
Journal of General Psychology, 93(1), 87-93.
Byrne, M. D., & Anderson, J. R. (1998). Perception and Action. In J. R. Anderson & C. Lebiere
(Eds.) The atomic components of thought (pp. 167–200). Mahwah, NJ: Lawrence
Erlbaum.
Byrne, M. D., & Anderson, J. R. (in press). Serial modules in parallel: The psychological
refractory period and perfect time-sharing. To appear in Psychological Review.
ACT-R/PM for HCI
41

Byrne, M. D., Anderson, J. R., Douglass, S., & Matessa, M. (1999). Eye tracking the visual
search of click-down menus. Human Factors in Computing Systems: Proceedings of CHI
99, 402-409. Reading, MA: Addison Wesley.
Byrne, M. D., & Bovair, S. (1997). A working memory model of a common procedural error.
Cognitive Science, 21(1), 31-61.
Card, S., Moran, T., & Newell, A. (1983). The psychology of human-computer interaction.
Hillsdale, NJ: Erlbaum.
Chong, R. S. (1998). Modeling Dual-Task Performance Improvement:Casting Executive Process
Knowledge Acquisition as Strategy Refinement. Doctoral dissertation, University of
Michigan, Ann Arbor, MI.
Coeffe, C., & O'Regan, J. K. (1987). Reducing the influence of non-target stimuli on saccade
accuracy: Predictability and latency effects. Vision Research, 27(2), 227-240.
Cohen, P. R., Greenberg, M. L., Hart, D. M., & Howe, A. E. (1989). Trial by fire: Understanding
the design requirements for agents in complex environments. AI Magazine, 10(3), 32-48.
Ehret, B. D. (1999). Learning Where to Look: The Acquisition of Location Knowledge in
Display-Based Interaction. Doctoral dissertation, George Mason University, Fairfax, VA.
Findlay, J. M. (1982). Global visual processing for saccadic eye movements. Vision Research,
22(8), 1033-1045.
Findlay, J. M. (1997). Saccade target selection in visual search. Vision Research, 37, 617-631.
Gibson, E. J. (1969). Principles of perceptual learning and development. New York: Meredith.
Gray, W. D. (2000). The nature and processing of errors in interactive behavior. Cognitive
Science, 24, 205–248.
Gray, W. D., & Altmann, E. M. (in press). Cognitive modeling and human-computer interaction.
In W. Karwowski (Ed.), International encyclopedia of ergonomics and human factors.
New York: Taylor & Francis, Ltd.
ACT-R/PM for HCI
42

Gray, W. D., Schoelles, M. J., & Fu, W.-T. (2000). Modeling a continuous dynamic task. Paper
presented at the Third International Conference on Cognitive Modeling, Groningen,
Netherlands.
Hornof, A. J., & Kieras, D. E. (1997). Cognitive modeling reveals menu search is both random
and systematic. In Human Factors in Computing Systems: Proceedings of CHI 97 (pp.
107–114). New York: ACM Press.
John, B. E. and D. E. Kieras (1996). The GOMS family of user interface analysis techniques:
Comparison and contrast. ACM Transactions on Computer-Human Interaction, 3, 320-
351.
Kieras, D. E., & Meyer, D. E. (1996). The EPIC architecture: Principles of operation.
Unpublished manuscript from ftp://ftp.eecs.umich.edu/ people/kieras/EPICarch.ps
Kieras, D. E., & Meyer, D. E. (1997). An overview of the EPIC architecture for cognition and
performance with application to human-computer interaction. Human-Computer
Interaction, 12, 391–438.
Landauer, T. K. (1995). The trouble with computers: Usefulness, usability, and productivity.
Cambridge, MA: MIT Press.
MacKenzie, I. S. (1992). Fitts’ Law as a research and design tool in human-computer interaction.
Human-Computer Interaction, 7, 91–139.
Motter, B. C., & Belky, E. J. (1998a). The zone of focal attention during active visual search.
Vision Research, 38(7), 1007-1022.
Motter, B. C., & Belky, E. J. (1998b). The guidance of eye movements during active visual
search. Vision Research, 38(12), 1805-1815.
Newell, A. (1990). Unified theories of cognition. Cambridge, MA: Harvard University Press.
Nielsen, J. (1997). How Users Read on the Web. http://www.useit.com/alertbox/9710a.html
ACT-R/PM for HCI
43

Nilsen, E. L. (1991). Perceptual-motor control in human-computer interaction (Technical Report
Number 37). Ann Arbor, MI: The Cognitive Science and Machine Intelligence
Laboratory, the University of Michigan.
Norman, K. L. (1991). The Psychology of Menu Selection: Designing Cognitive Control of the
Human/Computer Interface. Norwood, NJ: Ablex.
Pylyshyn, Z. (1999). Is vision continuous with cognition? The case of impenetrability of visual
perception. Behavioral & Brain Sciences, 22, 341-423.
Ritter, F. E., Baxter, G. D., Jones, G., & Young, R. M. (2000). Cognitive models as users. ACM
Transactions on Computer-Human Interaction, 7, 141-173.
Rosenbaum, D. A. (1980). Human movement initiation: Specification of arm, direction, and
extent. Journal of Experimental Psychology: General, 190, 475-495.
Rosenbaum, D. A. (1991). Human motor control. New York: Academic Press.
Shen, J., & Reingold, E. M. (1999). Saccadic selectivity during visual search: The effects of
shape and stimulus familiarity. In M. Hahn & S. C. Stoness (Eds.), Twenty First Annual
Conference of the Cognitive Science Society (pp. 649-652). Mahwah, NJ: Erlbaum.
Tauscher, L., & Greenberg, S. (1997). How people revisit Web pages: Empirical findings and
implications for the design of history systems. International Journal of Human-Computer
Studies, 47, 97–137
Treisman, A. M., & Gelade, G. (1980). A feature-integration theory of attention. Cognitive
Psychology, 12(1), 97-136.
Welford, A. T. (1968). Fundamentals of skill. London: Methuen.
Zelinsky, G. J., & Sheinberg, D. L. (1997). Eye movements during parallel-serial visual search.
Journal of Experimental Psychology: Human Perception & Performance, 23(1), 244-262.
ACT-R/PM for HCI
44

Zettlemoyer, L. S., St. Amant, R. (1999). A visual medium for programmatic control of
interactive applications. Human Factors in Computing Systems: Proceedings of CHI 99,
199–206. Reading, MA: Addison-Wesley.
ACT-R/PM for HCI
45

Author Note
Michael D. Byrne, Department of Psychology.
I would like to thank John Anderson for his extensive contributions to this work and
Wayne Gray for discussions about the ETA triad. Portions of this research was supported by the
National Science Foundation (NSF SBR 94-21332), the Office of Naval Research (ONR
N00014-96-I-0491), and the National Institute of Mental Health (NIMH 2732-MH19102) while
the author was at Carnegie Mellon University.
Correspondence concerning this article should be addressed to Michael D. Byrne,
Department of Psychology, Rice University MS-25, 6100 Main Street, Houston, Texas, 77005-
1892. Electronic mail may be sent to [email protected].
ACT-R/PM for HCI
46

Table 1. ACT-R/PM main system parameters (not including Audition and Speech)
Parameter Module ValueBurst time Motor 50 msecFeature preparation time, per feature Motor 50 msecFitts' coefficient for Peck Motor 75 msec/bitFitts' coefficient, mouse movement Motor 100 msec/bitMinimum aimed movement time Motor 100 msecAttention shift latency Vision 135 msec
ACT-R/PM for HCI
47
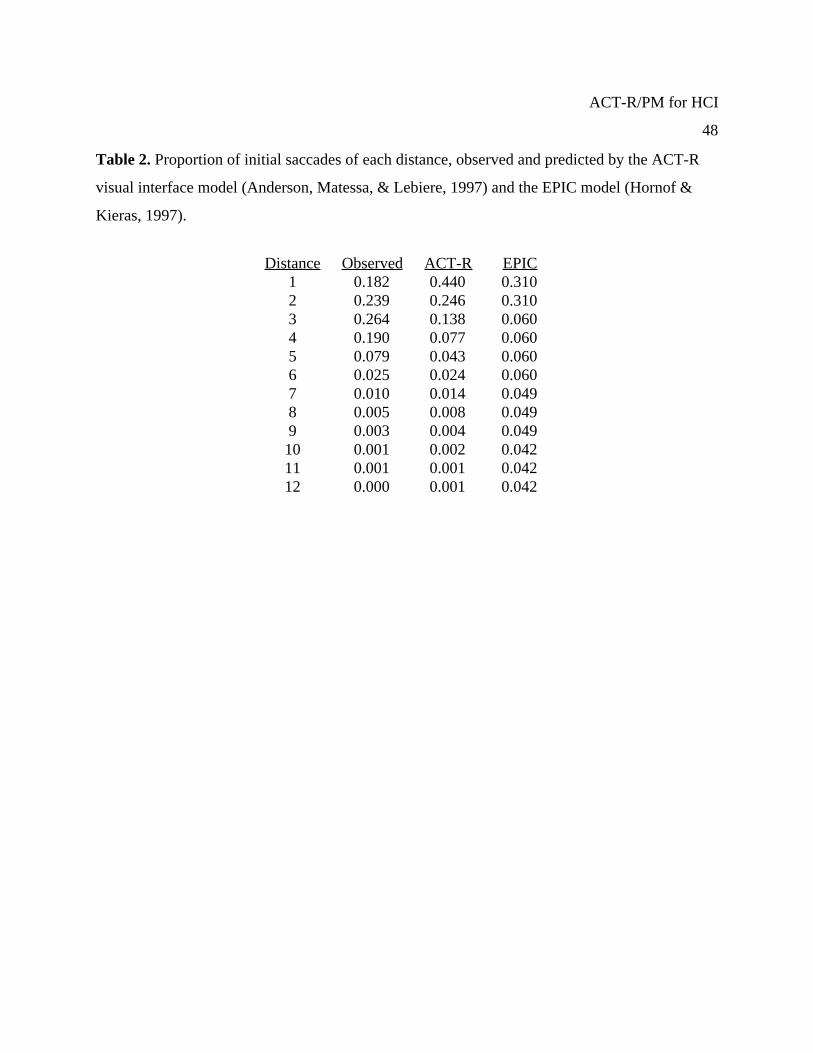
Table 2. Proportion of initial saccades of each distance, observed and predicted by the ACT-R
visual interface model (Anderson, Matessa, & Lebiere, 1997) and the EPIC model (Hornof &
Kieras, 1997).
Distance Observed ACT-R EPIC1 0.182 0.440 0.3102 0.239 0.246 0.3103 0.264 0.138 0.0604 0.190 0.077 0.0605 0.079 0.043 0.0606 0.025 0.024 0.0607 0.010 0.014 0.0498 0.005 0.008 0.0499 0.003 0.004 0.04910 0.001 0.002 0.04211 0.001 0.001 0.04212 0.000 0.001 0.042
ACT-R/PM for HCI
48

Table 3. Final b values for the five productions which compete for control of the initial saccade
in the EPIC-Inspired model after 5000 learning trials.
Production Name b-value Probabilityattend-first-position 1.5989 0.256attend-second-position 1.6267 0.210attend-third-position 1.6271 0.210attend-fourth-position 1.6412 0.190attend-fifth-position 1.6909 0.134
ACT-R/PM for HCI
49

Table 4. Final b values for the eight productions which compete for control of after the initial
saccade in the Inclusive model after 5000 learning trials.
Production Name b-value Probabilitydown-nearest-hit 1.3868 0.143down-any-hit 1.3954 0.135down-nearest 1.5300 0.052down-anywhere 1.4959 0.066any-nearest-hit 1.3170 0.234any-hit 1.3230 0.225nearest 1.4789 0.075anywhere 1.4857 0.071
ACT-R/PM for HCI
50

Figure Captions
Figure 1. The Embodied Cognition-Task-Artifact triad.
Figure 2. ACT-R/PM system diagram.
Figure 3. Flow of information in the ACT-R production system. After Figure 1.2 in Anderson
and Lebiere (1998).
Figure 4. Flow of information in the Vision Module.
Figure 5. Procedure in the Nilsen menu experiment.
Figure 6. Results of the Nilsen experiment. The dotted curve underneath the data represents the
movement time as predicted by Fitts’ Law.
Figure 7. The two strategies in the EPIC model. Panel (a) describes the systematic strategy, and
panel (b) presents the random strategy. Based on Hornof and Kieras (1997).
Figure 8. Example menu used in the Byrne, et al. (1999) eye-tracking experiment.
Figure 9. Response time of subjects (panel a) and number of fixations of subjects (panel b) as a
function of menu length and target position in the eye-tracking experiment.
Figure 10. Histogram for the distribution of the initial saccade. Item 1 represents the top menu
item.
Figure 11. Histograms for the distribution of middle saccades (panel a) and final saccades (panel
b). Positive numbers represent the top-to-bottom direction, negative numbers the bottom-
to-top direction.
Figure 12. Representation of the letter “E” in the default feature set used by the ACT-R Visual
Interface.
ACT-R/PM for HCI
51

Figure 13. Fit of the EPIC-Inspired model to the empirical response time data (panel a) and
fixation data (panel b). Filled points and solid lines represent the model, open points and
dashed lines the data. Vertical bars represent 95% confidence intervals.
Figure 14. Histogram of saccade distances for middle saccades (panel a) and final saccades
(panel b) for the EPIC-Inspired model. The empirical distribution is indicated by the gray
line and boxes.
Figure 15. Learning curve for the five productions which direct the initial saccade of the EPIC-
Inspired ACT-R/PM model.
Figure 16. Learning curves for the DOWN-NEAREST-HIT production (lower curve) and the
LOOK-ANYWHERE production for the first 2000 learning trials in the EPIC-Inspired
model.
Figure 17. Histogram of saccade distances for middle saccades (panel a) and final saccades
(panel b) for the EPIC-Inspired model after 5000 learning trials. The empirical
distribution is indicated by the gray line and boxes.
Figure 18. Fit of the EPIC-Inspired model to the empirical response time data (panel a) and
fixation data (panel b) after 5000 learning trials. Filled points and solid lines represent the
model, open points and dashed lines the data. Vertical bars represent 95% confidence
intervals.
Figure 19. Fit of the before-learning Inclusive model to the empirical response time data (panel
a) and fixation data (panel b). Filled points and solid lines represent the model, open
points and dashed lines the data. Vertical bars represent 95% confidence intervals.
Figure 20. Histogram of saccade distances for middle saccades (panel a) and final saccades
(panel b) for the Inclusive model, before learning. The empirical distribution is indicated
by the gray line and boxes.
Figure 21. Learning curve for the five productions which direct the initial saccade of the
Inclusive model.
ACT-R/PM for HCI
52

Figure 22. Learning curve for the eight productions which direct the search after the initial
saccade for the Inclusive model.
Figure 23. Fit of the Inclusive model after 5000 learning trials to the empirical response time
data (panel a) and fixation data (panel b). Filled points and solid lines represent the
model, open points and dashed lines the data. Vertical bars represent 95% confidence
intervals.
Figure 24. Histogram of saccade distances for middle saccades (panel a) and final saccades
(panel b) for the Inclusive model, before learning. The empirical distribution is indicated
by the gray line and boxes.
ACT-R/PM for HCI
53

Interactive Behavior
Embodied Cognition
Task Artifact
Figure 1

Perceptual-Motor Layer
CognitiveLayer
attention
attention
target of attention (chunks)
target of attention (chunks)
screen objects
simulatedaudio
clicks, keypresses
simulatedspeech
Motor Module
Speech Module
Audition Module
Vision Module
Production Memory
Declarative Memory
Environment
Figure 2
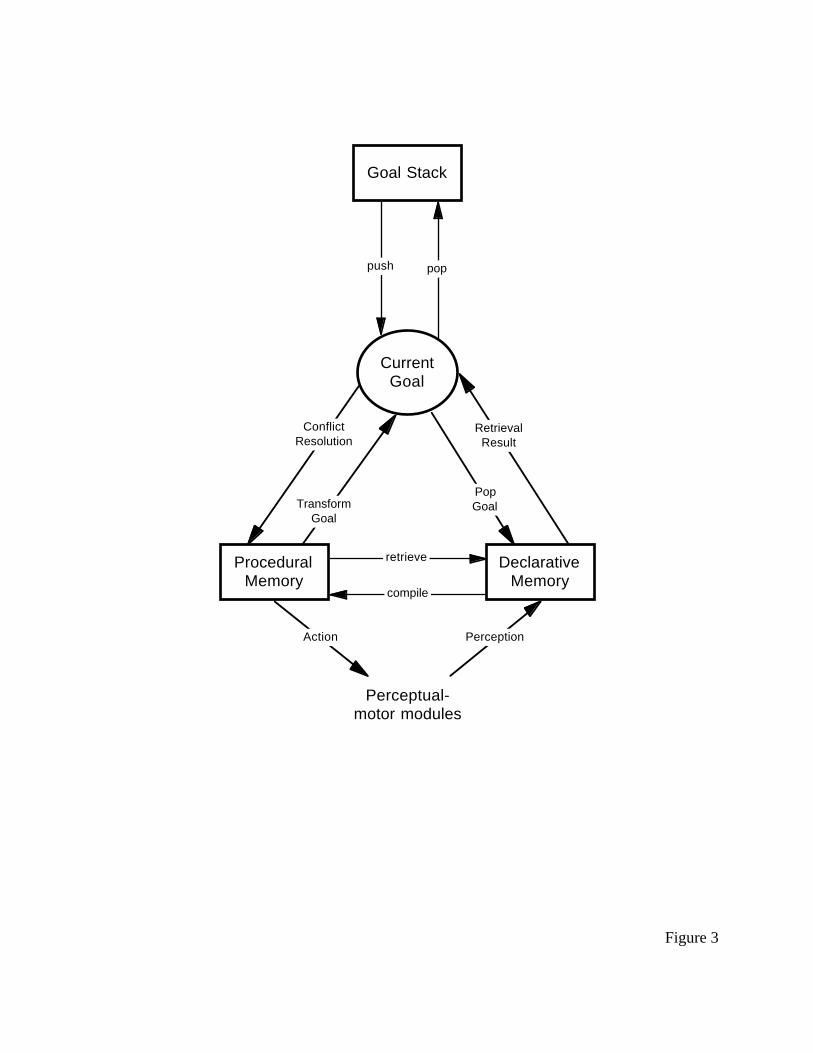
push pop
retrieve
compile
TransformGoal
ConflictResolution
PopGoal
RetrievalResult
Action Perception
Current Goal
Goal Stack
Procedural Memory
Declarative Memory
Perceptual-motor modules
Figure 3

Window
Icon
feature
feature
feature
feature
feature
feature
feature
feature
feature
DeclarativeMemory
chunk
chunk
chunk
chunk
chunk
Figure 4

(a) (b)
4
GO
3
5
4
7
6
2
Figure 5

Figure 6

(a)
Look at precueClick the GO box and move eyes to top item
Determine the item one foveal diameter below gaze.Move eyes to that item.
Quit searching when target item appears in memory.
Move mouse and gaze to item.Click mouse
donein parallel
(b)
Look at precue.Click the GO box and move eyes to random item
As soon as it is determined which items are not in the fovea, randomly choose an item and move gaze to it.
Quit searching when target item appears in memory.
Move mouse and gaze to item.Click mouse
donein parallel
Figure 7

Figure 8

1 2 3 4 5 6 7 8 9 10 11 120
200
400
600
800
1000
1200
1400
1600
1800
2000R
esp
on
se T
ime
(ms)
Target Location
6
9
12
Figure 9a

1 2 3 4 5 6 7 8 9 10 11 12
0
1
2
3
4
5
6
Nu
mb
er o
f fi
xati
on
s
Target Location
6
9
12
Figure 9b

1 2 3 4 5 6 7 8 9 10 110.00
0.05
0.10
0.15
0.20
0.25
0.30
Pro
po
rtio
n
Distance
Figure 10

-11
-10 -9 -8 -7 -6 -5 -4 -3 -2 -1 1 2 3 4 5 6 7 8 9 10 11
0.00
0.05
0.10
0.15
0.20
0.25
Pro
po
rtio
n
Distance
Figure 11a
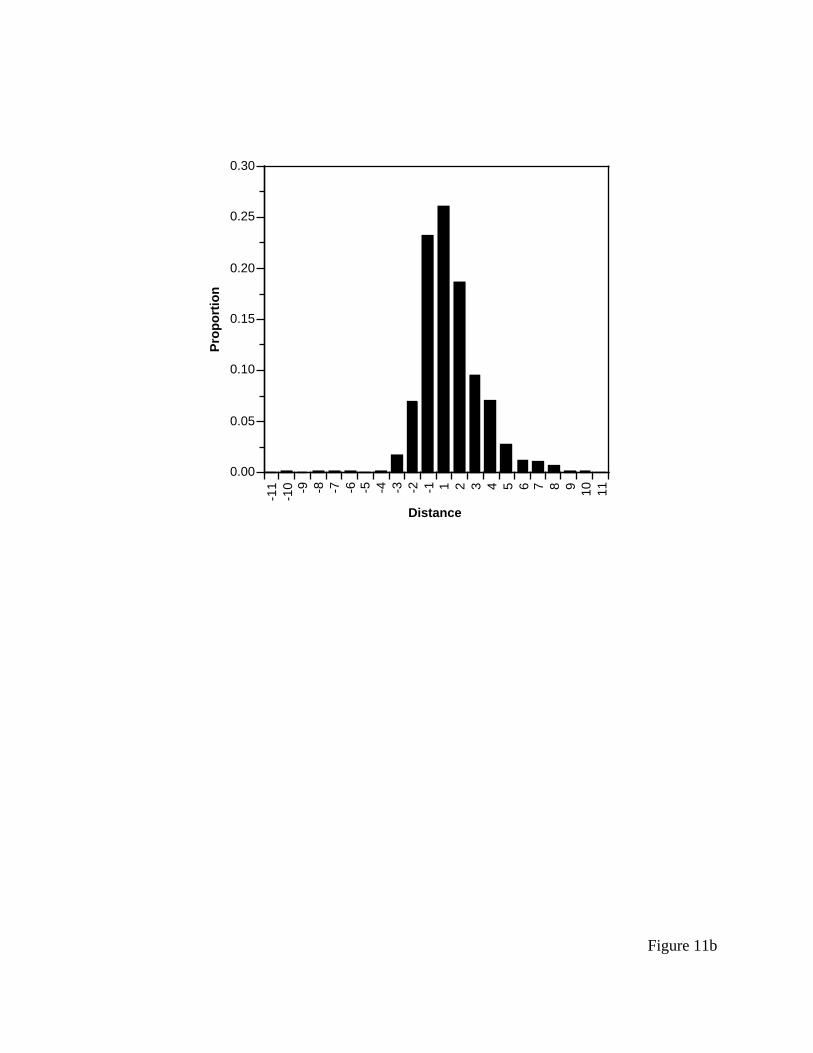
-11
-10 -9 -8 -7 -6 -5 -4 -3 -2 -1 1 2 3 4 5 6 7 8 9 10 11
0.00
0.05
0.10
0.15
0.20
0.25
0.30
Pro
po
rtio
n
Distance
Figure 11b

- -| - -| - -
Figure 12
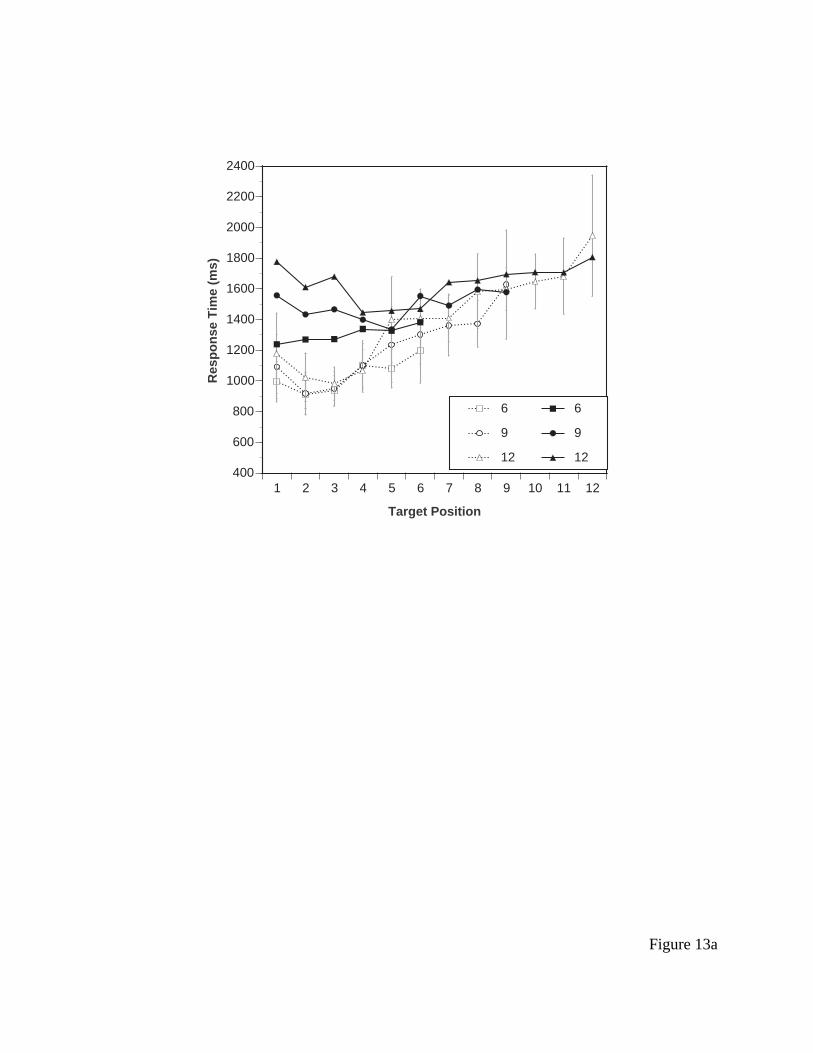
1 2 3 4 5 6 7 8 9 10 11 12400
600
800
1000
1200
1400
1600
1800
2000
2200
2400
Res
po
nse
Tim
e (m
s)
Target Position
6
9
12
6
9
12
Figure 13a
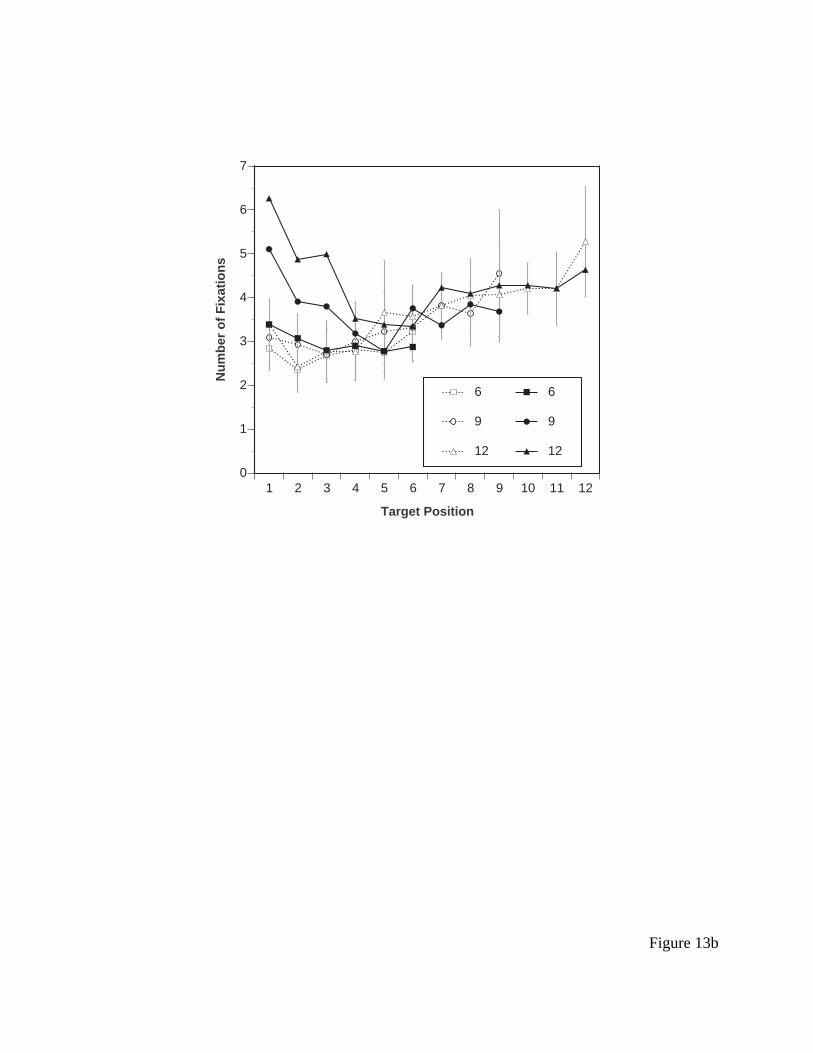
1 2 3 4 5 6 7 8 9 10 11 120
1
2
3
4
5
6
7
Nu
mb
er o
f F
ixat
ion
s
Target Position
6
9
12
6
9
12
Figure 13b

-11
-10 -9 -8 -7 -6 -5 -4 -3 -2 -1 1 2 3 4 5 6 7 8 9
10 11
0.00
0.05
0.10
0.15
0.20
0.25
Pro
po
rtio
n
Distance
Figure 14a

-11
-10 -9 -8 -7 -6 -5 -4 -3 -2 -1 1 2 3 4 5 6 7 8 9
10 11
0.00
0.05
0.10
0.15
0.20
0.25
0.30
Pro
po
rtio
n
Distance
Figure 14b

020
040
060
080
010
0012
0014
0016
0018
0020
0022
0024
0026
0028
0030
0032
0034
0036
0038
0040
0042
0044
0046
0048
00
1.3
1.4
1.5
1.6
1.7
1.8
1.9
2.0
2.1P
rod
uct
ion
b-v
alu
e
Trial
Figure 15

0 200 400 600 800 1000 1200 1400 1600 18001.20
1.25
1.30
1.35
1.40
1.45
1.50
1.55
1.60
1.65
1.70P
rod
uct
ion
b-v
alu
e
Trial
Figure 16

-11
-10 -9 -8 -7 -6 -5 -4 -3 -2 -1 1 2 3 4 5 6 7 8 9
10 11
0.00
0.05
0.10
0.15
0.20
0.25
Pro
po
rtio
n
Distance
Figure 17a

-11
-10 -9 -8 -7 -6 -5 -4 -3 -2 -1 1 2 3 4 5 6 7 8 9
10 11
0.00
0.05
0.10
0.15
0.20
0.25
0.30
Pro
po
rtio
n
Distance
Figure 17b

1 2 3 4 5 6 7 8 9 10 11 12400
600
800
1000
1200
1400
1600
1800
2000
2200
2400
Res
po
nse
Tim
e (m
s)
Target Position
6
9
12
6
9
12
Figure 18a
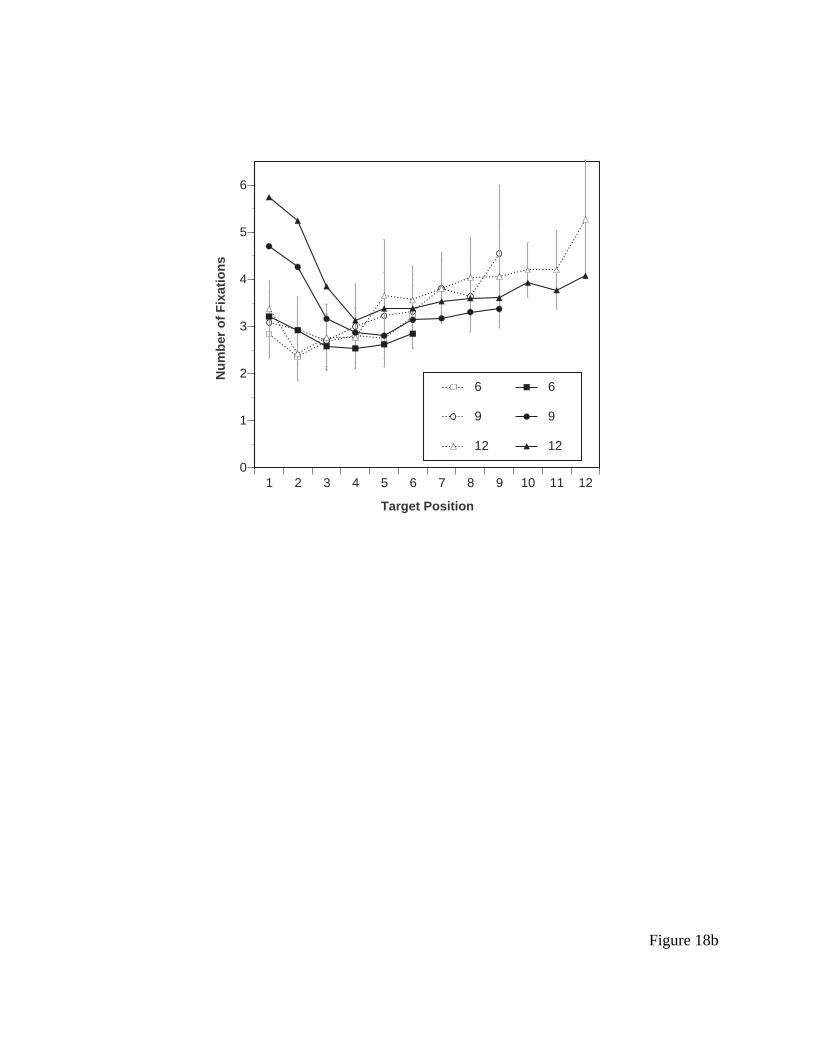
1 2 3 4 5 6 7 8 9 10 11 120
1
2
3
4
5
6
Nu
mb
er o
f F
ixat
ion
s
Target Position
6
9
12
6
9
12
Figure 18b

1 2 3 4 5 6 7 8 9 10 11 12400
600
800
1000
1200
1400
1600
1800
2000
2200
2400
Res
po
nse
Tim
e (m
s)
Target Position
6
9
12
6
9
12
Figure 19a

Target 1 2 3 4 5 6 7 8 9 10 11 120
1
2
3
4
5
6
Nu
mb
er o
f F
ixat
ion
s
Target Position
6
9
12
6
9
12
Figure 19b

-11
-10 -9 -8 -7 -6 -5 -4 -3 -2 -1 1 2 3 4 5 6 7 8 9
10 11
0.00
0.05
0.10
0.15
0.20
0.25
0.30
0.35
0.40
Pro
po
rtio
n
Distance
Figure 20a

-11
-10 -9 -8 -7 -6 -5 -4 -3 -2 -1 1 2 3 4 5 6 7 8 9
10 11
0.00
0.05
0.10
0.15
0.20
0.25
0.30
Pro
po
rtio
n
Distance
Figure 20b

020
040
060
080
010
0012
0014
0016
0018
0020
0022
0024
0026
0028
0030
0032
0034
0036
0038
0040
0042
0044
0046
0048
00
1.35
1.40
1.45
1.50
1.55
1.60
1.65
1.70
1.75
1.80
1.85
Pro
du
ctio
n b
-val
ue
Trial
Figure 21

020
040
060
080
010
0012
0014
0016
0018
0020
0022
0024
0026
0028
0030
0032
0034
0036
0038
0040
0042
0044
0046
0048
00
1.2
1.25
1.3
1.35
1.4
1.45
1.5
1.55
1.6
1.65
Pro
du
ctio
n b
-val
ue
Trial
Figure 22

1 2 3 4 5 6 7 8 9 10 11 12400
600
800
1000
1200
1400
1600
1800
2000
2200
2400
Res
po
nse
Tim
e (m
s)
Target Position
6
9
12
6
9
12
Figure 23a

1 2 3 4 5 6 7 8 9 10 11 120
1
2
3
4
5
6
Nu
mb
er o
f F
ixat
ion
s
Target Position
6
9
12
6
9
12
Figure 23b

-11
-10 -9 -8 -7 -6 -5 -4 -3 -2 -1 1 2 3 4 5 6 7 8 9
10 11
0.00
0.05
0.10
0.15
0.20
0.25
0.30
Pro
po
rtio
n
Distance
Figure 24a
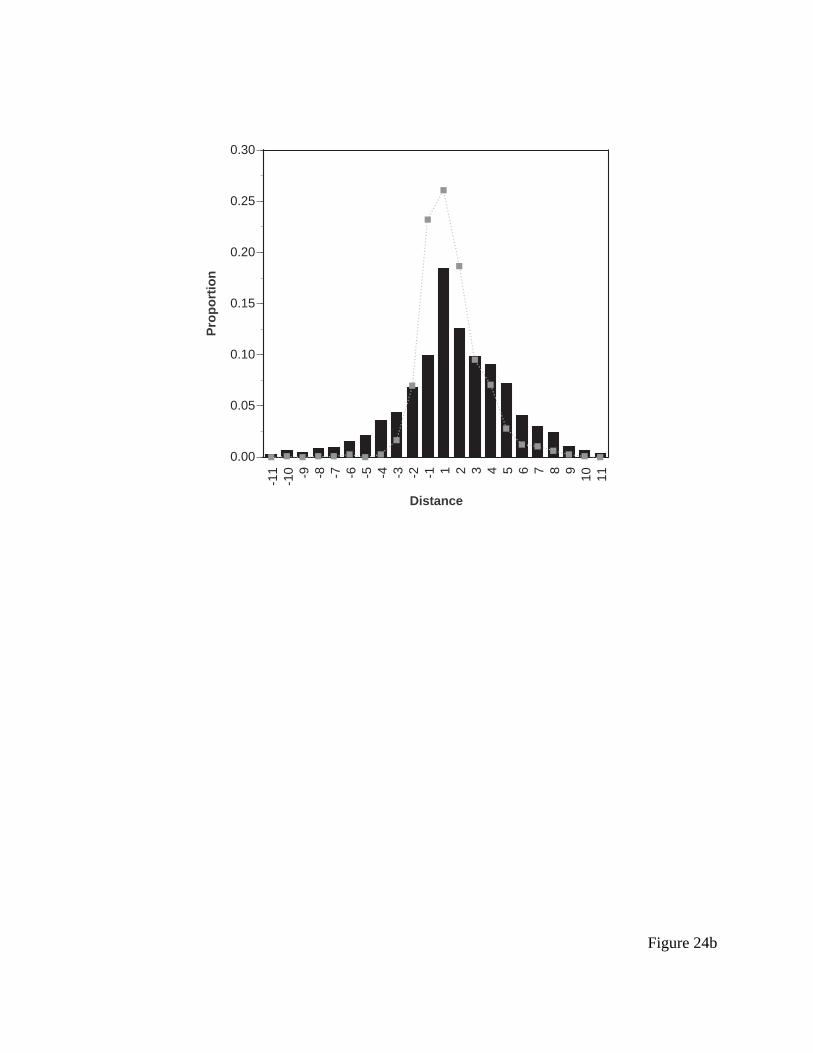
-11
-10 -9 -8 -7 -6 -5 -4 -3 -2 -1 1 2 3 4 5 6 7 8 9
10 11
0.00
0.05
0.10
0.15
0.20
0.25
0.30
Pro
po
rtio
n
Distance
Figure 24b