applus results h1 2017v11
TRANSCRIPT

Disclaimer
This document may contain statements that constitute forward looking statements about Applus Services, SA (“Applus+” or “the Company”). These statements are based on financial projections and estimates and their underlying assumptions, statements regarding plans, objectives and expectations, which refer to estimates regarding, among others, future growth in the different business lines and the global business, market share, financial results and other aspects of the activity and situation relating to the Company.
Such forward looking statements, by its nature, are not guarantees of future performance and involve risks and uncertainties, and other important factors that could cause actual developments or results to differ from those expressed or implied in these forward looking statements. These risks and uncertainties include those discussed or identified in fuller disclosure documents filed by Applus+ with the relevant Securities Markets Regulators, and in particular, with the Spanish Market Regulator, the Comisión Nacional del Mercado de Valores.
Applus+ does not undertake to publicly update or revise these forward-looking statements even if experience or future changes make it clear that the projected performance, conditions or events expressed or implied therein will not be realized.
This document contains summarised information or information that has not been audited. In this sense this information is subject to, and must be read in conjunction with other publicly available information including if necessary any fuller disclosure document published by Applus+. Nothing in this presentation should be construed as a profit forecast.

Applus+ Group Results Presentation H1 2017
25th July 2017

Agenda
4
1 HIGHLIGHTS2 FINANCIAL REVIEW
3 BUSINESS REVIEW
4 OUTLOOK 2017
Fernando BasabeChief Executive Officer

5
Highlights
• Q2 organic1 revenue flat, after 9 quarters of decline
• Energy & Industry margin up 30 bps following successful integration
• Auto stable revenue with a new consolidated Uruguay contract on attractive terms and a new contract in Ecuador
• IDIADA and Labs delivered strong revenue growth
• H1 2017 financial performance:
• Revenue of €789.3 million down organic1 0.6% (reported +0.7%)
• Operating profit2 of €71.0 million flat organic1 (reported +0.6%)
• Operating profit2 margin of 9.0%, flat to previous year
• Operating cash flow2 of €43 million, down €3.7 million
• Earnings per share2 of €0.31, down 2.9%
• Net debt/EBITDA ratio stable at 3.2x
(1) Organic is at constant exchange rates
(2) Operating profit, margin, cash flow and earnings per share are all adjusted for other results and amortisation
of acquisition intangibles

Agenda
6
1 HIGHLIGHTS
2 FINANCIAL REVIEW3 BUSINESS REVIEW
4 OUTLOOK 2017
Joan AmigóChief Financial Officer

H1 2017. Revenue Growth Bridge
7
• Organic revenue trend continues to improve
EUR Million
+0.7%

H1 2017. Adjusted Operating Profit Growth Bridge
8• Stable margin in Q1 and Q2
EUR Million
+0.6%

2017 2016 Change
Revenue 789.3 783.7 0.7%
Adj. Operating Profit 71.0 70.6 0.6%
Adj.Op.Profit margin 9.0% 9.0% -1 bps
PPA Amortisation (23.8) (23.8)
Other results (5.6) (5.5)
Operating profit 41.6 41.2 0.9%
Finance result (12.3) (11.4)
Associates 0.5 0.9
Profit before tax 29.8 30.7 (3.1)%
Income taxes (8.7) (8.8)
Net Profit 21.1 22.0 (3.9)%
Minorities (4.8) (4.4)
Net Profit Group 16.3 17.6 (7.2)%
Adjusted Net Profit Group 40.2 41.4 (2.9)%
EPS in € 0.13 0.14 (7.2)%
Adjusted EPS in € 0.31 0.32 (2.9)%
H1
H1 2017. Summary Income Statement
9
EUR Million
(1) Adjusted Op. Profit, Net Profit and EPS are stated before amortisation of acquisition intangibles, Historical Management Incentive Plan,
restructuring, impairment and transaction & integration costs
(1)
(1)
(1)
2017 2016 Change
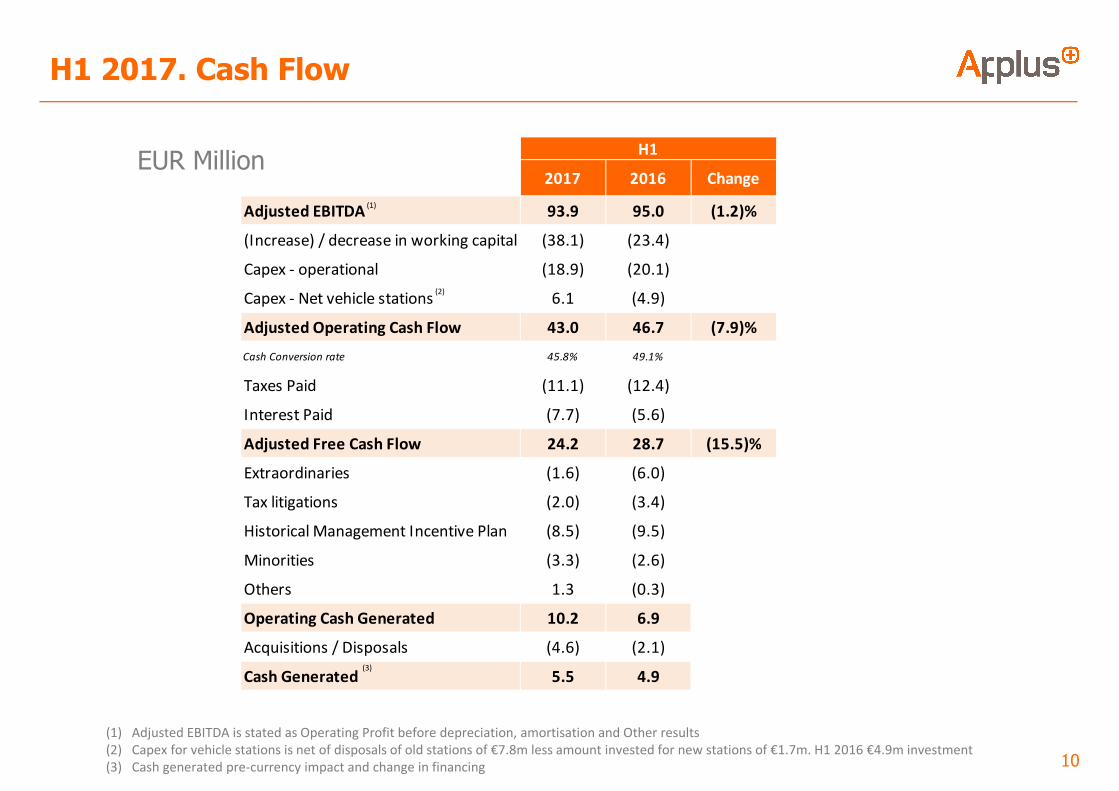
Adjusted EBITDA 93.9 95.0 (1.2)%
(Increase) / decrease in working capital (38.1) (23.4)
Capex - operational (18.9) (20.1)
Capex - Net vehicle stations 6.1 (4.9)
Adjusted Operating Cash Flow 43.0 46.7 (7.9)%
Cash Conversion rate 45.8% 49.1%
Taxes Paid (11.1) (12.4)
Interest Paid (7.7) (5.6)
Adjusted Free Cash Flow 24.2 28.7 (15.5)%
Extraordinaries (1.6) (6.0)
Tax litigations (2.0) (3.4)
Historical Management Incentive Plan (8.5) (9.5)
Minorities (3.3) (2.6)
Others 1.3 (0.3)
Operating Cash Generated 10.2 6.9
Acquisitions / Disposals (4.6) (2.1)
Cash Generated 5.5 4.9
H1
H1 2017. Cash Flow
10
EUR Million
(1) Adjusted EBITDA is stated as Operating Profit before depreciation, amortisation and Other results
(2) Capex for vehicle stations is net of disposals of old stations of €7.8m less amount invested for new stations of €1.7m. H1 2016 €4.9m investment
(3) Cash generated pre-currency impact and change in financing
(1)
(3)
(2)
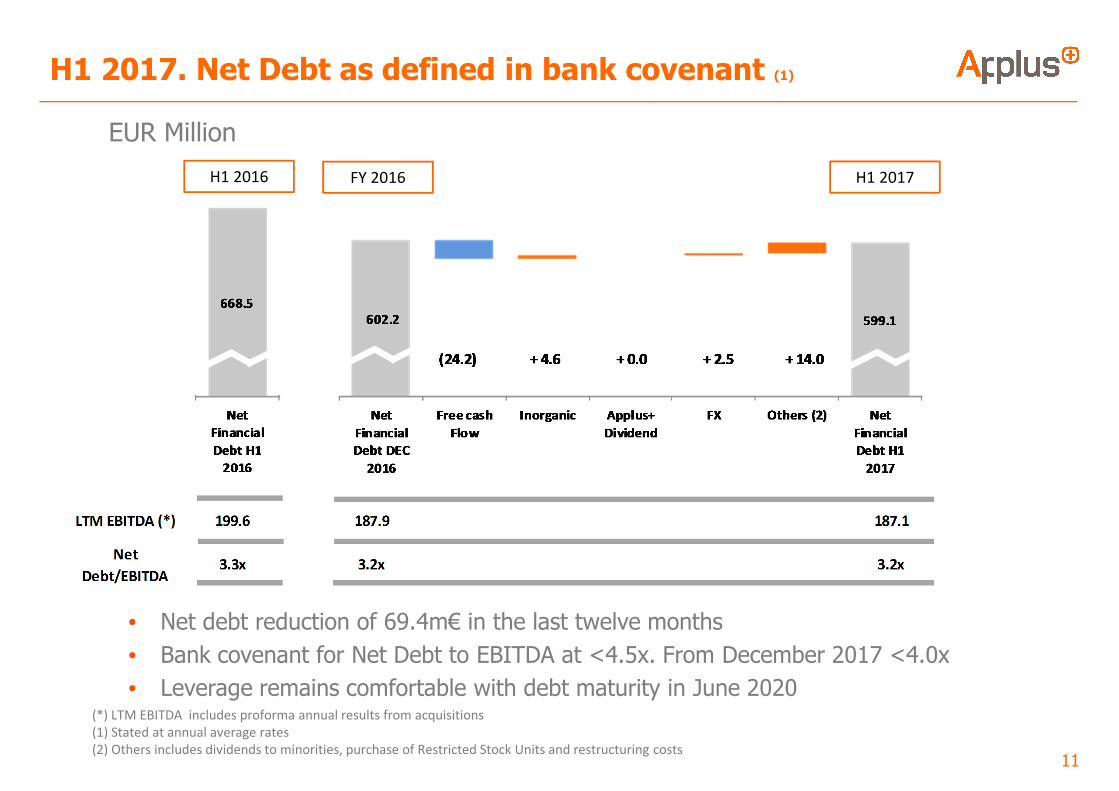
H1 2017. Net Debt as defined in bank covenant (1)
11
EUR Million
• Net debt reduction of 69.4m€ in the last twelve months
• Bank covenant for Net Debt to EBITDA at <4.5x. From December 2017 <4.0x
• Leverage remains comfortable with debt maturity in June 2020(*) LTM EBITDA includes proforma annual results from acquisitions
(1) Stated at annual average rates
(2) Others includes dividends to minorities, purchase of Restricted Stock Units and restructuring costs
H1 2016 FY 2016 H1 2017

46% 45%
26% 25%
4% 5%
24% 25%
H1 2017 H1 2016
OTHER
GBP
USD
EUR
H1 2017. Currency Exposure
12
% Revenue by Actual Currency
(1)
(1) Includes currencies pegged to USD
(2) None above 4%
(2)
No significant changes in currency mix
JAN - JUN
2017
JAN - JUN
2016Change
USD 1.081 1.116 3.3%
GBP 0.859 0.777 (9.5)%
Average FX Exchange rates vs Euro

Agenda
13
1 HIGHLIGHTS
2 FINANCIAL REVIEW
3 BUSINESS REVIEW4 OUTLOOK 2017
Fernando BasabeChief Executive Officer

Oil & Gas 38%
Statutory
Vehicle
Inspection 19%
Automotive
OEM 12%
Power 10%
Construction
4%
Aerospace 3%
Others 14%
Energy &
Industry
65%
Laboratories
4%
Auto 19%
IDIADA 12%Spain 20%
Rest of
Europe 28%
North
America 20%
LatAm 9%
Asia Pacific
11%
Middle East
& Africa 12%
H1 2017. Revenue Distribution
14
By Division
By Geography
By End Market
(40%)*
(19%)*
(11%)*
(8%)*
(5%)*
* H1 2016
(15%)*
(66%)*
(4%)*
(19%)*
(11%)*
(29%)*
(19%)*
(9%)*
(12%)*
(12%)*(19%)*
(2%)*

Energy & Industry Division
15
65%
Revenue
Energy & Industry Division employs
Key figures
60in
countries
12,500 people
41%Adj.Op.
Profit

Energy & Industry Division (I)
16
H1 2017 Revenue (€m)
(1.4)%
H1 2017 Adj. Op. Profit (€m)
+3.0%
• Rate of decline improvement comes from Oil & Gas in North America although overallmarket continues to be challenging with price pressure and no capex recovery
• Other end markets including Construction, Power, Telecom and Aerospace continued togrow
• Margin improvement of 30bps due to integration synergies and cost control

Energy & Industry Division (II)
17
• North America (26% of division revenue): After two years of strong revenue decrease,stabilised in H1 with outlook improving for Oil & Gas Capex and Opex. Aerospace performingwell
• LatAm (9%): Region negatively impacted by weaker market conditions mainly in Chile withslow down in infrastructure market and the end of new construction pipeline projects inMexico
• Northern Europe (19%): Overall stable with Opex work andinternational new construction projects managed out of theregion doing well. North Sea Oil & Gas activity under strongvolume and price pressure
• Southern Europe, Africa, Middle East, Asia & Pacific (46%):
• Growth in Middle East and Spain offset the decline inAfrica and Asia Pacific
• Shell contract in Australia expected to start inSeptember

Laboratories Division
18
4%
Revenue
4%
Adj.Op.
Profit
Key figures
Laboratories Division employs
800 people
12in
countries

Laboratories Division
19
H1 2017 Revenue (€m)
+8.8%
H1 2017 Adj. Op. Profit (€m)
+27.7%
• Continues to have strong growth and margin in the double digits
• All business lines performing well with Industry and Construction leading the growth
• Industry - Aerospace and Auto (electrical and emc1) continue being the key endmarkets
• Construction - Spanish market strengthening for domestic and export
• The electrical and electronics testing laboratory acquired in Italy performing on plan
(1) Electromagnetic compatibility

Automotive Division
20
Key figures
Automotive Division employs approximately
3,500 people
8in
countries
19%Revenue
40%
Adj.Op.
Profit

Automotive Division (I)
21
H1 2017 Revenue (€m)
+0.8%
H1 2017 Adj. Op. Profit (€m)
(5.6)%
• Overall, revenue stable with lower inspections in Ireland offsetting growthelsewhere
• Margin down mainly due to the ramp up in the Illinois and Chile renewals andnew contract in Buenos Aires city

Automotive Division (II)
22
• Good growth in Spain mainly due to Canary Islands and Madrid. Other regions alsoperforming well
• Ireland negatively impacted by the rejuvenation of the vehicle fleet
• Nordic region stable
• Good revenue performance in US helped by the newtaxi programme in New York
• Double digit growth in LatAm due to the ramp up inBuenos Aires city compensating a decrease in Chile
• New Uruguay region programme awarded.Consolidated estimated revenue €60m over 8 yearswith 4 year possible extension. Operation estimated tostart in H2 2018
• Won 10 years programme in Ecuador with anestimated total revenue of 11m€ expected to start in2018

IDIADA Division
23
12%
Revenue
15%
Adj.Op.
Profit

IDIADA Division
24
H1 2017 Revenue (€m)
+10.8%
H1 2017 Adj. Op. Profit (€m)
• Strong revenue and profit growth
• Homologation, Body and Passive Safety and the Proving Ground grew at doubledigit rates as well as our operations in Germany, Czech, India and Brazil
• A new passive safety lab in Catalonia entered operations. This allows us tocontinue performing component homologation testing and increase our capacitywith vehicle crash tests
• Investing and well positioned in Advanced Driver Assistance Systems,Autonomous and Electric vehicles with good wins already achieved
+7.9%

Agenda
25
1 HIGHLIGHTS
2 FINANCIAL REVIEW
3 BUSINESS REVIEW
4 OUTLOOK 2017

26
Outlook
• No change to the guidance for 2017:
• Oil & Gas to remain challenging, butimprovement expected to continue
• Rest of the businesses to continue toperform well
• Overall organic revenue and profitmargin to be approximately flat


H1 2017. Adjustments to Statutory results
28
EUR Million Adj. ResultsOther
results
Statutory
resultsAdj. Results
Other
results
Statutory
results
Revenue 789.3 789.3 783.7 - 783.7 0.7%
Ebitda 93.9 (3.7) 90.2 95.0 (5.5) 89.5 (1.2)%
Operating Profit 71.0 (29.4) 41.6 70.6 (29.3) 41.2 0.6%
Net financial expenses (12.3) (12.3) (11.4) 0.0 (11.4)
Share of profit of associates 0.5 0.5 0.9 0.0 0.9
Profit Before Taxes 59.2 (29.4) 29.8 60.1 (29.3) 30.7 (1.5)%
Income tax (14.2) 5.5 (8.7) (14.3) 5.5 (8.8)
Non controlling interests (4.8) (4.8) (4.4) 0.0 (4.4)
Net Profit 40.2 (23.9) 16.3 41.4 (23.8) 17.6 (2.9)%
Number of Shares 130,016,755 130,016,755 130,016,755 130,016,755
EPS, in Euros 0.31 0.13 0.32 0.14 (2.9)%
Income Tax/PBT (24.0)% (29.2)% (23.8)% (28.6)%
H1 2017 H1 2016
+/- % Adj.
Results

H1 2017. Revenue & Adj. Op. Profit by Division
29
EUR Million
Organic Inorganic FX Total
Energy & Industry 509.7 (3.2)% 0.0% 1.8% (1.4)% 517.1
Laboratories 31.0 6.9% 1.6% 0.3% 8.8% 28.5
Auto 152.9 0.7% 0.0% 0.1% 0.8% 151.7
Idiada 95.5 10.6% 0.0% 0.2% 10.8% 86.3
Holding 0.0 0.1
Total Revenue 789.3 (0.6)% 0.1% 1.2% 0.7% 783.7
Actual 2017Growth
Revenue Actual 2016
Organic Inorganic FX Total
Energy & Industry 34.7 1.7% 0.0% 1.3% 3.0% 33.7
Laboratories 3.4 22.8% 5.3% (0.4)% 27.7% 2.7
Auto 33.3 (5.3)% (0.3)% (5.6)% 35.3
Idiada 12.4 8.1% (0.2)% 7.9% 11.5
Holding (12.9) 1.9% 0.0% 1.9% (12.6)
Total Adj. OP. Profit 71.0 0.0% 0.2% 0.4% 0.6% 70.6
Adj. Op. Profit Actual 2017 Growth Actual 2016

Q1 & Q2 2017. Revenue by Division & Adj. Op. Profit
30
Q1
Q2
EUR Million
Organic Inorganic FX Total
Energy & Industry 239.5 (4.2)% 0.0% 2.5% (1.7)% 243.7
Laboratories 14.6 7.8% 0.4% 8.2% 13.5
Auto 76.9 1.8% 0.3% 2.1% 75.3
Idiada 46.5 5.9% 0.2% 6.1% 43.8
Holding 0.0 n/a n/a n/a 0.0
Total Revenue 377.5 (1.4)% 0.0% 1.7% 0.3% 376.3
Adj. Op. Profit 25.9 0.7% 0.0% (0.3)% 0.4% 25.8
GrowthActual 2016Revenue Actual 2017
Organic Inorganic FX Total
Energy & Industry 270.3 (2.2)% 0.0% 1.0% (1.2)% 273.4
Laboratories 16.4 6.1% 3.0% 0.2% 9.3% 15.0
Auto 76.0 (0.5)% 0.1% (0.4)% 76.4
Idiada 49.1 15.4% 0.1% 15.5% 42.5
Holding 0.0 n/a n/a n/a 0.1
Total Revenue 411.8 0.2% 0.1% 0.7% 1.0% 407.3
Adj. Op. Profit 45.1 (0.3)% 0.3% 0.8% 0.8% 44.8
RevenueGrowth
Actual 2016Actual 2017

Q1 & Q2 2017. Summary Income Statement
31
EUR Million
2017 2016 Change 2017 2016 Change
Revenue 377.5 376.3 0.3% 411.8 407.3 1.0%
Adj. Operating Profit 25.9 25.8 0.4% 45.1 44.8 0.9%
Adj.Op.Profit margin 6.9% 6.9% + 1 bps 11.0% 11.0% -3 bps
PPA Amortisation (11.9) (11.9) (11.9) (11.9)
Other results (2.5) (2.8) (3.1) (2.8)
Operating profit 11.5 11.1 3.1% 30.1 30.1 0.1%
Finance result (6.3) (5.9) (6.0) (5.5)
Associates 0.3 0.4 0.2 0.5
Profit before tax 5.4 5.6 (3.1)% 24.3 25.1 (3.1)%
Q1 Q2

H1 2017. Other results
32
EUR Million
2017 2016
Other results (5.6) (5.5)
Severances (1.5) (0.0)
Transaction costs (0.1) (0.1)
Other gains & losses (0.2) 0.0
Historical Management Incentive Plan (3.7) (5.5)
H1

H1 2017. Net Financial Expenses
33
EUR Million
Financial Expenses H1 2017 H1 2016
Interest on Term Loan (7.5) (7.2)
Amortisation (1.0) (1.0)
Foreign exchange (2.3) (2.0)
Other (1.5) (1.1)
Total (12.3) (11.4)

H1 2016 FY 2016 H1 2017
Term Loan 747.1 745.1 702.2
RCF - - -
Other Financial Debt 43.0 40.1 36.0
Total Gross Debt 790.1 785.2 738.2
Net cash (121.6) (183.0) (139.1)
Total Net debt 668.5 602.2 599.1
LTM EBITDA 199.6 187.9 187.1
Net Debt to EBITDA 3.3 x 3.2 x 3.2 x
H1 2017. Net Financial Debt
34
EUR Million

H1 2017. Statutory Cash Flow reconciliation
35
EUR Million
CF
Statement
Restructuring
& Extraord.
Impacts
Historical
Mgmnt
Incentive Plan
Others
Add Back
capex &
interests
Non cash
itemsStatutory CF Staturory CF equivalent epigraph
Adjusted EBITDA 93.9 (2.4) (3.7) 1.3 (59.3) 29.8 Profit Before taxes
59.3 59.3 Non cash items
Working Capital variation (38.1) 0.7 (0.4) - (37.7) (Increase)/Decrease in working capital
Capex (12.8) 12.8 -
Adjusted Operating Cash Flow 43.0 (1.6) (4.1) 1.3 12.8 -
Cash Conversion rate 45.8%
Taxes Paid (11.1) (2.0) (13.1) Taxes Paid
Interest Paid (7.7) 7.7 -
Adjusted Free Cash Flow 24.2 (1.6) (4.1) (0.7) 20.5 - 38.3 Operating Cash Flow
(12.8) (12.8) Capex
(7.7) (7.7) Interest paid
Extraordinaries (1.6) 1.6 - 0.0
Tax litigations (2.0) 2.0 -
Historical Mgmnt. Incentive Plan (8.5) 8.5 -
Minorities (3.3) (3.3) Minorities
Others 1.3 (1.3) 0.0
Operating Cash Generated 10.2 - 4.4 - - -
Acquisitions / Disposals (4.6) - (4.6) Acquisitions/Disposals of subsidiaries
Cash Generated 5.5 - 4.4 - - -
Changes in financing (50.3) (4.4) (54.7) Changes in financing
Curency translations (7.0) (7.0) Currency translations
Cash increase (decrease) (51.7) - - - - - (51.7) Cash Increase / (Decrease)

H1 2017. Balance Sheet
36
EUR Million
H1 2017 FY 2016 H1 2017 FY 2016
Equity 656.3 657.6
Goodwill 533.7 535.5 Long Term Provisions 14.8 16.9
Other intangible assets 506.4 533.6 Bank borrowings 692.0 757.9
PPA 460.3 486.2 Other financial liabilities 23.2 23.5
Other intangible assets 46.1 47.4 Deferred Tax Liabilities PPA 110.8 116.9
Tangible assets 200.4 217.0 Deferred Tax Liabilities Others 46.6 47.9
Non current Financial Assets 10.7 12.6 Deferred Tax Liabilities 157.4 164.8
Deferred Tax Assets 84.0 87.2 Other non current liabilities 7.0 7.0
Total Non-Current Assets 1,335.2 1,385.9 Total Non-Current Liabilities 894.4 970.1
Inventories 11.3 8.1 Short term provisions 1.2 1.3
Trade & Other receivables 392.1 393.4 Bank borrowings 24.8 27.1
Corporate Income Tax assets 12.2 15.9 Trade & Other payables 300.5 318.6
Current financial assets 7.3 4.6 Income Tax Liabilities 8.9 12.1
Cash & Cash equivalents 136.5 188.2 Other current liabilities 8.5 9.3
Total Current Assets 559.4 610.2 Total Current Liabilities 343.9 368.4
Total Assets 1,894.6 1,996.1 Total Equity & Liabilities 1,894.6 1,996.1