applied psychological measurement …math.ntnu.edu.tw/~rtsai/106/irt/ref/mirt_comparison.pdfkyung...
TRANSCRIPT
Article
Applied Psychological Measurement2014, Vol. 38(6) 486–498
� The Author(s) 2014Reprints and permissions:
sagepub.com/journalsPermissions.navDOI: 10.1177/0146621614536770
apm.sagepub.com
A Review of CommercialSoftware Packages forMultidimensional IRTModeling
Kyung (Chris) T. Han1 and Insu Paek2
Abstract
In this study, the authors evaluate several commercially available multidimensional item responsetheory (MIRT) software packages, including IRTPRO 2.1, Mplus 7.1, FlexMIRT, and EQSIRT, aswell as their built-in estimation algorithms, and compare them for their performance in MIRTmodel estimation. The study examines the performance of model parameter recovery via aseries of simulations based on four approaches for latent structuring—within-item MIRT,between-item MIRT, a mixture of within- and between-item MIRT and a bifactor model. Thesimulation studies focused on realistic conditions and models that researchers and practitionersare likely to encounter in practice. The results showed that the studied software packagesrecovered the item parameters reasonably well but differed greatly in terms of the types of dataand models they could handle and also the run time required for estimation completion.
Keywords
MIRT, computer program, simulation
The emergence of item response theory (IRT), originally introduced in the 1960s and based
mainly on a unidimensional latent structure (Lord & Novick, 1968), completely changed the
paradigm of psychological and educational measurement. It made many things possible, com-
puterized adaptive testing, for example, that were not as effective (if not nearly impossible)
using classical test theory. One of the main reasons for IRT’s rapid gain in popularity in the
field was the availability of computer software tools for estimating various IRT models. This
development enabled and invited a wide range of IRT research and applications.
With the introduction of early unidimensional IRT models to the field, models generalized
for multidimensional latent structures soon followed. The concept of multidimensional item
response theory (MIRT), the mathematical equivalent to existing factor analysis approaches,
1Graduate Management Admission Council, Reston, VA, USA2Florida State University, Tallahassee, FL, USA
Corresponding Author:
Kyung (Chris) T. Han, Graduate Management Admission Council, 11921 Freedom Dr., Suite 300, Reston, VA 20190,
USA.
Email: [email protected]
at NATIONAL TAIWAN NORMAL UNIV LIB on December 7, 2016apm.sagepub.comDownloaded from at NATIONAL TAIWAN NORMAL UNIV LIB on December 7, 2016apm.sagepub.comDownloaded from at NATIONAL TAIWAN NORMAL UNIV LIB on December 7, 2016apm.sagepub.comDownloaded from
had circulated in the field for decades but had yet to reach critical mass in terms of the number
of related research studies and applications. This was largely due to unavailability of computer
software tools for MIRT modeling and insufficient PC computing power. Typical response data
in psychological or educational measurement are of a discrete scale that requires mathematical
integration processes causing heavy computational loads, especially when dealing with three or
more dimensions. The last 5 years, however, have witnessed great progress in the development
of both computer hardware and software. It is now common for PCs to sport multiple CPU
cores, and equally common for these newer systems to implement multiple parallel threads with
a virtualization technique for computation-heavy tasks. Most important is the development of
several new software tools for MIRT modeling designed to take advantage of the latest PCs that
are now readily available to the public. Because these MIRT software tools differ significantly
in terms of their performance and user experience, researchers and practitioners could benefit
from a comprehensive comparison of these tools to make more informed decisions in choosing
the right MIRT software tool for their specific needs.
This study presents an evaluation and comparison of the most recent commercially available
MIRT software packages and their estimation algorithms. These packages include IRTPRO 2.1
(Cai, Thissen, & du Toit, 2011), Mplus 7.1 (Muthen & Muthen, 1998-2012), flexMIRT 2 (Cai,
2013), and EQSIRT (Wu & Bentler, 2013).
Features, Capabilities, and Algorithms
Mplus 7.1
Mplus supports a variety of statistical analysis methods including regression and path analysis,
exploratory factor analysis (EFA), confirmatory factor analysis (CFA), structural equation mod-
eling (SEM), and mixture modeling. It also supports multigroup and multilevel data. Mplus
handles IRT and MIRT models as a special case of CFA and can estimate threshold and slope
parameters but not lower asymptote (i.e., pseudo-guessing parameter). In other words, it does
not support three-parameter logistic (3PL) IRT/MIRT models. Mplus can handle both dichoto-
mous and/or polytomous items and also supports mixture and/or multilevel IRT analyses.
For MIRT modeling, Mplus offers great flexibility in specifying latent structures and con-
straints. Users are allowed to impose constrains on a covariance matrix for latent variables and
on item parameters. Mplus can handle data with missing responses. Mplus can handle a maxi-
mum of 500 variables (i.e., items), which might be too small for some large-scale tests with
large item banks.
For MIRT estimation, available estimators includes the weighted least square means and var-
iance adjusted (WLSMV), the maximum likelihood (ML), and Bayes. For the ML estimator,
which is the most widely used, Mplus features several different sets of algorithms including
Fisher scoring, Newton–Raphson, quasi-Newton, and Expectation–Maximization (EM). By
default, Mplus automatically selects and implements different algorithms for ML during the
iterations. Users can choose one of three options for numerical integration: (a) rectangular inte-
gration, (b) Gauss–Hermite integration, and (c) Monte Carlo (MC) integration. The developers
recommend use of rectangular integration whenever possible, but Monte Carlo integration is
sometimes the only feasible option when the estimation involves more than three dimensions
due to what is known as the ‘‘curse of dimensionality.’’ For estimating person score (i.e., factor
score), it uses the expected a posteriori (EAP) estimation method. Monte Carlo simulations and
multiple imputations can be done within the software. Mplus supports multithreading for the
ML estimator, and it can reduce the time required to complete estimation by a large factor when
the computer has multiple CPU cores available.
Han and Paek 487
at NATIONAL TAIWAN NORMAL UNIV LIB on December 7, 2016apm.sagepub.comDownloaded from
IRTPRO 2.1
IRTPRO 2.1, although still offering some features for EFA, mainly focuses on IRT/MIRT mod-
eling. IRTPRO is based on a highly generalized IRT model that embraces multiple groups, mul-
tiple response categories, and multiple dimensions. As a result, it can cover a range of models,
from a unidimensional 3PL model with a pseudo-guessing parameter to multidimensional IRT
models for multiple groups with polytomous responses based on the graded response model
(GRM), the generalized partial credit model (GPCM), or the nominal response model (NRM).
Users can impose constraints or prior values on any of the item parameters with IRTPRO,
and the software can handle data with missing responses. There is no maximum limit on the
number of items that IRTPRO can handle; however, it is essentially limited by the system’s
usable memory and by IRTPRO’s maximum manageable memory with a 32-bit architecture
(theoretically up to 4 GB).
For item parameter estimation, IRTPRO offers three different methods: the Bock–Aitkin
approach with the expectation–maximization algorithm (BAEM; Bock & Aitkin, 1981), the
adaptive quadrature approach (ADQ; Schilling & Bock, 2005) with three different options for
numerical integrations (Gauss–Hermite, Monte Carlo, and Latin Hypercube), and the
Metropolis–Hastings Robbins–Monro Method (MHRM; Cai, 2010a, 2010b). MHRM is an
optimization method that produces marginal maximum likelihood (MML) and modal Bayes
solutions for item factor models and multilevel item factor model. It eschews numerical inte-
gration and combines elements of the Makov chain Monte Carlo (MCMC) using the
Metropolis–Hasting method with stochastic approximation (the Robbins–Monro method) to
achieve a pointwise convergent algorithm. It produces standard errors as a by-product.
Generally, the only tuning parameter for the MHRM algorithm is the proposal dispersion
constant for the MH sampler. For score estimation, IRTPRO supports three types of estima-
tion methods: EAP, summed score expected a posteriori (SSEAP), and the maximum a pos-
teriori (MAP) method and also provides differential item functioning (DIF) analysis tools.
IRTPRO supports the multithreading, boosting its computation speed on computers that have
multiple CPU cores.
flexMIRT 2.0
flexMIRT supports the same unidimensional and multidimensional IRT models that IRTPRO
does and also is capable of handling multilevel structures; the latest version (2.0) also supports
the extended cognitive diagnostic models (CDM). There are two different editions of flexMIRT
that work with different Windows systems—one based on a 32-bit architecture and another
based on a 64-bit architecture. For the 64-bit version, there is practically no maximum limit in
the size of computer memory that flexMIRT can use (Windows 8 Pro supports up to 512 GB
RAM).
For item calibration, users can choose either BAEM or MHRM methods, and, for score esti-
mation, they have the option of using ML, EAP, SSEAP, Weighted SSEAP, or MAP. flexMIRT
also can estimate the item parameters and theta distribution simultaneously by using empirical
histogram (currently only for single level bifactor or testlet response models). Tools for DIF
analyses, multiple imputation, and simulations are also available within flexMIRT. A unique
feature of flexMIRT is the ‘‘fixed effects calibration,’’ in which item parameters can be esti-
mated given fixed values for individual thetas. This feature can be very useful for practitioners
who need to calibrate pretest items using a priori calibrated individual theta values. flexMIRT
also supports multithreading operations with two possible options for efficiency tuning depend-
ing on the number of dimensions and the number of items.
488 Applied Psychological Measurement 38(6)
at NATIONAL TAIWAN NORMAL UNIV LIB on December 7, 2016apm.sagepub.comDownloaded from
EQSIRT 1.0
EQSIRT supports various unidimensional and multidimensional IRT models with both dichoto-
mous and polytomous response types as well as latent class analysis (LCA) and Mokken scale
analysis (MSA). EQSIRT offers three estimation algorithms for item calibration: (a) the MML
method, (b) the Monte Carlo Expectation–Maximization (MCEM) method, and (c) the MCMC
method. Not all estimation methods work with all IRT models, however. For example, MCEM
and MCMC do not work for estimating the 3PL model in EQSIRT. For theta estimation, the
software offers ML, EAP, and MAP methods.
EQSIRT offers a wide variety of tools for IRT-related research including DIF analysis, test
score equating, and simulation. EQSIRT cannot handle a response matrix with missing data,
and does not support multithreading computing. EQSIRT can handle a maximum number of
200 items for MIRT calibration.
Performance
A series of simulation studies were conducted to evaluate and compare the performance of
MIRT parameter recovery across the studied software packages.
Simulations
Response matrix data with 30 dichotomous items loading on three or four factors (i.e., latent
variables) were simulated based on the multidimensional compensatory 2PL IRT model under
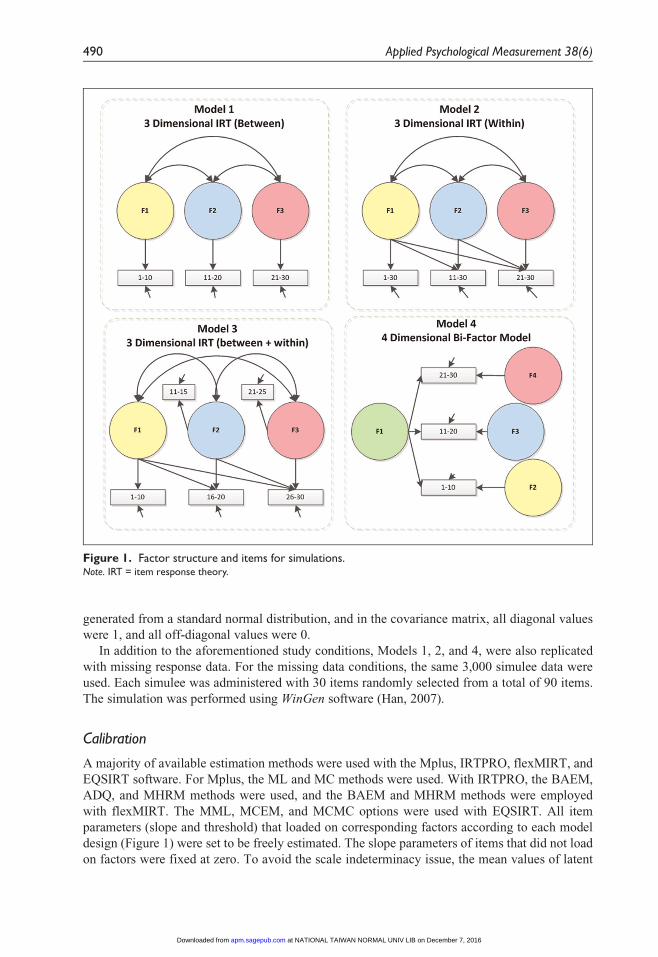
four different latent structures. The diagrams of the four models are represented in Figure 1.
Model 1 was a so-called ‘between-item’ structure, in which each item loaded on a single fac-
tor. There were three factors, and each factor was exclusively associated with 10 items. The
true item parameter values were borrowed from a real, existing item bank for a testing program
in higher education. The mean and the standard deviation (SD) of the true slope parameter val-
ues of the 30 items were 1.22 and 0.48, respectively. To prevent potential scaling issues, all true
threshold parameter values were rescaled to follow a standard normal distribution.
Model 2 was a so-called ‘within-item’ structure in this study, where some items loaded on
more than a single factor. In Model 2, the first 10 items loaded only on the first factor, F1, and
Items 11 to 20 loaded on both F1 and F2. The final 10 items (Items 21-30) loaded on all three
factors (F1, F2, and F3). The mean and the SD of the true a-parameter values across factors were
0.88 and 0.47, respectively, and the true b-parameter values were the same as those seen with
Model 1.
Model 3 was a mixture of ‘‘between’’ and ‘‘within’’ structures. Items 1 to 10 loaded only on
F1, Items 11 to 15 only on F2, and Items 21 to 25 only on F3. The remaining items loaded on
multiple factors.
Model 4 was a bifactor model in which there was one primary factor (F1) on which all 30
items loaded. Each item also loaded on one of three nuisance factors (F2, F3, and F4).
Under the four studied models, the response data for 3,000 simulees were generated. For
Models 1, 2, and 3, the true theta values with three dimensions were borrowed from real score
data derived from a higher education testing program with three different subjects. The true
theta values of each dimension were rescaled to follow a standard normal distribution, and as a
result, the true covariance matrix values were identical to the correlation matrix values. The
covariance values were 0.19 for F1 and F2, 0.46 for F1 and F3, and 0.35 for F2 and F3. For
Model 4, the true theta values for four factors (one main + three nuisances) were randomly
Han and Paek 489
at NATIONAL TAIWAN NORMAL UNIV LIB on December 7, 2016apm.sagepub.comDownloaded from
generated from a standard normal distribution, and in the covariance matrix, all diagonal values
were 1, and all off-diagonal values were 0.
In addition to the aforementioned study conditions, Models 1, 2, and 4, were also replicated
with missing response data. For the missing data conditions, the same 3,000 simulee data were
used. Each simulee was administered with 30 items randomly selected from a total of 90 items.
The simulation was performed using WinGen software (Han, 2007).
Calibration
A majority of available estimation methods were used with the Mplus, IRTPRO, flexMIRT, and
EQSIRT software. For Mplus, the ML and MC methods were used. With IRTPRO, the BAEM,
ADQ, and MHRM methods were used, and the BAEM and MHRM methods were employed
with flexMIRT. The MML, MCEM, and MCMC options were used with EQSIRT. All item
parameters (slope and threshold) that loaded on corresponding factors according to each model
design (Figure 1) were set to be freely estimated. The slope parameters of items that did not load
on factors were fixed at zero. To avoid the scale indeterminacy issue, the mean values of latent
Figure 1. Factor structure and items for simulations.Note. IRT = item response theory.
490 Applied Psychological Measurement 38(6)
at NATIONAL TAIWAN NORMAL UNIV LIB on December 7, 2016apm.sagepub.comDownloaded from
trait distributions were set to 0, and the variance values of the latent trait distributions were fixed
at 1. For Models 1, 2, and 3, all off-diagonal values of the covariance matrix for the latent traits
were set to be freely estimated. For Model 2, the calibration was done twice under an additional
condition where all off-diagonal values of the covariance matrix were fixed to the true values
(called it Model 2B). For Model 4, all off-diagonal values of the covariance matrix were fixed
to zero during calibration, and for IRTPRO and flexMIRT, the commands for bifactor modeling
were used, where dimension reduction techniques were employed.
The calibration performance of the studied software programs was evaluated based on
Pearson correlation coefficients between the true values and estimates, estimation bias, and
mean absolute error (MAE) statistics. For models where the covariance matrix was freely esti-
mated, the difference between the true values and estimates also were compared. All calibra-
tions were run on a computer with Intel i7-2760QM CPU with quad cores and 8 GB of physical
RAM. The operating system was Microsoft Windows 7 Professional 64-bit edition. Except for
EQSIRT, which did not support multithread computing, all studied programs were set to use up
to two CPU cores during calibration. The actual elapsed time (not CPU time) for each calibra-
tion run was recorded. The study focused on evaluating item parameter recovery and did not
evaluate the person estimates.
Results and Performance Comparison
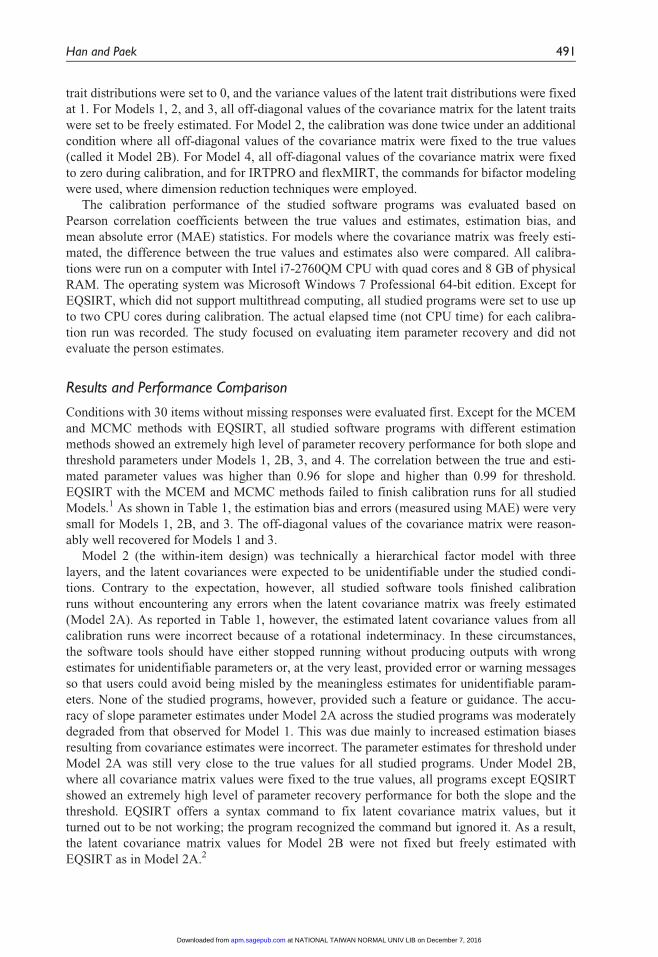
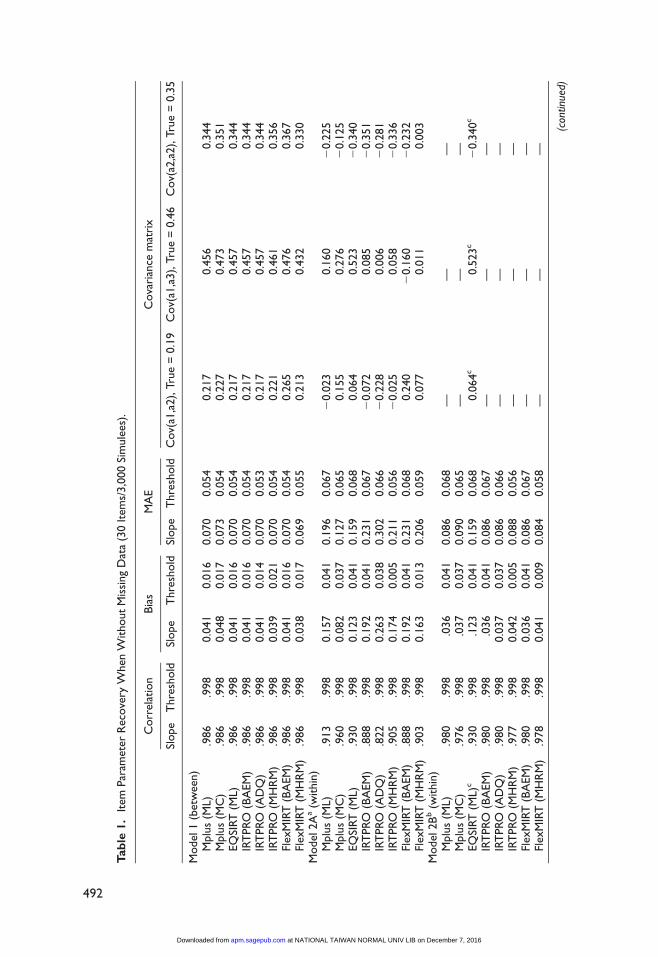
Conditions with 30 items without missing responses were evaluated first. Except for the MCEM
and MCMC methods with EQSIRT, all studied software programs with different estimation
methods showed an extremely high level of parameter recovery performance for both slope and
threshold parameters under Models 1, 2B, 3, and 4. The correlation between the true and esti-
mated parameter values was higher than 0.96 for slope and higher than 0.99 for threshold.
EQSIRT with the MCEM and MCMC methods failed to finish calibration runs for all studied
Models.1 As shown in Table 1, the estimation bias and errors (measured using MAE) were very
small for Models 1, 2B, and 3. The off-diagonal values of the covariance matrix were reason-
ably well recovered for Models 1 and 3.
Model 2 (the within-item design) was technically a hierarchical factor model with three
layers, and the latent covariances were expected to be unidentifiable under the studied condi-
tions. Contrary to the expectation, however, all studied software tools finished calibration
runs without encountering any errors when the latent covariance matrix was freely estimated
(Model 2A). As reported in Table 1, however, the estimated latent covariance values from all
calibration runs were incorrect because of a rotational indeterminacy. In these circumstances,
the software tools should have either stopped running without producing outputs with wrong
estimates for unidentifiable parameters or, at the very least, provided error or warning messages
so that users could avoid being misled by the meaningless estimates for unidentifiable param-
eters. None of the studied programs, however, provided such a feature or guidance. The accu-
racy of slope parameter estimates under Model 2A across the studied programs was moderately
degraded from that observed for Model 1. This was due mainly to increased estimation biases
resulting from covariance estimates were incorrect. The parameter estimates for threshold under
Model 2A was still very close to the true values for all studied programs. Under Model 2B,
where all covariance matrix values were fixed to the true values, all programs except EQSIRT
showed an extremely high level of parameter recovery performance for both the slope and the
threshold. EQSIRT offers a syntax command to fix latent covariance matrix values, but it
turned out to be not working; the program recognized the command but ignored it. As a result,
the latent covariance matrix values for Model 2B were not fixed but freely estimated with
EQSIRT as in Model 2A.2
Han and Paek 491
at NATIONAL TAIWAN NORMAL UNIV LIB on December 7, 2016apm.sagepub.comDownloaded from
Tab
le1.
Item
Par
amet
erR
ecove
ryW
hen
Without
Mis
sing
Dat
a(3
0It
ems/
3,0
00
Sim
ule
es).
Corr
elat
ion
Bia
sM
AE
Cova
rian
cem
atri
x
Slope
Thre
shold
Slope
Thre
shold
Slope
Thre
shold
Cov(
a1,a
2),
True
=0.1
9C
ov(
a1,a
3),
True
=0.4
6C
ov(
a2,a
2),
True
=0.3
5
Model
1(b
etw
een)
Mplu
s(M
L).9
86
.998
0.0
41
0.0
16
0.0
70
0.0
54
0.2
17
0.4
56
0.3
44
Mplu
s(M
C)
.986
.998
0.0
48
0.0
17
0.0
73
0.0
54
0.2
27
0.4
73
0.3
51
EQ
SIRT
(ML)
.986
.998
0.0
41
0.0
16
0.0
70
0.0
54
0.2
17
0.4
57
0.3
44
IRT
PRO
(BA
EM
).9
86
.998
0.0
41
0.0
16
0.0
70
0.0
54
0.2
17
0.4
57
0.3
44
IRT
PRO
(AD
Q)
.986
.998
0.0
41
0.0
14
0.0
70
0.0
53
0.2
17
0.4
57
0.3
44
IRT
PRO
(MH
RM
).9
86
.998
0.0
39
0.0
21
0.0
70
0.0
54
0.2
21
0.4
61
0.3
56
Flex
MIR
T(B
AEM
).9
86
.998
0.0
41
0.0
16
0.0
70
0.0
54
0.2
65
0.4
76
0.3
67
Flex
MIR
T(M
HR
M)
.986
.998
0.0
38
0.0
17
0.0
69
0.0
55
0.2
13
0.4
32
0.3
30
Model
2A
a(w
ithin
)M
plu
s(M
L).9
13
.998
0.1
57
0.0
41
0.1
96
0.0
67
20.0
23
0.1
60
20.2
25
Mplu
s(M
C)
.960
.998
0.0
82
0.0
37
0.1
27
0.0
65
0.1
55
0.2
76
20.1
25
EQ
SIRT
(ML)
.930
.998
0.1
23
0.0
41
0.1
59
0.0
68
0.0
64
0.5
23
20.3
40
IRT
PRO
(BA
EM
).8
88
.998
0.1
92
0.0
41
0.2
31
0.0
67
20.0
72
0.0
85
20.3
51
IRT
PRO
(AD
Q)
.822
.998
0.2
63
0.0
38
0.3
02
0.0
66
20.2
28
0.0
06
20.2
81
IRT
PRO
(MH
RM
).9
05
.998
0.1
74
0.0
05
0.2
11
0.0
56
20.0
25
0.0
58
20.3
36
Flex
MIR
T(B
AEM
).8
88
.998
0.1
92
0.0
41
0.2
31
0.0
68
0.2
40
20.1
60
20.2
32
Flex
MIR
T(M
HR
M)
.903
.998
0.1
63
0.0
13
0.2
06
0.0
59
0.0
77
0.0
11
0.0
03
Model
2B
b(w
ithin
)M
plu
s(M
L).9
80
.998
.036
0.0
41
0.0
86
0.0
68
——
—M
plu
s(M
C)
.976
.998
.037
0.0
37
0.0
90
0.0
65
——
—EQ
SIRT
(ML)
c.9
30
.998
.123
0.0
41
0.1
59
0.0
68
0.0
64
c0.5
23c
20.3
40
c
IRT
PRO
(BA
EM
).9
80
.998
.036
0.0
41
0.0
86
0.0
67
——
—IR
TPRO
(AD
Q)
.980
.998
0.0
37
0.0
37
0.0
86
0.0
66
——
—IR
TPRO
(MH
RM
).9
77
.998
0.0
42
0.0
05
0.0
88
0.0
56
——
—Fl
exM
IRT
(BA
EM
).9
80
.998
0.0
36
0.0
41
0.0
86
0.0
67
——
—Fl
exM
IRT
(MH
RM
).9
78
.998
0.0
41
0.0
09
0.0
84
0.0
58
——
—
(con
tinue
d)
492
at NATIONAL TAIWAN NORMAL UNIV LIB on December 7, 2016apm.sagepub.comDownloaded from
Tab
le1.(c
ontinued
)
Corr
elat
ion
Bia
sM
AE
Cova
rian
cem
atri
x
Slope
Thre
shold
Slope
Thre
shold
Slope
Thre
shold
Cov(
a1,a
2),
True
=0.1
9C
ov(
a1,a
3),
True
=0.4
6C
ov(
a2,a
2),
True
=0.3
5
Model
3(b
etw
een
+w
ithin
)M
plu
s(M
L).9
92
.999
0.0
51
0.0
37
0.0
66
0.0
54
0.1
87
0.4
39
0.2
87
Mplu
s(M
C)
.991
.998
0.0
52
0.0
40
0.0
70
0.0
56
0.2
15
0.4
92
0.3
05
EQ
SIRT
(ML)
.992
.999
0.0
51
0.0
37
0.0
66
0.0
54
0.1
88
0.4
39
0.2
87
IRT
PRO
(BA
EM
).9
92
.999
0.0
51
0.0
37
0.0
66
0.0
54
0.1
87
0.4
39
0.2
87
IRT
PRO
(AD
Q)
.992
.999
0.0
51
0.0
35
0.0
66
0.0
53
0.1
87
0.4
30
0.2
82
IRT
PRO
(MH
RM
).9
92
.999
0.0
51
0.0
33
0.0
67
0.0
52
0.1
90
0.4
13
0.2
88
Flex
MIR
T(B
AEM
).9
92
.999
0.0
51
0.0
37
0.0
66
0.0
54
0.1
87
0.4
38
0.2
86
Flex
MIR
T(M
HR
M)
.992
.999
0.0
58
0.0
33
0.0
72
0.0
53
0.1
81
0.3
41
0.2
15
Model
4(b
ifact
or)
Mplu
s(M
L).9
80
.998
0.1
04
0.0
33
0.1
21
0.0
63
Mplu
s(M
C)
.974
.998
0.1
02
0.0
28
0.1
25
0.0
62
EQ
SIRT
(ML)
.983
.999
20.0
05
20.0
06
0.0
72
0.0
43
IRT
PRO
(BA
EM
).9
83
.999
20.0
05
20.0
07
0.0
72
0.0
42
IRT
PRO
(AD
Q)
.983
.999
20.0
04
20.0
09
0.0
72
0.0
42
IRT
PRO
(MH
RM
).9
64
.999
0.0
36
20.0
10
0.0
86
0.0
43
Flex
MIR
T(B
AEM
).9
83
.999
20.0
05
20.0
07
0.0
72
0.0
42
Flex
MIR
T(M
HR
M)
.972
.999
0.0
34
20.0
09
0.0
81
0.0
42
Not
e.M
AE
=m
ean
abso
lute
erro
r;M
L=
max
imum
likel
ihood;B
AEM
=Bock
–A
itki
nex
pec
tation–m
axim
izat
ion;
AD
Q=
adap
tive
qua
dra
ture
appro
ach;
MH
RM
=M
etro
polis
–H
astings
Robbin
s–M
onr
oM
ethod.
a InM
odel
2A
,th
eco
vari
ance
mat
rix
was
free
lyes
tim
ated
.bIn
Model
2B,th
eco
vari
ance
mat
rix
was
not
estim
ated
but
fixed
toth
etr
ue
valu
es.
c Not
work
edas
inte
nded
.Se
tto
fixth
eco
vari
ance
mat
rix
valu
esbut
EQ
SIRT
did
not
fixth
em.
493
at NATIONAL TAIWAN NORMAL UNIV LIB on December 7, 2016apm.sagepub.comDownloaded from
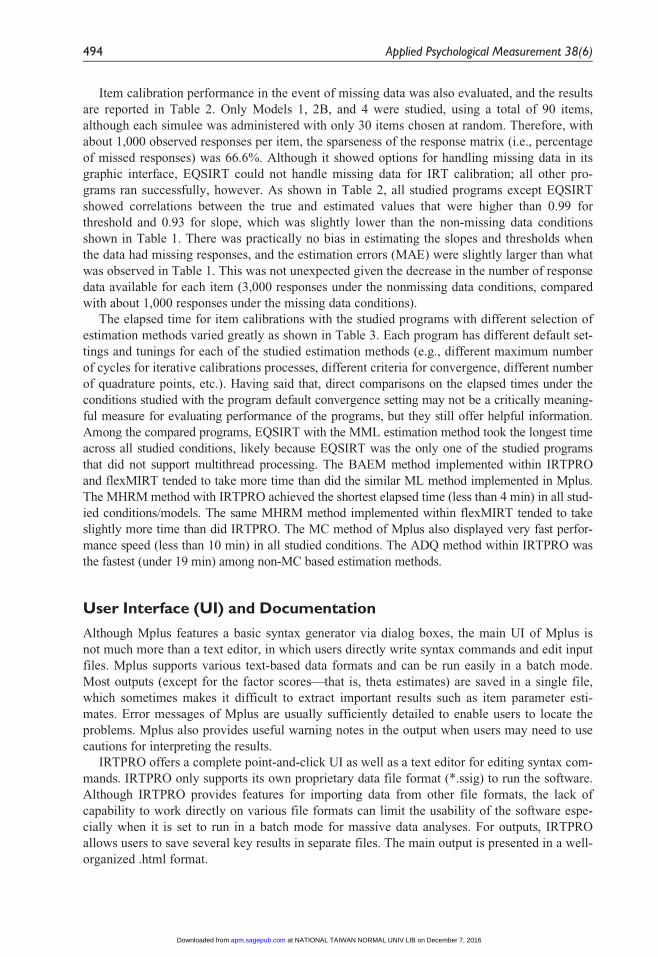
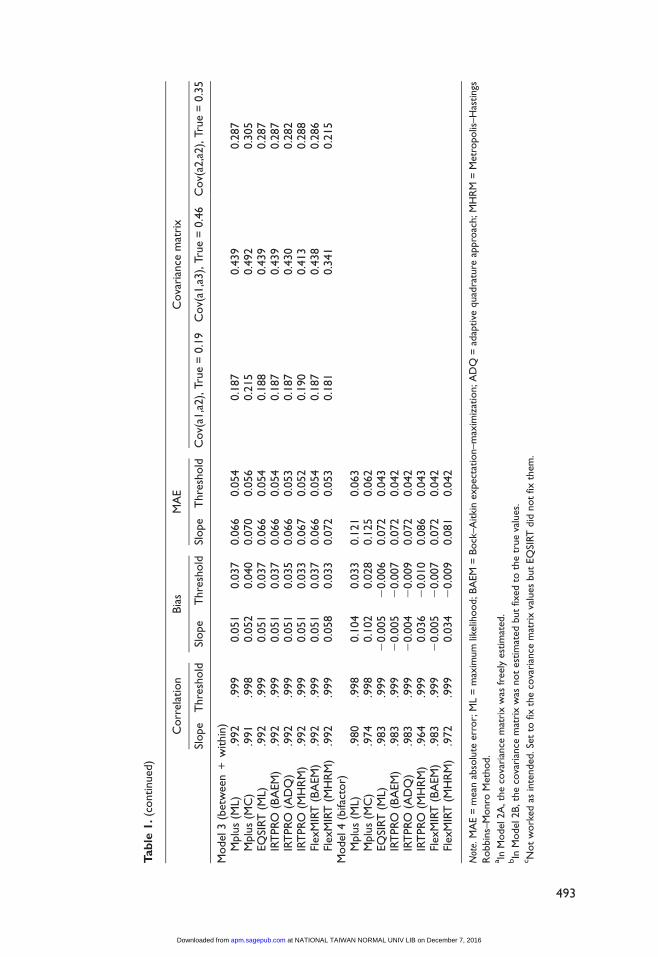
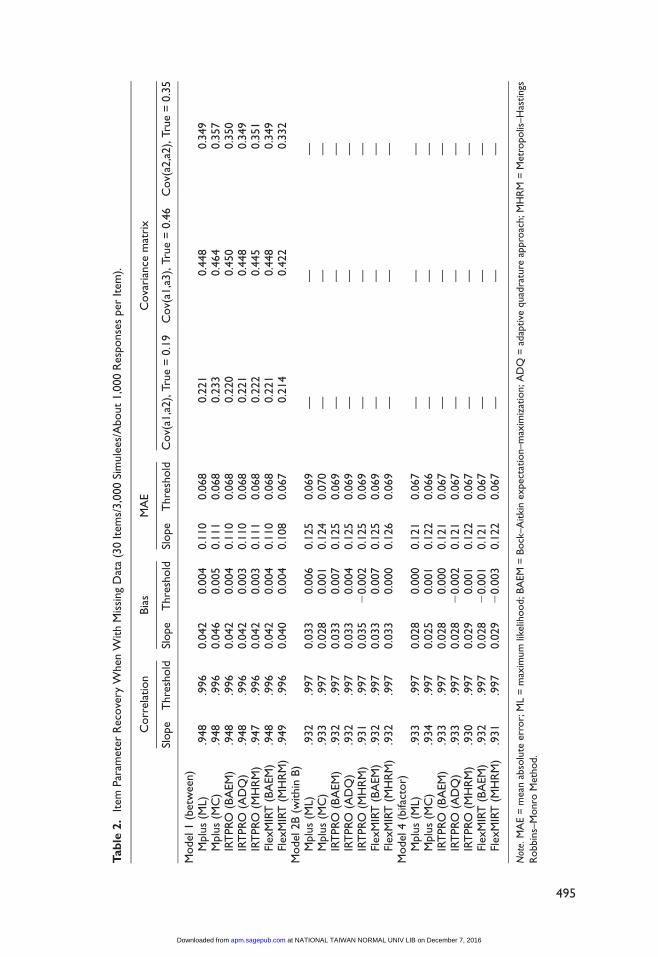
Item calibration performance in the event of missing data was also evaluated, and the results
are reported in Table 2. Only Models 1, 2B, and 4 were studied, using a total of 90 items,
although each simulee was administered with only 30 items chosen at random. Therefore, with
about 1,000 observed responses per item, the sparseness of the response matrix (i.e., percentage
of missed responses) was 66.6%. Although it showed options for handling missing data in its
graphic interface, EQSIRT could not handle missing data for IRT calibration; all other pro-
grams ran successfully, however. As shown in Table 2, all studied programs except EQSIRT
showed correlations between the true and estimated values that were higher than 0.99 for
threshold and 0.93 for slope, which was slightly lower than the non-missing data conditions
shown in Table 1. There was practically no bias in estimating the slopes and thresholds when
the data had missing responses, and the estimation errors (MAE) were slightly larger than what
was observed in Table 1. This was not unexpected given the decrease in the number of response
data available for each item (3,000 responses under the nonmissing data conditions, compared
with about 1,000 responses under the missing data conditions).
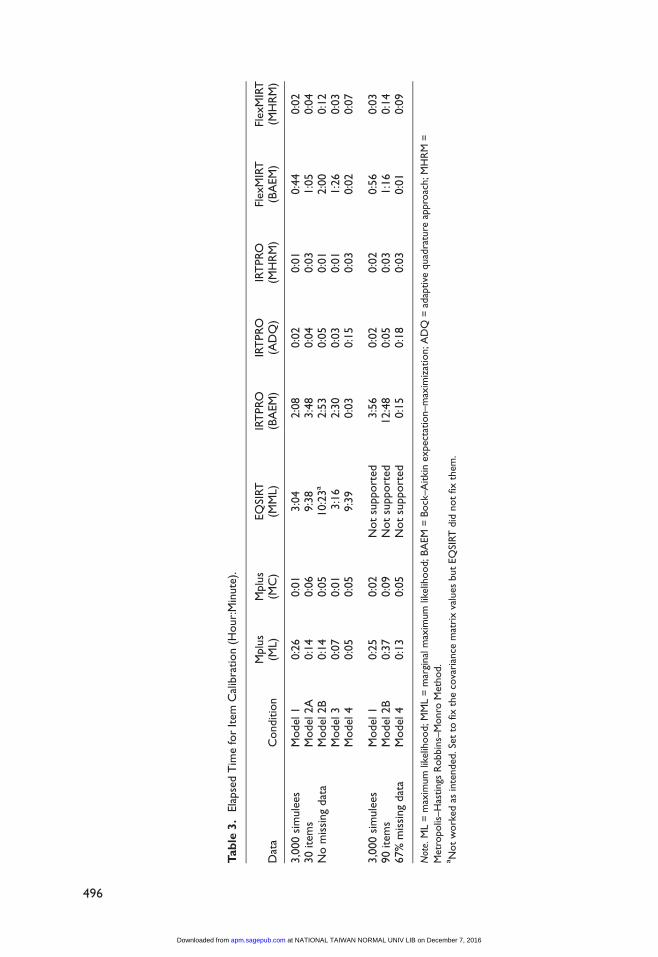
The elapsed time for item calibrations with the studied programs with different selection of
estimation methods varied greatly as shown in Table 3. Each program has different default set-
tings and tunings for each of the studied estimation methods (e.g., different maximum number
of cycles for iterative calibrations processes, different criteria for convergence, different number
of quadrature points, etc.). Having said that, direct comparisons on the elapsed times under the
conditions studied with the program default convergence setting may not be a critically meaning-
ful measure for evaluating performance of the programs, but they still offer helpful information.
Among the compared programs, EQSIRT with the MML estimation method took the longest time
across all studied conditions, likely because EQSIRT was the only one of the studied programs
that did not support multithread processing. The BAEM method implemented within IRTPRO
and flexMIRT tended to take more time than did the similar ML method implemented in Mplus.
The MHRM method with IRTPRO achieved the shortest elapsed time (less than 4 min) in all stud-
ied conditions/models. The same MHRM method implemented within flexMIRT tended to take
slightly more time than did IRTPRO. The MC method of Mplus also displayed very fast perfor-
mance speed (less than 10 min) in all studied conditions. The ADQ method within IRTPRO was
the fastest (under 19 min) among non-MC based estimation methods.
User Interface (UI) and Documentation
Although Mplus features a basic syntax generator via dialog boxes, the main UI of Mplus is
not much more than a text editor, in which users directly write syntax commands and edit input
files. Mplus supports various text-based data formats and can be run easily in a batch mode.
Most outputs (except for the factor scores—that is, theta estimates) are saved in a single file,
which sometimes makes it difficult to extract important results such as item parameter esti-
mates. Error messages of Mplus are usually sufficiently detailed to enable users to locate the
problems. Mplus also provides useful warning notes in the output when users may need to use
cautions for interpreting the results.
IRTPRO offers a complete point-and-click UI as well as a text editor for editing syntax com-
mands. IRTPRO only supports its own proprietary data file format (*.ssig) to run the software.
Although IRTPRO provides features for importing data from other file formats, the lack of
capability to work directly on various file formats can limit the usability of the software espe-
cially when it is set to run in a batch mode for massive data analyses. For outputs, IRTPRO
allows users to save several key results in separate files. The main output is presented in a well-
organized .html format.
494 Applied Psychological Measurement 38(6)
at NATIONAL TAIWAN NORMAL UNIV LIB on December 7, 2016apm.sagepub.comDownloaded from
Tab
le2.
Item
Par
amet
erR
ecove
ryW
hen
With
Mis
sing
Dat
a(3
0It
ems/
3,0
00
Sim
ule
es/A
bout
1,0
00
Res
ponse
sper
Item
).
Corr
elat
ion
Bia
sM
AE
Cova
rian
cem
atri
x
Slope
Thre
shold
Slope
Thre
shold
Slope
Thre
shold
Cov(
a1,a
2),
True
=0.1
9C
ov(
a1,a
3),
True
=0.4
6C
ov(
a2,a
2),
True
=0.3
5
Model
1(b
etw
een)
Mplu
s(M
L).9
48
.996
0.0
42
0.0
04
0.1
10
0.0
68
0.2
21
0.4
48
0.3
49
Mplu
s(M
C)
.948
.996
0.0
46
0.0
05
0.1
11
0.0
68
0.2
33
0.4
64
0.3
57
IRT
PRO
(BA
EM
).9
48
.996
0.0
42
0.0
04
0.1
10
0.0
68
0.2
20
0.4
50
0.3
50
IRT
PRO
(AD
Q)
.948
.996
0.0
42
0.0
03
0.1
10
0.0
68
0.2
21
0.4
48
0.3
49
IRT
PRO
(MH
RM
).9
47
.996
0.0
42
0.0
03
0.1
11
0.0
68
0.2
22
0.4
45
0.3
51
Flex
MIR
T(B
AEM
).9
48
.996
0.0
42
0.0
04
0.1
10
0.0
68
0.2
21
0.4
48
0.3
49
Flex
MIR
T(M
HR
M)
.949
.996
0.0
40
0.0
04
0.1
08
0.0
67
0.2
14
0.4
22
0.3
32
Model
2B
(within
B)
Mplu
s(M
L).9
32
.997
0.0
33
0.0
06
0.1
25
0.0
69
——
—M
plu
s(M
C)
.933
.997
0.0
28
0.0
01
0.1
24
0.0
70
——
—IR
TPRO
(BA
EM
).9
32
.997
0.0
33
0.0
07
0.1
25
0.0
69
——
—IR
TPRO
(AD
Q)
.932
.997
0.0
33
0.0
04
0.1
25
0.0
69
——
—IR
TPRO
(MH
RM
).9
31
.997
0.0
35
20.0
02
0.1
25
0.0
69
——
—Fl
exM
IRT
(BA
EM
).9
32
.997
0.0
33
0.0
07
0.1
25
0.0
69
——
—Fl
exM
IRT
(MH
RM
).9
32
.997
0.0
33
0.0
00
0.1
26
0.0
69
——
—M
odel
4(b
ifact
or)
Mplu
s(M
L).9
33
.997
0.0
28
0.0
00
0.1
21
0.0
67
——
—M
plu
s(M
C)
.934
.997
0.0
25
0.0
01
0.1
22
0.0
66
——
—IR
TPRO
(BA
EM
).9
33
.997
0.0
28
0.0
00
0.1
21
0.0
67
——
—IR
TPRO
(AD
Q)
.933
.997
0.0
28
20.0
02
0.1
21
0.0
67
——
—IR
TPRO
(MH
RM
).9
30
.997
0.0
29
0.0
01
0.1
22
0.0
67
——
—Fl
exM
IRT
(BA
EM
).9
32
.997
0.0
28
20.0
01
0.1
21
0.0
67
——
—Fl
exM
IRT
(MH
RM
).9
31
.997
0.0
29
20.0
03
0.1
22
0.0
67
——
—
Not
e.M
AE
=m
ean
abso
lute
erro
r;M
L=
max
imum
likel
ihood;B
AEM
=Bock
–A
itki
nex
pec
tation–m
axim
izat
ion;
AD
Q=
adap
tive
qua
dra
ture
appro
ach;
MH
RM
=M
etro
polis
–H
astings
Robbin
s–M
onr
oM
ethod.
495
at NATIONAL TAIWAN NORMAL UNIV LIB on December 7, 2016apm.sagepub.comDownloaded from
Tab
le3.
Ela
pse
dT
ime
for
Item
Cal
ibra
tion
(Hour:
Min
ute)
.
Dat
aC
onditio
nM
plu
s(M
L)M
plu
s(M
C)
EQ
SIRT
(MM
L)IR
TPRO
(BA
EM
)IR
TPRO
(AD
Q)
IRT
PRO
(MH
RM
)Fl
exM
IRT
(BA
EM
)Fl
exM
IRT
(MH
RM
)
3,0
00
sim
ule
es30
item
sN
om
issi
ng
dat
a
Model
10:2
60:0
13:0
42:0
80:0
20:0
10:4
40:0
2M
odel
2A
0:1
40:0
69:3
83:4
80:0
40:0
31:0
50:0
4M
odel
2B
0:1
40:0
510:2
3a
2:5
30:0
50:0
12:0
00:1
2M
odel
30:0
70:0
13:1
62:3
00:0
30:0
11:2
60:0
3M
odel
40:0
50:0
59:3
90:0
30:1
50:0
30:0
20:0
7
3,0
00
sim
ule
es90
item
s67%
mis
sing
dat
a
Model
10:2
50:0
2N
ot
support
ed3:5
60:0
20:0
20:5
60:0
3M
odel
2B
0:3
70:0
9N
ot
support
ed12:4
80:0
50:0
31:1
60:1
4M
odel
40:1
30:0
5N
ot
support
ed0:1
50:1
80:0
30:0
10:0
9
Not
e.M
L=
max
imum
likel
ihood;M
ML
=m
argi
nal
max
imum
likel
ihood;BA
EM
=Bock
–Aitki
nex
pec
tation–
max
imiz
atio
n;A
DQ
=ad
aptive
quad
ratu
reap
pro
ach;M
HR
M=
Met
ropolis
–H
astings
Robbin
s–M
onro
Met
hod.
a Not
work
edas
inte
nded
.Se
tto
fixth
eco
vari
ance
mat
rix
valu
esbut
EQ
SIRT
did
not
fixth
em.
496
at NATIONAL TAIWAN NORMAL UNIV LIB on December 7, 2016apm.sagepub.comDownloaded from
Like IRTPRO, EQSIRT has a complete point-and-click solution for user interfacing. The
main interface of EQSIRT is well organized and highly flexible so that users can easily work on
multiple projects simultaneously. The syntax editor is very user-friendly with automatic color
coding on the syntax commands. EQSIRT has its own proprietary format for data files, but users
still can directly access fixed format data without converting them. The main output is provided
in both text format and .html format, with .xml format also available. Error messages provided
in dialog boxes did not seem to be helpful in identifying or fixing problems in syntax and data.
During this study, the program often stopped running without displaying any error messages.
Similar to Mplus, flexMIRT mostly has a syntax-based interface with no real graphical UI
elements. flexMIRT has no feature to generate syntax commands; users must write syntax com-
mands on their own. The program can natively handle data in space-, comma-, or tab-delimited
formats but does not support fixed format. Users have options to save key results in separate
output files. The program provides simple error messages that were useful for identifying and
fixing problems with syntax and/or data.
All studied programs come with user manuals and output examples. Mplus offers the most
comprehensive manual contents including hundreds of examples for most of the models and
analyses that the program is designed to handle, but the contents covering IRT modeling are
very limited. Mplus has a large user forum where thousands of examples, discussions, and
Q&A can be found. The software’s technical support is also strong; generally most questions
are answered within 24 hr. The other programs—IRTPRO, EQSIRT, and flexMIRT—have
much shorter histories in the field, and fewer resources except for examples provided in the
manual and technical support.
Availability and Price
Mplus and EQSIRT are available for Windows, Mac OS X, and Linux platforms; IRTPRO and
flexMIRT are available only for Windows systems. IRTPRO requires administrator operation
every time it is run; otherwise, it does not start. This can be a serious limitation for users who
need to work on company-owned and-maintained computers because most users in such work
environment do not normally have administrator privilege. Versions with the 64-bit architecture
for 64-bit Windows systems are available for Mplus and flexMIRT.
Program prices vary significantly. For academic users, a single user license costs US$595
for Mplus, US$495 for IRTPRO (for a single installation), and US$595 for EQSIRT. Student
versions of Mplus and EQSIRT are available for less than US$200. flexMIRT does not offer a
permanent license option, instead being a subscription-based product costing US$125 per year
(up to three installations) for academic users. All prices are subject to change. All programs also
offer a wide range of pricing options for rental and commercial use, while offering trial versions
that have limited time use or limited features.
Conclusion
All MIRT software packages that were evaluated and compared in this study are capable of esti-
mating MIRT models. The results from the parameter recovery study with simulation suggest
that they all worked very well with a high level of estimation accuracy (except for Model 2A,
where the covariance matrix for latent variables was not identifiable unless additional con-
straints were imposed). Each program, however, has its own unique favorable features and
shortcomings. Regarding limitations of the programs evaluated here, Mplus cannot calibrate
models with lower asymptote parameters (i.e., pseudo-guessing). IRTPRO cannot natively han-
dle text-based data formats, EQSIRT cannot handle data with missing responses, and flexMIRT
Han and Paek 497
at NATIONAL TAIWAN NORMAL UNIV LIB on December 7, 2016apm.sagepub.comDownloaded from
has a syntax-only UI, which may not be easy for new learners. Therefore, it is important for
users to understand the different advantages and limitations across the programs before they
choose a MIRT software package for their purposes.
Authors’ Note
The views and opinions expressed in this article are those of the authors and do not necessarily reflect those
of the Graduate Management Admission Council�.
Acknowledgments
The authors are grateful to Paula Bruggeman of Graduate Management Admission Council� for editorial
review.
Declaration of Conflicting Interests
The author(s) declared no potential conflicts of interest with respect to the research, authorship, and/or pub-
lication of this article.
Funding
The author(s) received no financial support for the research, authorship, and/or publication of this article.
Notes
1. At the time of this writing, the developers of EQSIRT are aware of the issue and reportedly are work-
ing to fix the problems.
2. This bug was reported to the software developers.
References
Bock, R. D., & Aitkin, M. (1981). Marginal maximum likelihood estimation of item parameters: An
application of the EM algorithm. Psychometrika, 46, 443-459.
Cai, L. (2010a). High-dimensional exploratory item factor analysis by a Metropolis-Hasings Robbins-
Monro algorithm. Psychometrika, 75, 33-57.
Cai, L. (2010b). Metropolis-Hastings Robbins-Monro algorithm for confirmatory item factor analysis.
Journal of Educational and Behavioral Statistics, 35, 30-335.
Cai, L. (2013). flexMIRT: A numerical engine for flexible multilevel multidimensional item analysis and
test scoring (Version 2.0) [Computer software]. Chapel Hill, NC: Vector Psychometric Group.
Cai, L., Thissen, D., & du Toit, S. H. C. (2011). IRTPRO for Windows [Computer software].
Lincolnwood, IL: Scientific Software International.
Han, K. T. (2007). WinGen: Windows software that generates IRT parameters and item responses. Applied
Psychological Measurement, 31, 457-459.
Lord, F. M., & Novick, M. R. (1968). Statistical theories of mental test scores. Reading, MA: Addison-
Wesley.
Muthen, L. K., & Muthen, B. O. (1998-2012). Mplus user’s guide (7th ed.). Los Angeles, CA: Author.
Schilling, S., & Bock, R. D. (2005). High-dimensional maximum marginal likelihood item factor analysis
by adaptive quadrature. Psychometrika, 70, 533-555.
Wu, E. J. C., & Bentler, P. M. (2013). EQSIRT: A comprehensive item response theory program
[Computer software]. Encino, CA: Multivariate Software.
498 Applied Psychological Measurement 38(6)
at NATIONAL TAIWAN NORMAL UNIV LIB on December 7, 2016apm.sagepub.comDownloaded from
Information for Readers
Applied Psychological Measurement2014, Vol. 38(8) NP2
� The Author(s) 2014Reprints and permissions:
sagepub.com/journalsPermissions.navDOI: 10.1177/0146621614554510
apm.sagepub.com
Corrigendum
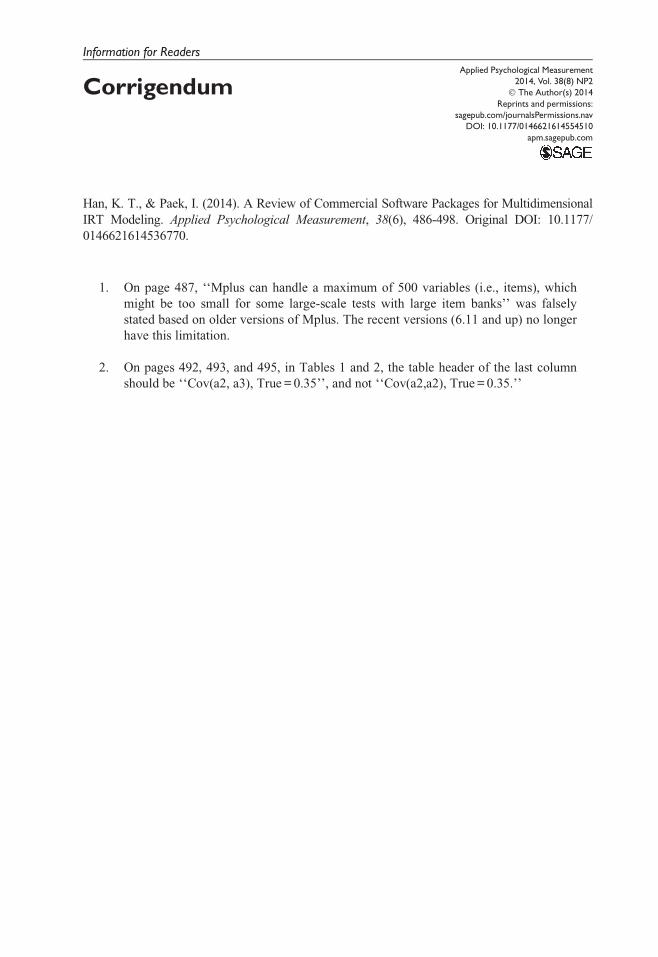
Han, K. T., & Paek, I. (2014). A Review of Commercial Software Packages for Multidimensional
IRT Modeling. Applied Psychological Measurement, 38(6), 486-498. Original DOI: 10.1177/
0146621614536770.
1. On page 487, ‘‘Mplus can handle a maximum of 500 variables (i.e., items), which
might be too small for some large-scale tests with large item banks’’ was falsely
stated based on older versions of Mplus. The recent versions (6.11 and up) no longer
have this limitation.
2. On pages 492, 493, and 495, in Tables 1 and 2, the table header of the last column
should be ‘‘Cov(a2, a3), True = 0.35’’, and not ‘‘Cov(a2,a2), True = 0.35.’’