applied physiology of rugby sevens: performance analysis ... · applied physiology of rugby sevens:...
TRANSCRIPT
Applied Physiology of Rugby Sevens: Performance
Analysis and Elite Player Development
Dean Glen Higham
Bachelor of Exercise Science (Honours) (First Class), Australian Catholic University
A thesis submitted to the University of Canberra for the degree of
Doctor of Philosophy
October, 2013
Faculty of Health,
University of Canberra
Physiology,
Australian Institute of Sport
Australian Rugby Union
i
Abstract
Rugby sevens is an abbreviated format of rugby union that will be contested at the Olympic
Games from 2016. Despite a rise in the worldwide popularity and profile of rugby sevens, the
technical, tactical, physical, and physiological demands of international competition are not
well understood and only limited information exists on the characteristics of elite-level
players. The purpose of this thesis was to quantify the requirements of international
competition, identify the anthropometric, physiological, and performance characteristics of
international-level players, and quantify the specificity of contemporary on-field training
practices. Seven experimental studies were conducted to address these issues.
Linear mixed modelling of 392 international team performances identified several
performance indicators either positively or negatively related to the number of points scored
by a team. An increase of two standard deviations in a team’s possession time (4.0; ±2.0,
change in points scored; ±90% confidence limits (CL)), passes (1.0; ±1.5), kicks (1.1; ±1.5),
and relative ruck and maul retention (5.9; ±1.4) were related to scoring more points in a
match. In contrast, opposition possession time (-5.8; ±1.8), penalties and free kicks conceded
(-2.2; ±1.5), passes per min of possession (-1.7; ±1.5), rucks and mauls retained (3.0; ±1.5),
rucks and mauls per min of possession (-8.8; ±1.3), turnovers conceded (-7.0; ±1.4), and
turnovers conceded per min of possession (-8.0; ±1.6) were negatively related to scoring
points. Linear mixed modelling of performance indicators from nine tournaments of the
2011/2012 International Rugby Board (IRB) Sevens World Series confirmed the most
successful teams maintained ball possession by minimising errors and turnovers, were
efficient in converting possession into tries, and had effective defensive structures resulting in
a high rate of tackle completion. Similarly, linear mixed modelling of performance indicators
for 12 teams during four IRB Sevens World Series between 2008/2009 and 2011/2012
revealed the mean number of tries scored and conceded by a team best discriminated higher
and lower World Series rankings within and between teams. Tactics associated with a better
team ranking were based on increasing ball retention in line-outs and the breakdown, turning
the ball over more frequently in opposition rucks, and pressuring the opposition in their
territory by kicking fewer contestable restarts.
Activity profiling of 174 player observations during 27 matches demonstrated a higher
physical intensity in international compared with domestic matches due to players covering
ii
~27% greater distance at ≥6 m·s-1
and performing 4 to 39% more changes in velocity. Total
distance covered per min was ~45% greater in rugby sevens and relative high-velocity
running volume more than double that of 15-player rugby union. Despite 1 to 16% reductions
in the distance covered at >2 m·s-1
and number of changes in velocity from the first to second
half of matches, there was little indication of accumulated fatigue over a multi-day
tournament.
Laboratory- and field-based testing of 18 international male rugby sevens players revealed
they had highly-developed speed, power, and endurance qualities to meet the demands of
competition. Rugby sevens players had anthropometric characteristics similar to those of
backs in international 15-player rugby union. Acceleration and speed, lower-body muscular
power, and relative maximal aerobic power were similar to, or exceeded, that of professional
15-a-side players. The small between-athlete variability of characteristics in rugby sevens
players highlights the need for relatively uniform physical and performance standards in
contrast with 15-a-side teams.
The body composition of 38 international male rugby union and 27 international male rugby
sevens players was measured using dual-energy X-ray absorptiometry. The quantity and
distribution of fat, non-osseous lean and bone mineral mass across anatomical regions were
compared between backs and forwards in each squad. Forwards were heavier and had a
greater quantity of fat (union 43 to 67%; ±~17%, range of % differences; ±~95% CL; sevens
20 to 26%; ±~29%), non-osseous lean (union 14 to 22%; ±~5.8%; sevens 6.9 to 8.4%;
±~6.6%), and bone mineral (union 12 to 26%; ±~7.2%; sevens 5.0 to 11%; ±~7.2%) mass
than backs in both rugby union and rugby sevens. However, the magnitude of difference
between the positional groups was greater in rugby union players. When anatomical regional
tissue mass was expressed as a proportion of total regional mass, positional group differences
were predominantly unclear in rugby sevens players, but persisted in rugby union players.
The distribution of tissue varied between positional groups and rugby formats.
The movement patterns and physiological demands of 42 international male rugby sevens
players were monitored during 22 international matches and 63 rugby-specific training drills.
Differences between matches and training were quantified using magnitude-based inferential
statistics. During 21 months of on-field training observation, technical and game-simulation
drills typically failed to replicate the positional group-specific physical and physiological
demands of competition.
iii
In summary, rugby sevens imposes unique demands on players during competition. The
disparity between rugby union and rugby sevens dictates different characteristics of players,
priorities for player preparation, and tactical approaches to competition are required. Coaches
and support staff can utilise the findings of this thesis to better prepare players for the
requirements of this growing sport. The research outcomes can be applied to develop talent
identification and transfer programmes, refine positional group-specific technical and
physical development, and implement monitoring systems to ensure training adaptations are
optimised leading into international competition in the newest Olympic team sport.
v
Statement of Contribution by Others
This thesis details original research conducted by the candidate at the Australian Institute of
Sport while enrolled in the Faculty of Health at the University of Canberra. The thesis
includes research articles of which I am the lead author and was primarily responsible for the
conception and design of the research, ethical approval to conduct the research, data
collection, analysis and interpretation, manuscript preparation, and correspondence with
journals.
Where explicitly acknowledged in each experimental chapter, a number of individuals have
contributed to the research presented in this thesis.
Prof. David B. Pyne: Research design, data interpretation and manuscript review
Dr. Judith M. Anson: Manuscript review
Prof. Will G. Hopkins: Data analysis and interpretation, and manuscript review
Dr. Gary J. Slater: Data collection and interpretation, and manuscript review
Christine E. Dziedzic: Data interpretation and manuscript review
Anthony Eddy: Technical assistance
……………………………………………………………………
Signature of candidate (Dean Higham)
……………………………………………………………………
Signature of chair of the supervisory panel (Dr. Judith Anson)
Date: ……………………………
vi
Table of Contents
Abstract ...................................................................................................................................... i
Certificate of Authorship of Thesis ....................................................................................... iv
Statement of Contribution by Others .................................................................................... v
Table of Contents .................................................................................................................... vi
List of Figures ........................................................................................................................ xiv
List of Tables ......................................................................................................................... xvi
Publications by the Candidate Relevant to the Thesis ................................................... xviii
Conference Presentations by the Candidate Relevant to the Thesis ................................ xix
Acknowledgements ................................................................................................................ xx
Chapter One - Introduction .................................................................................................... 1
Statement of the Problem ....................................................................................................... 2
Aims ....................................................................................................................................... 3
Competition Analysis ......................................................................................................... 3
Player Selection and Development ..................................................................................... 4
Specificity of Training ........................................................................................................ 4
Significance of the Thesis ...................................................................................................... 4
Synopsis of the Thesis ............................................................................................................ 5
Chapter Two - Review of Literature ...................................................................................... 8
Evolution of Rugby Union ..................................................................................................... 8
Description of Rugby Sevens ............................................................................................... 10
Performance Analysis in Rugby Union ................................................................................ 11
Notational Analysis .......................................................................................................... 11
Time-motion Analysis ...................................................................................................... 15
Physiological Responses to Competition ......................................................................... 24
Physical Characteristics and Capacities of Rugby Players .................................................. 31
Body Mass ........................................................................................................................ 32
vii
Height ............................................................................................................................... 34
Body Composition ............................................................................................................ 36
Aerobic Performance ........................................................................................................ 38
Anaerobic Performance .................................................................................................... 41
Muscular Strength and Power........................................................................................... 43
Speed ................................................................................................................................ 50
Seasonal Variations in Physical Characteristics and Capacities ...................................... 51
Relationships between Player Characteristics and Performance.......................................... 52
Physical Development and Training Interventions .............................................................. 54
Conclusions .......................................................................................................................... 54
Chapter Three - Performance Indicators Related to Points Scoring and Winning in
International Rugby Sevens .................................................................................................. 56
Abstract ................................................................................................................................ 56
Introduction .......................................................................................................................... 57
Methods ................................................................................................................................ 58
Sample .............................................................................................................................. 58
Statistical Analysis ........................................................................................................... 59
Results .................................................................................................................................. 61
Discussion ............................................................................................................................ 65
Conclusion ............................................................................................................................ 69
Key Points ............................................................................................................................ 69
Chapter Four - Relationships between Rugby Sevens Performance Indicators and
International Tournament Outcomes .................................................................................. 71
Abstract ................................................................................................................................ 71
Introduction .......................................................................................................................... 73
Methods ................................................................................................................................ 74
Sample .............................................................................................................................. 74
Statistical Analysis ........................................................................................................... 74
viii
Results .................................................................................................................................. 76
Discussion ............................................................................................................................ 78
Conclusion ............................................................................................................................ 81
Practical Implications ........................................................................................................... 81
Chapter Five - Patterns of Play Associated with Success in International Rugby Sevens
.................................................................................................................................................. 83
Abstract ................................................................................................................................ 83
Introduction .......................................................................................................................... 84
Methods ................................................................................................................................ 85
Sample .............................................................................................................................. 85
Statistical Analysis ........................................................................................................... 86
Results .................................................................................................................................. 88
Discussion ............................................................................................................................ 91
Conclusion ............................................................................................................................ 94
Chapter Six - Movement Patterns in Rugby Sevens: Effects of Tournament Level,
Fatigue and Substitute Players ............................................................................................. 95
Abstract ................................................................................................................................ 95
Introduction .......................................................................................................................... 97
Methods ................................................................................................................................ 98
Results .................................................................................................................................. 99
Discussion .......................................................................................................................... 102
Conclusion .......................................................................................................................... 105
Practical Implications ......................................................................................................... 105
Acknowledgements ............................................................................................................ 106
Chapter Seven - Physiological, Anthropometric and Performance Characteristics of
Rugby Sevens Players .......................................................................................................... 107
Abstract .............................................................................................................................. 107
Introduction ........................................................................................................................ 109
ix
Methods .............................................................................................................................. 110
Experimental Approach .................................................................................................. 110
Participants ..................................................................................................................... 110
Anthropometric Assessment ........................................................................................... 110
Physiological and Performance Assessments ................................................................. 111
Statistical Analysis ......................................................................................................... 112
Results ................................................................................................................................ 113
Anthropometric, Physiological and Performance Characteristics .................................. 113
Associations between Anthropometric, Physiological and Performance Characteristics
........................................................................................................................................ 115
Discussion .......................................................................................................................... 117
Practical Applications ........................................................................................................ 121
Conclusion .......................................................................................................................... 122
Acknowledgements ............................................................................................................ 122
Chapter Eight - Distribution of Fat, Non-osseous Lean and Bone Mineral Mass in
International Rugby Union and Rugby Sevens Players ................................................... 123
Abstract .............................................................................................................................. 123
Introduction ........................................................................................................................ 124
Methods .............................................................................................................................. 125
Experimental Approach .................................................................................................. 125
Participants ..................................................................................................................... 125
Standardised DXA Measurement and Analysis ............................................................. 125
Statistical Analysis ......................................................................................................... 127
Results ................................................................................................................................ 128
Age and Body Mass ........................................................................................................ 128
Absolute Regional Tissue Mass ..................................................................................... 128
Relative Regional Tissue Mass ....................................................................................... 130
Distribution of Mass ....................................................................................................... 132
x
Distribution of Tissue ..................................................................................................... 132
Discussion .......................................................................................................................... 137
Positional Group Differences in Tissue Mass ................................................................ 137
Distribution of Mass ....................................................................................................... 139
Distribution of Fat .......................................................................................................... 140
Distribution of Non-osseous Lean Mass ........................................................................ 140
Distribution of Bone Mineral Mass ................................................................................ 141
Conclusion .......................................................................................................................... 141
Chapter Nine - Comparison of Activity Profiles and Physiological Demands between
International Rugby Sevens Matches and Training ......................................................... 142
Abstract .............................................................................................................................. 142
Introduction ........................................................................................................................ 143
Methods .............................................................................................................................. 144
Experimental Approach to the Problem ......................................................................... 144
Participants ..................................................................................................................... 144
Procedures ...................................................................................................................... 144
Statistical Analyses ......................................................................................................... 146
Results ................................................................................................................................ 147
Differences between Positional Groups ......................................................................... 147
Differences between Training Activities and Matches ................................................... 148
Differences in Velocities ................................................................................................ 149
Differences in Physiological Load ................................................................................. 150
Discussion .......................................................................................................................... 151
Practical Applications ........................................................................................................ 156
Acknowledgements ............................................................................................................ 156
Chapter Ten – Discussion .................................................................................................... 157
Technical and Tactical Requirements of Competition ....................................................... 157

xi
Movement Patterns and Physiological Demands of Competition ...................................... 159
Characteristics and Capacities of Rugby Sevens Players................................................... 160
Physical Training and Player Development ....................................................................... 163
Conclusion .......................................................................................................................... 166
Chapter Eleven – Research Outcomes ............................................................................... 167
Research Aims and Key Outcomes .................................................................................... 167
Competition Analysis ..................................................................................................... 167
Player Selection and Development ................................................................................. 169
Specificity of Training .................................................................................................... 170
Limitations ......................................................................................................................... 170
Practical Applications ........................................................................................................ 171
Competition Analysis ..................................................................................................... 171
Player Selection and Development ................................................................................. 172
Specificity of Training .................................................................................................... 173
Directions for Future Research .......................................................................................... 174
Competition Analysis ..................................................................................................... 174
Player Selection and Development ................................................................................. 175
Specificity of Training .................................................................................................... 176
Summary ............................................................................................................................ 176
References ............................................................................................................................. 178
Appendix A – Performance Nutrition Guidelines for International Rugby Sevens
Tournaments ........................................................................................................................ 203
Abstract .............................................................................................................................. 203
Introduction ........................................................................................................................ 204
Typical Training Patterns ................................................................................................... 205
Competition ........................................................................................................................ 205
Movement Patterns and Physiological Demands ........................................................... 206
xii
Physique Characteristics .................................................................................................... 207
Nutritional Strategies to Promote Optimal Performance ................................................... 208
Ergogenic Aids ............................................................................................................... 211
Practical Challenges and Guidelines .............................................................................. 213
Conclusion .......................................................................................................................... 217
References .......................................................................................................................... 218
Appendix B – Running Movement Patterns in Rugby Sevens Football ......................... 225
Introduction ........................................................................................................................ 225
Methods .............................................................................................................................. 225
Results and Discussion ....................................................................................................... 225
Conclusion .......................................................................................................................... 226
References .......................................................................................................................... 226
Appendix C – What Physical and Performance Qualities Characterise Elite Rugby
Sevens Players? .................................................................................................................... 227
Introduction ........................................................................................................................ 227
Methods .............................................................................................................................. 227
Results ................................................................................................................................ 227
Discussion .......................................................................................................................... 228
References .......................................................................................................................... 228
Appendix D – Comparison of Fitness Characteristics between Men’s and Women’s
Rugby Sevens Players .......................................................................................................... 229
Purpose ............................................................................................................................... 229
Methods .............................................................................................................................. 229
Results ................................................................................................................................ 229
Conclusion .......................................................................................................................... 230
Appendix E – Comparison of 5- And 10-Hz GPS Technology for Team Sport Analysis
................................................................................................................................................ 231
Purpose ............................................................................................................................... 231

xiii
Methods .............................................................................................................................. 231
Results ................................................................................................................................ 231
Conclusions ........................................................................................................................ 231
xiv
List of Figures
Figure 1.1. Thematic overview of the experimental thesis chapters. ......................................... 5
Figure 2.1. Compilation of body mass of professional rugby union and rugby sevens players
reported between 1999 and 2013 ............................................................................................. 33
Figure 2.2. Compilation of height of professional rugby union and rugby sevens players
reported between 1999 and 2013 ............................................................................................. 35
Figure 2.3. Compilation of relative body fat of professional rugby union and rugby sevens
players reported between 1999 and 2013 ................................................................................. 37
Figure 2.4. Compilation of one-repetition maximum bench press performance of professional
rugby union players reported between 2006 and 2012 ............................................................ 44
Figure 2.5. Compilation of one-repetition maximum back squat performance of professional
rugby union players reported between 2007 and 2012 ............................................................ 45
Figure 2.6. Compilation of sprint times of professional rugby union players reported between
2003 and 2012 .......................................................................................................................... 50
Figure 3.1. Effect of two standard deviations of within-team changes and between-team
differences of team performance indicators on (A) points scored during an international rugby
sevens match, and (B) likelihood of winning a close match.................................................... 64
Figure 3.2. Example of strong between- and within-team relationships between a
performance indicator (rucks and mauls per min of possession) and points scored in
international rugby sevens matches. ........................................................................................ 65
Figure 4.1. Effect of two standard deviations of between-team differences and within-team
changes of team performance indicators on ranking in International Rugby Board Sevens
World Series tournaments ........................................................................................................ 77
Figure 5.1. Effect of two standard deviations of within-team changes and between-team
differences of team performance indicators on annual ranking in the International Rugby
Board Sevens World Series ..................................................................................................... 90
xv
Figure 7.1. Linear relationship between A) Yo-Yo intermittent recovery level 1 (Yo-Yo IR1)
distance and relative V̇O2max (n = 14), B) Yo-Yo IR1 distance and velocity at V̇O2max (n =
14), C) relative V̇O2max and 40-m sprint time (n = 14), and D) relative V̇O2max and repeated-
sprint ability (n = 12) ............................................................................................................. 117
Figure 8.1. Example DXA scan image partitioned into regions of interest for analysis. ...... 126
Figure 8.2. Regional mass of rugby sevens (A) and rugby union (B) backs and forwards as a
proportion of DXA-derived whole-body mass ...................................................................... 132
Figure 8.3. Principal component scores of rugby union and rugby sevens backs and forwards
for fat (A), non-osseous lean (B) and bone mineral (C) mass distribution ............................ 136
Figure 9.1. Standardised differences in activity profiles between training activities and
international rugby sevens matches ....................................................................................... 149
Figure 9.2. Standardised differences in distance covered per min in specified velocity zones
between training activities and international rugby sevens matches ..................................... 150
Figure 9.3. Standardised differences in heart rate variables and performance efficiency index
between training activities and international rugby sevens matches ..................................... 151
Figure A-1. Timeline of key nutrition guidelines for a typical tournament schedule. ........... 216
xvi
List of Tables
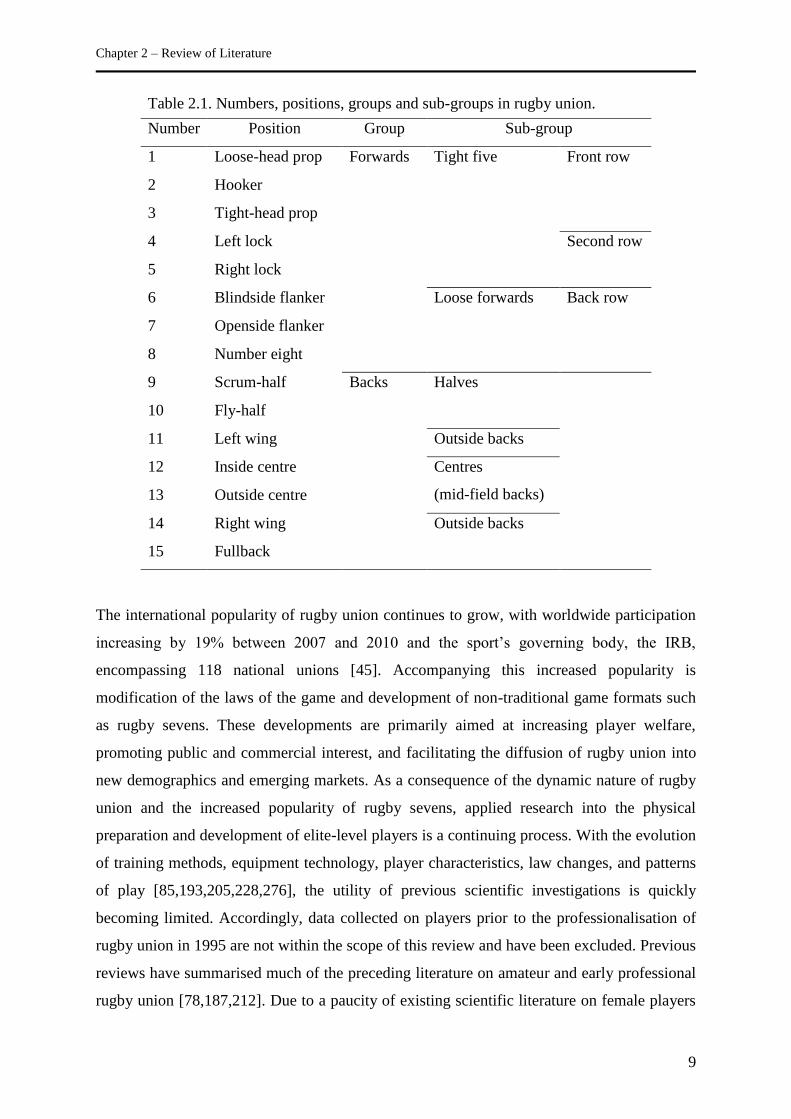
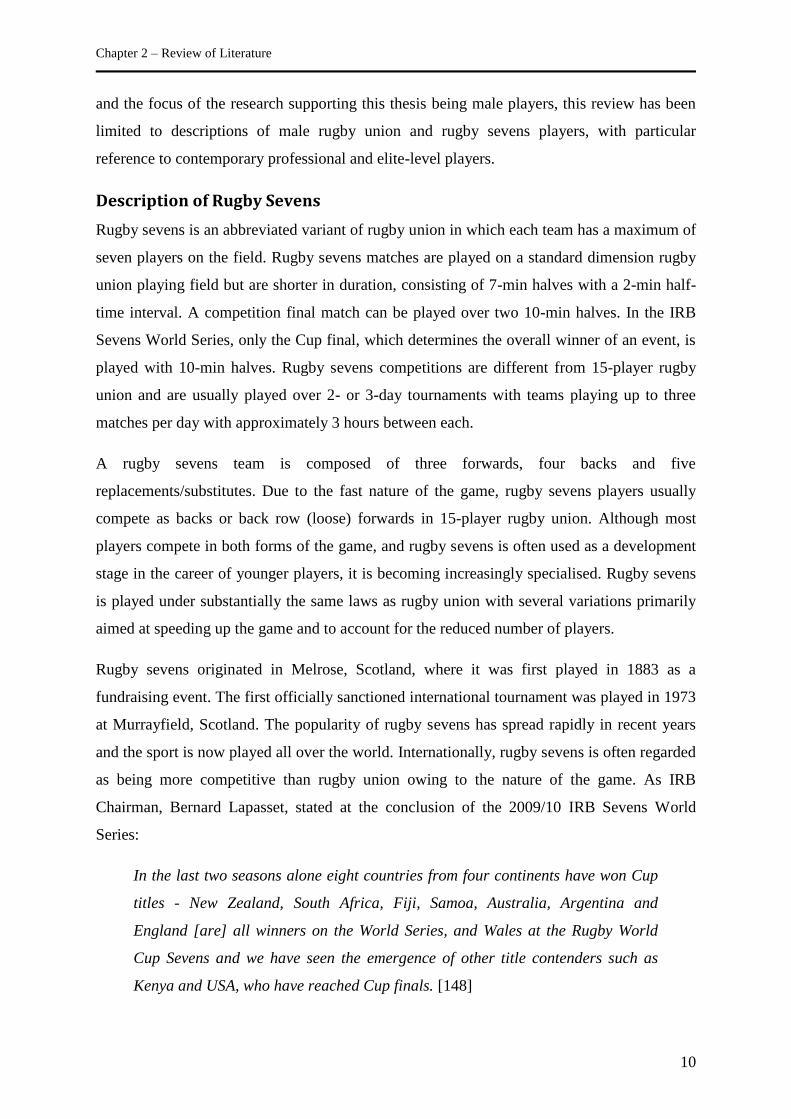
Table 2.1. Numbers, positions, groups and sub-groups in rugby union. ................................... 9
Table 2.2. Number and magnitude of impacts in rugby sevens and professional rugby union
matches .................................................................................................................................... 22
Table 2.3. Blood lactate concentration of rugby union and rugby sevens players during
competition. ............................................................................................................................. 27
Table 2.4. Changes in creatine kinase concentration following rugby union matches. ........... 29
Table 2.5. Body mass of international rugby union and rugby sevens players ....................... 34
Table 2.6. Height of international rugby union and rugby sevens players .............................. 35
Table 2.7. Sum of seven or eight skinfolds thickness and lean mass index of professional
rugby union players.................................................................................................................. 37
Table 2.8. Absolute and relative maximal oxygen uptake (V̇O2max) or peak oxygen uptake
(V̇O2peak) of professional rugby union players ......................................................................... 40
Table 2.9. Peak power output during the bench throw of professional rugby union players .. 46
Table 2.10. Peak power output during the countermovement jump of professional rugby
union players ............................................................................................................................ 47
Table 2.11. Maximum vertical jump height of professional rugby union players ................... 49
Table 3.1. Rugby sevens team performance indicators. .......................................................... 58
Table 3.2. Rugby sevens team performance indicator values per team per match .................. 62
Table 4.1. Reference values for international rugby sevens tournament performance
indicators .................................................................................................................................. 76
Table 5.1. Categories of team performance indicators in rugby sevens. ................................. 86
Table 5.2. Rugby sevens annual team ranking and annual team mean performance indicators,
expressed as averaged counts per match unless otherwise stated, in the International Rugby
Board Sevens World Series ..................................................................................................... 89
xvii
Table 6.1. Movement patterns during domestic and international rugby sevens tournaments.
................................................................................................................................................ 100
Table 6.2. First and second half movement patterns of players that contested a full match. 101
Table 6.3. Second half movement patterns of players that contested a full match and
substitute players on the field for less than 4 min. ................................................................. 102
Table 7.1. Anthropometric characteristics of international rugby sevens players ................. 113
Table 7.2. Performance and physiological characteristics of international rugby sevens
players .................................................................................................................................... 114
Table 7.3. Associations between anthropometric, physiological and performance
characteristics of international rugby sevens players ............................................................. 115
Table 7.4. Associations between physiological and performance characteristics of
international rugby sevens players ......................................................................................... 116
Table 8.1. Differences in absolute regional tissue mass between forwards and backs in rugby
union and rugby sevens. ......................................................................................................... 129
Table 8.2. Differences in relative regional tissue mass between forwards and backs in rugby
union and rugby sevens. ......................................................................................................... 131
Table 8.3. Principal components of combined relative regional fat, non-osseous lean and bone
mineral mass. ......................................................................................................................... 134
Table 9.1. Movement and physiological load variables (mean ± SD) for forwards (n = 14
players, 162 observations) and backs (n = 18 players, 144 observations) during 22
international rugby sevens matches. ...................................................................................... 148
Table A-1. Practical nutrition guidelines to optimise performance during an international
rugby sevens tournament. ...................................................................................................... 215
Table B-1. Movement patterns relative to playing time. ....................................................... 225
xviii
Publications by the Candidate Relevant to the Thesis
Higham, D.G., Hopkins, W.G., Pyne, D.B., & Anson, J.M. (2014). Performance indicators
related to points scoring and winning in international rugby sevens. Journal of Sports Science
and Medicine, 13(2), 358-364.
Higham, D.G., Hopkins, W.G., Pyne, D.B., & Anson, J.M. (2014). Relationships between
rugby sevens performance indicators and international tournament outcomes. Journal of
Quantitative Analysis in Sports, 10(1), 81-87.
Higham, D.G., Hopkins, W.G., Pyne, D.B., & Anson, J.M. (2014). Patterns of play
associated with success in international rugby sevens. International Journal of Performance
Analysis in Sport, 14(1), 111-122.
Higham, D.G., Pyne, D.B., Anson, J.M., & Eddy, A. (2012). Movement patterns in rugby
sevens: effects of tournament level, fatigue and substitute players. Journal of Science and
Medicine in Sport, 15(3), 277-282.
Higham, D.G., Pyne, D.B., Anson, J.M., & Eddy, A. (2013). Physiological, anthropometric
and performance characteristics of rugby sevens players. International Journal of Sports
Physiology and Performance, 8(1), 19-27.
Higham, D.G., Pyne, D.B., Anson, J.M., Dziedzic, C.E., & Slater, G.J. (2014). Distribution
of fat, non-osseous lean and bone mineral mass in international Rugby Union and Rugby
Sevens players. International Journal of Sports Medicine. (in press).
Higham, D.G., Pyne, D.B., Anson, J.M., Hopkins, W.G., & Eddy, A. (2013). Comparison of
activity profiles and physiological demands between international rugby sevens matches and
training. Journal of Strength and Conditioning Research. (in press).
Dziedzic, C.E. & Higham, D.G. (2014). Performance nutrition guidelines for international
rugby sevens competition. International Journal of Sport Nutrition and Exercise Metabolism.
(in press).
Higham, D.G., Pyne, D.B., & Mitchell, J.A. (2012). Protocols for the physiological
assessment of rugby union players. In: R.K. Tanner & C.J. Gore (eds), Physiological Tests
for Elite Athletes (2nd ed.). Champaign, Illinois: Human Kinetics.
xix
Vickery, W. Dascombe, B., Duffield, R., Baker, J., Higham, D.G., & Spratford, W. (2013).
Accuracy and reliability of GPS devices for measurement of sports-specific movement
patterns related to cricket, tennis and field-based team sports. Journal of Strength and
Conditioning Research. (in press).
Conference Presentations by the Candidate Relevant to
the Thesis
Pyne, D.B., Petersen, C., Higham, D.G., & Cramer, M.N. Comparison of 5- and 10-Hz GPS
technology for team sport analysis. American College of Sports Medicine 57th Annual
Meeting, 1-4 June, 2010, Baltimore, USA.
Higham, D.G. Current GPS use in rugby sevens. GPS and Elite Sport Workshop, 17-18
June, 2010, Canberra, Australia.
Higham, D.G., Pyne, D.B., Anson, J.M., & Eddy, A. Running movement patterns in rugby
sevens football. 7th World Congress on Science and Football, 26-30 May, 2011, Nagoya,
Japan.
Higham, D.G., Pyne, D.B., & Anson, J.M. What physical and performance qualities
characterise elite rugby sevens players? 17th Annual Congress of the European College of
Sport Science, 4-7 July, 2012, Bruges, Belgium.
Pyne, D.B., Higham, D.G., Clarke, A., Mitchell, J., & Eddy, A. Comparison of fitness
characteristics between men’s and women’s rugby sevens players. American College of
Sports Medicine 59th Annual Meeting, 29 May-2 June, 2012, San Francisco, USA.
Higham, D.G. On the road to rugby sevens gold in Rio: Performance analysis and elite
player development. ACT Science and Medicine in Sport Conference, 9-10 February, 2013,
Canberra, Australia.
Higham, D.G. Applied physiology in rugby sevens: Performance analysis and elite player
development. Australian Rugby Union National Coaching Conference, 3 July, 2013, Sydney,
Australia.
xx
Acknowledgements
“If I have seen further, it is by standing on the shoulders of giants” - Sir Isaac Newton
It is with great pleasure that I acknowledge and thank all of those that made this thesis
possible. Firstly, I would like to thank the Australian Institute of Sport, University of
Canberra and Australian Rugby Union for providing me with the opportunity to undertake
this PhD programme. It has been a challenging yet rewarding journey and I would not have
reached the destination without the support of many individuals to whom I am sincerely
grateful.
Prof. David Pyne – Pyney, my sincerest thanks for your academic support and guidance.
Thank you for your continued patience, prompt and valuable feedback, and for always having
an open door when some sound advice was needed. I am truly appreciative to have learnt so
much under your mentorship. You have my utmost respect and gratitude.
Dr. Judith Anson – Judith, thank you for everything you have done for me, academically and
personally. Without your support and input this research would not have the same quality and
impact. It is a rare quality to be as dedicated to your students as you are, and for your
assistance and contribution, I thank you.
Prof. Will Hopkins – Will, to say that your contribution “almost certainly” had a “very large
beneficial” effect on this thesis would be understating your work! Thank you for inviting me
into your home and for investing your time in my research and professional development as a
scientist. Your attention to detail and passion for science are inspiring. I learn so much from
each of our exchanges and I look forward to many more in the future.
Prof. Chris Gore and Marilyn Dickson – Chris and Maz, thank you for your kindness,
generosity and support during my time at the Australian Institute of Sport. I appreciate all of
the opportunities I have been given in the past few years. It has been a pleasure to work in
such a great environment.
Australian Rugby Union staff and athletes – A special thank you to the coaches, support staff
and athletes who made this research possible. Thank you in particular to Michael O’Connor,
John Mitchell and Luca Liussi. At times applied research can be an imposition and it may not
always be easy to immediately see the benefits. Thank you for your support.

xxi
Colleagues at the Australian Institute of Sport – Over the past five years it has been an
absolute pleasure and privilege to work alongside you. Thank you all for your willingness to
help, to share, and to teach. To my colleagues and true friends that have helped me during
every step of my PhD journey, thank you for your support, belief, passion, enthusiasm and
reassurance, for your banter, and for your alacrity to share much-needed caffeine.
Finally, thanks Mum, for your enduring support, encouragement and love during this long
venture. I hope you are proud of what I have accomplished.
Chapter 1 – Introduction
1
Chapter One - Introduction
Rugby union is an international field-based team sport characterised by frequent physical
contact and repeated intermittent bouts of high-intensity activity. Success in the sport at an
elite level requires well-developed physical and physiological characteristics, technical
expertise in a diverse range of skills, perceptual and strategic awareness, and the ability to
implement team tactics. The development of players to compete on the international stage
therefore, also necessitates a multifaceted and competition-specific approach to concurrently
improve players’ physical, physiological, technical, and tactical capabilities.
Despite an increase in global popularity and competitiveness, and the importance of player
development for performance, the evidence base of applied research has failed to keep pace
with the increased professionalism in rugby union and its abridged format, rugby sevens.
Although previous research has attempted to quantify rugby union and rugby sevens activity
profiles during competition [207,241], characterise the anthropometric and physiological
qualities of players [78], and assess training interventions [4,110], the changing demands of
competition and the need for practical applications of scientific research warrant
contemporary investigation. Furthermore, in parallel with the changing demands of
competition and physical preparation programmes, there have also been developments in the
methods available for data collection and analysis. For example, it is now possible to
concurrently quantify a player’s heart rate, physical impacts, distance covered, and velocity
in real time without interference to the training and match environment [12,65]. Progressive
methods of data analysis and interpretation now allow for the practical as well as statistical
significance of empirical findings to be quantified [141]. The coalition of these factors
highlights the need for a comprehensive assessment of the competition demands and
technical and physical development of elite-level players, especially in the emerging sport of
rugby sevens.
Although greater professionalism in rugby union has stimulated scientific interest, there
remains a paucity of information on the specific requirements for player development in
rugby sevens. Differences in the competition demands between rugby union and rugby
sevens suggest the requirements of an evidence-based technical and physical preparation
programme will also differ [175]. The simple application of elite-level player development
programmes for rugby sevens based on the needs of rugby union competition is
Chapter 1 – Introduction
2
inappropriate. The development and implementation of a rugby sevens-specific development
programme should be primarily dictated by the demands of competition. The technical,
tactical and physiological demands of competition can be evaluated by monitoring elite-level
performance [213] and profiling international-level players to identify key characteristics
specific to the sport [172]. Once the demands of competition have been established, the
specificity of talent identification and development programmes, and training practices, can
be explored and optimised. The explicit physical and physiological outcomes of training
activities may be compared to those of competition to help guide physical preparation
programmes [128]. To date, no published investigations have examined the typical training
practices of rugby sevens players. Although the specialisation of player development towards
either rugby union or rugby sevens has increased in recent years, many fundamental areas of
technical and physical preparation require further rigorous scientific investigation.
Statement of the Problem
Little information exists on the requirements for optimal individualised development and
preparation programmes for international-level rugby sevens players. Establishing such
programmes requires an evidence-based approach addressing the technical, tactical, physical,
and physiological priorities to meet the demands of competition. The conception and delivery
of competition level-specific preparation programmes relies on an understanding of the
demands of competition and the requirements for success. The limited scientific literature
detailing rugby sevens players and competition leaves coaches and support staff to currently
rely on personal experience and anecdotal reports when planning player preparation
programmes.
The key performance indicators and patterns of play related to successful team performance
in contemporary rugby sevens competition are not well understood. Despite match statistics
on international competitions being available to coaching and support staff, it is unclear
which performance indicators are most important for monitoring team performance. To date,
there are no thorough published retrospective investigations of team performances, needed
for successful preparation and prediction of competition outcomes. Given the inherently
variable nature of rugby sevens, it is difficult for coaches to address the technical and tactical
priorities for training without this knowledge.
The global increase in popularity of rugby sevens has seen a corresponding increase in the
number of tournaments played at the domestic and international level. For rugby sevens
Chapter 1 – Introduction
3
players and coaches, the transition from the domestic to international stage is an important
consideration. To date, there is no scientific review of the likely differences in movement
patterns between international- and domestic-level tournaments. Unlike rugby union, which is
typically played in a seasonal league-style competition format, rugby sevens competitions are
played in a tournament-style format involving up to six matches played over two or three
days. The potential effect of accumulated fatigue on players’ movement patterns over
multiple matches within and between competition days has not been examined.
Although the physical characteristics and physiological capacities of rugby union players
have been reported [78], this information is not available on rugby sevens players. A
comprehensive understanding of the anthropometric, physiological and performance
characteristics of elite-level rugby sevens players, and how they differ from professional
rugby union players, is needed to guide talent identification and development programmes,
individualise training prescription and injury prevention programmes, and facilitate the
transition of players to the more specialised sevens format. Sport-specific strength and
conditioning programmes rely on an understanding of the association between the
anthropometric and fitness attributes of players. This association is currently unknown in
rugby sevens players. Furthermore, at present there is a gap in understanding of the
relationships between cross-sectional player evaluations in the laboratory and in the field, and
on-field monitoring of training and competition.
Given the traditional crossover of players and coaches between rugby union and rugby
sevens, it is not uncommon for training activities typical of rugby union to be used to prepare
rugby sevens players. This approach may be inappropriate as the competition demands and
requirements for positional group-specific physical development in international rugby
sevens differ markedly to rugby union [175]. The effectiveness and specificity of training
drills used to concomitantly improve the physical, physiological, technical and tactical
capabilities of players has not been scientifically scrutinised.
Aims
The specific aims of the experimental studies contained within this thesis are to:
Competition Analysis
1. Identify key performance indicators related to successful rugby sevens performance.
Chapter 1 – Introduction
4
2. Develop models for rugby sevens match performance prediction using team
performance indicators.
3. Identify the relationship between team performance indicators and international rugby
sevens tournament outcomes.
4. Identify specific technical and tactical factors (patterns of play) associated with
success in international rugby sevens.
5. Quantify the differences in movement patterns between international and domestic
rugby sevens tournaments.
6. Quantify changes in movement patterns within and between rugby sevens matches.
7. Assess the movement patterns of late-match substitute players in rugby sevens
matches.
Player Selection and Development
8. Profile the physiological, anthropometric and performance characteristics of national-
level rugby sevens players, and compare these results with previously published
values for rugby union players.
9. Quantify the relationships between anthropometric, physiological and performance
test results in national-level rugby sevens players.
10. Quantify and compare the distribution of fat, non-osseous lean and bone mineral mass
in international rugby union and rugby sevens players.
Specificity of Training
11. Examine the positional group-specific specificity of contemporary rugby sevens
training practices in relation to the demands of competition.
Significance of the Thesis
The findings of this thesis have a direct and practical application for the analysis of
contemporary rugby sevens performance and delivery of player development programmes.
The examination of current competition and training performance should allow for more
effective individualisation of training and recovery programmes. The outcomes of the
investigations contained within this thesis will guide player development programmes for
technical and physical preparation as well as the priorities of national coaching curricula.
Furthermore, the research findings will assist the direction of sport-specific talent
identification and development systems.
Chapter 1 – Introduction
5
By quantifying the specific demands of training drills, coaching and support staff may
implement strategies designed to maximise training effectiveness. Given the limited time
available to players and coaches for training and physical development, the efficiency of
training must be optimised to minimise the risks to players’ health and performance without
compromising training adaptations. Understanding movement patterns and physiological
demands of various training drills, and the disparity between training and match demands
afforded by this thesis, provide a useful scientific framework for coaches in prescribing
periodised training programmes.
Synopsis of the Thesis
This thesis contains eleven chapters. Each experimental chapter of the thesis (chapters three
to nine) is presented in manuscript format according to the requirements of the scientific
journal to which it was submitted, with corresponding Abstract, Introduction, Methods,
Results and Discussion sections. Consequently, there is some repetition between chapters in
the thesis. Experimental chapters vary from the published articles in some sections due to
minor editorial changes and the addition of supplementary information. For the reader’s
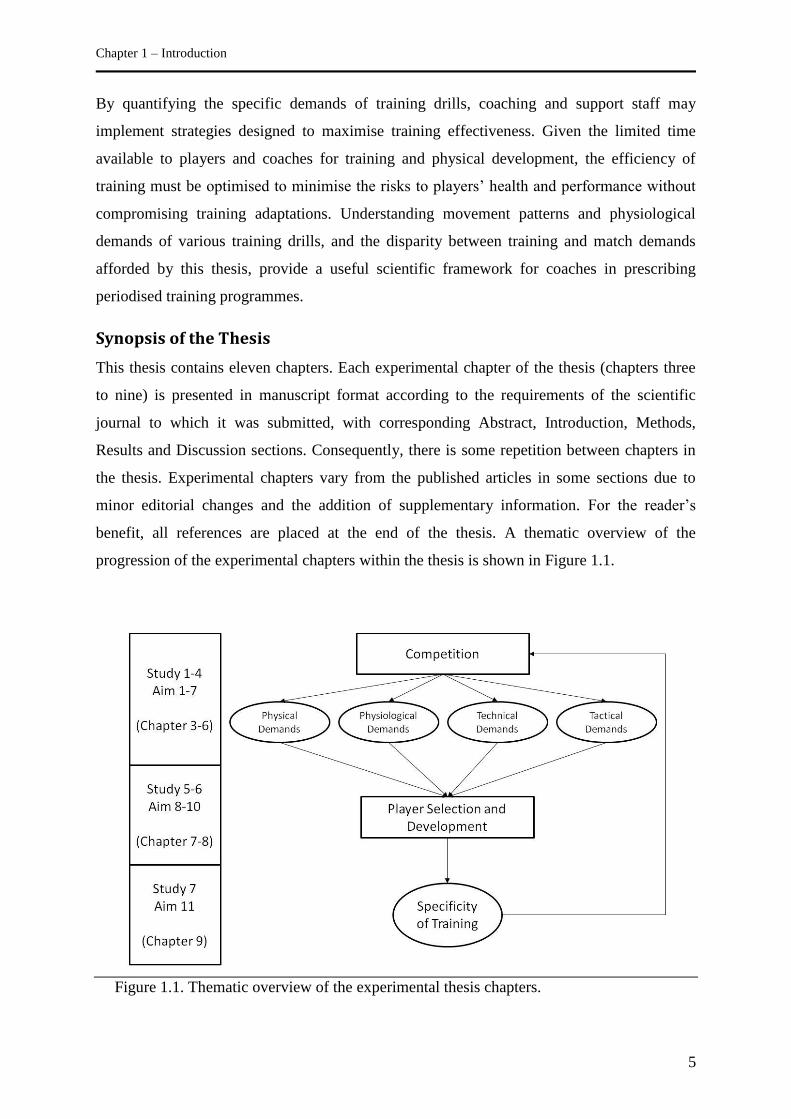
benefit, all references are placed at the end of the thesis. A thematic overview of the
progression of the experimental chapters within the thesis is shown in Figure 1.1.
Figure 1.1. Thematic overview of the experimental thesis chapters.
Chapter 1 – Introduction
6
Following Chapter One – Introduction, Chapter Two – Review of Literature details a
contemporary review of the major applied physiology and performance topics relating to
rugby union and rugby sevens. The review includes an introduction and background of rugby
union and rugby sevens, details of performance analysis in rugby union, physical
characteristics and physiological capacities of rugby players and associations with
performance, and a summary of physical development and training interventions.
Chapter Three – Performance Indicators Related to Points Scoring and Winning in
International Rugby Sevens examines the team statistics of international rugby sevens
matches to identify which technical performance indicators are best associated with team
performance. Key performance indicators are used to develop models to predict the number
of points scored by a team and the likelihood of victory in close matches.
Chapter Four – Relationships between Rugby Sevens Performance Indicators and
International Tournament Outcomes investigates the association between performance
indicators of international rugby sevens teams and their final ranking in tournaments.
Chapter Five – Patterns of Play Associated with Success in International Rugby Sevens
explores the association between the tactics and patterns of play adopted by teams over the
course of an international season and their final ranking in the International Rugby Board
(IRB) Sevens World Series.
Chapter Six – Movement Patterns in Rugby Sevens: Effects of Tournament Level, Fatigue and
Substitute Players documents a comprehensive analysis of the activity profiles of players
during domestic- and international-level matches using Global Positioning System (GPS)
technology. Movement patterns are analysed using magnitude-based statistics to make
inferences on the practical applications of results, specifically relating to competition level-
specific preparation, the effects of acute and residual fatigue, and tactical considerations to
mitigate the effects of fatigue on team performance.
Chapter Seven – Physiological, Anthropometric and Performance Characteristics of Rugby
Sevens Players and Chapter Eight – Distribution of Fat, Non-osseous Lean and Bone Mineral
Mass in International Rugby Union and Rugby Sevens Players profiles the characteristics and
capacities of rugby sevens players and how these characteristics and capacities compare to
those of professional rugby union players. In conjunction with the examination of
Chapter 1 – Introduction
7
competition demands outlined in previous chapters, chapters seven and eight define the
priorities for physical development of elite-level rugby sevens players.
Chapter Nine – Comparison of Activity Profiles and Physiological Demands between
International Rugby Sevens Matches and Training examines the specificity of different types
of on-field training in a cohort of international rugby sevens players. This investigation
should assist the development of sport-specific training drills to provide physical and
physiological stimuli similar to those observed during competition. Coaching staff can use
the results of the study to mediate the stress placed on players by increasing the specificity
and intensity, and reducing the volume, of training.
Chapter Ten – Discussion reviews the impact of this thesis and its importance in the
progression of knowledge in the area of applied physiology in elite-level rugby sevens.
Chapter Eleven – Research Outcomes presents the primary findings of the thesis, practical
outcomes and applications of the new knowledge, limitations of the research, and directions
for future research in the area.
The thesis is supported by additional work presented in the appendices. The appendices
include a review manuscript submitted for publication that details the physique characteristics
and training patterns of international-level rugby sevens players, the physical and
physiological demands of competition and subsequent practical nutritional guidelines likely
to enhance performance during international tournaments (Appendix A). Also included in the
appendices are international scientific conference presentation abstracts that describe the
competition movement patterns in rugby sevens (Appendix B) and the physical and
performance qualities of rugby sevens players (Appendix C), compare the fitness
characteristics of male and female players (Appendix D), and compare the validity and
reliability of GPS devices for measuring sprint distances in team-sport athletes (Appendix E).
Chapter 2 – Review of Literature
8
Chapter Two - Review of Literature
Evolution of Rugby Union
Rugby union is a contact, field-based team sport played by over five million people around
the world [45]. A match is played over 40-min halves with a short break between, during
which teams exchange ends of the field. Two teams begin each match with 15 players on the
field who may be substituted (tactical) or replaced (injury) during the match. Each team may
nominate up to seven or eight replacement/substitute players depending on the level of
competition. Players are classified into two main groups based on playing position and their
role within the team. The “forwards” are player numbers 1 to 8 and the “backs” are numbered
9 to 15 (Table 2.1). The principal function of forwards is to contest possession in set-piece
plays as well as rucks and mauls, while the role of backs is to use possession to gain territory
and score points. When not in possession, backs attempt to prevent the opponents from
gaining territory and scoring through tackling. In Australia, the typical competition season is
contested between February and September with usually one or, at most, two matches played
in any 7-day period.
Chapter 2 – Review of Literature
9
Table 2.1. Numbers, positions, groups and sub-groups in rugby union.
Number Position Group Sub-group
1 Loose-head prop Forwards Tight five Front row
2 Hooker
3 Tight-head prop
4 Left lock Second row
5 Right lock
6 Blindside flanker Loose forwards Back row
7 Openside flanker
8 Number eight
9 Scrum-half Backs Halves
10 Fly-half
11 Left wing Outside backs
12 Inside centre Centres
(mid-field backs)
13 Outside centre
14 Right wing Outside backs
15 Fullback
The international popularity of rugby union continues to grow, with worldwide participation
increasing by 19% between 2007 and 2010 and the sport’s governing body, the IRB,
encompassing 118 national unions [45]. Accompanying this increased popularity is
modification of the laws of the game and development of non-traditional game formats such
as rugby sevens. These developments are primarily aimed at increasing player welfare,
promoting public and commercial interest, and facilitating the diffusion of rugby union into
new demographics and emerging markets. As a consequence of the dynamic nature of rugby
union and the increased popularity of rugby sevens, applied research into the physical
preparation and development of elite-level players is a continuing process. With the evolution
of training methods, equipment technology, player characteristics, law changes, and patterns
of play [85,193,205,228,276], the utility of previous scientific investigations is quickly
becoming limited. Accordingly, data collected on players prior to the professionalisation of
rugby union in 1995 are not within the scope of this review and have been excluded. Previous
reviews have summarised much of the preceding literature on amateur and early professional
rugby union [78,187,212]. Due to a paucity of existing scientific literature on female players
Chapter 2 – Review of Literature
10
and the focus of the research supporting this thesis being male players, this review has been
limited to descriptions of male rugby union and rugby sevens players, with particular
reference to contemporary professional and elite-level players.
Description of Rugby Sevens
Rugby sevens is an abbreviated variant of rugby union in which each team has a maximum of
seven players on the field. Rugby sevens matches are played on a standard dimension rugby
union playing field but are shorter in duration, consisting of 7-min halves with a 2-min half-
time interval. A competition final match can be played over two 10-min halves. In the IRB
Sevens World Series, only the Cup final, which determines the overall winner of an event, is
played with 10-min halves. Rugby sevens competitions are different from 15-player rugby
union and are usually played over 2- or 3-day tournaments with teams playing up to three
matches per day with approximately 3 hours between each.
A rugby sevens team is composed of three forwards, four backs and five
replacements/substitutes. Due to the fast nature of the game, rugby sevens players usually
compete as backs or back row (loose) forwards in 15-player rugby union. Although most
players compete in both forms of the game, and rugby sevens is often used as a development
stage in the career of younger players, it is becoming increasingly specialised. Rugby sevens
is played under substantially the same laws as rugby union with several variations primarily
aimed at speeding up the game and to account for the reduced number of players.
Rugby sevens originated in Melrose, Scotland, where it was first played in 1883 as a
fundraising event. The first officially sanctioned international tournament was played in 1973
at Murrayfield, Scotland. The popularity of rugby sevens has spread rapidly in recent years
and the sport is now played all over the world. Internationally, rugby sevens is often regarded
as being more competitive than rugby union owing to the nature of the game. As IRB
Chairman, Bernard Lapasset, stated at the conclusion of the 2009/10 IRB Sevens World
Series:
In the last two seasons alone eight countries from four continents have won Cup
titles - New Zealand, South Africa, Fiji, Samoa, Australia, Argentina and
England [are] all winners on the World Series, and Wales at the Rugby World
Cup Sevens and we have seen the emergence of other title contenders such as
Kenya and USA, who have reached Cup finals. [148]
Chapter 2 – Review of Literature
11
Rugby sevens has become popular in nations which are not traditionally successful in the 15-
a-side format. Development in nations where rugby union has a lesser profile has often
focussed on rugby sevens as a means of introducing people to the sport.
The growing worldwide popularity of rugby sevens was highlighted in October, 2009 when
the International Olympic Committee voted to include rugby sevens on the sporting
programme for the 2016 Summer Olympic Games in Rio de Janeiro, Brazil. The introduction
into the Olympic Games compliments other multisport events where rugby sevens is
currently contested such as the Commonwealth Games, Asian Games, Pacific Games and
World Games. Other major international rugby sevens tournaments include the IRB Sevens
World Series and the Rugby World Cup Sevens. The men’s IRB Sevens World Series is
contested annually over nine rounds played in various locations around the world. The Rugby
World Cup Sevens is held every four years. Following the 2013 tournament in Moscow,
Russia, the quadrennial Rugby World Cup Sevens event will be integrated into the middle of
the Olympic cycle, with the next tournament to take place in 2018.
Performance Analysis in Rugby Union
Performance analysis is a relatively new sub-discipline of sports science primarily related to
the observation and deconstruction of an individual player or team performance. Accurate
examination and evaluation of performance is a key component of successful coaching.
Consequently, the role of performance analysts in supporting coaching staff is becoming
more prevalent with the assistance of increasingly sophisticated technology. Success in team
sports such as rugby union and rugby sevens relies upon the consistent execution of
performance through the development of technical, strategic, physiological, and
psychological factors. Performance analysis in these sports is principally focused on the
technical and strategic domains using notational analysis, and the physiological domain
through time-motion analysis.
Notational Analysis
Notational analysis is a method used to objectively and reliably quantify critical moments in a
performance [143]. Many aspects of rugby union performance, from individual players
[37,150,164] to team units and entire teams [152,153,165,260], have been characterised using
notational analysis. Of particular interest to sports scientists and coaches are the “set-piece”
elements of performance, such as line-outs and scrums, as well as the offensive
[35,75,161,165,259,272,273] and defensive structures, patterns, and outcomes [257,258].
Chapter 2 – Review of Literature
12
Many performance analysis studies have attempted to identify tactics and technical skill
executions associated with scoring tries and team success [35,75,161,165,259]. These studies
highlight a variety of tactics and playing styles that teams may employ with equal
effectiveness. The playing styles associated with successful team outcomes not only differ
between competitions, but also within tournaments [259]. Despite these variations, there are
common elements of performance at either an individual player or team level more often
predictive of success. These elements are commonly termed “performance indicators”.
Performance analysis research is often used as a vehicle to identify key performance
indicators in team sports such as rugby union and rugby sevens.
Performance indicators
A performance indicator is a variable, or combination of variables, that attempts to explain
some aspect of performance [146]. To be useful and representative of a performance,
performance indicators should be related to a successful performance or outcome, and are
often expressed as a ratio or normalised relative to a predetermined value to facilitate
comparisons within and between teams or individuals. Performance indicators can be
subcategorised into four types: match classification indicators, technical indicators, tactical
indicators, and biomechanical indicators.
Match classification indicators define the nature of the match by reporting the frequency of
key structural events. These indicators describe the overall performance and are most
appropriately interpreted in relation to the opponents’ values and previous performances at a
similar standard. Examples of match classification indicators in rugby union are tries,
penalties and drop goals (successful and unsuccessful), line-outs, scrums, and incursions into
the opponents’ 22-metre zone.
A technical indicator reflects the relative success in execution of a specific skill. The
frequency of success or error in technical skill performance is typically normalised against
the total frequency of skill executions and reported as a ratio or percentage. Examples of
technical indicators include successful conversions, tackles missed, passes completed, and
scrum possessions retained.
Tactical indicators illustrate the decision-making options taken by a player, unit, or team
based on their technical strengths and weaknesses, thereby reflecting the style or patterns of
play employed. In rugby union it is possible to quantify, and express in either percentages or
ratios, the options taken to kick, run, or pass the ball when in possession. Other performance
Chapter 2 – Review of Literature
13
indicators representing a team’s chosen style of play include the number of rucks or passes
per min of possession. These values typically reveal the preference for a team to employ
either a direct or wide attacking approach.
The ability of teams to successfully employ a strategy or tactic is constrained by their
capacity to accurately execute individual skills. Biomechanical indicators are used to describe
and assess the technique of an individual or group performing a skill. Despite the rich
information the assessment of the technique of skill execution could add to other outcome-
focused measures, the use of biomechanical performance indicators in rugby union research
is limited [130,206,208,222,272,273]. Biomechanical indicators vary from descriptive to the
kinetics and kinematics of skill performance. Examples include the analysis of ball release
velocity, to analysis of energy transfer, joint forces and moments, and sequencing of joint
movements. Skills that may benefit from further quantitative and qualitative analysis of
technique include scrummaging, tackling, passing, kicking, and line-out lifting, jumping and
throwing.
Investigations of contact skills of rugby union players have provided insight on the technical
predictors of success in the tackle contest. In attack, strong contact intensity and active
fending strategies predicted 86% of poor defensive positions, with 92% of tackle breaks
occurring as a result of poor defensive positioning [272]. Players are also more likely to be
successful in the tackle and produce a positive phase outcome when receiving the ball at
higher speeds, running with greater intensity, and adopting either an oblique running pattern
or a forward step evasion pattern [223]. Furthermore, higher-ranked teams had a larger
percentage of tackle breaks, higher ball reception speeds and greater running intensity than
lower-ranked teams [223,273]. Conversely, forward lean of the tackler’s torso and an oblique
angle of approach to the ball-carrier were more prevalent characteristics of effective tackles
resulting in a net loss or zero gain in attacking territory from the time of contact to the
completion of the tackle [257]. The number of tackle attempts varies between positional
groups and between competitions, even at the international level [258]. These differences
presumably reflect variations in playing style and the unique role of individual playing
positions in influencing the frequency, velocity, and type of tackle attempted.
Researchers have attempted to validate key performance indicators in rugby union and rugby
sevens by investigating their relationship with performance outcomes, such as tournament
rankings, or examining the differences in performance indicator values between winning and
Chapter 2 – Review of Literature
14
losing teams [144,145,153,195,202,263,264]. A case study of twenty matches of one
professional team in a domestic league revealed statistically significant differences between
winning and losing performances for the percentage of line-outs won on opposition’s throw,
and the percentage of tries scored out of the total tries scored [153]. Differences not
statistically significant but possibly of practical importance were observed for turnovers and
errors made. The performance indicators discriminating between winning and losing teams
vary depending on the specific competition and how close or balanced the match is
[263,264]. Analyses of 58 matches over four seasons of the Six Nations tournament (2003 to
2006) demonstrated several key differences in performance indicators between winning and
losing teams [195]. Briefly, winning teams lost less possession during scrums and line-outs,
won more turnovers and mauls, completed more tackles, kicked more frequently, and made
more line breaks.
The limited research investigating performance indicators in rugby sevens shows that
successful teams are dominant in defence as well as offence [144]. Successful teams appear
to play a different style of game from unsuccessful teams. Successful teams obtained more
territory and possession, performed fewer rucks, mauls and kicks, and executed more dummy
passes, sidesteps, swerves, and clean breaks. The possession advantage of successful teams
resulted in fewer tackles being made, but also fewer missed tackles than unsuccessful teams.
However, the application of these findings from matches played in 2001 to modern
international-level rugby sevens is uncertain given the rapid evolution of the sport in recent
years. More recently, a regression analysis of the mean performance indicator value per
match over seven tournaments of the IRB Sevens World Series revealed tries per match,
rucks per match, and passes per match accounted for 93% of the variance in the team’s final
ranking [145].
Despite the range of analyses of rugby union performance, critical gaps still remain in the
knowledge of successful performance and application of methods to prepare players for
competition. Research outcomes for coaching may benefit from investigation of individual
elements of performance, and the amalgamation of performance indicators to give a more
complete summary of team structures and strategies. Given advancements in measurement
and analysis technology, off-the-ball player formations and player interactions and
coordination can be studied to further explain rugby performance and aid player preparation
[53,197,198]. It is also evident there is a lack of published information available on rugby
sevens performance. There is great potential for the progression of performance analysis
Chapter 2 – Review of Literature
15
research in rugby sevens competition to expand the knowledge of performance and coaching
in this sport.
Time-motion Analysis
Time-motion analysis is a method used to quantify the dynamic movement patterns and
energetic demands of training and competition. Time-motion analysis simplifies the
inherently variable and intermittent activity of players in team sports by quantifying and
categorising the movement type, intensity, frequency, and duration (and/or distance). The
objective information provided by this analysis method can be directly applied to the design
of sport- and position-specific physical preparation and testing programmes. There is a
growing body of literature on the movement characteristics of contemporary professional
rugby union competition [13,14,42,54,68,80,84,207,220,242]. However, only limited
published data exist detailing the physical and physiological demands of men’s rugby sevens
matches [115,216,239,241]. The collection of data on international-level rugby sevens
players would greatly assist in accurately establishing the demands of competition.
Traditionally, rugby union time-motion analyses have been conducted using manual or
computer-assisted notational analysis techniques [13,80]. Technological advancements now
allow more sophisticated data collection and analysis methods to be used, including semi-
automated player tracking systems [207] and micro-sensor technology such as GPS devices
[12,65]. These methods have advantages over conventional notational analysis techniques
including being substantially less labour-intensive, faster analysis and feedback times, greater
objectivity, and improved accuracy and reliability, collectively making newer analysis
methods a more viable option.
Validity and reliability of time-motion analysis
The validity and reliability of a measurement system is an important consideration when
interpreting data collected during training or competition. Concurrent validity refers to the
agreement between an observed value and the true or criterion value of a measurement,
whereas test-retest reliability refers to the reproducibility of a value when a measurement is
repeated [139]. A measurement system unable to produce accurate and consistent data has
little use in the evaluation of sports performance. The interpretation of movement analysis
data is dependent upon the reliability of the measurement method and estimations of the
variability within and between players from observation to observation [79].
Chapter 2 – Review of Literature
16
The validity and reliability must be established for each measurement technique used.
Reliability and/or validity estimates have been derived for a variety of time-motion analysis
techniques including computer-assisted and hand-notational analyses [73,74,79,139], a
manual digitising analysis method [217], manual computer-based tracking [128], semi-
automated player tracking [207], and GPS technology [12]. The intra-tester reliability of
notational analysis, quantified as the typical error of measurement (TE) [139], of total
duration spent in specific movements of stationary, walking, jogging, striding, sprinting, and
static exertion are moderate to poor (5.8 to 11.1%), frequency of movements are good to poor
(4.3 to 13.6%), and mean duration of movements are moderate (7.1 to 9.3%) [79]. Other
studies using similar methods also report the intra-tester reliability (TE) of frequency of
movements (1.2 to 4.6%), total duration (2.9 to 1.8%), mean duration (4.8%), percentage of
total match duration in a specific movement type (4.3 to 1.6%), and percentage of total
distance covered in specific movement types (3.7%) [13,73]. Inter-tester reliability is similar
for all measures (0.4 to 8.7%) [13,73].
The validity and reliability of time-motion analyses estimating distances covered by players
as the product of velocity, measured separately during different movement intensities
(walking to sprinting) using timing gates, and time, measured by notational analysis, have
also been reported. Validity estimates range from r = 0.74 to 0.94 for estimates of total
distance covered at a variety of velocities, and r = 0.45 to 0.98 for estimates of mean distance
covered [74]. Reliability estimates range from 1.7 to 4.9% standard error for estimated total
distance and 1.9 to 4.9% standard error for mean distance [74]. The validity estimated for a
manual digitising method, reported as a coefficient of variation, is within 2.1% for total
distance covered and 8.3% for mean velocity [217]. Intra- and inter-tester reliability (TE) is
0.5% and 0.9%, respectively, for total distance, and 3.4% and 6.0%, respectively, for mean
velocity [217]. These estimates are similar to the 6% intra- and inter-tester reliability reported
for computer-based tracking [128].
More sophisticated methods are becoming increasingly common in the measurement and
analysis of rugby union and rugby sevens players’ activity profiles. For example, semi-
automated multiple-camera player tracking technologies offer a high degree of accuracy, with
position data averaging between ±0.14 to 0.20 m, and a sampling frequency of 2 Hz or higher
[84,207]. The practical advantages of micro-technology worn by players to monitor heart
rate, physical impacts, distance covered, and velocity without interference to the training or
match environment, and provide feedback in real time, means it is being increasingly adopted
Chapter 2 – Review of Literature
17
for player monitoring and research purposes. Reviews of the reliability, validity, and
applications of GPS technology for measuring activity in field sports are described elsewhere
[12,65]. However, it appears the validity of GPS measurements is enhanced with an increase
in sampling frequency and longer measurement duration. Devices with a low sampling
frequency (1 Hz) may be unable to accurately measure high-velocity activity performed over
a short duration. This limitation is critical given the intermittent nature of field-based team
sports. The reliability of GPS device measurements is also task- and time-dependent, with
higher movement velocities and movements involving changes of direction showing poorer
reliability. Newer GPS devices have sufficient accuracy to quantify instantaneous velocity,
even during periods of acceleration and deceleration [262].
In the absence of a “gold standard” time-motion analysis method, all of the described
techniques are capable of determining players’ movement patterns and work rates.
Furthermore, a video-based time-motion analysis system, a semi-automated multiple-camera
player tracking system, and GPS systems detect similar performance decrements during
competition [211]. However, substantial differences in absolute measurement values suggest
comparisons of information from different movement analysis systems require caution
[124,211].
Movement patterns
Differences in match and environmental conditions, changes to the laws of the game, and
variations in methodology make direct comparisons between research findings of player
movement patterns difficult. However, it is clear from previous studies of rugby union
players that substantial differences in movement patterns and activity profiles are evident
between positions [207]. These disparities primarily relate to the playing roles of forwards
and backs. Distinctions in the specific demands of individual positional groups should be
acknowledged when structuring training and recovery programmes around competition.
The total distance covered by a player contesting an entire professional rugby union match
ranges between approximately 4500 to 7500 m, with backs generally covering greater
distances than forwards [13,42,54,68,220]. In relative terms, rugby union backs also cover
greater distances per min (~71 to 74 m·min-1
) than forwards (~65 to 68 m·min-1
) [42,54,68].
In contrast, club-level rugby sevens players covered 1581 ± 146 m (mean ± SD; range 1349
to 1976 m) during an entire match [241]. If the distance travelled by rugby sevens players
during a single match is normalised to an 80-min rugby union match, the total distance
Chapter 2 – Review of Literature
18
covered would be approximately 9000 m. This theoretical extrapolation demonstrates the
increased running intensity of rugby sevens competition, even at the sub-elite level. The
distance covered by players during active (ball in play) time in international Rugby union
matches varies between 3700 m for props to 4500 m for scrum-halves [207]. Players in
various positions are stationary for between 9 and 15% of this active time. In both rugby
union and rugby sevens, the majority of the total distance covered during a match is at a
walking or jogging pace [13,42,54,68,207,220,239,241,242]. Rugby union backs spend more
time walking (38 to 46%) than forwards (27 to 35%), while outside backs spend the greatest
proportion of match time walking of all positional groups (43 to 62%) [80,84,220].
Conversely, backs tend to cover the greatest distance sprinting [13,54,68,84,220].
The mean duration of sprints during rugby union competition is approximately 2 to 4 s
[73,83]. Mean sprint distances vary by position but are typically less than 20 m
[14,68,74,84,242]. The mean sprint distance reported for backs (19.5 ± 6.5 m) and forwards
(17.9 ± 3.6 m) in club-level rugby sevens matches is similar to that in rugby union [239].
However, comparisons between studies should be interpreted with caution because of
differences in objective and more subjective methods of analysis, and varying definitions of a
“sprint”. Despite the relatively short typical sprint durations in rugby union matches, players
also regularly achieve speeds in excess of 90% maximal velocity [83].
Professional rugby union forwards spend approximately 2.5 times longer in high-intensity
activity than backs [13,72,80,84,220]. The substantially greater high-intensity activity of
forwards is attributable to more time involved in set-piece plays (scrums and line-outs) and
contests for the ball (rucks and mauls) [13,72,73,80,84,207,220]. Set-piece plays and
elements of the game involving collisions with opponents, namely rucks, mauls, and tackles,
are critical components of a rugby union match. Rucks, mauls and scrums account for up to
11 ± 4% of match time for back-row forwards [80]. The same activities for backs account for
>2% of total time [80,220]. As a proportion of time spent in high-intensity activity, forwards
spend up to 90% in static exertion [72,73,220]. In contrast, between approximately 30 and
60% of high-intensity exercise in backs comprises running-based movements [72,220]. Back-
row forwards typically complete more tackles than other positional groups, averaging up to
20 or more per match [80,84,207]. During an international rugby union match, forwards
usually contest more than 30 rucks, whereas backs are rarely involved in more than half this
number [207]. International-level forwards also usually contest around 25 scrums per match,
with a mean duration of approximately 3 s from engagement to the completion of each scrum,
Chapter 2 – Review of Literature
19
either through the ball being picked up by a player or the referee blowing the whistle for an
infringement [207]. International-level forwards are typically engaged in around 3.5 min of
scrums, rucks and mauls per match [207]. The total involvement of backs at the same level is
less than 1 min per match. The mean duration for both backs and forwards of each scrum,
ruck, or maul is 3 to 4 s.
The marked differences in the movement patterns and relative time spent in specific velocity
zones between positional groups and individual positions in professional rugby union players
are unsurprising given the diversity in playing roles. Forwards cover greater distances at low
to moderate velocity resulting from more continuous activity, given their higher involvement
and proximity to contests for the ball. The movement patterns and technical demands are
distinct even between sub-groups of backline players. The scrum-half and fly-half handle and
pass the ball more than any other positions, with the scrum-half handling the ball on 59 ± 10
occasions during an international match [207]. Scrum-halves cover the greatest distance of all
positions at a velocity of 4 to 6 m·s-1
[207]. In contrast, outside backs make less tackles than
other positions and spend a large proportion of match time in off-the-ball activities which is
reflected by the large distances covered walking and in utility movements (lateral or
backward walking and shuffling) [73,80,84,207,220]. When outside backs are involved in
play, they cover large distances sprinting to support other players, cover in defence, gain
territory, and score tries [73,80,84,207,220].
Quantifying the work-to-rest ratios of competition provides valuable and objective
information for the development of competition-specific physical preparation programmes.
Comparisons between reports of work-to-rest ratios and the frequency and duration of efforts
in the literature are confounded by differences in the definitions and methodologies
employed. Mean work-to-rest ratios in professional rugby union matches vary from 1:4 for
forwards [13] to 1:22.8 for outside backs [73] using video-based time-motion analysis
methods, and 1:7.5 for back-row forwards to 1:14.6 for outside backs using a semi-automated
multiple-camera player tracking system [84]. Using GPS technology, reports of mean work-
to-rest ratios vary from 1:0.8 [242] to 1:5.8 [68]. Work-to-rest ratios reported for men’s rugby
sevens competitions were derived solely on locomotion using GPS technology. Work-to-rest
ratios were 1:0.5 [241] to 1:0.59 [239] based on movement at 0 to 1.67 m·s-1
classified as rest
and movements greater than a velocity of 1.69 m·s-1
classified as work.

Chapter 2 – Review of Literature
20
Differences in methodology and definitions make comparisons of the frequency and duration
of work bouts difficult to interpret. The frequency of work periods for Super 12 rugby union
players varied from 42 ± 9 (mean ± SD) periods per match for outside backs to 129 ± 28 for
front-row forwards in one study [73] and 55 ± 10 for outside backs to 127 ± 20 for back-row
forwards in another [80]. One study of English Premiership players reported 203 ± 24 high-
intensity work bouts per match for outside backs with up to 275 ± 44 for back-row forwards
[84], whereas another study reports a range of 102 for fly-halves and centres to 154 for loose
forwards [220]. The mean duration of work bouts varies between positions and between
studies from 1 to 6 s [73,80,84,220]. The short duration of work periods implies a significant
reliance on anaerobic metabolism. Rest periods between work bouts are typically <20 s for
most positional groups, whereas outside backs have substantially longer rest periods (>100 s)
[80]. Short rest periods may be insufficient to allow full recovery of creatine phosphate
stores, increasing the reliance on anaerobic glycolysis and oxidative metabolism [74,112].
Although most rest periods are relatively short, stoppages in play can increase the maximum
rest time to between 3 and 7 min for different positions [73].
Descriptions of the mean work-to-rest ratios may be of limited use in preparing players for
the most demanding passages of play. Analysis of the frequency, duration, and nature of
repeated high-intensity exercise involving three or more sprints, and/or tackles, and/or scrum,
ruck or maul activities within a 21 s period in the 2008 and 2009 Super 14 rugby union
season revealed the most intense periods of play were likely to exceed 120 s in duration with
as little as 25 s recovery separating consecutive repeated-effort bouts [14]. There were
significant variations in the frequency, duration, and nature of repeated high-intensity
exercise efforts between positional groups. The number of repeated bouts in a single match
ranged from 2 for outside backs to 21 for back-row forwards. Front- and back-row forwards,
fly-halves and centres averaged one repeated high-intensity activity bout every 6 min, while
outside backs averaged one bout every 10 min. The duration of the single longest repeated
high-intensity exercise bouts ranged from 53 s for an outside back to 165 s for a back-row
forward. The minimum recovery period between repeated bouts ranged from 25 s for a back-
row forward to 64 s for front-row forwards.
Tactical player substitutions
One aspect of modern rugby union and rugby sevens competition that has received little
attention is tactical player substitutions. Since changes to the laws of the game in 1996
allowing the substitution of players for tactical purposes at the coach’s prerogative, there has
Chapter 2 – Review of Literature
21
been a substantial decrease in the mean time each player spends on the field and a
concomitant increase in the number of players contesting each rugby union match [205]. In
90 international rugby union matches played by the New Zealand national team and their
opponents between 2004 and 2010, hookers were the most frequently, and openside flankers
the least frequently, substituted forwards (40%, 33 to 49%; rate difference, 90% confidence
interval) [207]. In the backs, scrum-half was the most frequently substituted position, and left
wing the least substituted (60%, 53 to 67%). Although there is variability between positions,
most substitute players contest approximately 21 min of a rugby union match [207]. The
dearth of research investigating the effects of player substitutions in rugby union and rugby
sevens is surprising given the intense nature of matches likely to result in fatigue that impacts
performance, and observations of differences in work-rates of starting and substitute players
in other field-based team sports [43,181].
Frequency and magnitude of impacts
The recent allowance of wearable micro-sensors incorporating accelerometers during
competition has facilitated the quantification of the number and intensity of impacts
experienced by players. The sensitivity of this technology allows the measurement of all
impacts performed by the player above a specified threshold. As such, the results of this
measurement should be interpreted with caution as the number of impacts does not
necessarily equate to the number of collisions with the ground or opposing players, but may
also incorporate heavy foot-strike impacts and changes of direction while running [104].
Nevertheless, the measurement of impacts provides important information for coaches and
support staff of the mechanical load on players during training and competition.
The number of impacts measured during a rugby sevens or rugby union match is proportional
to the magnitude of impacts (Table 2.2). As expected based on their positional roles, forwards
experience more impacts than backs in rugby union, but the differences in impacts between
backs and forwards are unclear in rugby sevens players [239]. Data from a larger sample of
players are required to confirm the magnitude of positional differences and their application
to the development of position-specific physical preparation programmes. A study of under-
19 rugby union players found back-row forwards had the highest number of total impacts
during matches, and outside backs the least [265]. However, fly-halves and centres
experienced the highest number of severe impacts (>10 g) and front-row forwards the least.
Additional data are required to more clearly define differences in the number and magnitude
of impacts on players at different levels of competition.
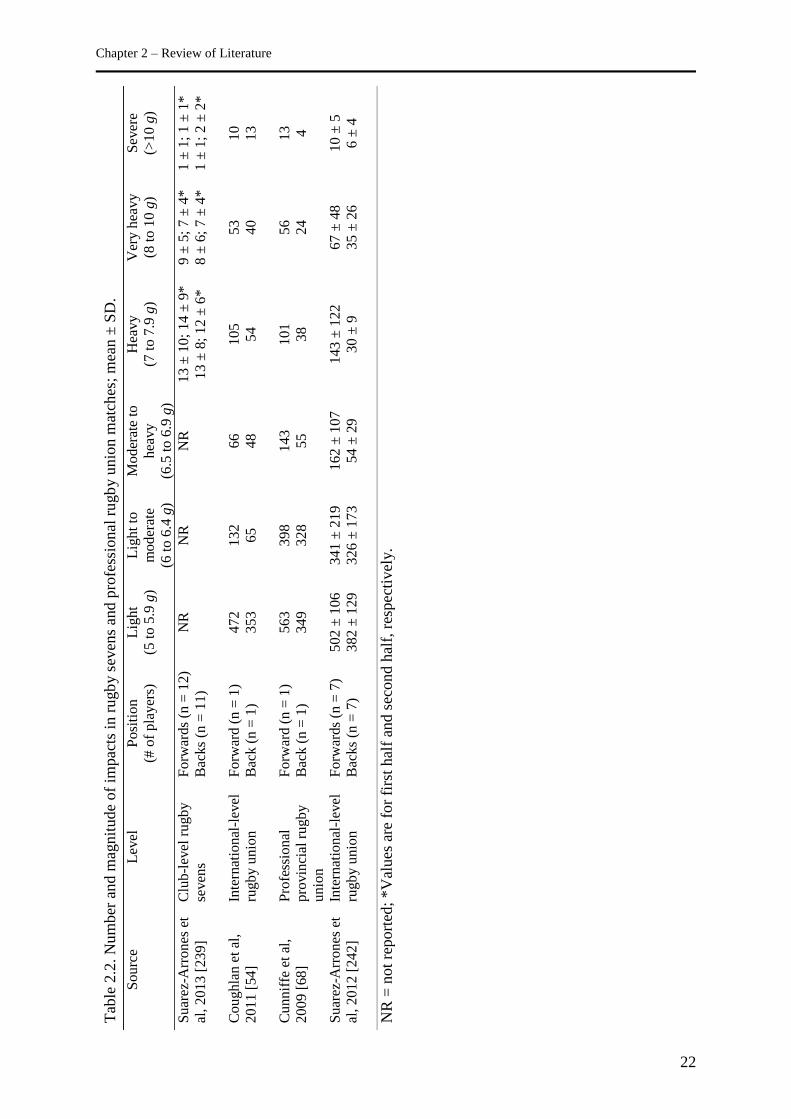
Chapter 2 – Review of Literature
22
T
able
2.2
. N
um
ber
and m
agnit
ude
of
impac
ts i
n r
ugb
y s
even
s an
d p
rofe
ssio
nal
rugb
y u
nio
n m
atch
es;
mea
n ±
SD
.
Sourc
e L
evel
P
osi
tio
n
(# o
f pla
yer
s)
Lig
ht
(5 t
o 5
.9 g
) L
igh
t to
moder
ate
(6 t
o 6
.4 g
)
Mo
der
ate
to
hea
vy
(6.5
to 6
.9 g
)
Hea
vy
(7 t
o 7
.9 g
) V
ery h
eavy
(8 t
o 1
0 g
) S
ever
e (>
10
g)
Suar
ez-A
rrones
et
al,
2013
[239
] C
lub
-lev
el r
ugb
y
seven
s F
orw
ards
(n =
12)
Bac
ks
(n =
11)
NR
N
R
NR
1
3 ±
10
; 1
4 ±
9*
13
± 8
; 1
2 ±
6*
9 ±
5;
7 ±
4*
8 ±
6;
7 ±
4*
1 ±
1;
1 ±
1*
1 ±
1;
2 ±
2*
Coughla
n e
t al
,
2011 [
54
] In
tern
atio
nal
-lev
el
rugb
y u
nio
n
Forw
ard (
n =
1)
Bac
k (
n =
1)
472
353
132
65
66
48
10
5
54
53
40
10
13
Cunnif
fe e
t al
,
2009 [
68
] P
rofe
ssio
nal
pro
vin
cial
ru
gb
y
un
ion
Forw
ard (
n =
1)
Bac
k (
n =
1)
563
349
398
328
143
55
10
1
38
56
24
13
4
Suar
ez-A
rrones
et
al,
2012 [
242
] In
tern
atio
nal
-lev
el
rugb
y u
nio
n
Forw
ards
(n =
7)
Bac
ks
(n =
7)
502 ±
106
382 ±
129
341 ±
219
326 ±
173
162 ±
10
7
54 ±
29
14
3 ±
12
2
30
± 9
6
7 ±
48
35
± 2
6
10
± 5
6
± 4
NR
= n
ot
report
ed;
*V
alues
are
for
firs
t hal
f an
d s
econd h
alf,
res
pec
tivel
y.
Chapter 2 – Review of Literature
23
The measurement of impacts by accelerometer confirms the trend of contacts quantified in
professional provincial rugby union matches by notational analysis [256]. Although the
methodological differences lead to a lower total number of impacts for the entire team when
quantified by notational analysis (386, 307 to 535; mean, range), forwards were still involved
in more impacts than backs. The most frequent type of impact for the entire team was contact
with the ground (108, 70 to 133). Positional differences in the frequency and magnitude of
impacts during rugby union matches are the result of greater involvement of forwards in
contact situations with the ball and in competing for the ball. Preliminary notational analysis
of club-level rugby sevens matches demonstrated that while the number of rucks contested
was similar between positional groups, forwards made a substantially larger number of
tackles or tackle attempts than backs (7.4 ± 1.8 vs. 4.1 ± 2.4) [239].
The positional differences in contact-related activity may partially explain the higher bone
mineral density and bone mass in rugby union forwards than backs [90]. Rugby union players
have enhanced axial and appendicular skeletal mass and increased bone turnover relative to
age- and ethnicity-matched controls as a consequence of adaptation to the bone deformations
due to vibration and strain induced by muscle contractions and a high frequency of impacts
[90]. An understanding of the mechanical stress elicited by impacts can assist coaches and
support staff in structuring the volume and intensity of position-specific training and
recovery. These findings also highlight the importance of implementing a monitoring system
to quantify the contact demands of training and competition.
Differences between levels of competition
Only one study has explored differences in movement patterns between club-level and
professional rugby union competition. Although clear differences were present between
backs and forwards, there were minimal differences in activities of players between club-
level competition in New Zealand and professional Super 12 matches assessed with time-
motion analyses [72]. Super Rugby is the premier provincial rugby union competition in the
southern hemisphere. The Super 12 was contested between 1996 and 2005 before the
expansion of the Super Rugby competition. No significant differences were observed
between the activities of forwards in Super 12 matches and first division club matches. In
contrast, compared with club-level backs, Super 12 backs performed fewer work efforts
(defined as cruising, sprinting, tackling, jumping, rucking, mauling, and scrummaging) per
match (55 ± 11 vs. 47 ± 9, respectively), had a longer mean rest (inactive, walking, jogging,
or lateral or backwards shuffling) period between work bouts (78.0 ± 3.5 s vs. 99.5 ± 3.5 s,
Chapter 2 – Review of Literature
24
respectively), and spent greater time in utility movements (2.3 ± 1.0% vs. 3.7 ± 2.0%,
respectively). No significant differences were observed between competition levels for total
work duration (forwards ~10 and backs ~4 min per match). The utility of the previous
comparison between club-level and professional matches for contemporary competition is
questionable, given the observed increase from 2001 and 2002 to 2008 and 2009 in high-
intensity activity, sprint frequency, and work-to-rest ratio for all playing positions in Super
Rugby [13].
Although methodological differences may confound direct comparisons of movement
patterns observed during professional and international rugby union, international
competition appears to be played at a higher intensity than lower-level professional
competition [207]. The increase in intensity is represented by a greater distance travelled at
higher velocities and a corresponding reduction in the distance covered at lower velocities
during international matches. Analyses of the movements of all players from both teams
during 27 international matches revealed players typically ran (>4 m·s-1
) between 107 and
249 m further per match than reported for one team of professional players during six
professional matches [84,207]. The same analyses of international competition showed
players travelled between 220 m (for tight forwards) and 570 m (for fly-halves and centres)
further per match at high-intensity or maximal velocity (>5 m·s-1
) than professional English
Premiership players [220].
The differences in technical requirements between varying levels of competition require
further analysis [266]. As with movement patterns, differences in the technical performance
profiles of players vary by position. Variation in the frequency of scrums, line-outs, tackles,
rucks, and mauls in international and professional domestic matches likely represent both
modified physical and technical demands between the different levels of competition, as well
as differences in the tactics and playing styles adopted by teams competing in different
competitions. No published research has examined the differences in movement patterns or
technical actions between domestic or club-level and international rugby sevens competition.
Physiological Responses to Competition
In conjunction with movement analysis, a variety of physiological parameters have been
measured to gauge the physical and metabolic demands of rugby union competition in the
professional era. Recent investigations have assessed haematological and biochemical indices
[18,114], such as changes in immune system function, metabolic disturbances, markers of
Chapter 2 – Review of Literature
25
muscle damage and inflammation [2,19,67,111,171,180,236,243-245], antioxidant status and
oxidative stress [93], and endocrine status [89,173], to establish the physiological responses
to competition. These, and other studies that have examined cardiovascular responses
[68,74,237,242] and fluid balance shifts [176,177] during competition, provide coaches and
support staff with valuable information on the physiology of the modern rugby player. This
knowledge can be applied to optimise the specific physical preparation of players for
competition and develop strategies that facilitate recovery and minimise the risk of injury or
overtraining.
Cardiovascular responses
Reports on heart rate information of rugby players during competition is limited, especially
for top-level players, potentially resulting from the logistical issues of taking accurate
measurements in a high-intensity collision sport without additional discomfort to the athlete.
Despite the acknowledged limitation that the use of heart rate measurements may be
inappropriate to assess intense, intermittent activity [167], the analysis of cardiovascular
responses may be used to estimate the work output during competition and training as a
function of the linear relationship between sub-maximal work rate and heart rate [1].
Customarily, heart rate data have been analysed by the relative time spent within standardised
intensity zones defined as a percentage of a player’s predetermined maximum [68,74,242].
A study of 24 under-19 rugby union players reported higher physiological stress in forwards
than backs, with forwards competing up to 20% of match time above 95% of their maximum
competition heart rate [74]. Forwards spent approximately 72% of the match at a heart rate
exceeding 85% of their maximum, whereas the backs spent a significantly larger proportion
of match time under 85% of their maximum (approximately 52 to 59%). These positional
differences were confirmed in a case study of a fly-half and back-row forward during one
professional UK team trial match [68]. In this match, the forward completed a larger
proportion of the match at >95% of maximum heart rate (15 vs. 5%), while the back spent
more time at a heart rate between 80 to 90% of maximum (28 vs. 42%). Throughout the
match, players averaged heart rates of approximately 85% of maximum.
Club-level rugby sevens players spent over 75% of matches with a heart rate exceeding 80%
of their predetermined maximum [239,241]. Players spent most match time between 81 and
90% of their maximum heart rate [239,241] and recorded peak values of 92 ± 4% of
predetermined maximum in one study [115], and 99 ± 2% in another [241]. Mean heart rates
Chapter 2 – Review of Literature
26
were similar for backs (86 ± 3% maximum heart rate) and forwards (86 ± 4% maximum heart
rate) [239]. One study showed a small increase for both groups in mean heart rate from the
first to second half, with backs spending a greater proportion of the second half at 91 to 95%
of maximum heart rate [239]. In contrast, two other studies showed no significant differences
in mean heart rate between match halves [115,241].
Recently, the validity of analysing heart rate data using standardised intensity zones has been
criticised due to potential errors in the estimates of exercise intensity and energy system
contributions as a result of individual differences in fitness levels, the degree of between-
player variability in exercise economy, and the somewhat arbitrary selection of intensity
thresholds based on maximum heart rate for all players [1,136]. In an attempt to overcome
these limitations, a study of 21 university-level rugby union players classified heart rate data
into low-, moderate-, and high-intensity zones based on values corresponding to the first and
second ventilatory thresholds of each player [237]. Using this approach, substantially more
time was categorised in the high-intensity zone than by analysis using other match analysis
methods (mean = 44% of total match time). The mean duration of high-intensity bouts was
77 ± 100 s (mean ± SD), interspersed with periods of low- and moderate-intensity activity of
29 ± 23 and 29 ± 15 s, respectively. Differences in heart rate responses between positional
groups were not examined.
Despite the potential influence of factors other than oxygen uptake, such as environmental
conditions, hydration status, psychological state, and muscle activation, affecting heart rate
response, collectively, measurements of movement patterns and cardiovascular system
responses suggest a large contribution from anaerobic energy pathways to support frequent
bouts of high-intensity activity. Given the intermittent nature of match activity and the
positional differences between backs and forwards, it appears there may be different
anaerobic and aerobic system demands for varying positions, at least in rugby union.
Blood lactate accumulation
Blood lactate concentration is commonly used as an indicator of exercise intensity by
signifying the magnitude of anaerobic glycolytic pathway contribution to adenosine
triphosphate (ATP) production in the myocyte [267]. There are currently no published reports
of blood lactate measurements in top-level players since rugby union became professional in
1995 and only one published report of domestic-level rugby sevens players [115]. There are
several limitations acknowledged with the measurement and interpretation of blood lactate
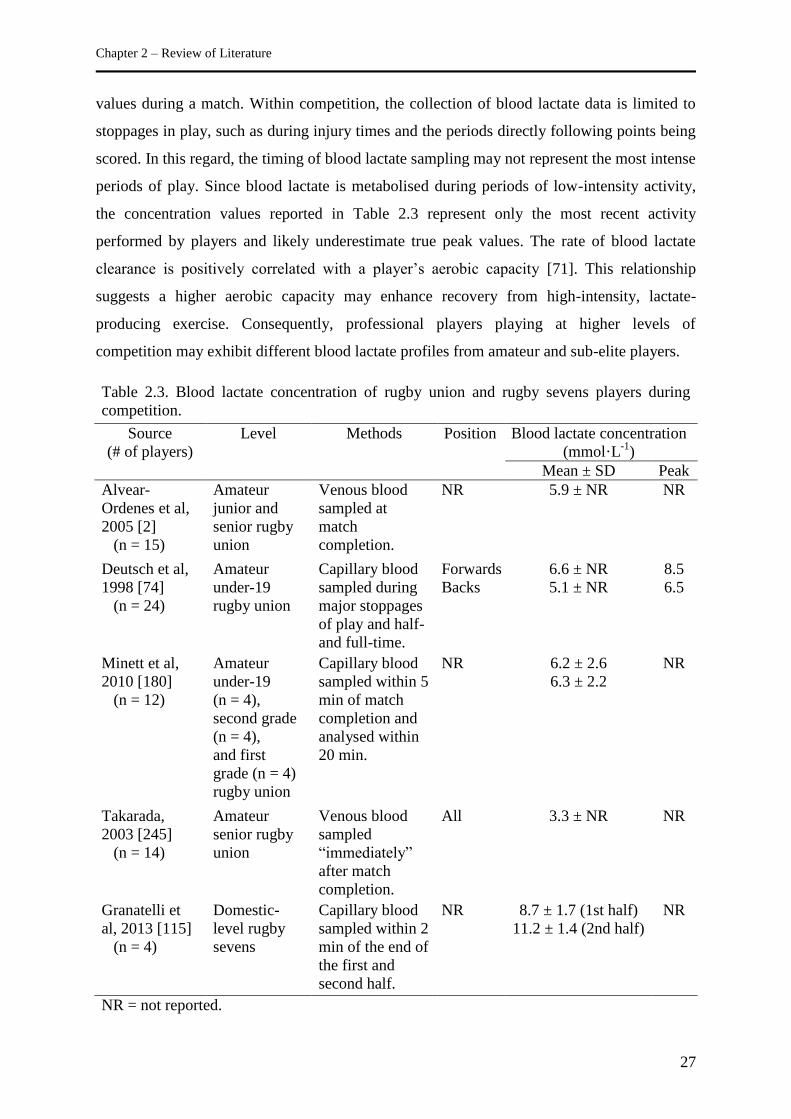
Chapter 2 – Review of Literature
27
values during a match. Within competition, the collection of blood lactate data is limited to
stoppages in play, such as during injury times and the periods directly following points being
scored. In this regard, the timing of blood lactate sampling may not represent the most intense
periods of play. Since blood lactate is metabolised during periods of low-intensity activity,
the concentration values reported in Table 2.3 represent only the most recent activity
performed by players and likely underestimate true peak values. The rate of blood lactate
clearance is positively correlated with a player’s aerobic capacity [71]. This relationship
suggests a higher aerobic capacity may enhance recovery from high-intensity, lactate-
producing exercise. Consequently, professional players playing at higher levels of
competition may exhibit different blood lactate profiles from amateur and sub-elite players.
Table 2.3. Blood lactate concentration of rugby union and rugby sevens players during
competition.
Source
(# of players)
Level Methods Position Blood lactate concentration
(mmol·L-1
)
Mean ± SD Peak
Alvear-
Ordenes et al,
2005 [2]
(n = 15)
Amateur
junior and
senior rugby
union
Venous blood
sampled at
match
completion.
NR 5.9 ± NR NR
Deutsch et al,
1998 [74]
(n = 24)
Amateur
under-19
rugby union
Capillary blood
sampled during
major stoppages
of play and half-
and full-time.
Forwards
Backs
6.6 ± NR
5.1 ± NR
8.5
6.5
Minett et al,
2010 [180]
(n = 12)
Amateur
under-19
(n = 4),
second grade
(n = 4),
and first
grade (n = 4)
rugby union
Capillary blood
sampled within 5
min of match
completion and
analysed within
20 min.
NR 6.2 ± 2.6
6.3 ± 2.2
NR
Takarada,
2003 [245]
(n = 14)
Amateur
senior rugby
union
Venous blood
sampled
“immediately”
after match
completion.
All 3.3 ± NR NR
Granatelli et
al, 2013 [115]
(n = 4)
Domestic-
level rugby
sevens
Capillary blood
sampled within 2
min of the end of
the first and
second half.
NR 8.7 ± 1.7 (1st half)
11.2 ± 1.4 (2nd half)
NR
NR = not reported.
Chapter 2 – Review of Literature
28
When information on blood lactate accumulation is combined with the information provided
by time-motion analyses and heart rate responses during rugby union and rugby sevens
competition, it appears there is a high reliance on anaerobic energy systems, both alactic and
glycolytic, to perform high-intensity activity. However, development of the aerobic system
should not be neglected, as oxidative phosphorylation is increasingly utilised during repeated
high-intensity efforts with limited recovery [112]. Aerobic metabolism also facilitates
resynthesis of creatine phosphate stores during longer periods of reduced-intensity activity.
Muscle damage
Elevated concentrations of muscle proteins and enzymes in the blood are indicative of
exercise-induced muscle damage [251,252]. Although other biomarkers are often reported,
such as myoglobin, glutamate oxaloacetate transaminase, glutamate pyruvate transaminase,
and lactate dehydrogenase, changes in creatine kinase concentration are most frequently
measured to indirectly indicate the magnitude of muscle damage. Both endogenous and
exogenous mechanisms are associated with muscle damage in multiple-sprints sports with
body contact. Intermittent high-intensity running typical of rugby matches results in a
significant increase in muscle damage and soreness, particularly from the eccentric loading
phase of muscle contraction [251]. Rugby union and rugby sevens matches are also
characterised by frequent heavy-load collisions. Increases in markers of muscle damage are
evident from repeated, direct muscle trauma from impacts with other players and with the
ground. Elevations in creatine kinase concentration observed after rugby union matches are
summarised in Table 2.4.
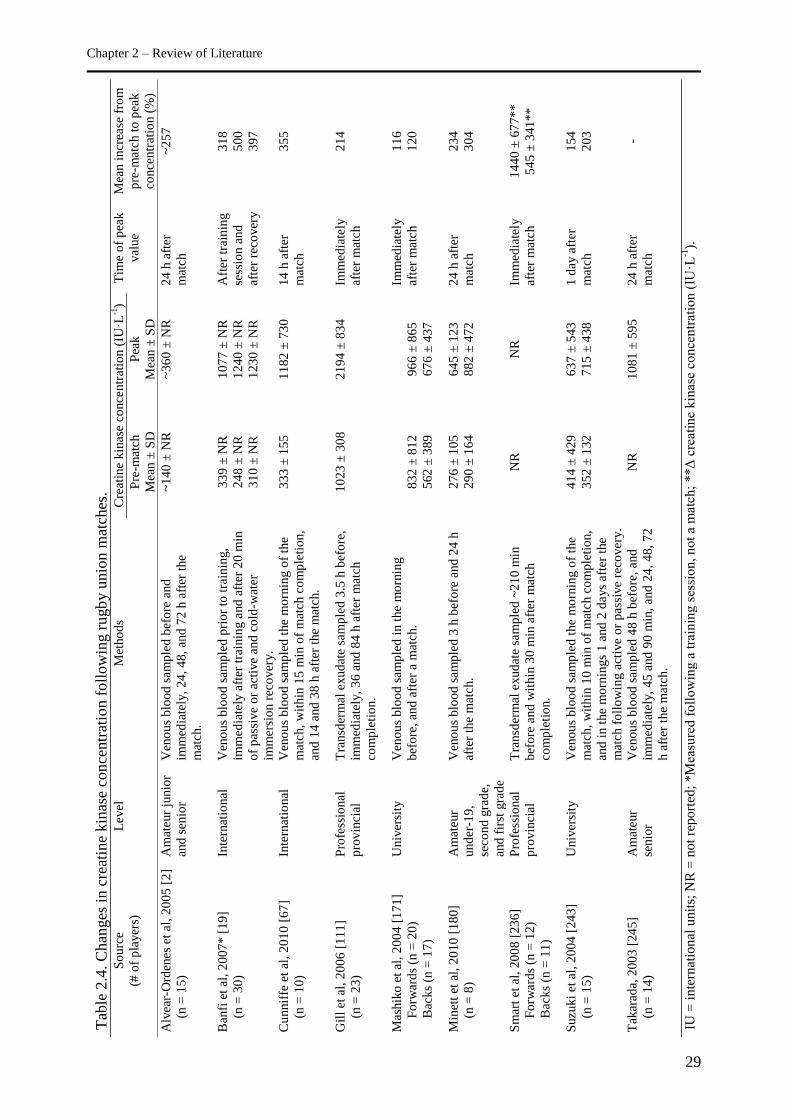
Chapter 2 – Review of Literature
29
Tab
le 2
.4. C
han
ges
in c
reat
ine
kin
ase
con
centr
atio
n f
oll
ow
ing r
ugb
y u
nio
n m
atch
es.
So
urc
e
(# o
f p
layer
s)
Level
M
etho
ds
Cre
atin
e kin
ase
conce
ntr
atio
n (
IU·L
-1)
Tim
e o
f p
eak
val
ue
Mea
n i
ncr
ease
fro
m
pre
-mat
ch t
o p
eak
conce
ntr
atio
n (
%)
Pre
-mat
ch
Mea
n ±
SD
Pea
k
Mea
n ±
SD
Alv
ear-
Ord
enes
et
al,
20
05
[2
]
(n =
15
)
Am
ateur
junio
r
and
sen
ior
Ven
ou
s b
loo
d s
amp
led
bef
ore
and
imm
edia
tely
, 2
4,
48
, an
d 7
2 h
aft
er t
he
mat
ch.
~1
40
± N
R
~3
60
± N
R
24
h a
fter
mat
ch
~2
57
Ban
fi e
t al
, 2
00
7* [
19
]
(n =
30
)
Inte
rnat
ional
V
eno
us
blo
od
sam
ple
d p
rio
r to
tra
inin
g,
imm
edia
tely
aft
er t
rain
ing a
nd
aft
er 2
0 m
in
of
pas
sive
or
acti
ve
and
co
ld-w
ater
imm
ersi
on r
eco
ver
y.
33
9 ±
NR
24
8 ±
NR
31
0 ±
NR
10
77
± N
R
12
40
± N
R
12
30
± N
R
Aft
er t
rain
ing
sess
ion a
nd
afte
r re
cover
y
31
8
50
0
39
7
Cu
nnif
fe e
t al
, 2
01
0 [
67
]
(n =
10
)
Inte
rnat
ional
V
eno
us
blo
od
sam
ple
d t
he
mo
rnin
g o
f th
e
mat
ch,
wit
hin
15
min
of
mat
ch c
om
ple
tio
n,
and
14
and
38
h a
fter
the
mat
ch.
33
3 ±
155
1
18
2 ±
73
0
14
h a
fter
mat
ch
35
5
Gil
l et
al,
20
06
[1
11]
(n =
23
)
Pro
fess
ional
pro
vin
cial
Tra
nsd
erm
al e
xud
ate
sam
ple
d 3
.5 h
bef
ore
,
imm
edia
tely
, 3
6 a
nd
84
h a
fter
mat
ch
com
ple
tio
n.
10
23
± 3
08
2
19
4 ±
83
4
Imm
edia
tely
afte
r m
atch
21
4
Mas
hik
o e
t al
, 2
00
4 [
17
1]
Fo
rwar
ds
(n =
20
)
Bac
ks
(n =
17
)
Univ
ersi
ty
Ven
ou
s b
loo
d s
amp
led
in t
he
mo
rnin
g
bef
ore
, an
d a
fter
a m
atch.
83
2 ±
812
56
2 ±
389
96
6 ±
865
67
6 ±
437
Imm
edia
tely
afte
r m
atch
11
6
12
0
Min
ett
et a
l, 2
01
0 [
18
0]
(n =
8)
Am
ateur
und
er-1
9,
seco
nd
gra
de,
and
fir
st g
rad
e
Ven
ou
s b
loo
d s
amp
led
3 h
bef
ore
and
24
h
afte
r th
e m
atch.
27
6 ±
105
29
0 ±
164
64
5 ±
123
88
2 ±
472
24
h a
fter
mat
ch
23
4
30
4
Sm
art
et a
l, 2
00
8 [
23
6]
Fo
rwar
ds
(n =
12
)
Bac
ks
(n =
11
)
Pro
fess
ional
pro
vin
cial
Tra
nsd
erm
al e
xud
ate
sam
ple
d ~
21
0 m
in
bef
ore
and
wit
hin
30
min
aft
er m
atch
com
ple
tio
n.
NR
N
R
Imm
edia
tely
afte
r m
atch
14
40
± 6
77
**
54
5 ±
341
**
Suzuk
i et
al,
20
04
[2
43
]
(n =
15
)
Univ
ersi
ty
Ven
ou
s b
loo
d s
amp
led
the
mo
rnin
g o
f th
e
mat
ch,
wit
hin
10
min
of
mat
ch c
om
ple
tio
n,
and
in t
he
mo
rnin
gs
1 a
nd
2 d
ays
aft
er t
he
mat
ch f
oll
ow
ing a
ctiv
e o
r p
assi
ve
reco
ver
y.
41
4 ±
429
35
2 ±
132
63
7 ±
543
71
5 ±
438
1 d
ay a
fter
mat
ch
15
4
20
3
Tak
arad
a, 2
003
[24
5]
(n =
14
)
Am
ateur
senio
r
Ven
ou
s b
loo
d s
amp
led
48
h b
efo
re,
and
imm
edia
tely
, 4
5 a
nd
90
min
, and
24
, 4
8,
72
h a
fter
the
matc
h.
NR
1
08
1 ±
59
5
24
h a
fter
mat
ch
-
IU =
inte
rnat
ional
unit
s; N
R =
not
report
ed;
*M
easu
red f
oll
ow
ing a
tra
inin
g s
essi
on, not
a m
atch
; **Δ
cre
atin
e k
inas
e co
nce
ntr
atio
n (
IU·L
-1).
Chapter 2 – Review of Literature
30
To date, only one study has investigated changes in markers of muscle damage in rugby
sevens players [244]. This study observed seven members of the Japanese national team
before and after two matches played on the same day with approximately 4 hours between
matches. Compared with the baseline serum creatine kinase concentration measurement (359
± 131 IU·L-1
), significantly higher concentrations were reported prior to (424 ± 140 IU·L-1
),
and then after (509 ± 184 IU·L-1
), the second match of the day. The ~27% elevation in
creatine kinase concentration from after the first to after the second match indicates a
cumulative effect of match activity. The cumulative rise in creatine kinase values even after
only a short exposure to match time is an important consideration for coaches and support
staff working with rugby sevens players, especially given these players may be required to
compete in up to six matches in 2 days. Indeed, following a rugby union match, creatine
kinase concentration may be elevated above pre-match values for up to 48 hours [2,245].
Sustained elevated measures of muscle damage and soreness and the associated decrements
in function and performance indicate the need to implement sport-specific recovery strategies
for seasonal rugby union competition and tournament-style rugby sevens competition [111].
Regardless of the stage of competitive season, 87% of creatine kinase concentration
measurements from a squad of professional rugby union players in France were higher than
the normal reference interval [114]. Observations of consistently elevated creatine kinase
concentrations in rugby union players and other sports have led to the suggestion that higher
resting creatine kinase values in athletes compared with non-athletes may require sport-
specific reference ranges [114]. Higher upper-limit reference ranges may be required for
athletes given their greater muscle mass and frequent training. Sport-specific reference values
would reduce the likelihood of physicians misdiagnosing high creatine kinase concentrations
as pathological and assist coaches in prescribing appropriate training and recovery.
The degree of muscle damage experienced during exercise is related to both the intensity and
duration of activity, with intensity having the greatest effect [252]. The one- to five-fold
increases in creatine kinase concentration following rugby union competition are related to
match time (r = 0.69 to 0.82), time defending (r = 0.72 to 0.74), number of tackles (r = 0.86
to 0.92), very high-intensity running distance covered in the second half (>5.56 m·s-1
, r = -
0.76), and total number of contact events (r = 0.71 to 0.78) [67,180,236,245]. In backs, large
correlations were also observed between creatine kinase changes and the number of hit-ups (r
= 0.74), and number of occasions the player was among one of the first three players to join a
ruck or maul in attack (r = 0.79) [236]. In forwards, pre- to post-match changes in creatine
Chapter 2 – Review of Literature
31
kinase concentration were also associated with the number of scrums performed (r = 0.73)
[236]. The increase in creatine kinase concentration following a rugby union match is
reportedly higher for forwards than backs [236]. This difference is likely the result of the
differing roles of backs and forwards and higher frequency of tasks involving collisions
performed by forwards [236].
In some instances, severe muscle damage results in trauma graded as an injury [245]. In one
documented case of a player that withdrew from competition 15 min into the second half due
to bruising on the thigh resulting from being tackled, creatine kinase concentration was
substantially higher than the team mean 24 hours after the match (2621 vs. 1081 ± 595
IU·L-1
; mean ± SD) [245]. Tackles are the most common form of contact in rugby union and
also result in the most injuries [95]. However, scrums and collisions present the highest risk
of injury per event [95]. The high-intensity contact nature of international rugby union carries
a relatively high injury risk [97]. Interestingly though, the magnitude of injury risk is greater
in international-level rugby sevens than rugby union despite differences in anthropometric
characteristics of players and lower emphasis on physical confrontation [98]. Although the
reasons for a greater injury risk in rugby sevens are unknown, it is possible the fast nature of
rugby sevens increases the energy transfer during contact events, increasing the probability of
serious injury. The open style of rugby sevens may also explain the higher proportion of
severe knee and ankle ligament injuries relative to observations during the 2007 Rugby
World Cup resulting from more frequent evasive running, turning, and cutting manoeuvres.
Physical Characteristics and Capacities of Rugby Players
Public release of information on the characteristics and capacities of rugby players in the
professional era is limited by the competitiveness between teams. Laboratory- and field-based
testing data complements the information gained from match analyses. Anthropometric,
physiological, and performance testing in the laboratory and the field assists coaches and
support staff in monitoring long- and short-term training adaptations, prescribing and
assessing individualised physical preparation programmes, identifying talented players,
selecting players, and predicting performance outcomes. Although recommendations for the
assessment of rugby players have been developed to investigate players’ physiological
characteristics and components of fitness [135], the lack of standardisation of testing
procedures can make comparisons of findings between studies difficult.
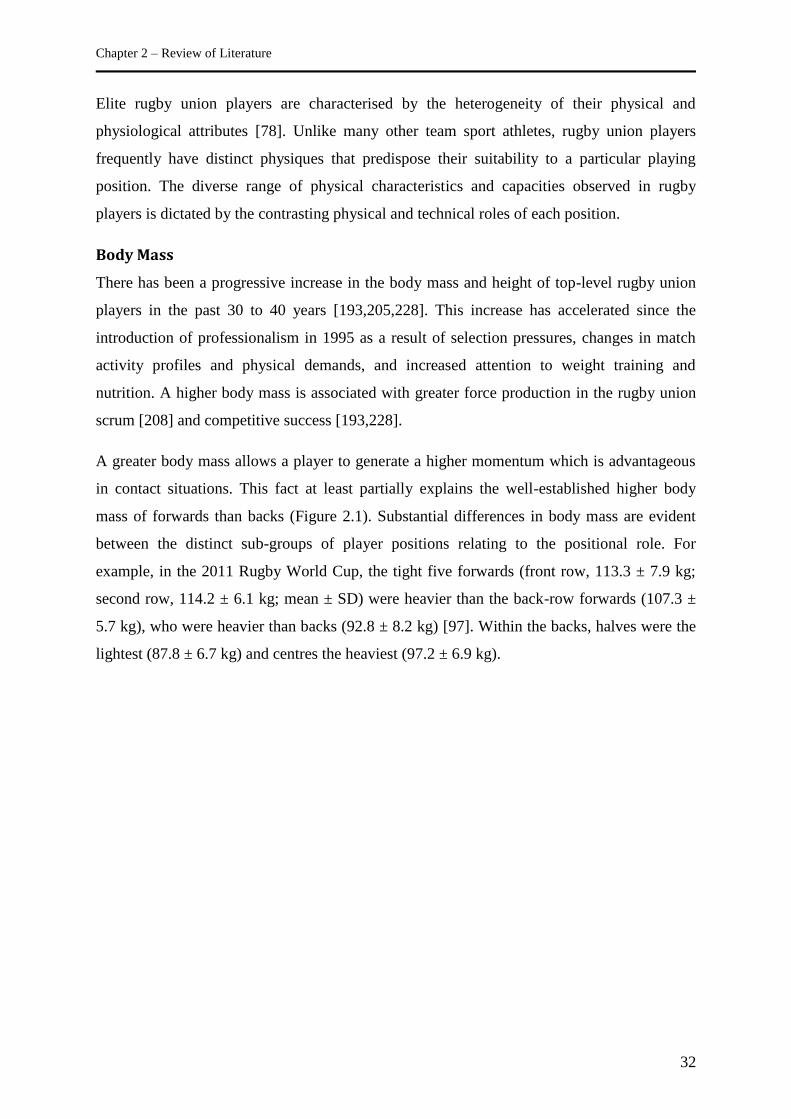
Chapter 2 – Review of Literature
32
Elite rugby union players are characterised by the heterogeneity of their physical and
physiological attributes [78]. Unlike many other team sport athletes, rugby union players
frequently have distinct physiques that predispose their suitability to a particular playing
position. The diverse range of physical characteristics and capacities observed in rugby
players is dictated by the contrasting physical and technical roles of each position.
Body Mass
There has been a progressive increase in the body mass and height of top-level rugby union
players in the past 30 to 40 years [193,205,228]. This increase has accelerated since the
introduction of professionalism in 1995 as a result of selection pressures, changes in match
activity profiles and physical demands, and increased attention to weight training and
nutrition. A higher body mass is associated with greater force production in the rugby union
scrum [208] and competitive success [193,228].
A greater body mass allows a player to generate a higher momentum which is advantageous
in contact situations. This fact at least partially explains the well-established higher body
mass of forwards than backs (Figure 2.1). Substantial differences in body mass are evident
between the distinct sub-groups of player positions relating to the positional role. For
example, in the 2011 Rugby World Cup, the tight five forwards (front row, 113.3 ± 7.9 kg;
second row, 114.2 ± 6.1 kg; mean ± SD) were heavier than the back-row forwards (107.3 ±
5.7 kg), who were heavier than backs (92.8 ± 8.2 kg) [97]. Within the backs, halves were the
lightest (87.8 ± 6.7 kg) and centres the heaviest (97.2 ± 6.9 kg).
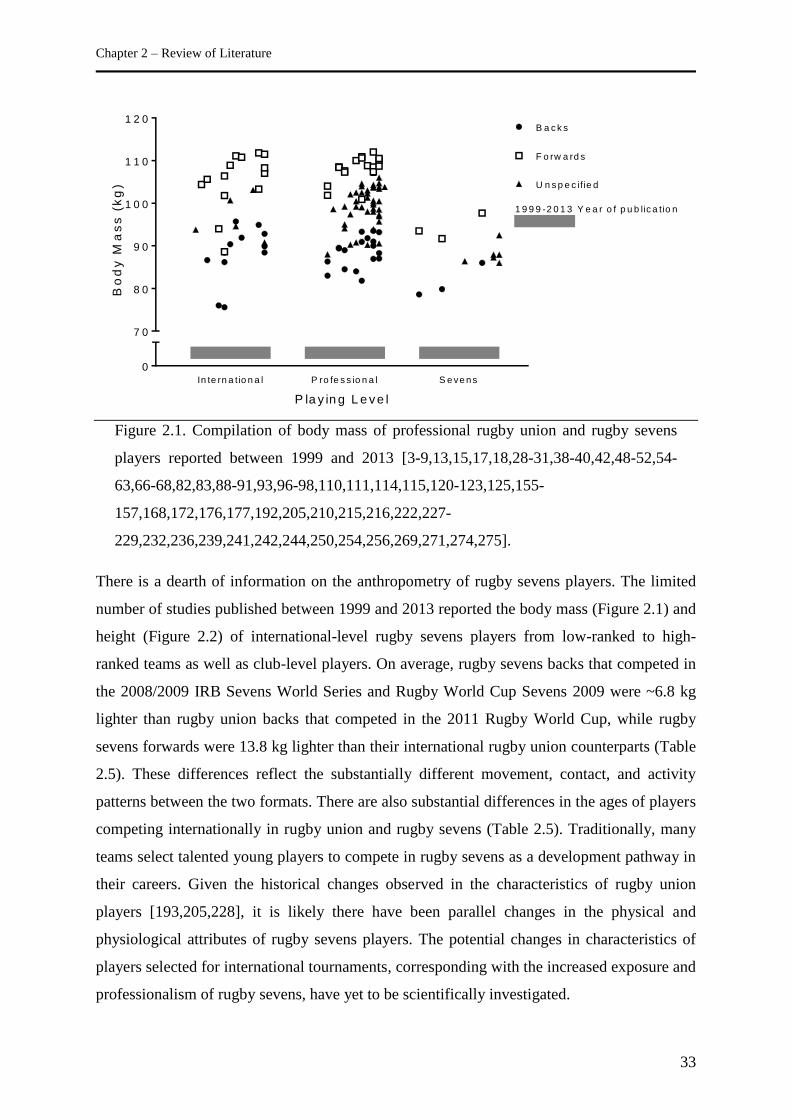
Chapter 2 – Review of Literature
33
P la y in g L e v e l
Bo
dy
Ma
ss
(k
g)
0
7 0
8 0
9 0
1 0 0
1 1 0
1 2 0B a c k s
F o rw a rd s
U n s p e c ifie d
1 9 9 9 -2 0 1 3 Y e a r o f p u b lic a tio n
In te rn a tio n a l P ro fe s s io n a l S e ve ns
Figure 2.1. Compilation of body mass of professional rugby union and rugby sevens
players reported between 1999 and 2013 [3-9,13,15,17,18,28-31,38-40,42,48-52,54-
63,66-68,82,83,88-91,93,96-98,110,111,114,115,120-123,125,155-
157,168,172,176,177,192,205,210,215,216,222,227-
229,232,236,239,241,242,244,250,254,256,269,271,274,275].
There is a dearth of information on the anthropometry of rugby sevens players. The limited
number of studies published between 1999 and 2013 reported the body mass (Figure 2.1) and
height (Figure 2.2) of international-level rugby sevens players from low-ranked to high-
ranked teams as well as club-level players. On average, rugby sevens backs that competed in
the 2008/2009 IRB Sevens World Series and Rugby World Cup Sevens 2009 were ~6.8 kg
lighter than rugby union backs that competed in the 2011 Rugby World Cup, while rugby
sevens forwards were 13.8 kg lighter than their international rugby union counterparts (Table
2.5). These differences reflect the substantially different movement, contact, and activity
patterns between the two formats. There are also substantial differences in the ages of players
competing internationally in rugby union and rugby sevens (Table 2.5). Traditionally, many
teams select talented young players to compete in rugby sevens as a development pathway in
their careers. Given the historical changes observed in the characteristics of rugby union
players [193,205,228], it is likely there have been parallel changes in the physical and
physiological attributes of rugby sevens players. The potential changes in characteristics of
players selected for international tournaments, corresponding with the increased exposure and
professionalism of rugby sevens, have yet to be scientifically investigated.
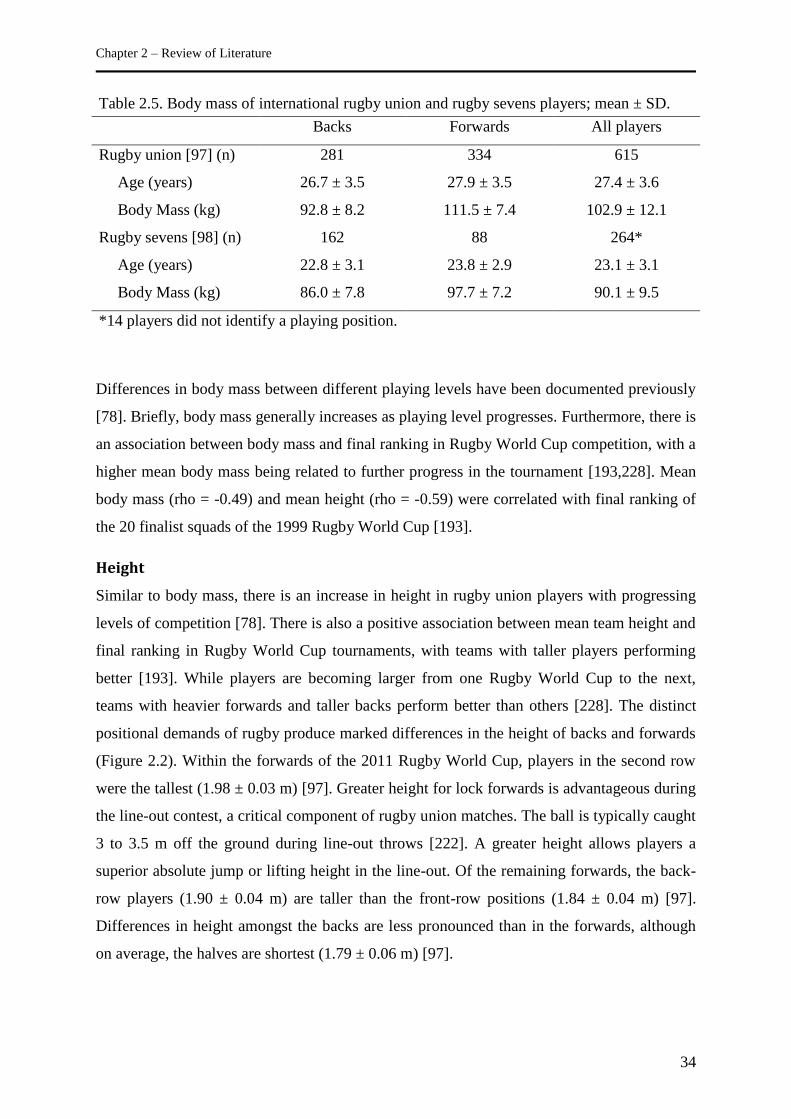
Chapter 2 – Review of Literature
34
Table 2.5. Body mass of international rugby union and rugby sevens players; mean ± SD.
Backs Forwards All players
Rugby union [97] (n) 281 334 615
Age (years) 26.7 ± 3.5 27.9 ± 3.5 27.4 ± 3.6
Body Mass (kg) 92.8 ± 8.2 111.5 ± 7.4 102.9 ± 12.1
Rugby sevens [98] (n) 162 88 264*
Age (years) 22.8 ± 3.1 23.8 ± 2.9 23.1 ± 3.1
Body Mass (kg) 86.0 ± 7.8 97.7 ± 7.2 90.1 ± 9.5
*14 players did not identify a playing position.
Differences in body mass between different playing levels have been documented previously
[78]. Briefly, body mass generally increases as playing level progresses. Furthermore, there is
an association between body mass and final ranking in Rugby World Cup competition, with a
higher mean body mass being related to further progress in the tournament [193,228]. Mean
body mass (rho = -0.49) and mean height (rho = -0.59) were correlated with final ranking of
the 20 finalist squads of the 1999 Rugby World Cup [193].
Height
Similar to body mass, there is an increase in height in rugby union players with progressing
levels of competition [78]. There is also a positive association between mean team height and
final ranking in Rugby World Cup tournaments, with teams with taller players performing
better [193]. While players are becoming larger from one Rugby World Cup to the next,
teams with heavier forwards and taller backs perform better than others [228]. The distinct
positional demands of rugby produce marked differences in the height of backs and forwards
(Figure 2.2). Within the forwards of the 2011 Rugby World Cup, players in the second row
were the tallest (1.98 ± 0.03 m) [97]. Greater height for lock forwards is advantageous during
the line-out contest, a critical component of rugby union matches. The ball is typically caught
3 to 3.5 m off the ground during line-out throws [222]. A greater height allows players a
superior absolute jump or lifting height in the line-out. Of the remaining forwards, the back-
row players (1.90 ± 0.04 m) are taller than the front-row positions (1.84 ± 0.04 m) [97].
Differences in height amongst the backs are less pronounced than in the forwards, although
on average, the halves are shortest (1.79 ± 0.06 m) [97].
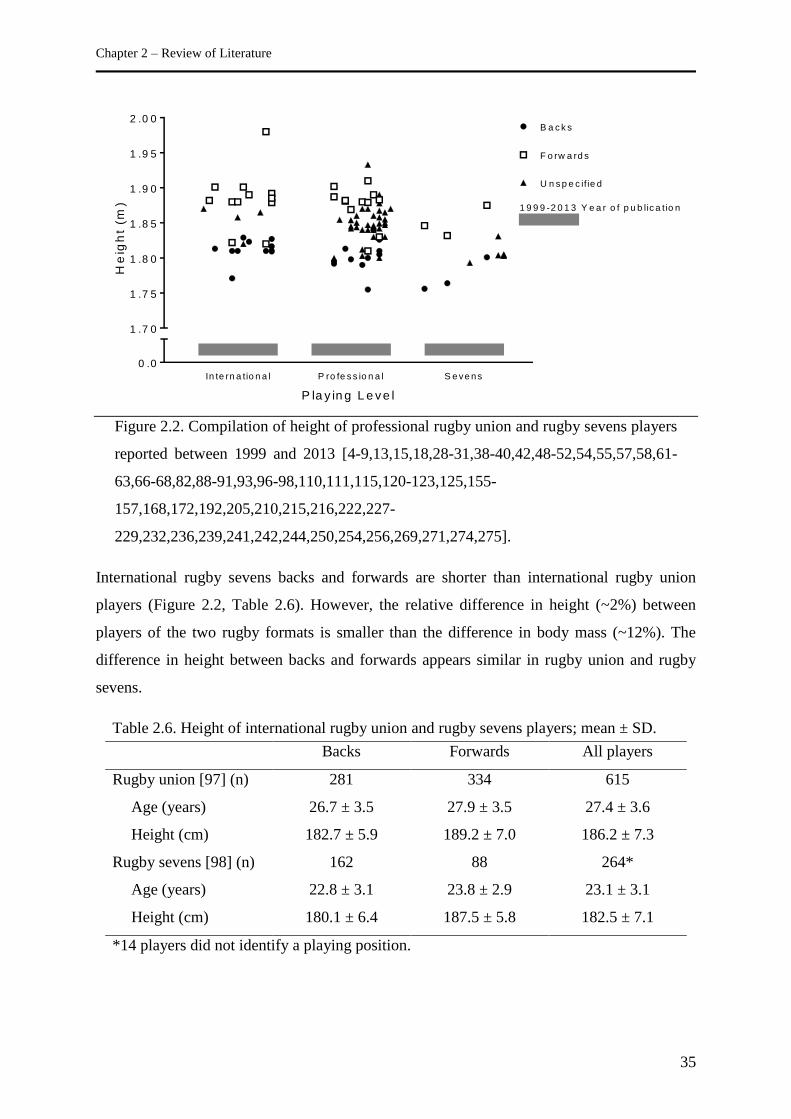
Chapter 2 – Review of Literature
35
P la y in g L e v e l
He
igh
t (m
)
0 .0
1 .7 0
1 .7 5
1 .8 0
1 .8 5
1 .9 0
1 .9 5
2 .0 0B a c k s
F o rw a rd s
U n s p e c ifie d
1 9 9 9 -2 0 1 3 Y e a r o f p u b lic a tio n
In te rn a tio n a l P ro fe s s io n a l S e ve ns
Figure 2.2. Compilation of height of professional rugby union and rugby sevens players
reported between 1999 and 2013 [4-9,13,15,18,28-31,38-40,42,48-52,54,55,57,58,61-
63,66-68,82,88-91,93,96-98,110,111,115,120-123,125,155-
157,168,172,192,205,210,215,216,222,227-
229,232,236,239,241,242,244,250,254,256,269,271,274,275].
International rugby sevens backs and forwards are shorter than international rugby union
players (Figure 2.2, Table 2.6). However, the relative difference in height (~2%) between
players of the two rugby formats is smaller than the difference in body mass (~12%). The
difference in height between backs and forwards appears similar in rugby union and rugby
sevens.
Table 2.6. Height of international rugby union and rugby sevens players; mean ± SD.
Backs Forwards All players
Rugby union [97] (n) 281 334 615
Age (years) 26.7 ± 3.5 27.9 ± 3.5 27.4 ± 3.6
Height (cm) 182.7 ± 5.9 189.2 ± 7.0 186.2 ± 7.3
Rugby sevens [98] (n) 162 88 264*
Age (years) 22.8 ± 3.1 23.8 ± 2.9 23.1 ± 3.1
Height (cm) 180.1 ± 6.4 187.5 ± 5.8 182.5 ± 7.1
*14 players did not identify a playing position.
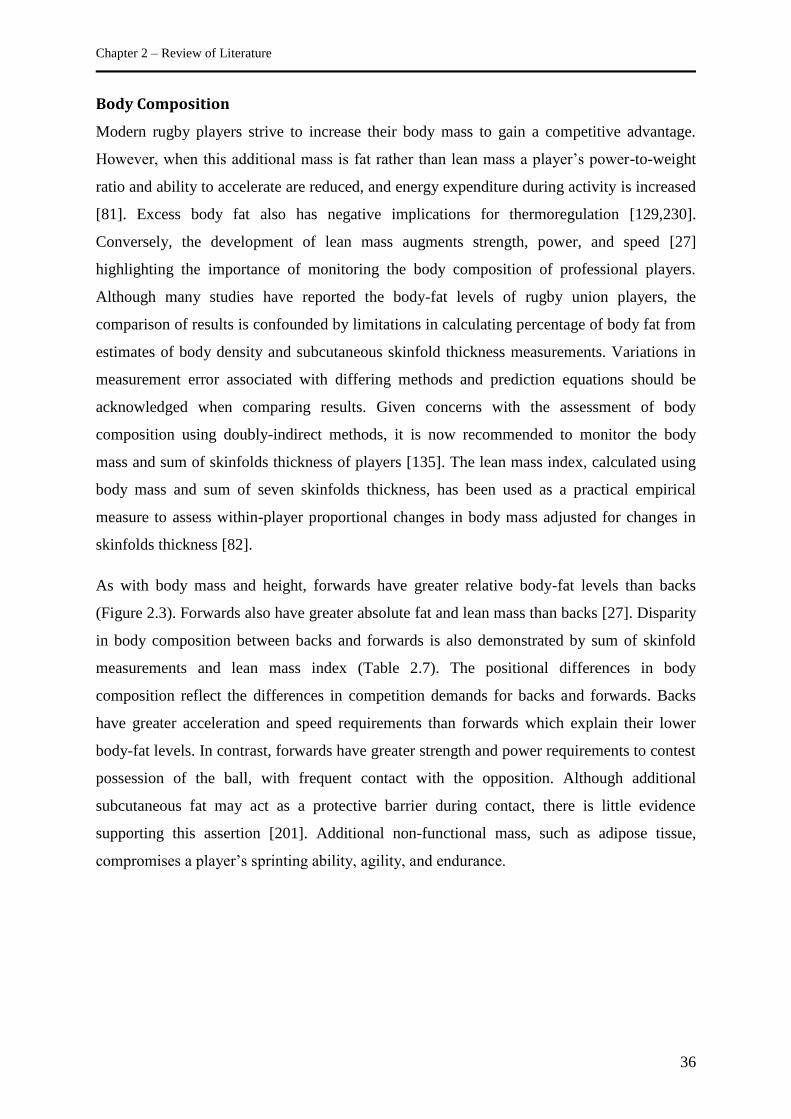
Chapter 2 – Review of Literature
36
Body Composition
Modern rugby players strive to increase their body mass to gain a competitive advantage.
However, when this additional mass is fat rather than lean mass a player’s power-to-weight
ratio and ability to accelerate are reduced, and energy expenditure during activity is increased
[81]. Excess body fat also has negative implications for thermoregulation [129,230].
Conversely, the development of lean mass augments strength, power, and speed [27]
highlighting the importance of monitoring the body composition of professional players.
Although many studies have reported the body-fat levels of rugby union players, the
comparison of results is confounded by limitations in calculating percentage of body fat from
estimates of body density and subcutaneous skinfold thickness measurements. Variations in
measurement error associated with differing methods and prediction equations should be
acknowledged when comparing results. Given concerns with the assessment of body
composition using doubly-indirect methods, it is now recommended to monitor the body
mass and sum of skinfolds thickness of players [135]. The lean mass index, calculated using
body mass and sum of seven skinfolds thickness, has been used as a practical empirical
measure to assess within-player proportional changes in body mass adjusted for changes in
skinfolds thickness [82].
As with body mass and height, forwards have greater relative body-fat levels than backs
(Figure 2.3). Forwards also have greater absolute fat and lean mass than backs [27]. Disparity
in body composition between backs and forwards is also demonstrated by sum of skinfold
measurements and lean mass index (Table 2.7). The positional differences in body
composition reflect the differences in competition demands for backs and forwards. Backs
have greater acceleration and speed requirements than forwards which explain their lower
body-fat levels. In contrast, forwards have greater strength and power requirements to contest
possession of the ball, with frequent contact with the opposition. Although additional
subcutaneous fat may act as a protective barrier during contact, there is little evidence
supporting this assertion [201]. Additional non-functional mass, such as adipose tissue,
compromises a player’s sprinting ability, agility, and endurance.
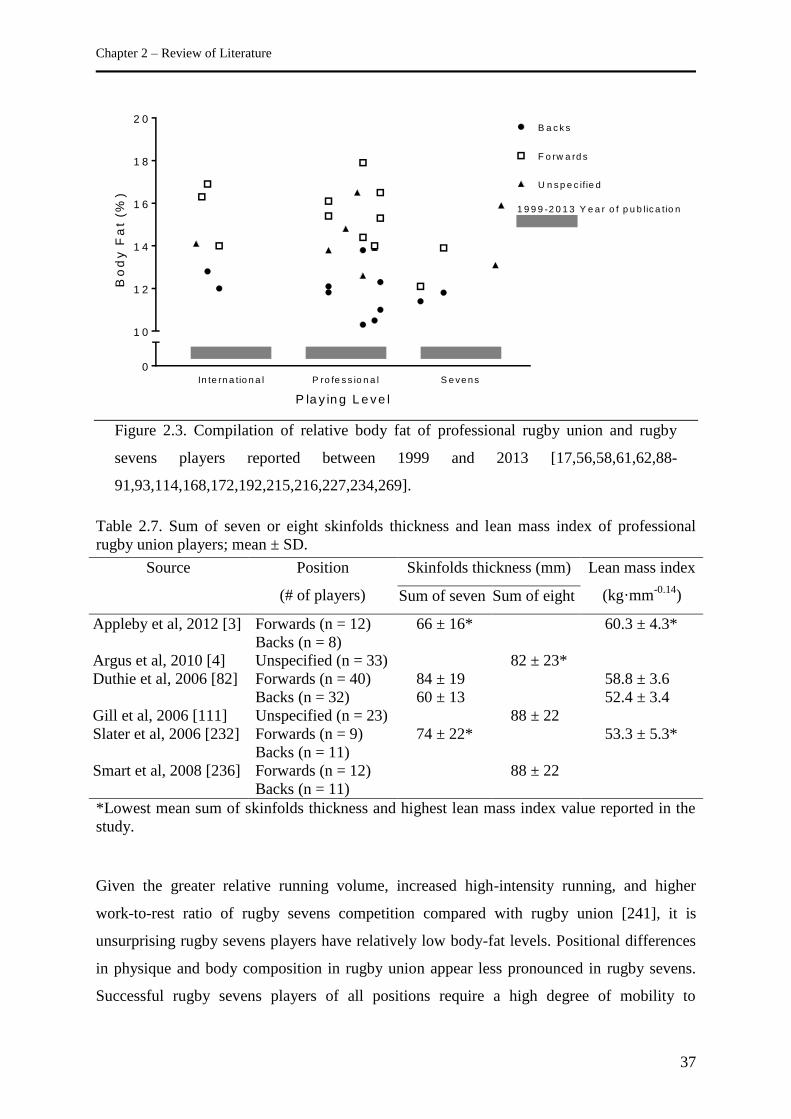
Chapter 2 – Review of Literature
37
P la y in g L e v e l
Bo
dy
Fa
t (%
)
0
1 0
1 2
1 4
1 6
1 8
2 0B a c k s
F o rw a rd s
U n s p e c ifie d
1 9 9 9 -2 0 1 3 Y e a r o f p u b lic a tio n
In te rn a tio n a l P ro fe s s io n a l S e ve ns
Figure 2.3. Compilation of relative body fat of professional rugby union and rugby
sevens players reported between 1999 and 2013 [17,56,58,61,62,88-
91,93,114,168,172,192,215,216,227,234,269].
Table 2.7. Sum of seven or eight skinfolds thickness and lean mass index of professional
rugby union players; mean ± SD.
Source Position
(# of players)
Skinfolds thickness (mm) Lean mass index
(kg·mm-0.14
) Sum of seven Sum of eight
Appleby et al, 2012 [3] Forwards (n = 12)
Backs (n = 8)
66 ± 16* 60.3 ± 4.3*
Argus et al, 2010 [4] Unspecified (n = 33) 82 ± 23*
Duthie et al, 2006 [82] Forwards (n = 40)
Backs (n = 32)
84 ± 19
60 ± 13
58.8 ± 3.6
52.4 ± 3.4
Gill et al, 2006 [111] Unspecified (n = 23) 88 ± 22
Slater et al, 2006 [232] Forwards (n = 9)
Backs (n = 11)
74 ± 22* 53.3 ± 5.3*
Smart et al, 2008 [236] Forwards (n = 12)
Backs (n = 11)
88 ± 22
*Lowest mean sum of skinfolds thickness and highest lean mass index value reported in the
study.
Given the greater relative running volume, increased high-intensity running, and higher
work-to-rest ratio of rugby sevens competition compared with rugby union [241], it is
unsurprising rugby sevens players have relatively low body-fat levels. Positional differences
in physique and body composition in rugby union appear less pronounced in rugby sevens.
Successful rugby sevens players of all positions require a high degree of mobility to
Chapter 2 – Review of Literature
38
accommodate the faster and more open style of play. Simultaneously, the reduced frequency
of set-piece plays, such as scrums and line-outs, in rugby sevens matches results in greater
homogeneity of anthropometric characteristics among different positions. In club-level rugby
sevens players, the mean sum of six skinfolds thickness was 61.6 ± 6.0 mm [239,241]. Based
on skinfold thickness measurements of 27 players competing in an international rugby sevens
tournament in 1996, body fat was estimated to be 12.1 ± 2.2% for forwards and 11.4 ± 2.5%
for backs [216]. A similar anthropometric analysis of 108 forwards and 138 backs competing
in a rugby sevens tournament in Uruguay in 1996 and 1997 reported substantial differences in
physique and body composition between forwards and backs [215]. Relative body fat
estimated from skinfold measurements was 13.9 ± 3.7% for forwards and 11.8 ± 3.2% for
backs. Significant differences were also observed between positional groups in estimates of
absolute muscle mass, absolute bone mass, and somatotype. However, when these body
composition measurements were reported in relative terms, the positional differences were no
longer apparent. The measurement of body composition of modern international-standard
rugby sevens players has yet to utilise more accurate and finer resolution measurement
techniques, such as dual-energy X-ray absorptiometry (DXA). Assessments using methods
such as DXA would allow greater insight into the similarities and differences in body
composition between rugby sevens and rugby union players.
There is only exiguous information on the body composition of rugby players measured using
DXA. The measurement of body composition using DXA allows for the regional distribution
of bone mineral, fat, and lean soft tissue mass to be quantified. Rugby union backs have
significantly higher relative lean soft tissue mass than forwards in the arms (84 vs. 77%), legs
(80 vs. 72%) and trunk (89 vs. 79%) [27]. In contrast, forwards have a higher relative fat
mass than backs in the arms (19 vs. 11%), legs (23 vs. 15%), and trunk (18 vs. 8%) [27]. Not
only are there substantial differences in the absolute and relative fat and lean soft tissue mass
between backs and forwards, but the regional distribution of this tissue across the body also
differs between backs and forwards [27]. No studies have examined the regional distribution
of tissue in rugby sevens or international-level rugby union players. Studies of elite-level
players of both formats would provide valuable information on the differences in body
composition and regional tissue distribution between positional groups.
Aerobic Performance
Developing a player’s aerobic capacity supports anaerobic energy pathways, assists in fatigue
resistance and lactate clearance, and facilitates recovery between bouts of high-intensity
Chapter 2 – Review of Literature
39
activity [253]. Maximal oxygen uptake (V̇O2max) has been commonly reported as an indicator
of aerobic fitness in rugby players. Additional measures of aerobic fitness such as maximal
aerobic running speed or velocity at V̇O2max [172], running economy [168], and anaerobic
threshold [227,237] are reported less frequently. These measures are typically used to
prescribe and monitor prolonged, steady-state exercise. The relative importance of these
measures to performance and training in high-intensity intermittent team sports, such as
rugby union and rugby sevens, is currently unclear.
A player’s V̇O2max is commonly measured in the laboratory on a motorised treadmill using an
incrementally-graded protocol. The time and financial expense of performing this
measurement is often prohibitive for rugby teams during the competition season. As a more
practical alternative, other field-based test protocols are often adopted to simplify the
assessment of players’ endurance in a team setting. Examples of tests used in rugby union
research include the 3000-m time trial [192], incremental track-based running tests [91,172],
and the multi-stage shuttle run [192]. Several of these tests allow the prediction of V̇O2max.
However, comparisons between test results should be interpreted with caution as the validity
of predicted V̇O2max estimates from indirect measures in rugby players is unclear. Indeed, the
multi-stage shuttle run scores of a small group of international rugby union players (n = 7)
had a poor relationship with V̇O2max measured in the laboratory [192].
The V̇O2max of rugby union forwards is in excess of 5 L·min-1
[269]. A well-developed
capacity of forwards to produce very high aerobic power output is required to sustain
repeated high-intensity bouts of rucking, mauling, scrummaging, and running with the ball
and in support. Table 2.8 shows that when V̇O2max is expressed in absolute units, the forwards
have greater aerobic capacity than backs. However, when V̇O2max is expressed relative to
body mass, the values favour backs. Although body mass should be considered when
interpreting aerobic capacity in relation to activities such as running, there is potential for a
larger body mass to bias the reporting of V̇O2max using ratio scaling (i.e., per kg of body
mass). Given the variation in body mass of rugby players, alternate methods of reporting
results, such as using allometric scaling, have been proposed to allow more valid
comparisons between individuals [186]. No published studies have reported the V̇O2max of
professional rugby players using alternate scaling or normalising methods.
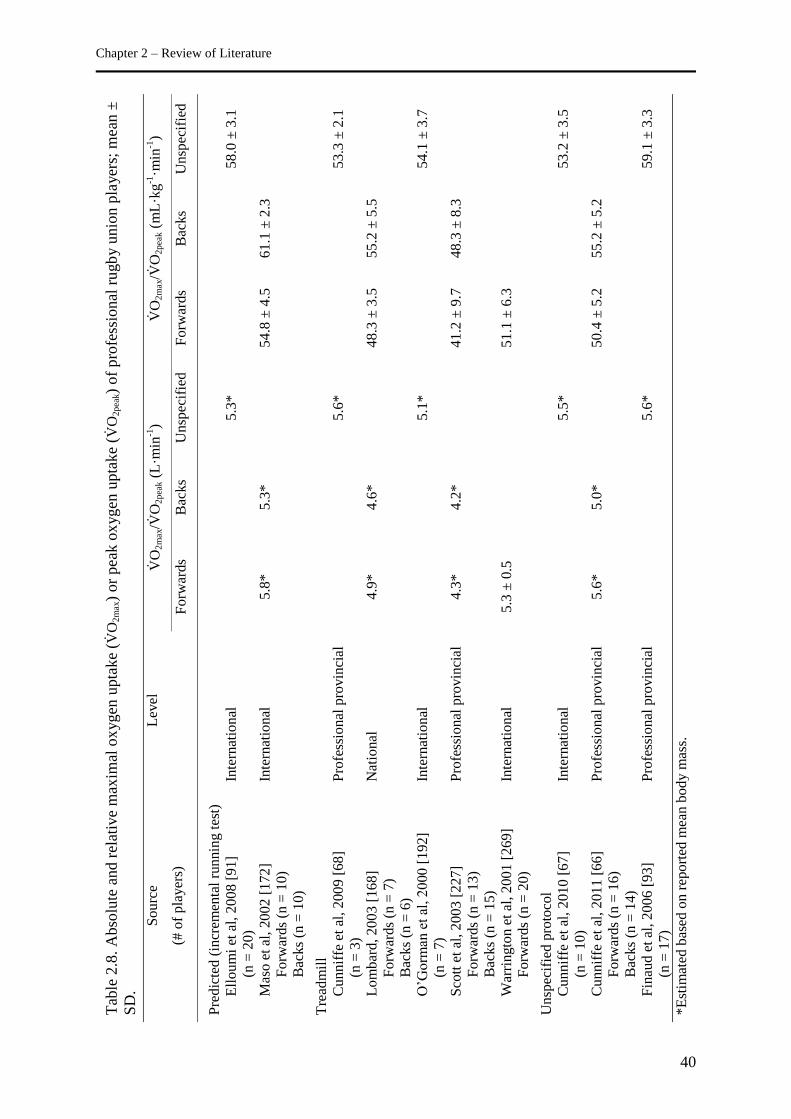
Chapter 2 – Review of Literature
40
Tab
le 2
.8.
Abso
lute
and r
elat
ive
max
imal
ox
ygen
upta
ke
(V̇O
2m
ax)
or
pea
k o
xygen
upta
ke
(V̇O
2pea
k)
of
pro
fess
ional
ru
gb
y u
nio
n p
layer
s; m
ean ±
SD
.
So
urc
e
(# o
f p
layer
s)
Lev
el
V̇O
2m
ax/V̇
O2
pea
k (
L·m
in-1
) V̇
O2
max/V̇
O2pea
k (
mL
·kg
-1·m
in-1
)
Forw
ards
Bac
ks
Un
spec
ifie
d
Fo
rwar
ds
Bac
ks
Un
spec
ifie
d
Pre
dic
ted (
incr
emen
tal
run
nin
g t
est)
E
lloum
i et
al,
20
08
[9
1]
(n =
20)
Inte
rnat
ional
5
.3*
58
.0 ±
3.1
Mas
o e
t al
, 20
02
[1
72
] F
orw
ards
(n =
10)
Bac
ks
(n =
10)
Inte
rnat
ional
5.8
*
5.3
*
5
4.8
± 4
.5
61
.1 ±
2.3
Tre
adm
ill
Cunnif
fe e
t al
, 2
00
9 [
68
] (n
= 3
) P
rofe
ssio
nal
pro
vin
cial
5
.6*
53
.3 ±
2.1
Lom
bar
d, 2
00
3 [
16
8]
Forw
ards
(n =
7)
Bac
ks
(n =
6)
Nat
ional
4.9
*
4.6
*
4
8.3
± 3
.5
55
.2 ±
5.5
O’G
orm
an e
t al
, 2
000
[1
92]
(n =
7)
Inte
rnat
ional
5
.1*
54
.1 ±
3.7
Sco
tt e
t al
, 2
00
3 [
22
7]
Forw
ards
(n =
13)
Bac
ks
(n =
15)
Pro
fess
ional
pro
vin
cial
4.3
*
4.2
*
4
1.2
± 9
.7
48
.3 ±
8.3
War
ringto
n e
t al
, 2
00
1 [
26
9]
Forw
ards
(n =
20)
Inte
rnat
ional
5.3
± 0
.5
51
.1 ±
6.3
Unsp
ecif
ied
pro
toco
l C
unnif
fe e
t al
, 2
01
0 [
67
] (n
= 1
0)
Inte
rnat
ional
5
.5*
53
.2 ±
3.5
Cunnif
fe e
t al
, 2
01
1 [
66
] F
orw
ards
(n =
16)
Bac
ks
(n =
14)
Pro
fess
ional
pro
vin
cial
5.6
*
5.0
*
5
0.4
± 5
.2
55
.2 ±
5.2
Fin
aud e
t al
, 2
00
6 [
93]
(n =
17)
Pro
fess
ional
pro
vin
cial
5
.6*
59
.1 ±
3.3
*E
stim
ated
bas
ed o
n r
epo
rted
mea
n b
od
y m
ass.
Chapter 2 – Review of Literature
41
Although improving a rugby player’s V̇O2max is likely to positively influence performance, it
does not appear to be the most important fitness characteristic in a player’s profile. This
contention is supported by the lower relative V̇O2max of rugby union players compared with
athletes competing in other field-based team sports with a reduced emphasis on physical
contact and greater running volume, such as field hockey (61.8 ± 1.8 mL·kg-1
·min-1
) [36] and
soccer (63.2 ± 4.9 mL·kg-1
·min-1
) [69]. Interestingly, despite the relatively greater volume of
running in rugby sevens compared with rugby union, the relative V̇O2max of club-level rugby
sevens players (mean = ~52 to 56 mL·kg-1
·min-1
) [115,239,241] is similar to reports of
professional and international rugby union players. Given the moderate aerobic qualities of
rugby players relative to endurance-sport athletes and the limited ecological validity of
continuous running tests for assessing a player’s aerobic fitness as required for competition, it
is increasingly common for coaches and scientists to adopt other test methods that assess a
player’s ability to perform repeated high-intensity efforts under maximal activation of the
aerobic system. Tests such as the Yo-Yo intermittent recovery tests evaluate the endurance
qualities of players under more team-sport-specific conditions, incorporating acceleration,
deceleration, and change of direction [20]. As the Yo-Yo test reflects the ability to repeatedly
perform high-intensity exercise, it concurrently assesses a player’s aerobic output with
involvement of anaerobic responses and short-duration recovery. Studies of other sports
demonstrate the Yo-Yo test is a more accurate predictor of on-field performance than V̇O2max
and offers greater sensitivity in discriminating between athletes of different levels and
evaluating training interventions [20]. Similarly in rugby union, more mature players tend to
outperform junior players and backs outperform forwards in the Yo-Yo intermittent recovery
test [135].
Anaerobic Performance
Anaerobic capacity and power are important fitness components for rugby union and rugby
sevens players during intermittent training and competition activity. Anaerobic metabolism is
required for the execution of power-based movements such as tackling, scrummaging, intense
accelerations, jumping, and application of force during rucking and mauling. The
development of a high anaerobic capacity is also paramount to the ability to sustain and
repeat high-intensity activity. Given the importance of anaerobic qualities for rugby
performance, it is surprising little research has focused on the anaerobic characteristics of
elite-level players. The anaerobic performance of amateur rugby union players was reviewed
Chapter 2 – Review of Literature
42
over a decade ago [187]. However, there is a paucity of research on the anaerobic
characteristics of high-level professional rugby players.
There is no standardised protocol for the assessment of anaerobic characteristics in rugby
players. Given the limited ecological validity of laboratory-based measures, such as cycle
ergometry, anaerobic metabolic properties are rarely tested in isolation [17,168,250].
Maximal cycle ergometer tests demonstrate higher peak power output in rugby union
forwards compared with backs [17,168,250]. This finding is likely the result of the greater
absolute muscle mass of forwards than backs, which is advantageous during contests for the
ball. Maximal testing in the laboratory indicates players exhibiting the highest peak power
values also tend to have the highest rate of fatigue during tests of moderate duration (30 s)
[168,250]. This finding implies there may be a compromise between peak anaerobic power
and anaerobic capacity. However, it is likely power decrements are associated with the
relative contribution of metabolic pathways supporting force production rather than the
absolute force generated [108,178]. Although absolute power production is important during
activity involving physical contact between players, power output relative to the mass of a
player may better reflect running performance. When peak power output is expressed relative
to body mass, the results marginally favour the backs over forwards [250].
The questionable relevance to rugby competition and lack of translation to training
prescription of laboratory-based testing has lead to the development of more sport-specific
tests, such as repeated-sprint ability tests. These tests evaluate players under conditions that
more closely replicate the demands of competition [135,172,191,234]. For example, the 6 ×
30-m repeated-sprint ability test is used to assess players using sprint distances and recovery
times similar to those experienced during matches [135]. The rugby-specific repeated-speed
test also incorporates standardised work where players jog with a weighted bag and perform
dynamic down and ups (that is, the player goes from standing to a prone position on the
ground before returning to their feet) during the periods between sprint bouts [234]. Backs
generally outperform forwards in repeated-sprint ability tests [135,172]. However, the
interpretation of repeated-sprint ability tests is largely dependent upon the method of analysis
employed [194,203]. Reports of better repeated-sprint ability in backs to a large extent reflect
their superior single sprint performance compared with forwards [203]. The ability of an
athlete to perform repeated bouts of high-intensity activity is highly task-dependent [32,112].
Recent research on players’ abilities to perform tasks specific to rugby union found different
responses and levels of fatigue produced by a sprinting task, scrummaging task, and mauling
Chapter 2 – Review of Literature
43
task [182]. It appears differences in psycho-physiological responses to the tasks may be
related to different mechanisms of fatigue. Such findings support the development of
position-specific tests of repeated-effort ability based on the player’s role [182].
Tests such as the Bath University Rugby Shuttle Test (BURST) have been developed based
on time-motion analyses of rugby union matches in an attempt to replicate the physical
demands of competition [219]. Such rugby-specific test protocols can be used to assess
interventions likely to affect performance [218] and could potentially be used for player
conditioning. Although these tests are conducted under controlled conditions, they may be
limited in their ability to isolate the specific physiological qualities or mechanisms that
underpin performance.
Muscular Strength and Power
Muscular strength and power are critical components for success during attack and defence in
both rugby formats [135]. A player’s strength and power relative to their body mass are
related to acceleration, running velocity, and the ability to quickly change direction
[189,233,278]. Absolute strength and power are essential to apply high forces rapidly in
contact situations and during scrummaging [208]. Strength is the maximal force generated by
a muscle or groups of muscles at a specified velocity [159]. The strength of rugby players is
usually evaluated using a gym-based assessment of weightlifting exercises. Measurements
using this approach allow for results to be transferred directly to resistance training
prescription to develop desired qualities. Maximal strength is commonly assessed using
variations of the bench press exercise for the upper-body, and the back squat exercise for the
lower-body [135]. Less commonly, other exercises are also used, such as the chin-up
[63,135,234]. The performance in these exercises is often reported as a one-repetition
maximum: the maximum weight lifted for a single repetition. This value can be measured
directly or estimated based on the weight lifted for a higher number of repetitions [163].
The physicality of professional rugby union requires high levels of strength for success.
Given the benefits of strength in contact situations, rugby union forwards usually possess
greater strength than backs in the variations of the bench press (Figure 2.4) and back squat
(Figure 2.5). Even in club-level players, the mean force produced by a forward pack during a
scrum can be as high as 9090 ± 70 N [208]. These measurements demonstrate the necessity
of position- and task-specific strength development. For example, the props and locks,
typically the heaviest players on the field, produce the highest individual force during the
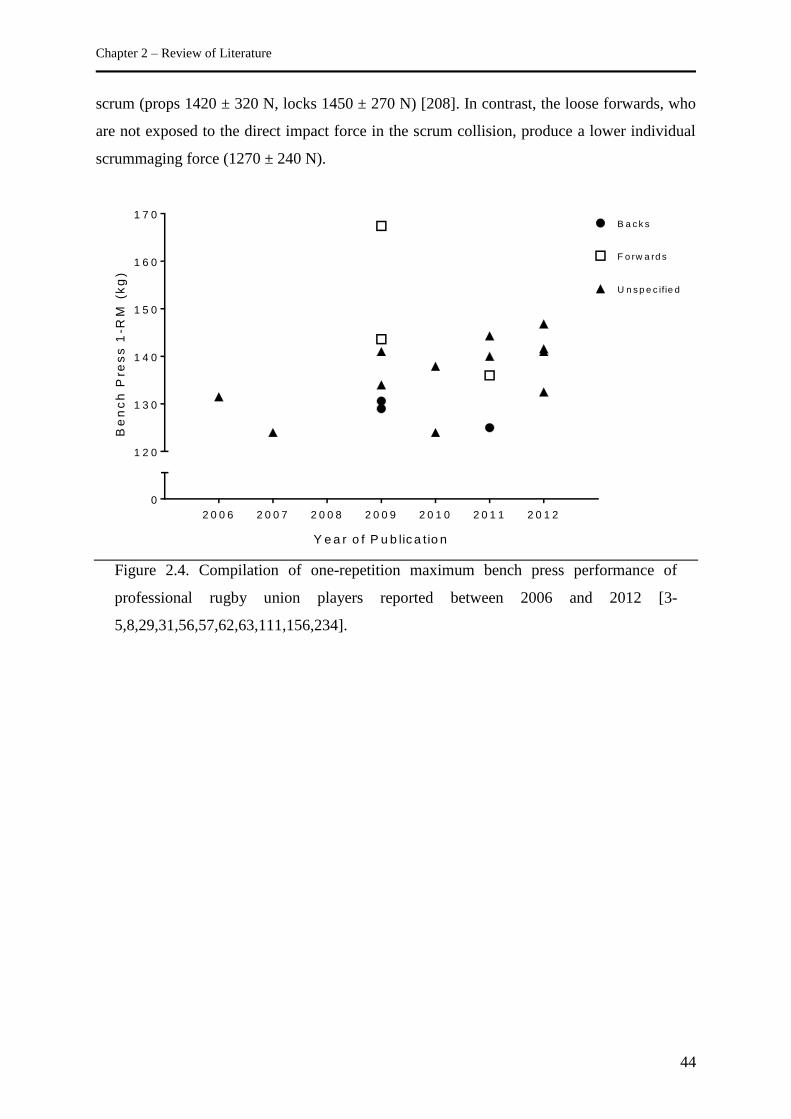
Chapter 2 – Review of Literature
44
scrum (props 1420 ± 320 N, locks 1450 ± 270 N) [208]. In contrast, the loose forwards, who
are not exposed to the direct impact force in the scrum collision, produce a lower individual
scrummaging force (1270 ± 240 N).
Y e a r o f P u b lic a t io n
Be
nc
h P
res
s 1
-RM
(k
g)
0
1 2 0
1 3 0
1 4 0
1 5 0
1 6 0
1 7 0
2 0 0 6 2 0 0 7 2 0 0 8 2 0 0 9 2 0 1 0 2 0 1 1 2 0 1 2
B a c k s
F o rw a rd s
U n s p e c ifie d
Figure 2.4. Compilation of one-repetition maximum bench press performance of
professional rugby union players reported between 2006 and 2012 [3-
5,8,29,31,56,57,62,63,111,156,234].
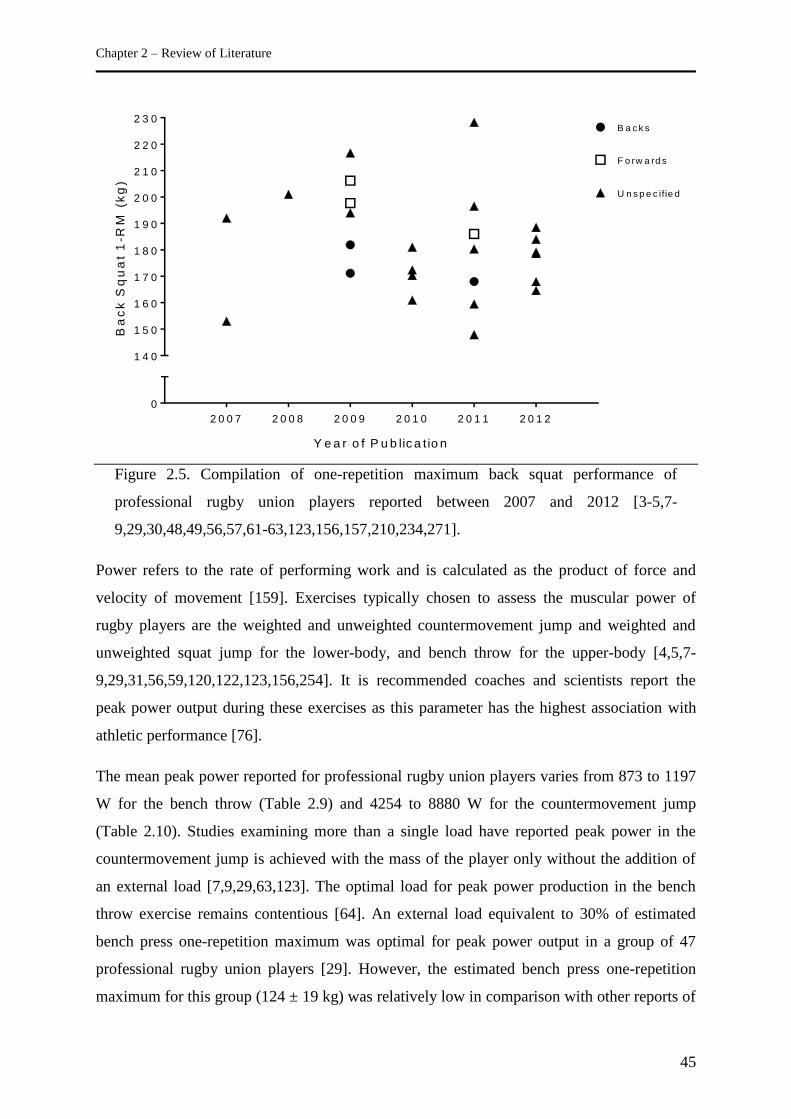
Chapter 2 – Review of Literature
45
Y e a r o f P u b lic a t io n
Ba
ck
Sq
ua
t 1
-RM
(k
g)
0
1 4 0
1 5 0
1 6 0
1 7 0
1 8 0
1 9 0
2 0 0
2 1 0
2 2 0
2 3 0
2 0 0 7 2 0 0 8 2 0 0 9 2 0 1 0 2 0 1 1 2 0 1 2
B a c k s
F o rw a rd s
U n s p e c ifie d
Figure 2.5. Compilation of one-repetition maximum back squat performance of
professional rugby union players reported between 2007 and 2012 [3-5,7-
9,29,30,48,49,56,57,61-63,123,156,157,210,234,271].
Power refers to the rate of performing work and is calculated as the product of force and
velocity of movement [159]. Exercises typically chosen to assess the muscular power of
rugby players are the weighted and unweighted countermovement jump and weighted and
unweighted squat jump for the lower-body, and bench throw for the upper-body [4,5,7-
9,29,31,56,59,120,122,123,156,254]. It is recommended coaches and scientists report the
peak power output during these exercises as this parameter has the highest association with
athletic performance [76].
The mean peak power reported for professional rugby union players varies from 873 to 1197
W for the bench throw (Table 2.9) and 4254 to 8880 W for the countermovement jump
(Table 2.10). Studies examining more than a single load have reported peak power in the
countermovement jump is achieved with the mass of the player only without the addition of
an external load [7,9,29,63,123]. The optimal load for peak power production in the bench
throw exercise remains contentious [64]. An external load equivalent to 30% of estimated
bench press one-repetition maximum was optimal for peak power output in a group of 47
professional rugby union players [29]. However, the estimated bench press one-repetition
maximum for this group (124 ± 19 kg) was relatively low in comparison with other reports of
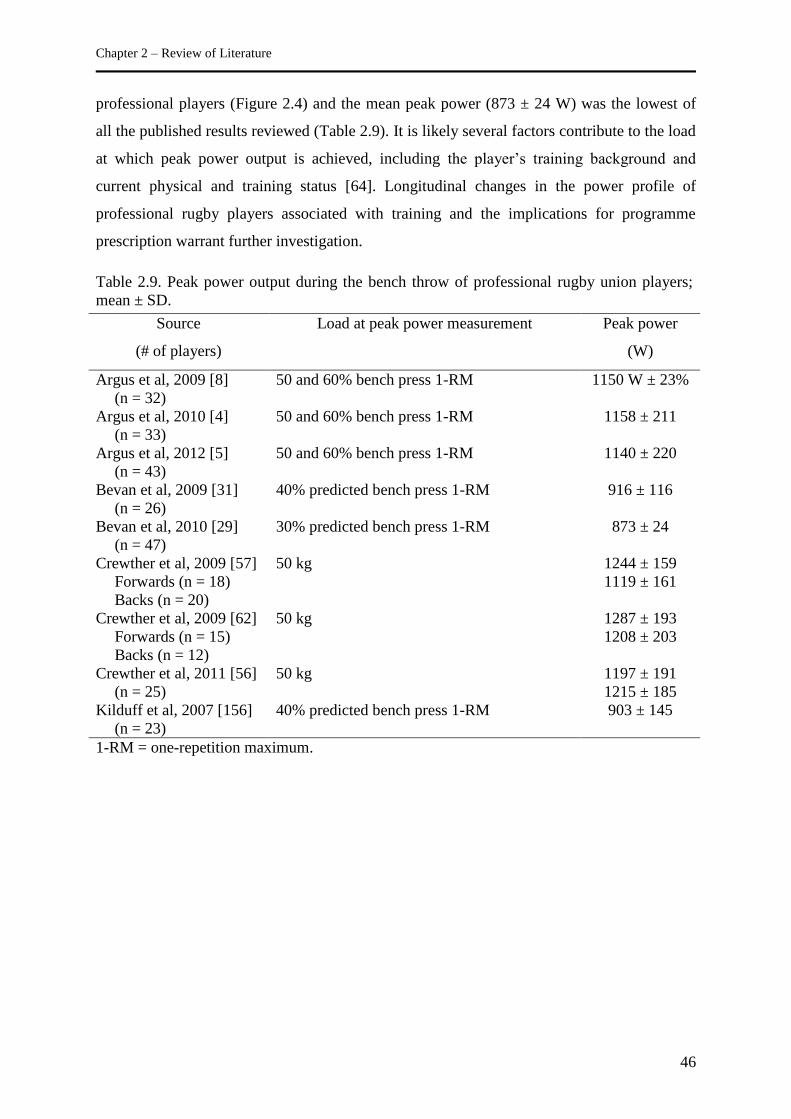
Chapter 2 – Review of Literature
46
professional players (Figure 2.4) and the mean peak power (873 ± 24 W) was the lowest of
all the published results reviewed (Table 2.9). It is likely several factors contribute to the load
at which peak power output is achieved, including the player’s training background and
current physical and training status [64]. Longitudinal changes in the power profile of
professional rugby players associated with training and the implications for programme
prescription warrant further investigation.
Table 2.9. Peak power output during the bench throw of professional rugby union players;
mean ± SD.
Source
(# of players)
Load at peak power measurement Peak power
(W)
Argus et al, 2009 [8]
(n = 32)
50 and 60% bench press 1-RM 1150 W ± 23%
Argus et al, 2010 [4]
(n = 33)
50 and 60% bench press 1-RM 1158 ± 211
Argus et al, 2012 [5]
(n = 43)
50 and 60% bench press 1-RM 1140 ± 220
Bevan et al, 2009 [31]
(n = 26)
40% predicted bench press 1-RM 916 ± 116
Bevan et al, 2010 [29]
(n = 47)
30% predicted bench press 1-RM 873 ± 24
Crewther et al, 2009 [57]
Forwards (n = 18)
Backs (n = 20)
50 kg 1244 ± 159
1119 ± 161
Crewther et al, 2009 [62]
Forwards (n = 15)
Backs (n = 12)
50 kg 1287 ± 193
1208 ± 203
Crewther et al, 2011 [56]
(n = 25)
50 kg 1197 ± 191
1215 ± 185
Kilduff et al, 2007 [156]
(n = 23)
40% predicted bench press 1-RM 903 ± 145
1-RM = one-repetition maximum.
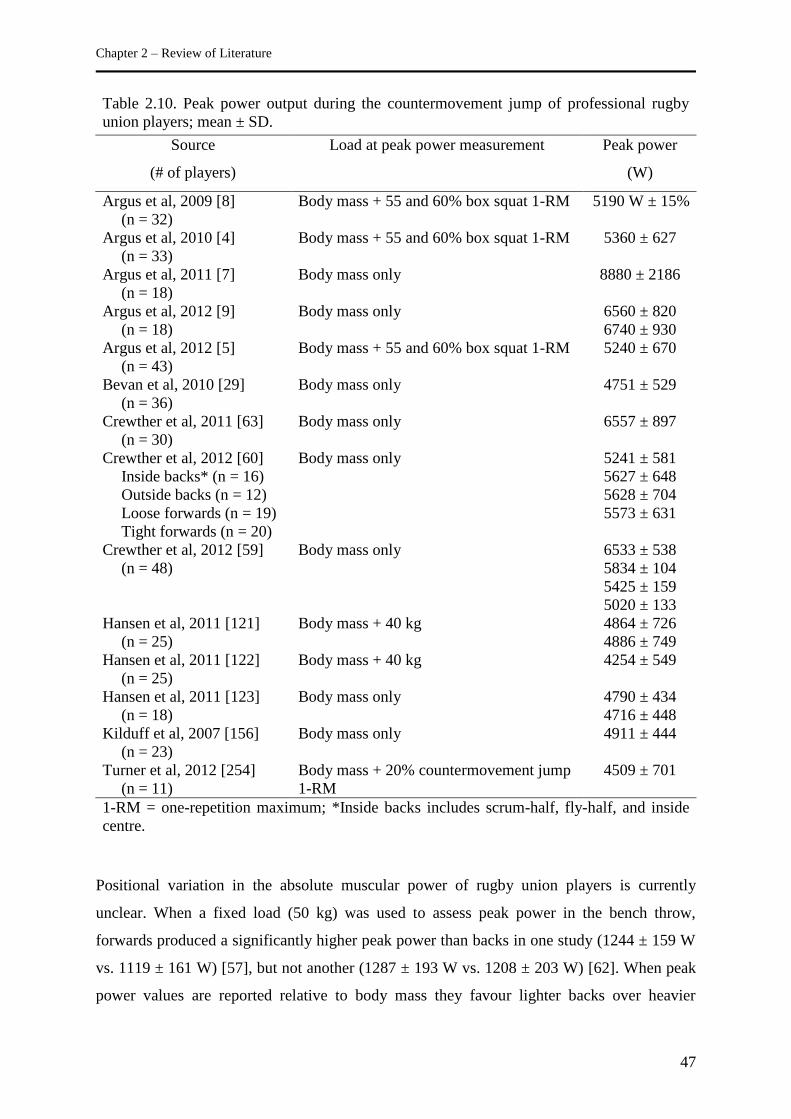
Chapter 2 – Review of Literature
47
Table 2.10. Peak power output during the countermovement jump of professional rugby
union players; mean ± SD.
Source
(# of players)
Load at peak power measurement Peak power
(W)
Argus et al, 2009 [8]
(n = 32)
Body mass + 55 and 60% box squat 1-RM 5190 W ± 15%
Argus et al, 2010 [4]
(n = 33)
Body mass + 55 and 60% box squat 1-RM 5360 ± 627
Argus et al, 2011 [7]
(n = 18)
Body mass only 8880 ± 2186
Argus et al, 2012 [9]
(n = 18)
Body mass only 6560 ± 820
6740 ± 930
Argus et al, 2012 [5]
(n = 43)
Body mass + 55 and 60% box squat 1-RM 5240 ± 670
Bevan et al, 2010 [29]
(n = 36)
Body mass only 4751 ± 529
Crewther et al, 2011 [63]
(n = 30)
Body mass only 6557 ± 897
Crewther et al, 2012 [60]
Inside backs* (n = 16)
Outside backs (n = 12)
Loose forwards (n = 19)
Tight forwards (n = 20)
Body mass only 5241 ± 581
5627 ± 648
5628 ± 704
5573 ± 631
Crewther et al, 2012 [59]
(n = 48)
Body mass only 6533 ± 538
5834 ± 104
5425 ± 159
5020 ± 133
Hansen et al, 2011 [121]
(n = 25)
Body mass + 40 kg 4864 ± 726
4886 ± 749
Hansen et al, 2011 [122]
(n = 25)
Body mass + 40 kg 4254 ± 549
Hansen et al, 2011 [123]
(n = 18)
Body mass only 4790 ± 434
4716 ± 448
Kilduff et al, 2007 [156]
(n = 23)
Body mass only 4911 ± 444
Turner et al, 2012 [254]
(n = 11)
Body mass + 20% countermovement jump
1-RM
4509 ± 701
1-RM = one-repetition maximum; *Inside backs includes scrum-half, fly-half, and inside
centre.
Positional variation in the absolute muscular power of rugby union players is currently
unclear. When a fixed load (50 kg) was used to assess peak power in the bench throw,
forwards produced a significantly higher peak power than backs in one study (1244 ± 159 W
vs. 1119 ± 161 W) [57], but not another (1287 ± 193 W vs. 1208 ± 203 W) [62]. When peak
power values are reported relative to body mass they favour lighter backs over heavier
Chapter 2 – Review of Literature
48
forwards [57,60]. The bias in reporting strength and power measures may be removed using
allometric scaling [57,60,63]. There is a need for further analysis of the peak force and peak
velocity values of backs and forwards. It is plausible players of different positions produce
high peak power values through the dominance of strength or speed qualities related to their
training and roles during competition. Without further investigation it is unclear whether
forwards generate peak power through higher force production from superior strength and
body mass, or if backs achieve peak power through a greater velocity of movement.
Empirical evidence of the relationship between these factors, playing position, and power
output would assist in the development of position-specific training programmes.
A surrogate field-based measure of lower-body power is maximum vertical jump height
[15,59,90,91,157,172,210]. A summary of reports of vertical jump performance in
professional rugby union players is presented in Table 2.11. Care should be taken when
comparing results between studies as there are several methodological factors that may
influence jump performance. These factors include the measurement method, differences in
protocol, and incorporation or lack of arm swing during the jump. Nevertheless, the vertical
jump test provides a practical option for measuring lower-body power in rugby players. The
maximum vertical jump height of professional rugby union backs is generally superior to that
of forwards [135,172]. These results support the trends observed in previous reviews
[78,187].
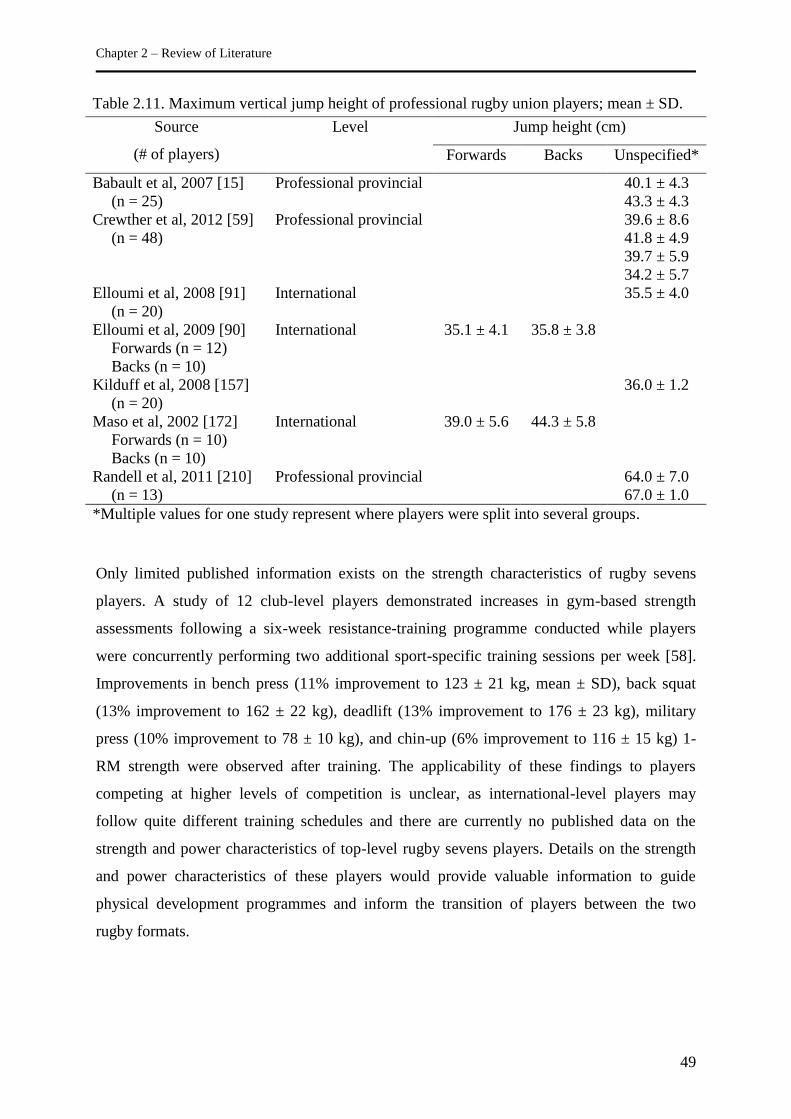
Chapter 2 – Review of Literature
49
Table 2.11. Maximum vertical jump height of professional rugby union players; mean ± SD.
Source
(# of players)
Level Jump height (cm)
Forwards Backs Unspecified*
Babault et al, 2007 [15]
(n = 25)
Professional provincial 40.1 ± 4.3
43.3 ± 4.3
Crewther et al, 2012 [59]
(n = 48)
Professional provincial 39.6 ± 8.6
41.8 ± 4.9
39.7 ± 5.9
34.2 ± 5.7
Elloumi et al, 2008 [91]
(n = 20)
International 35.5 ± 4.0
Elloumi et al, 2009 [90]
Forwards (n = 12)
Backs (n = 10)
International 35.1 ± 4.1 35.8 ± 3.8
Kilduff et al, 2008 [157]
(n = 20)
36.0 ± 1.2
Maso et al, 2002 [172]
Forwards (n = 10)
Backs (n = 10)
International 39.0 ± 5.6 44.3 ± 5.8
Randell et al, 2011 [210]
(n = 13)
Professional provincial 64.0 ± 7.0
67.0 ± 1.0
*Multiple values for one study represent where players were split into several groups.
Only limited published information exists on the strength characteristics of rugby sevens
players. A study of 12 club-level players demonstrated increases in gym-based strength
assessments following a six-week resistance-training programme conducted while players
were concurrently performing two additional sport-specific training sessions per week [58].
Improvements in bench press (11% improvement to 123 ± 21 kg, mean ± SD), back squat
(13% improvement to 162 ± 22 kg), deadlift (13% improvement to 176 ± 23 kg), military
press (10% improvement to 78 ± 10 kg), and chin-up (6% improvement to 116 ± 15 kg) 1-
RM strength were observed after training. The applicability of these findings to players
competing at higher levels of competition is unclear, as international-level players may
follow quite different training schedules and there are currently no published data on the
strength and power characteristics of top-level rugby sevens players. Details on the strength
and power characteristics of these players would provide valuable information to guide
physical development programmes and inform the transition of players between the two
rugby formats.
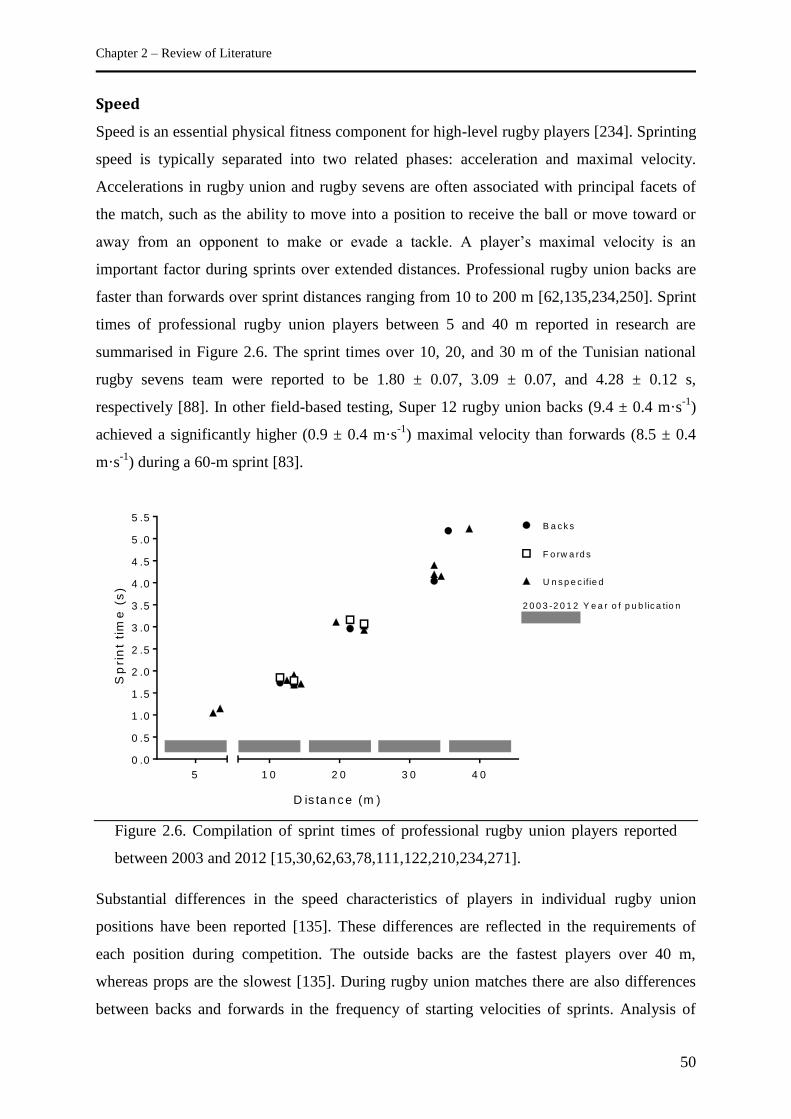
Chapter 2 – Review of Literature
50
Speed
Speed is an essential physical fitness component for high-level rugby players [234]. Sprinting
speed is typically separated into two related phases: acceleration and maximal velocity.
Accelerations in rugby union and rugby sevens are often associated with principal facets of
the match, such as the ability to move into a position to receive the ball or move toward or
away from an opponent to make or evade a tackle. A player’s maximal velocity is an
important factor during sprints over extended distances. Professional rugby union backs are
faster than forwards over sprint distances ranging from 10 to 200 m [62,135,234,250]. Sprint
times of professional rugby union players between 5 and 40 m reported in research are
summarised in Figure 2.6. The sprint times over 10, 20, and 30 m of the Tunisian national
rugby sevens team were reported to be 1.80 ± 0.07, 3.09 ± 0.07, and 4.28 ± 0.12 s,
respectively [88]. In other field-based testing, Super 12 rugby union backs (9.4 ± 0.4 m·s-1
)
achieved a significantly higher (0.9 ± 0.4 m·s-1
) maximal velocity than forwards (8.5 ± 0.4
m·s-1
) during a 60-m sprint [83].
D is ta n c e (m )
Sp
rin
t ti
me
(s
)
0 .0
0 .5
1 .0
1 .5
2 .0
2 .5
3 .0
3 .5
4 .0
4 .5
5 .0
5 .5B a c k s
F o rw a rd s
U n s p e c ifie d
2 0 0 3 -2 0 1 2 Y e a r o f p u b lic a tio n
5 1 0 2 0 3 0 4 0
Figure 2.6. Compilation of sprint times of professional rugby union players reported
between 2003 and 2012 [15,30,62,63,78,111,122,210,234,271].
Substantial differences in the speed characteristics of players in individual rugby union
positions have been reported [135]. These differences are reflected in the requirements of
each position during competition. The outside backs are the fastest players over 40 m,
whereas props are the slowest [135]. During rugby union matches there are also differences
between backs and forwards in the frequency of starting velocities of sprints. Analysis of
Chapter 2 – Review of Literature
51
Super 12 matches showed forwards commence most sprints from a standing start (41%) [83].
In contrast, for backs the frequency of starting speeds varied between standing (29%),
walking (29%), jogging (29%), and occasionally striding (13%) [83]. The discrimination in
acceleration and maximal velocity requirements between backs and forwards during
competition highlights the need for position-specific speed training programmes [83]. Such
speed development programmes should also incorporate ball-carrying technique, which can
affect a player’s sprint speed [116,268]. Differences in speed requirements specific to backs
and forwards in rugby sevens competition are unclear.
Seasonal Variations in Physical Characteristics and Capacities
Professional rugby union players compete in several competitions in a calendar year.
Consequently, it is not uncommon for elite players to compete in 30 to 40 matches in a 12-
month period. Many of these matches also require substantial travel which can have profound
implications on players’ health and performance [214,226]. It is the objective of any physical
preparation programme to maximise the opportunity for players to perform in competition
while minimising the risk of injury and illness. Accordingly, the cyclic annual training plan
for professional rugby players is typically structured into distinct phases each with its own
goals. The pre-season period is crucial in developing the physical and physiological attributes
required for successful competition performance. This phase is characterised by a high
training volume with increasing intensity. During the competition season, the objective of the
training programme is maintenance of the improvements in lean body mass, strength and
power, speed, and endurance achieved during pre-season training. This outcome is
challenging as training volume is often reduced and additional training goals are introduced
or emphasised, such as technical and tactical development. The off-season period provides
players with an interval for physical and psychological recovery and recuperation. The post-
season phase usually includes a reduction or even cessation of training.
The physical status of players will fluctuate over a season based on the nutritional strategies
employed and the priorities for conditioning and resistance training. There is limited research
on the changes in physical and physiological characteristics of rugby union players during a
competition season, and currently no longitudinal information on rugby sevens players. Four
weeks of intensive pre-season training with 33 Super Rugby players yielded moderate
increases in bench press strength, box squat strength, and mid-thigh girth and small increases
in fat-free mass and flexed upper-arm arm girth [4]. These changes accompanied a moderate
increase in perceptions of fatigue, thought to partially explain small decrements in power-
Chapter 2 – Review of Literature
52
oriented measurements. Conversely, 34 English Division One (second tier) professional
rugby union players showed a deterioration in strength and power, and anaerobic and aerobic
performance tests (-10.5 ± 38.5 to -1.5 ± 9.3%, mean change ± SD), coupled with a 5.5 ±
38.5% increase in sum of seven skinfolds thickness and -0.6 ± 9.3% decrease in body mass,
as a result of a six-week cessation of structured training in the post-season period [191].
Professional rugby union players can improve bench press strength and chin-up strength
during the competitive season by 1.8 and 1.9% of pre-season values, respectively [16].
Similarly, a study of Super Rugby players measuring upper- and lower-body strength and
power parameters on up to five occasions during a 13-week competitive season reported a
small increase in box squat strength and maintenance of bench press strength [8]. Decreases
observed in lower- and upper-body power measures were small and trivial, respectively. To
identify potential mechanisms for the variations observed within a season, testosterone and
cortisol steroid hormones were also measured as markers of the biological anabolic and
catabolic environment. Testosterone and cortisol increased moderately over the competitive
season, whereas there was a small decline in the testosterone-to-cortisol ratio. Relationships
between hormonal concentrations and strength and power measures were unclear.
Changes in anthropometric measures within and between seasons appear to be dependent
upon a player’s positional group. An examination of Super Rugby players from one team
between 1999 and 2003 found trivial changes in mean results for sum of seven skinfolds
thickness within and between seasons in backs [82]. Simultaneously, forwards showed a
small decrease in the sum of skinfolds from pre-season (November to January) to the Super
12 competition (February to May). Following the Super 12 season, the forwards had a small
increase in skinfolds during the club season (June to September). Changes in body mass and
lean mass index for both forwards and backs during the competitive season were trivial.
Improvements or decrements in a player’s anthropometry and components of fitness are
specific to the phase of the season. Jointly, these findings highlight the utility of monitoring a
player’s physical and physiological status over the course of a season to identify changes and
modify the physical preparation programme accordingly.
Relationships between Player Characteristics and Performance
Although the characteristics of rugby union players have been well documented and
information on rugby sevens players is emerging, little is known about the relationships
between player characteristics and playing performance. The priorities and specificity of
Chapter 2 – Review of Literature
53
physical training stimuli should reflect the degree to which each facet of fitness contributes to
match performance. For example, the significance of a player’s speed and acceleration
development is diminished if this characteristic does not transfer to an improvement in
playing performance. Indeed, a conceptual model has been presented in which fitness tests,
representative of specific physical characteristics, can be measured to signify the physical
constructs of team performance through a causal indicator, such as the quantity of high-
intensity activity performed during a match [147].
A study of 510 national provincial-, professional-, and international-level rugby union players
identified relationships between fitness testing results and performance indicators during 296
matches [234]. Small to moderate negative correlations were present between sprint times
and line breaks, metres advanced, tackle breaks, and tries scored. Percentage of body fat and
mean repeated-sprint time in the forwards, and decrement in repeated-sprint ability in the
backs, had small to moderate associations with activity rate on and around the ball. As may
be expected, the small to moderate relationships between physical testing scores and key
performance indicators demonstrate factors other than physical characteristics account for a
large portion of match statistics. However, associations between the aforementioned
performance indicators and successful phase and team outcomes infer the relative importance
of physical characteristics to on-field events [153,195,223,272].
The potential compromise between muscularity and endurance is demonstrated by the nature
of relationships between players’ anthropometric characteristics and measures of locomotive
work-rate. Mesomorphy and muscle mass were negatively correlated with the amount of
high-intensity running performed by players during matches of an international rugby sevens
tournament in 1996 [216]. During this tournament though, neither anthropometric profiles
nor work-rate measures were able to distinguish between winning and losing teams. These
findings are in contrast to a similar study of the anthropometric characteristics of rugby
sevens players which reported significant differences in estimates of absolute and relative
muscle mass, absolute bone mass, relative body fat, endomorphy, and mesomorphy between
players of teams that finished in the top and bottom four rankings during two tournaments in
1996 and 1997 [215]. Greater muscle mass is advantageous during contact situations and
contests for possession such as scrums, rucks, and mauls. Although the associations between
muscle mass and high-intensity running do not imply a causal relationship, they indicate the
potential for increased muscle mass to be associated with a faster onset of fatigue. Further
investigation is required to verify this relationship in rugby union and rugby sevens players.
Chapter 2 – Review of Literature
54
Physical Development and Training Interventions
Although frameworks for the medium- to long-term physical development of elite-level
rugby union players have been proposed [81,109], most contemporary studies of physical
development programmes and training interventions have focused on short-term changes in
specific factors relating to competition performance in isolation. More recent research has
considered such issues as the effects of hypoxic exposure [119,137], interventions to improve
speed and acceleration [49,126,238,271], and gym-based programmes aimed at augmenting
measures of strength and power [6,9,56,61,123]. Studies have also examined other methods
to improve markers of performance, including electromyostimulation to improve muscle
strength and power [15] and skill-based conditioning games to improve cardiorespiratory
fitness [110]. In contrast, studies of training programmes to improve rugby-specific skills
have received little attention [138], and only in rugby union players.
Mixed-method training programmes (incorporating both resistance and on-field training) over
multiple weeks are beneficial in developing a variety of physical qualities in adolescent [235]
and professional [4] rugby union players and international rugby sevens players [58,88].
Although many novel training strategies can improve physical qualities and indicators
relevant to rugby performance, most research has focused on sub-elite players. Differences in
the player characteristics, competition demands, and training habits between sub-elite or
junior players and top-level professional players may limit the application of these findings.
As an example, only one study of adolescent players has examined the specificity of on-field
training activities in comparison to matches [128]. Examination of the specificity of typical
training practices of international rugby sevens players would support the development of
physical preparation programmes that replicate the demands of competition and optimise the
efficiency of training time.
Conclusions
There is a growing body of knowledge on the tactical, physical, and physiological demands
of rugby union competition and the anthropometric, physical, and physiological
characteristics of players of various positions to meet these demands. Generally, rugby union
forwards are heavier and taller compared with backs, and have higher absolute results for
strength, aerobic capacity, and anaerobic power. These characteristics assist forwards in the
higher contact demands during matches than backs, and associated increased cardiovascular
load. In contrast, rugby union backs are typically leaner and faster compared with forwards,
Chapter 2 – Review of Literature
55
and have greater muscular power production and aerobic capacity when values are expressed
relative to body mass. Such qualities support the greater distances covered by backs during
matches and higher sprint demands compared with forwards. Although, the observed
evolution of rugby union dictates that ongoing research is required to meet the changing
characteristics of players and match activities at different levels of competition.
Comprehensive investigations of the characteristics of players, fitness requirements, and
movement patterns during competition available in rugby union do not currently exist in
rugby sevens. This information is required to guide development of effective evidence-based
physical preparation programmes. Given the increased worldwide popularity of rugby sevens
and the corresponding interest in the contribution of sports science to training and
competition performance, three main priority areas emerge for future applied research in the
sport. Firstly, research is required to establish the technical, tactical, and physical demands of
the sport. Investigations in this area will determine the key differences between rugby union
and rugby sevens and quantify the effects of changes to the game format, such as the reduced
number of players on the field and the tournament style of competition. Secondly, analysis of
the characteristics of players currently competing at the international level will help establish
the requirements for competition. Comparing and contrasting the qualities of rugby sevens
and professional rugby union players will also assist development of talent identification and
transfer programmes. Finally, once the requirements of rugby sevens competition and
priorities for physical and physiological development are established, future research should
investigate methods of training which maximise adaptations to benefit performance while
minimising the risk of injury. Findings from research into these three key areas will inform
strategies designed to improve specific components of rugby sevens performance.
Chapter 3 – Performance Indicators Related to Points Scoring and Winning in International Rugby Sevens
56
Chapter Three - Performance Indicators Related to Points
Scoring and Winning in International Rugby Sevens
Higham, D.G., Hopkins, W.G., Pyne, D.B., & Anson, J.M. (2014). Performance indicators
related to points scoring and winning in international rugby sevens. Journal of Sports Science
and Medicine, 13(2), 358-364.
Abstract
Identification on performance indicators related to scoring points and winning is needed to
inform tactical approaches to international rugby sevens competition. The aim of this study
was to characterise team performance indicators in international rugby sevens and quantify
their relationship with a team’s points scored and probability of winning. Performance
indicators of each team during 196 matches of the 2011/2012 International Rugby Board
Sevens World Series were modelled for their linear relationships with points scored and
likelihood of winning within (changes in team values from match to match) and between
(differences between team values averaged over all matches) teams. Relationships were
evaluated as the change and difference in points and probability of winning associated with a
two within- and between-team standard deviations increase in performance indicator values.
Inferences about relationships were assessed using a smallest meaningful difference of one
point and a 10% probability of a team changing the outcome of a close match. All indicators
exhibited high within-team match-to-match variability (intraclass correlation coefficients
ranged from 0.00 to 0.23). Excluding indicators representing points-scoring actions or events
occurring on average less than once per match, 13 of 17 indicators had substantial clear
within-team relationships with points scored and/or likelihood of victory. Relationships
between teams were generally similar in magnitude but unclear. Tactics that increase points
scoring and likelihood of winning should be based on greater ball possession, fewer rucks,
mauls, turnovers, penalties and free kicks, and limited passing.
Key words: match analysis, modelling, notational analysis, performance analysis, rugby
union, statistics
Chapter 3 – Performance Indicators Related to Points Scoring and Winning in International Rugby Sevens
57
Introduction
Rugby sevens is a complex team sport requiring a combination of fitness and physical ability
[132,133], execution of technical skills [175], and tactical and strategic considerations [144]
for success at the international level. The dynamic match environment can make it difficult
for coaches and support staff to identify which elements of physical, technical, and tactical
development to target to enhance the probability of successful performance. Match analysis is
often used to provide an objective and unbiased record of team activity to assess and monitor
performance. However, it is unclear which performance indicators should be monitored to
evaluate team performance in rugby sevens.
A performance indicator is a variable that characterises some aspect of performance [146]. To
be meaningful and useful, performance indicators should be related to a successful
performance outcome. Research is required to characterise the technical and tactical aspects
of team play related to successful performance in rugby sevens. In team sports such as rugby
sevens, the primary criterion for assessing a team’s performance is the match outcome,
determined by the points scored by each team. The final point difference, that is, the margin
of victory or loss, provides important contextual information relating to how well matched
the competing teams are and the relative success of the tactics and strategies employed. Team
performance indicators should therefore be considered in relation not only to winning
[153,195], but also points scored in close matches [263,264].
Team performance indicators describing individual or collective skills or match events may
fluctuate as a function of environmental conditions, officiating style, and each team’s
technical strengths and weaknesses. Analyses of limited data sets, such as those of a single
tournament or team, may be heavily influenced by these variables and not truly representative
of international-level competition. By analysing a large sample of matches from different
national teams, played under varying conditions, issues related to match volatility are
minimised and performance indicators commonly associated with successful performances
can be identified.
Identifying performance indicators related to scoring points and winning in rugby sevens may
be used to develop reference values for international matches. These values can be used by
coaches and support staff to inform practical guidelines for technical and tactical
development. Knowledge of performance indicators can also be used to create performance
profiles to predict team behaviours and performance outcomes. The purpose of this study was
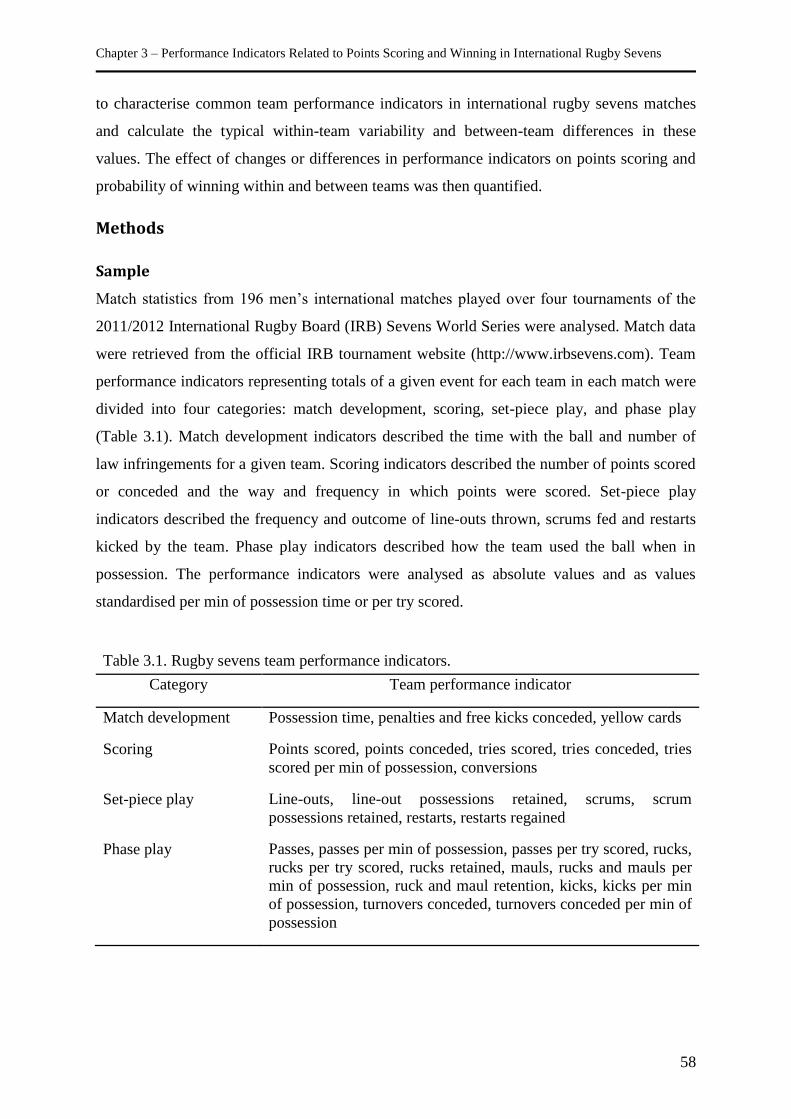
Chapter 3 – Performance Indicators Related to Points Scoring and Winning in International Rugby Sevens
58
to characterise common team performance indicators in international rugby sevens matches
and calculate the typical within-team variability and between-team differences in these
values. The effect of changes or differences in performance indicators on points scoring and
probability of winning within and between teams was then quantified.
Methods
Sample
Match statistics from 196 men’s international matches played over four tournaments of the
2011/2012 International Rugby Board (IRB) Sevens World Series were analysed. Match data
were retrieved from the official IRB tournament website (http://www.irbsevens.com). Team
performance indicators representing totals of a given event for each team in each match were
divided into four categories: match development, scoring, set-piece play, and phase play
(Table 3.1). Match development indicators described the time with the ball and number of
law infringements for a given team. Scoring indicators described the number of points scored
or conceded and the way and frequency in which points were scored. Set-piece play
indicators described the frequency and outcome of line-outs thrown, scrums fed and restarts
kicked by the team. Phase play indicators described how the team used the ball when in
possession. The performance indicators were analysed as absolute values and as values
standardised per min of possession time or per try scored.
Table 3.1. Rugby sevens team performance indicators.
Category Team performance indicator
Match development Possession time, penalties and free kicks conceded, yellow cards
Scoring Points scored, points conceded, tries scored, tries conceded, tries
scored per min of possession, conversions
Set-piece play Line-outs, line-out possessions retained, scrums, scrum
possessions retained, restarts, restarts regained
Phase play Passes, passes per min of possession, passes per try scored, rucks,
rucks per try scored, rucks retained, mauls, rucks and mauls per
min of possession, ruck and maul retention, kicks, kicks per min
of possession, turnovers conceded, turnovers conceded per min of
possession
Chapter 3 – Performance Indicators Related to Points Scoring and Winning in International Rugby Sevens
59
Statistical Analysis
Data were imported into the Statistical Analysis System (version 9.3, SAS Institute, Cary,
NC) for analysis. Mean values and true between-team and within-team standard deviation for
common team performance indicators were calculated using a mixed-model reliability
analysis with a random effect for team. Mean values were estimated as the intercept of the
model with the between-team standard deviation calculated from the random effect, and the
within-team standard deviation calculated from the residual variance. A standard deviation
representing observed between-team match-to-match typical differences was calculated as the
square root of the sum of the true between-team and within-team variances. Intraclass
correlation coefficients representing match-to-match reliability of performance indicators
were calculated as the true between-team variance divided by the observed between-team
variance.
Performance indicators representing events occurring on average more than once per match,
and not directly representing points-scoring actions, were further analysed for their
relationship with points scored by a team and the probability of winning. A mixed model with
the performance indicator as a linear fixed effect, a random effect for team, and an interaction
effect for performance indicator and team, was employed to characterise the relationship
between the performance indicator and points scored within each team. This model allowed
for the possibility of individual team differences in the relationship between the performance
indicator and points scored. An additional interaction effect for team and the tournament at
which matches were played, allowing for individual team differences in the relationship at
different tournaments, was removed from the model because it explained no additional
variance in points scored. A linear relationship between performance indicators and points
scored was deemed appropriate after assessment of a quadratic trend yielded no additional
meaningful information. A linear model was also favoured for its simpler interpretation. The
effect of a change within a team in performance indicator value on points scored was
assessed by multiplying the slope of the relationship by two within-team standard deviations
[141]. Two standard deviations represents the change within a team from a typically low
performance indicator value (-1 SD) to a typically high value (+1 SD).
A between-team effect of the selected indicators was assessed by averaging the values of the
performance indicator and points scored for each of the 26 teams. The effect of the
performance indicator was derived by multiplying the slope of the linear relationship between
Chapter 3 – Performance Indicators Related to Points Scoring and Winning in International Rugby Sevens
60
the means by twice the standard deviation of the teams' mean values of the performance
indicator.
Generalised linear modelling was used to estimate the effect of an increase in performance
indicator value on a team’s probability of winning. Cumulative logistic regression was
employed to model categorical match outcomes of a win or loss, allowing for the inclusion of
drawn matches. The addition of a random effect for team allowed for individual team
differences. The logarithm of the odds ratio of winning was calculated and the effect of a two
within- and between-team means standard deviation increase in the performance indicator
value expressed as a percent change or difference in the likelihood of a team winning a close
match (probability of winning centred on 50%).
Possible confounding effects of two important performance indicators (passes per min of
possession and rucks and mauls per min of possession) were analysed by assessing the effects
of a two standard deviation increase in the performance indicator after adjusting for the
second indicator by adding it to the model as a covariate. The results of these analyses did not
change the inferences about the effect on points and probability of winning and are therefore
not shown.
Inferences about effects of performance indicators were assessed using the smallest
meaningful difference in points scored during close matches. In this context, close matches
were defined as those with a final points score difference of 7, corresponding to match
outcomes decided by a converted try or less (41% of observed matches, n = 80). The smallest
meaningful difference is given by 0.3 of the typical variation between competitions of an
athlete's or team's performance [140]. This difference was calculated as the standard
deviation of the points difference in close matches (4.5) multiplied by 0.3/√2, equal to
approximately one point. The formula was divided by the square root of two to account for
the combined random variation in the performance of the two teams contesting a match. The
smallest meaningful difference represents the difference in a team’s points score required to
change the match outcome in ~10% of close matches. Similarly, 10% was defined as the
smallest meaningful difference in the analyses of a team’s probability of changing a match
outcome. A 10% difference represents one extra win or loss in 10 evenly-balanced matches.
An inference about the true value of an effect was based on the uncertainty of its magnitude.
When the 90% confidence interval crossed the threshold for both negative and positive values
of the smallest meaningful difference, the effect was deemed unclear [141].
Chapter 3 – Performance Indicators Related to Points Scoring and Winning in International Rugby Sevens
61
Results
Values for match development, scoring, set-piece play and phase play indicators in a typical
match summarised by the mean and observed standard deviation are presented in Table 3.2.
The observed standard deviation consists of contributions from the between-team standard
deviation, representing the stable typical differences between teams, and the within-team
standard deviation, representing the typical variability a team shows between matches. All
performance indicators exhibited higher variability in changes within teams than differences
between teams. The intraclass reliability correlation coefficients ranged from 0.00 to 0.23.
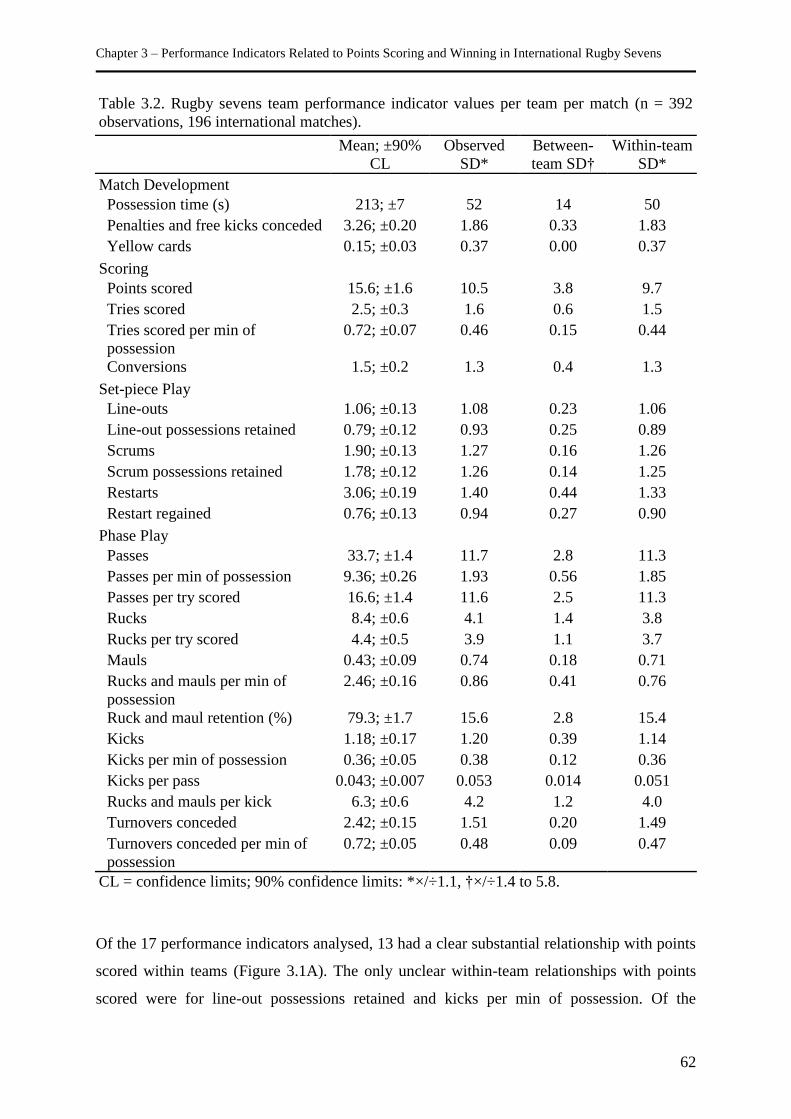
Chapter 3 – Performance Indicators Related to Points Scoring and Winning in International Rugby Sevens
62
Table 3.2. Rugby sevens team performance indicator values per team per match (n = 392
observations, 196 international matches).
Mean; ±90%
CL
Observed
SD*
Between-
team SD†
Within-team
SD*
Match Development
Possession time (s) 213; ±7 52 14 50
Penalties and free kicks conceded 3.26; ±0.20 1.86 0.33 1.83
Yellow cards 0.15; ±0.03 0.37 0.00 0.37
Scoring
Points scored 15.6; ±1.6 10.5 3.8 9.7
Tries scored 2.5; ±0.3 1.6 0.6 1.5
Tries scored per min of
possession
0.72; ±0.07 0.46 0.15 0.44
Conversions 1.5; ±0.2 1.3 0.4 1.3
Set-piece Play
Line-outs 1.06; ±0.13 1.08 0.23 1.06
Line-out possessions retained 0.79; ±0.12 0.93 0.25 0.89
Scrums 1.90; ±0.13 1.27 0.16 1.26
Scrum possessions retained 1.78; ±0.12 1.26 0.14 1.25
Restarts 3.06; ±0.19 1.40 0.44 1.33
Restart regained 0.76; ±0.13 0.94 0.27 0.90
Phase Play
Passes 33.7; ±1.4 11.7 2.8 11.3
Passes per min of possession 9.36; ±0.26 1.93 0.56 1.85
Passes per try scored 16.6; ±1.4 11.6 2.5 11.3
Rucks 8.4; ±0.6 4.1 1.4 3.8
Rucks per try scored 4.4; ±0.5 3.9 1.1 3.7
Mauls 0.43; ±0.09 0.74 0.18 0.71
Rucks and mauls per min of
possession
2.46; ±0.16 0.86 0.41 0.76
Ruck and maul retention (%) 79.3; ±1.7 15.6 2.8 15.4
Kicks 1.18; ±0.17 1.20 0.39 1.14
Kicks per min of possession 0.36; ±0.05 0.38 0.12 0.36
Kicks per pass 0.043; ±0.007 0.053 0.014 0.051
Rucks and mauls per kick 6.3; ±0.6 4.2 1.2 4.0
Turnovers conceded 2.42; ±0.15 1.51 0.20 1.49
Turnovers conceded per min of
possession
0.72; ±0.05 0.48 0.09 0.47
CL = confidence limits; 90% confidence limits: *×/÷1.1, †×/÷1.4 to 5.8.
Of the 17 performance indicators analysed, 13 had a clear substantial relationship with points
scored within teams (Figure 3.1A). The only unclear within-team relationships with points
scored were for line-out possessions retained and kicks per min of possession. Of the
Chapter 3 – Performance Indicators Related to Points Scoring and Winning in International Rugby Sevens
63
indicators demonstrating clear relationships, scrums and scrum possessions retained had
trivial effects (within the positive and negative thresholds for the smallest meaningful
difference). In contrast, the only clear between-team relationships with points scored were for
rucks and mauls per min of possession, penalties and free kicks conceded, passes per min of
possession, scrum possessions retained, possession time, and percentage of ruck and maul
retention (Figure 3.1A). Rucks and mauls per min of possession had the strongest relationship
with points scored. Figure 3.2 shows the differences in mean rucks and mauls per min of
possession between teams and substantial negative between- and within-team relationships
with points scored in a match.
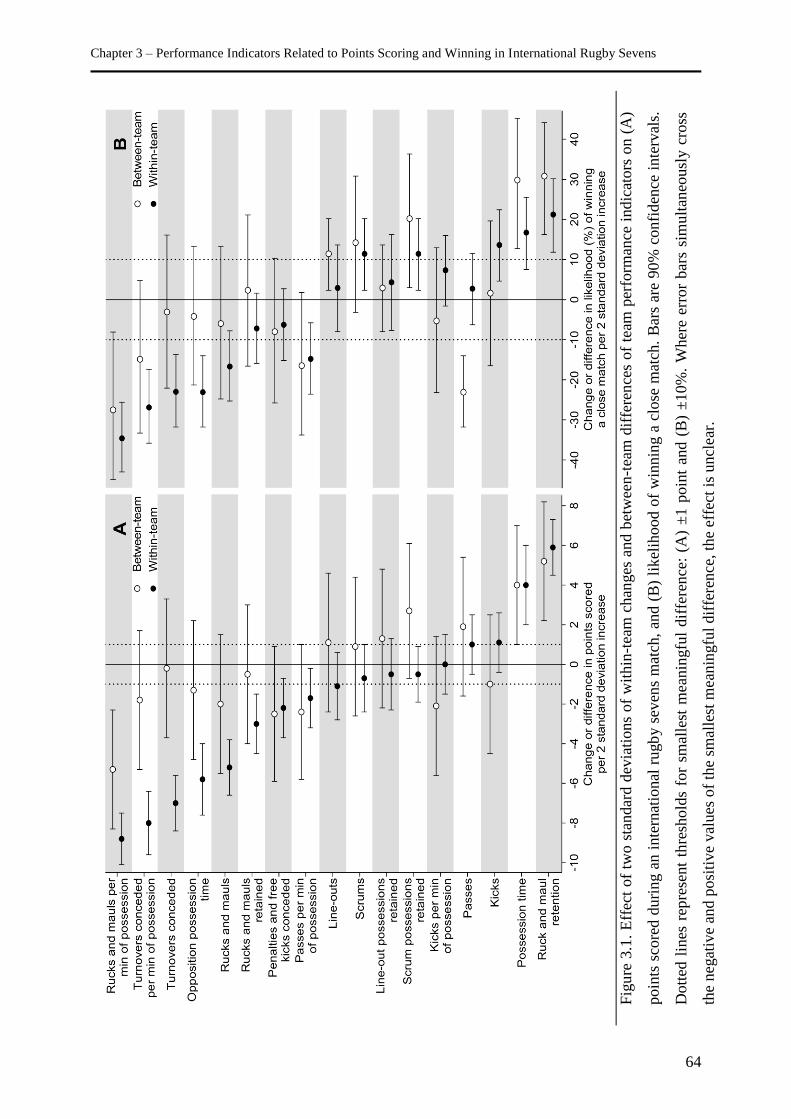
Chapter 3 – Performance Indicators Related to Points Scoring and Winning in International Rugby Sevens
64
Fig
ure
3.1
. E
ffec
t of
two
sta
ndar
d d
evia
tions
of
wit
hin
-tea
m c
han
ges
and b
etw
een
-tea
m d
iffe
ren
ces
of
team
per
form
ance
indic
ators
on (
A)
poin
ts s
core
d d
uri
ng a
n i
nte
rnat
ional
rugb
y s
even
s m
atch
, an
d (
B)
likel
ihood o
f w
innin
g a
clo
se m
atch
. B
ars
are
90%
confi
den
ce i
nte
rval
s.
Dott
ed l
ines
rep
rese
nt
thre
shold
s fo
r sm
alle
st m
eanin
gfu
l dif
fere
nce
: (A
) ±
1 p
oin
t an
d (
B)
±10%
. W
her
e er
ror
bar
s si
mult
aneo
usl
y c
ross
the
neg
ativ
e an
d p
osi
tive
val
ues
of
the
smal
lest
mea
nin
gfu
l dif
fere
nce
, th
e ef
fect
is
uncl
ear.
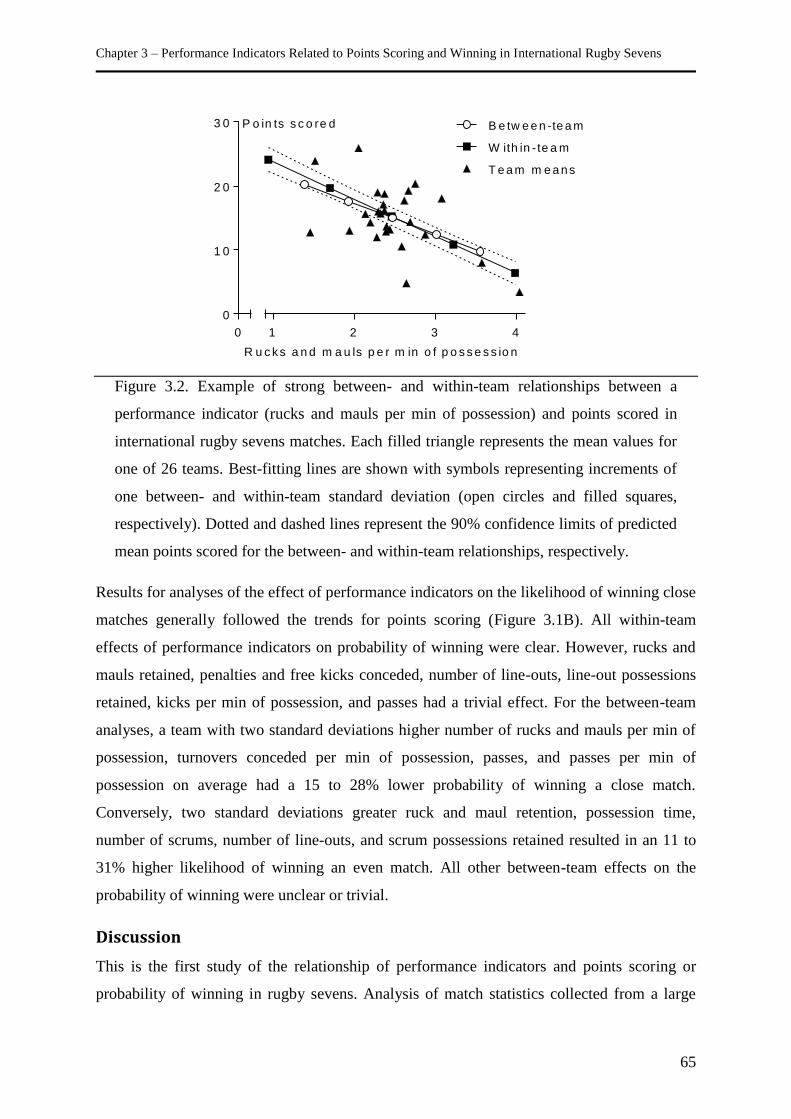
Chapter 3 – Performance Indicators Related to Points Scoring and Winning in International Rugby Sevens
65
0
0
1 0
2 0
3 0
1 2 3 4
R u c k s a n d m a u ls p e r m in o f p o s s e s s io n
P o in ts s c o re d
W ith in - te a m
B e tw e e n -te a m
T e a m m e a ns
Figure 3.2. Example of strong between- and within-team relationships between a
performance indicator (rucks and mauls per min of possession) and points scored in
international rugby sevens matches. Each filled triangle represents the mean values for
one of 26 teams. Best-fitting lines are shown with symbols representing increments of
one between- and within-team standard deviation (open circles and filled squares,
respectively). Dotted and dashed lines represent the 90% confidence limits of predicted
mean points scored for the between- and within-team relationships, respectively.
Results for analyses of the effect of performance indicators on the likelihood of winning close
matches generally followed the trends for points scoring (Figure 3.1B). All within-team
effects of performance indicators on probability of winning were clear. However, rucks and
mauls retained, penalties and free kicks conceded, number of line-outs, line-out possessions
retained, kicks per min of possession, and passes had a trivial effect. For the between-team
analyses, a team with two standard deviations higher number of rucks and mauls per min of
possession, turnovers conceded per min of possession, passes, and passes per min of
possession on average had a 15 to 28% lower probability of winning a close match.
Conversely, two standard deviations greater ruck and maul retention, possession time,
number of scrums, number of line-outs, and scrum possessions retained resulted in an 11 to
31% higher likelihood of winning an even match. All other between-team effects on the
probability of winning were unclear or trivial.
Discussion
This is the first study of the relationship of performance indicators and points scoring or
probability of winning in rugby sevens. Analysis of match statistics collected from a large
Chapter 3 – Performance Indicators Related to Points Scoring and Winning in International Rugby Sevens
66
sample of matches during four international tournaments allowed reference values for
common team performance indicators to be generated. The analysis also quantified the
typical variability between matches in performance indicator values for a given team. There
was greater variability in changes in performance indicator values within a team than
between teams. Excluding performance indicators representing points-scoring actions or
events occurring on average less than once per match, 13 of 17 indicators had substantial
clear relationships with a team’s points score and/or likelihood of victory. In general, the
within- and between-team effects of performance indicators were similar for a team’s points
score and probability of winning an evenly-contested match. An increase or positive
difference in rucks and mauls per min of possession had the largest negative association with
a team’s points and likelihood of winning. Conversely, the percentage of rucks and mauls
retained had the largest positive effect. The observed relationships indicate priorities for
technical and tactical development of teams at the international level.
The relationships between performance indicators, points scoring and likelihood of winning
support findings from international matches played in 2001, which identified differences in
the tactics employed by successful and unsuccessful teams [144]. When in possession of the
ball, successful teams adopted a more evasive style of play, whereas unsuccessful teams were
more direct in their patterns of play. The current findings of higher possession time having a
positive effect on points scoring and chances of winning are in agreement with these
observations, suggesting successful teams are more patient and have greater control of the
game. A more direct approach, resulting in a higher frequency of rucks and mauls, was
related to a lower points score and probability of a successful match outcome, even when the
ruck and maul possession was retained. Unsurprisingly, a higher point score was associated
with greater relative ruck and maul possession retention, and fewer turnovers in possession
and penalties and free kicks conceded.
Absolute frequency of passing and kicking within a team were positively related with points
scored, but when these actions were standardised relative to possession time the results were
reversed and unclear, respectively. The positive relationships of absolute frequency of these
events and points scoring appear more indicative of the higher ball possession time of higher-
scoring teams than the technical actions alone. During international matches played in 2001,
successful teams tended to kick less frequently than less successful teams [144]. Furthermore,
although the number of passes per match was similar between the teams, successful teams
performed fewer normal passes and loop passes, and more miss (cut-out) passes and dummy
Chapter 3 – Performance Indicators Related to Points Scoring and Winning in International Rugby Sevens
67
passes [144]. These differences, coupled with the fewer rucks and mauls performed by
successful teams, suggest the tactical approach of better teams is to keep the ball “alive” and
attack with more width and deception in preference to going into contact when in possession.
To increase the opportunities for points-scoring movements and probability of winning in
international competition, teams should aim to maintain ball possession. The importance of
maintaining possession concurs with the observation that teams progressing beyond the
quarter-final in the 2005 IRB Rugby World Cup Sevens secured and maintained control of
the ball for periods between 30 and 60 s, and converted over 30% of possessions into points-
scoring movements [261]. The possession-based approach of successful teams in
international rugby sevens contrasts with observations in international rugby union
competition. Winning in international rugby union has been associated with a territory-based
strategy, where teams are more likely to kick the ball when in possession [33,195]. The
difference in successful tactics between rugby sevens and rugby union likely represents the
additional space available for players in the abridged format. The reduced number of players
on the field in rugby sevens increases the opportunity for teams to initiate points-scoring
movements from any position on the field. This scenario results in a greater importance of
ball possession and less significance of field position and set-piece plays.
Teams conceding more penalties and free kicks tended to score fewer points. Nevertheless,
the effect on the likelihood of winning was unclear between teams and trivial within teams. In
2001, successful international teams with a win rate of ≥70% conceded more penalties per
match than unsuccessful teams [144]. This discrepancy in the number of penalties conceded
may be explained by successful teams being more likely to utilise the advantage rule to
continue play following an infringement by the opposition. Although conceding points to the
opposition through penalty goals is very rare in rugby sevens (and hence not included in
Table 3.2), conceding penalties and free kicks limits a team’s opportunities to score by giving
the opposition territory and possession. The association between poorer discipline and lower
scoring performances warrants further investigation into the timing and circumstances of
penalties and free kicks being awarded. It is unclear whether there are differences between
successful and unsuccessful teams in the frequency of law infringements when in possession
of the ball or when defending.
Previous studies of team performance indicators have been limited by analytical methods that
consider only the collective characteristics of successful and unsuccessful performances,
Chapter 3 – Performance Indicators Related to Points Scoring and Winning in International Rugby Sevens
68
leading to subtleties in individual team performances becoming indistinguishable [246]. The
limitation of generalising trends in match statistics to individual teams was accounted for in
the current study by analysing the relationship of within-team changes in performance
indicators with points scoring and probability of success. This model allowed individual
differences between teams in tactical approaches to be preserved while still estimating the
mean effect on points scored and likelihood of winning. The within-team relationships
characterised in this study represent the observed and achievable change in points scored and
odds of winning as a team changes its performance indicator, whereas the between-team
relationships represent stable long-term differences in performance between teams. A similar
approach could be employed to determine the influence of performance indicators on success
in other sports and with other frequent match events or player actions.
It should be noted that the analysis of the relationships between performance indicators,
points scoring and winning does not imply a cumulative effect when indicators are combined.
Although it is possible to prioritise the importance of individual statistics based on their
association with scoring and successful outcomes, it is likely there are substantial correlations
between some performance indicators. For example, in most matches, increasing a team’s
absolute possession time will simultaneously restrict their opposing team’s possession.
However, preliminary analyses of the effects of a performance indicator adjusted for a second
performance indicator demonstrated independent effects on points scoring and probability of
winning (results not shown). These results suggest that in some circumstances a team’s
performance may be improved by independently changing performance indicator values.
Given the open nature of rugby sevens with additional space afforded to players compared
with 15-player rugby union, defensive actions and structures are crucial in determining the
outcome of matches. The current study focused on performance indicators representative of
actions performed by teams when in possession of the ball. As it is impossible to maintain
possession of the ball for an entire match, future studies could investigate relationships
between defensive performance indicators and points scored by the opposition. This
investigation was limited to official match statistics routinely collected by the IRB during the
international IRB Sevens World Series. Subsequent research should examine additional
performance indicators that may further inform the technical and tactical preparation of teams
for competition.
Chapter 3 – Performance Indicators Related to Points Scoring and Winning in International Rugby Sevens
69
While it is apparent the team performance indicators described in this study are representative
of technical and tactical factors associated with successful match outcomes, clearly other
elements also influence team performance. Factors such as players’ physiques, fitness and
physical ability, skill and technical proficiency are all determinants of the success of a team.
Although some of the performance indicators examined may be partially representative of
these factors and the strategies employed by successful teams, coaches must consider the
interaction of the multitude of components related to performance in rugby sevens at the
international level.
Conclusion
Coaches and support staff can use the performance indicator values presented in this study as
a reference to monitor and assess the performance of their team as well as opposing teams.
Coaches can then devise strategies and assign priorities for team preparation based on each
performance indicator’s effect on points scoring and chances of winning. There is greater
variability in within-team changes than between-team differences in team performance
indicator values. The associations of performance indicators with points scoring and
probability of winning suggest higher-scoring and more-successful teams tend to control
possession of the ball and play a patient, disciplined and evasive style of game. A less
disciplined and more direct approach, characterised by conceding more penalties and free
kicks and performing more rucks and mauls, gives the opposition greater opportunity to gain
ball possession and is associated with lower scores. Team tactics that maximise the amount of
points scored and likelihood of winning should be based on strategies that promote greater
ball possession, minimise rucks and mauls, turnovers, penalties and free kicks, and limit
passes.
Key Points
Successful international rugby sevens teams tend to maintain ball possession; more
frequently avoid taking the ball into contact; concede fewer turnovers, penalties and
free kicks; retain possession in scrums, rucks and mauls; and limit passing the ball.
Selected performance indicators may be used to evaluate team performances and plan
more effective tactical approaches to competition.
There is greater match-to-match variability in performance indicator values within
than between international rugby sevens teams.
Chapter 3 – Performance Indicators Related to Points Scoring and Winning in International Rugby Sevens
70
The priorities for a rugby sevens team’s technical and tactical preparation should
reflect the magnitudes of the relationships between performance indicators, points
scoring and the likelihood of winning.
Chapter 4 – Relationships between Rugby Sevens Performance Indicators and International Tournament
Outcomes
71
Chapter Four - Relationships between Rugby Sevens
Performance Indicators and International Tournament
Outcomes
Higham, D.G., Hopkins, W.G., Pyne, D.B., & Anson, J.M. (2014). Relationships between
rugby sevens performance indicators and international tournament outcomes. Journal of
Quantitative Analysis in Sports, 10(1), 81-87.
Abstract
Objectives: Identifying performance indicators related to rugby sevens competition outcomes
will inform development of team tactics that increase the likelihood of success. This study
characterised 16 team performance indicators and quantified the effect of changes and
differences in performance indicators within and between teams on team ranking in
international tournaments.
Design: Official tournament statistics and final ranking of each team in each of nine men’s
tournaments of the 2011/2012 International Rugby Board Sevens World Series were analysed
in a retrospective longitudinal design.
Methods: Novel analyses involving linear mixed modelling quantified the effects within and
between teams of an increase in performance indicators from a typically low to typically high
value on the logarithm of the tournament ranking. Magnitudes of effects were assessed using
a smallest meaningful difference in ranking.
Results: Three performance indicators had substantial within-team effects and twelve had
substantial between-team effects on tournament ranking. More entries into the opposition’s
22-m zone per match, tries per entry into the opposition’s 22-m zone, tackles per match,
passes per match, rucks per match and a higher percentage of tackle completion were
associated with a better mean ranking. Conversely, more passes per try, rucks per try, kicks
per try, errors per match, surrendered possessions per match, and missed tackles per match
were related to a worse ranking.
Chapter 4 – Relationships between Rugby Sevens Performance Indicators and International Tournament
Outcomes
72
Conclusions: The most successful teams maintain ball possession by reducing errors and
turnovers, are efficient in converting possession into tries, and have effective defensive
structures resulting in a high rate of tackle completion.
Key words: rugby union, statistics, performance analysis, notational analysis, match
analysis, modelling
Chapter 4 – Relationships between Rugby Sevens Performance Indicators and International Tournament
Outcomes
73
Introduction
Coaches and support staff incessantly seek to better understand factors that contribute to
success in international competition. In rugby sevens, as with other sports, match statistics
collected during competition provide useful, objective and critical information on the
technical proficiency of teams, strategies, tactics and patterns of play employed by different
teams, and key performance indicators that discriminate between successful and unsuccessful
teams. The utility of such information provides a valuable description of the nature of the
sport and highlights areas for team development and match preparation.
Performance analysis in 15-player rugby union has identified statistics that discriminate
between winning and losing teams [195,263,264], examined specific components of play
such as rucks [259] and tackles [257,258], quantified changes in match activities over time
[205,276], and been used to monitor the performance of individual players [37,164].
However, unlike rugby union, rugby sevens has received little scientific examination despite
an increase in worldwide popularity. Rugby sevens differs from rugby union in a number of
fundamental ways, including the reduced number of players on the field for each team (seven
vs. 15) and shorter match duration (14 vs. 80 min; a 20 min match is played for a tournament
final). International competition also differs between the rugby formats, as rugby sevens is
played in 2- or 3-day tournaments. The International Rugby Board (IRB) Sevens World
Series is an annual series of international rugby sevens tournaments contested by national
teams from around the world. In 2016, rugby sevens will debut at the Olympic Games in Rio
de Janeiro, Brazil.
While performance analysis studies have been conducted in rugby union, differences in
movement patterns [132] and player characteristics [133] as well as the more “open” nature
of rugby sevens are likely to impose different technical requirements for success. The
purpose of this study was to establish reference values for team performance indicators
during international rugby sevens tournaments and identify the most important performance
indicators for success by quantifying relationships between match statistics and final team
rankings in IRB Sevens World Series tournaments.
Chapter 4 – Relationships between Rugby Sevens Performance Indicators and International Tournament
Outcomes
74
Methods
Sample
A retrospective longitudinal study design was employed. Summary match statistics and final
ranking position of teams from nine international men’s tournaments of the 2011/2012 IRB
Sevens World Series (392 matches, five or six matches per team per tournament) were
retrieved from the official tournament website (http://www.irbsevens.com). The statistics
collected for analysis included: passes per match, kicks per match, completed tackles per
match, missed tackles per match, percentage of tackle completion, errors per match,
surrendered possessions per match, rucks per match, tries per match, rucks per try, kicks per
try, passes per try, percentage of restarts regained, percentage of restart errors, entries into
opposition’s 22-m zone per match, and tries per entry into opposition’s 22-m zone.
Statistics representing totals over the entire tournament for each match event for each team
were expressed as a relative value (e.g., a percentage or per match) to account for differences
in the number of matches contested, tries scored and restart kicks taken by each team in each
tournament.
Statistical Analysis
Data were imported into the Statistical Analysis System (version 9.3, SAS Institute, Cary,
NC) for analysis. The mean value, within-team standard deviation (SD), and true between-
team standard deviation for team performance indicators were calculated using mixed model
reliability analysis with a random effect for team. The mean value was estimated as the
intercept of the model, the between-team standard deviation was calculated from the random
effect, and the within-team standard deviation was calculated from the residual variance. A
standard deviation representing typical observed tournament-to-tournament differences
between teams was calculated as the square root of the sum of the true between-team and
within-team variances. Intraclass correlation coefficients representing tournament-to-
tournament reliability of performance indicators were calculated as the true between-team
variance divided by the observed between-team variance. Final tournament rankings were
logarithmically transformed to estimate and give equal importance to percent or factor
differences in rankings rather than absolute differences. For example, the difference between
second and first is equivalent to the difference between tenth and ninth without
transformation (one rank improvement) and between tenth and fifth with transformation
(50% improvement).
Chapter 4 – Relationships between Rugby Sevens Performance Indicators and International Tournament
Outcomes
75
A linear mixed model with the performance indicator as a fixed effect, a random effect for
team, and an interaction effect for performance indicator and team was employed to
characterise the relationship between the performance indicator and tournament ranking
within each team. The model allowed for the possibility of individual team differences in the
relationship between performance indicator and ranking. A linear relationship between
performance indicators and ranking was quantified after assessment of a quadratic trend
yielded no additional meaningful information. A linear model was also favoured for its
simpler interpretation. The effect of a change within a team in performance indicator value on
tournament ranking was assessed by multiplying the slope of the relationship by two within-
team standard deviations [141], which represented the typical tournament-to-tournament
variability in the performance indicator. To delimit the investigation to technical performance
indicators instead of point-scoring actions, the relationship between the number of tries
scored and tournament ranking was not analysed.
The between-team relationship of the performance indicators with tournament ranking was
assessed by averaging the values of the performance indicator and ranking for each team over
the nine tournaments. The typical effect of a difference in performance indicator value on
ranking was calculated by multiplying the slope of the linear relationship between the means
by twice the standard deviation of the teams’ mean performance indicator values [141]. A
two standard deviation increase represents the difference between teams with a typically low
(-1 SD) and typically high (+1 SD) performance indicator value.
Inferences about effects of within-team changes and between-team differences in
performance indicators were assessed using the smallest meaningful difference in tournament
ranking. The smallest meaningful improvement was defined as a 20% better ranking (a factor
difference of 0.8 of the original ranking). This improvement represents the difference
required to move a team’s tournament ranking from fifth to fourth. In IRB Sevens World
Series tournaments, a ranking of fifth equates to a team winning the second-tier Plate
competition; moving to fourth ensures a team finishes in the top-tier Cup competition,
thereby scoring more World Series points. The smallest meaningful decrement in ranking
was therefore a move from fourth to fifth, or 25% (a factor difference of 1/0.8 or 1.25).
An inference about the true value of an effect was based on the uncertainty of its magnitude.
When the 90% confidence interval concurrently crossed the thresholds for the smallest
meaningful decrement and improvement, the effect was deemed unclear [141].
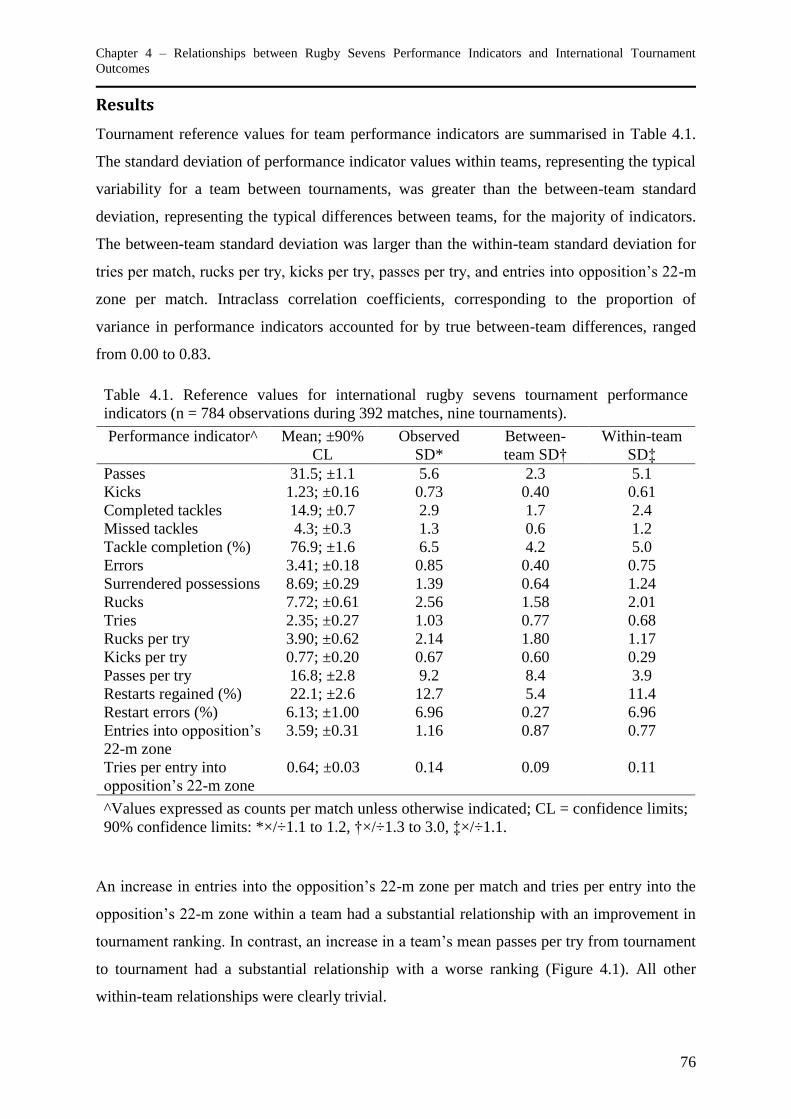
Chapter 4 – Relationships between Rugby Sevens Performance Indicators and International Tournament
Outcomes
76
Results
Tournament reference values for team performance indicators are summarised in Table 4.1.
The standard deviation of performance indicator values within teams, representing the typical
variability for a team between tournaments, was greater than the between-team standard
deviation, representing the typical differences between teams, for the majority of indicators.
The between-team standard deviation was larger than the within-team standard deviation for
tries per match, rucks per try, kicks per try, passes per try, and entries into opposition’s 22-m
zone per match. Intraclass correlation coefficients, corresponding to the proportion of
variance in performance indicators accounted for by true between-team differences, ranged
from 0.00 to 0.83.
Table 4.1. Reference values for international rugby sevens tournament performance
indicators (n = 784 observations during 392 matches, nine tournaments).
Performance indicator^ Mean; ±90%
CL
Observed
SD*
Between-
team SD†
Within-team
SD‡
Passes 31.5; ±1.1 5.6 2.3 5.1
Kicks 1.23; ±0.16 0.73 0.40 0.61
Completed tackles 14.9; ±0.7 2.9 1.7 2.4
Missed tackles 4.3; ±0.3 1.3 0.6 1.2
Tackle completion (%) 76.9; ±1.6 6.5 4.2 5.0
Errors 3.41; ±0.18 0.85 0.40 0.75
Surrendered possessions 8.69; ±0.29 1.39 0.64 1.24
Rucks 7.72; ±0.61 2.56 1.58 2.01
Tries 2.35; ±0.27 1.03 0.77 0.68
Rucks per try 3.90; ±0.62 2.14 1.80 1.17
Kicks per try 0.77; ±0.20 0.67 0.60 0.29
Passes per try 16.8; ±2.8 9.2 8.4 3.9
Restarts regained (%) 22.1; ±2.6 12.7 5.4 11.4
Restart errors (%) 6.13; ±1.00 6.96 0.27 6.96
Entries into opposition’s
22-m zone
3.59; ±0.31 1.16 0.87 0.77
Tries per entry into
opposition’s 22-m zone
0.64; ±0.03 0.14 0.09 0.11
^Values expressed as counts per match unless otherwise indicated; CL = confidence limits;
90% confidence limits: *×/÷1.1 to 1.2, †×/÷1.3 to 3.0, ‡×/÷1.1.
An increase in entries into the opposition’s 22-m zone per match and tries per entry into the
opposition’s 22-m zone within a team had a substantial relationship with an improvement in
tournament ranking. In contrast, an increase in a team’s mean passes per try from tournament
to tournament had a substantial relationship with a worse ranking (Figure 4.1). All other
within-team relationships were clearly trivial.
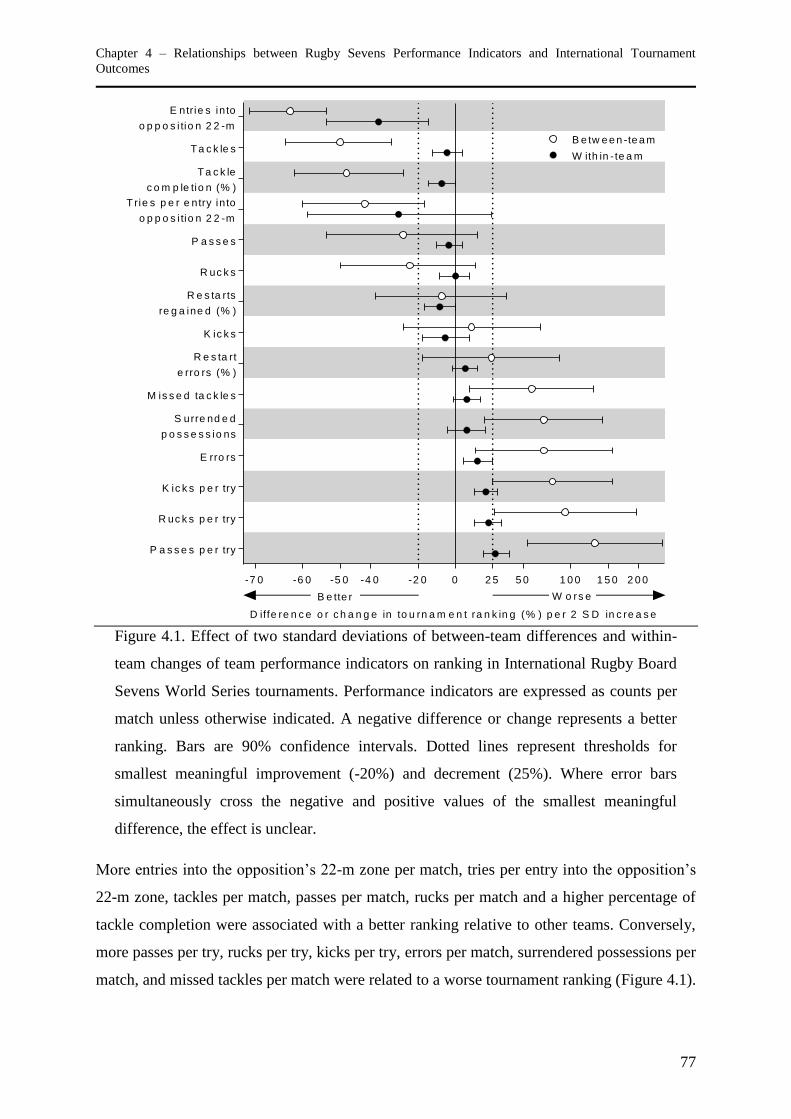
Chapter 4 – Relationships between Rugby Sevens Performance Indicators and International Tournament
Outcomes
77
D iffe re n c e o r c h a n g e in to u rn a m e n t ra n k in g (% ) p e r 2 S D in c re a s e
P a s s e s p e r try
R uc k s p e r try
K ic k s p e r try
E rro rs
S urre nd e d
p o s s e s s io ns
M is s e d ta c k le s
R e s ta rt
e rro rs (% )
K ic k s
R e s ta rts
re g a ine d (% )
R uc k s
P a s s e s
T rie s p e r e ntry in to
o p p o s i tio n 2 2 -m
Ta c k le
c o m p le tio n (% )
Ta c k le s
E ntrie s in to
o p p o s i tio n 2 2 -m
B e tw e e n -te a m
W ith in - te a m
-4 0 5 0 1 0 0 1 5 0-2 0 2 5-6 0-7 0 -5 0 2 0 00
W o rs eB e tte r
Figure 4.1. Effect of two standard deviations of between-team differences and within-
team changes of team performance indicators on ranking in International Rugby Board
Sevens World Series tournaments. Performance indicators are expressed as counts per
match unless otherwise indicated. A negative difference or change represents a better
ranking. Bars are 90% confidence intervals. Dotted lines represent thresholds for
smallest meaningful improvement (-20%) and decrement (25%). Where error bars
simultaneously cross the negative and positive values of the smallest meaningful
difference, the effect is unclear.
More entries into the opposition’s 22-m zone per match, tries per entry into the opposition’s
22-m zone, tackles per match, passes per match, rucks per match and a higher percentage of
tackle completion were associated with a better ranking relative to other teams. Conversely,
more passes per try, rucks per try, kicks per try, errors per match, surrendered possessions per
match, and missed tackles per match were related to a worse tournament ranking (Figure 4.1).
Chapter 4 – Relationships between Rugby Sevens Performance Indicators and International Tournament
Outcomes
78
The between-team relationships of percentage of restarts regained, kicks per match, and
percentage of restart errors with ranking were unclear.
Discussion
Better tournament rankings in international rugby sevens were associated with superior
efficiency in attack and technical abilities emphasising the maintenance of ball possession
and higher tackle completion. These technical elements provide important information in
understanding the tactics associated with successful outcomes in international competition.
The analysis of match statistics from the nine tournaments of the men’s 2011/2012 IRB
Sevens World Series enabled reference values for team performance indicators to be
calculated. Relating the typical differences or changes in these values with tournament
rankings informs the preparation of teams for international competition.
The largest positive between-team effects were observed for an increase in passes per try,
rucks per try and kicks per try averaged over a tournament. The magnitudes of these effects
highlight the importance of attacking proficiency to a team’s overall performance. The most
successful teams are more efficient in converting ball possessions into points-scoring
movements. For example, a team with 19 more passes per try in a tournament (that is, two
between-team means SD) than a team with a final ranking of fourth is likely to have a
ranking of ninth (fifth to thirteenth; 90% confidence interval). Similarly, performing 19 more
passes per try than the tournament runner-up will likely result in a ranking of fourth (second
to sixth).
The mean number of passes per try in this study (17) was markedly higher than for successful
(winning rate ≥70%; 7 passes per try) and less successful (11 passes per try) teams in
international rugby sevens competition in 2001 [144]. The observed difference may indicate
that the patterns of play in the IRB Sevens World Series have changed over time. However,
the possibility that contemporary teams adopt a different tactical approach by taking the ball
into contact more often, and thus passing less frequently, is not supported by the fact that
there were trivial differences between matches in 2001 and 2011/2012 in the frequency of
passes or rucks per match. Instead, it appears modern matches are more closely contested,
resulting in fewer tries.
The control of ball possession appears a key determinant of IRB Sevens World Series
tournament outcomes [144,261]. In 2001, successful teams averaged 51% of possession time
per match, whereas less successful teams averaged 43% [144]. It is plausible the negative
Chapter 4 – Relationships between Rugby Sevens Performance Indicators and International Tournament
Outcomes
79
between-team relationships between the frequency of rucks, passes and entries into the
opposition’s 22-m zone per match and ranking in the present study partially reflect the higher
absolute possession time of better-performing teams. Successful teams maintain ball
possession by limiting the frequency of errors and turnovers, thereby reducing the opponent’s
possession time and attacking opportunities. The mean number of errors per match (3.4) was
lower than that reported for successful (8 errors) and less successful (6 errors) teams in 2001
[144]. This difference may indicate an improvement in the technical proficiency and skill of
present-day teams, or possibly a difference in definitions used for notational analysis. In the
2001 matches, there was a mean of four handling errors per match, similar to the number of
errors per match in the current study. Clearly, reducing the frequency of errors and
surrendered possessions through effective skill execution improves a team’s opportunities for
scoring points and likelihood of success in a tournament.
As it is not possible to maintain control of the ball for an entire match, better-ranked teams
are also more effective in defence. More-successful teams are characterised by a higher
number of successful tackles and fewer missed tackles, leading to a higher rate of tackle
completion. These findings are in agreement with observations of international matches
played in 2001, where the more successful teams performed better in defence than less
successful teams [144]. However, in contrast to the present findings, successful teams in 2001
completed less tackles (16 per match) than other teams (19 per match). The lower number of
tackles completed by successful teams was explained by their higher proportion of ball
possession, which limited the number of tackles required [144]. In the current sample of
international matches, teams completed a mean of 15 tackles per match. The difference
between the results from 2001 and contemporary matches may be related to methodological
differences, sampling variation, or changing patterns of play in international rugby sevens. It
is evident that successful teams in international competitions require a combination of skilled
individual players capable of effecting tackles and well-organised defensive structures that
increase the rate of tackle completion and limit the opposition’s attacking opportunities.
Although most performance indicators demonstrated substantial relationships with
tournament outcomes, some indicators were less prominently linked with a team’s overall
performance. The frequency of general-play kicks and measures of relative success in restart
set-piece plays had unclear associations with tournament ranking. The unclear, and
potentially trivial, relationship between these indicators and ranking suggest coaches should
prioritise other areas of their teams’ technical development. Tactics that increase
Chapter 4 – Relationships between Rugby Sevens Performance Indicators and International Tournament
Outcomes
80
opportunities for maintaining ball possession rather than kicking for territory should also be
considered. The number of entries into the opposition’s 22-m zone had the largest beneficial
between- and within-team effects on a team’s tournament ranking. Coaches should therefore
encourage teams to gain territory by controlling possession. This recommendation is in
contrast with observations of international rugby union, where winning teams were more
likely to adopt a territory- rather than possession-based approach by kicking the ball more
frequently and pressuring the opposition in defence and in set-piece plays [33,195]. The
differences in tactics between rugby sevens and rugby union likely result from the greater
space available to players in rugby sevens: more space permits teams to create points-scoring
passages of play from any field position and somewhat reduces the importance of set-piece
plays.
The within-team relationships quantified in this study represent the changes in ranking as a
team changes its performance indicators, whereas the between-team relationships characterise
the stable differences in rankings associated with differences in indicators between teams
from tournament to tournament. By averaging team performances across tournaments to
quantify between-team relationships, the attenuating effect of the inherent variability in
performance indicator values was reduced, thereby strengthening the observed association
with team ranking. The assessment of summary statistics averaged for each team over all
matches contested in a tournament is appropriate for identifying the indicators most important
for successful competition outcomes, as the tournament format of international events ensures
teams play opponents closely matched in ability as they progress beyond the pool stage.
Although analyses of averaged tournament statistics provide important information on the
team indicator values of successful and unsuccessful teams, it is likely an individual team’s
tactical approach, and hence performance indicator values, will vary depending on their
playing style and the specific circumstances of each match [246]. Additional research is
required on the match-to-match variability in performance indicators and the mostly trivial
within-team between-tournament effects observed in this study.
This study was limited to official match statistics routinely collected during the IRB Sevens
World Series. Factors such as tournament location, environmental conditions, quality of
opposition, and injuries also influence a team’s performance during competition [247].
Despite the omission of these predictor variables from the analyses, the relationships of the
selected indicators with individual differences or changes in tournament team ranking
demonstrate the relative importance of these indicators to rugby sevens performance. Future
Chapter 4 – Relationships between Rugby Sevens Performance Indicators and International Tournament
Outcomes
81
investigations should examine the interaction of other variables that could affect tournament
outcomes to inform the technical and tactical preparation of teams for competition.
Quantifying the relationships between individual performance indicators and tournament
rankings allows for more objective evaluation and prescription of a team’s technical
preparation. However, this analysis does not provide details of the cumulative effect on team
ranking when indicators are combined. It is likely that substantial correlations exist between
some performance indicators that should be considered when planning a team’s preparation
programme or tactical approach to competition. Subsequent studies using similar
methodology could investigate competition outcomes and tactical patterns of play, such as
the techniques employed by teams to maintain ball possession [47] and score points [249]. A
progressive investigation of this nature would further inform coaching and support staff of
the tactical and strategic behaviours of successful rugby sevens teams.
Conclusion
The analysis of each tournament throughout the entire 2011/2012 IRB Sevens World Series
highlights the technical elements of play related to success at the highest level of international
rugby sevens. Through the analysis of a large sample of international tournaments, we
identified several team performance indicators related to tournament outcomes. The reference
values for these indicators should be useful to assess performance and inform team
preparation. The findings underscore the importance of effectiveness in offensive and
defensive elements of play for success in international competition. To increase the
likelihood of success in tournaments, coaches should develop team tactics and the technical
abilities of players to maintain ball possession by reducing errors and turnovers, maximise
attacking efficiency, and increase the rate of successful tackle completion. These tactics will
increase a team’s scoring opportunities and minimise the opponents’ ability to control the ball
and score points.
Practical Implications
Successful international rugby sevens teams maintain ball possession by reducing
errors and turnovers, are efficient in converting possession into tries, and have
effective defensive structures resulting in a high rate of tackle completion.
Coaches and support staff can use selected performance indicators to evaluate the
performance of their team and the opposition, and to plan tactical approaches that
enhance tournament outcomes.
Chapter 4 – Relationships between Rugby Sevens Performance Indicators and International Tournament
Outcomes
82
Technical preparation for international rugby sevens competition should give attention
to offence and defence.
The priorities for a team’s technical development should reflect the magnitudes of the
relationships between team performance indicators and tournament ranking.
Chapter 5 – Patterns of Play Associated with Success in International Rugby Sevens
83
Chapter Five - Patterns of Play Associated with Success in
International Rugby Sevens
Higham, D.G., Hopkins, W.G., Pyne, D.B., & Anson, J.M. (2014). Patterns of play associated
with success in international rugby sevens. International Journal of Performance Analysis in
Sport, 14(1), 111-122.
Abstract
Understanding the relationships between annual mean performance indicators and team
ranking in the IRB Sevens World Series should inform long-term tactical approaches to
competition. In this study we characterised these relationships using official data for each of
the 12 core teams during the men’s IRB Sevens World Series between 2008/2009 and
2011/2012. Mean values, typical within-team variability and typical between-team
differences were derived from the four annual World Series mean values for 23 performance
indicators. Linear mixed modelling was employed to quantify the effect of an increase in
performance indicator values (from typically low to typically high) on logarithmically-
transformed series ranking within and between teams. Ten indicators had clear substantial
between-team effects (2- to 3-fold differences) on team ranking, but only five had clear
substantial within-team effects (~1.5-fold changes). Tries scored and tries conceded had the
strongest effects on ranking. Tactics that improved team ranking were based on increasing
ball retention in line-outs and the breakdown, turning over possession more frequently in
opposition rucks, and pressuring the opposition in their territory by kicking fewer short
restarts. These findings confirm the intuitive importance of some common performance
indicators and provide valuable novel insights for tactical planning.
Key words: statistics, match analysis, notational analysis, performance analysis, performance
indicators, rugby union
Chapter 5 – Patterns of Play Associated with Success in International Rugby Sevens
84
Introduction
Rugby sevens is an abridged format of rugby union played under substantially the same laws.
In contrast to rugby union, a rugby sevens match is contested over 7-min halves by seven
players on the field for each team. The increase in worldwide popularity and international
competitiveness in rugby sevens, particularly accompanying the announcement of the
Olympic Games debut of the sport in 2016, has increased the need for scientific support to
enhance performance. Scientific investigations of contemporary rugby sevens have examined
the movement patterns [132,134,241] and physiological responses [240,244] of players
during competition, and the anthropometric, physical, and physiological characteristics of
international-level players [131,133]. These studies provide valuable information to coaches
and support staff developing programmes for player selection and physical development that
are specific to the demands of competition.
One aspect of rugby sevens competition that has received little scientific inquiry is the
tactical component of performance. Technical and tactical performance indicators are
regularly quantified in sport to define patterns of play employed by competitors to exploit
their perceived strengths and the opposition’s weaknesses in technical proficiency. In team
invasion sports such as rugby sevens, these indicators characterise a team’s use of ball
possession, field position, fitness, and movement to execute patterns of play. To be useful in
informing tactical approaches, performance indicators must be associated with success.
Studies of rugby union performance have identified performance indicators that discriminate
between winning and losing teams [33,153,195,263,264]. However, equivalent studies are yet
to be published for rugby sevens.
Recent research into team performance during the knockout stages of the 2011 Rugby World
Cup identified a territory-based strategy as the most effective for match success [33]. This
research supports previous findings that winning rugby union teams have greater success at
the line-out [153,195,263,264], kick more frequently [195,263,264], miss fewer tackles
[195,263], and make more line breaks [75,195] relative to losing teams. Differences in the
physical nature of rugby sevens and rugby union [132] imply outcomes of analyses of
performance indicators in rugby union may not be directly applicable to rugby sevens.
Furthermore, unlike most rugby union competitions which follow a league-style format,
usually with a single weekly match, rugby sevens competitions are typically played in a
tournament format. International rugby sevens tournaments are generally contested over two
Chapter 5 – Patterns of Play Associated with Success in International Rugby Sevens
85
or three successive days with teams playing up to three matches per day. The International
Rugby Board (IRB) Sevens World Series is an annual series of international rugby sevens
tournaments (rounds) contested by national teams from around the world over an eight-month
period. Every year a number of core teams qualify to contest every tournament of the World
Series. National rugby sevens teams compete for World Series points at each round, with
points awarded based on each team’s finishing position in the tournament. The overall IRB
Sevens World Series champion and final team rankings are determined at the end of the
World Series based on the points accumulated over each tournament round.
It is likely the expansive nature and tournament format of rugby sevens influences the tactical
approaches and performance indicators associated with success. Knowledge of the patterns of
play related to success in the IRB Sevens World Series will assist coaches to develop tactical
approaches specific to international rugby sevens. Therefore, the purpose of this study was to
characterise performance indicators in international rugby sevens competition and quantify
the relationships between performance indicators and annual team ranking in the men’s IRB
Sevens World Series.
Methods
Sample
A four-year retrospective longitudinal study design was employed. Summary statistics and
annual World Series rankings of the 12 core teams (those who participated in every World
Series tournament) from the 2008/2009 to 2011/2012 IRB Sevens World Series were
retrieved from the official IRB tournament website (http://www.irbsevens.com). Team
performance indicators were classified into four categories: match development, scoring, set-
piece play, and phase play (Table 5.1). Match development indicators quantified the time
with the ball and number of law infringements for a given team. Scoring indicators described
the way and frequency in which points were scored or conceded. Set-piece play indicators
described the nature and outcome of line-outs, scrums and restarts. Phase play indicators
detailed how the team used the ball when in possession.
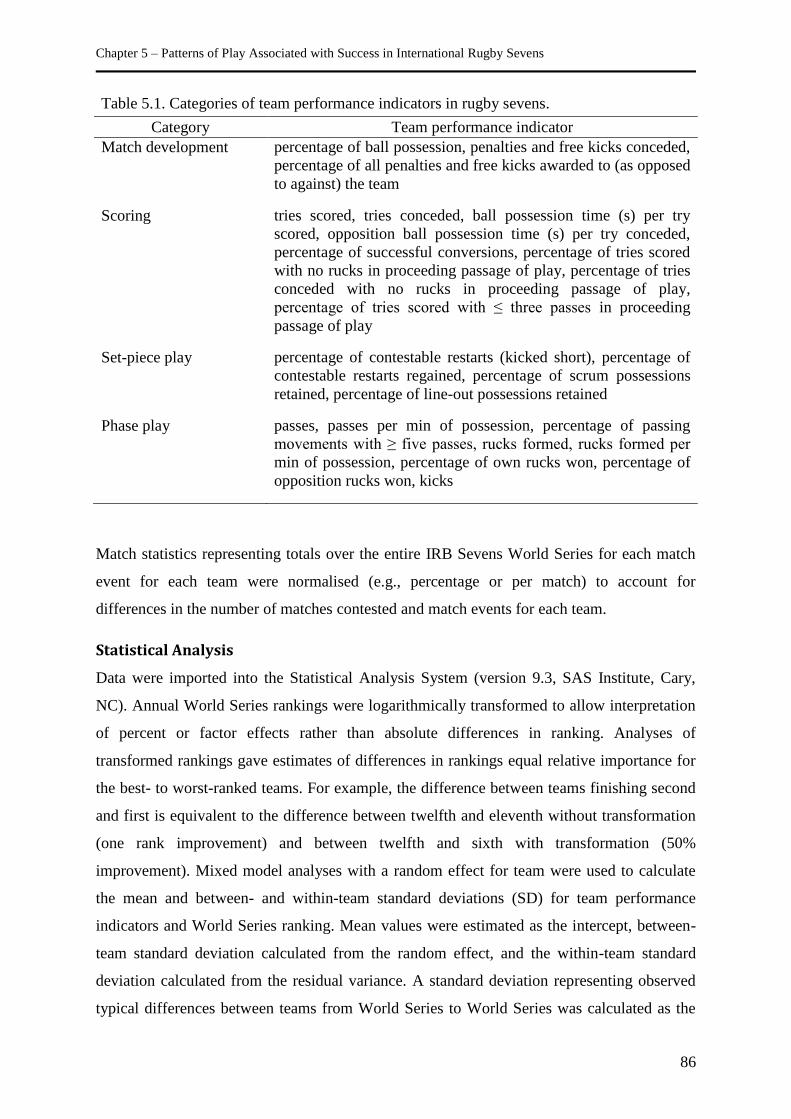
Chapter 5 – Patterns of Play Associated with Success in International Rugby Sevens
86
Table 5.1. Categories of team performance indicators in rugby sevens.
Category Team performance indicator
Match development percentage of ball possession, penalties and free kicks conceded,
percentage of all penalties and free kicks awarded to (as opposed
to against) the team
Scoring tries scored, tries conceded, ball possession time (s) per try
scored, opposition ball possession time (s) per try conceded,
percentage of successful conversions, percentage of tries scored
with no rucks in proceeding passage of play, percentage of tries
conceded with no rucks in proceeding passage of play,
percentage of tries scored with ≤ three passes in proceeding
passage of play
Set-piece play percentage of contestable restarts (kicked short), percentage of
contestable restarts regained, percentage of scrum possessions
retained, percentage of line-out possessions retained
Phase play passes, passes per min of possession, percentage of passing
movements with ≥ five passes, rucks formed, rucks formed per
min of possession, percentage of own rucks won, percentage of
opposition rucks won, kicks
Match statistics representing totals over the entire IRB Sevens World Series for each match
event for each team were normalised (e.g., percentage or per match) to account for
differences in the number of matches contested and match events for each team.
Statistical Analysis
Data were imported into the Statistical Analysis System (version 9.3, SAS Institute, Cary,
NC). Annual World Series rankings were logarithmically transformed to allow interpretation
of percent or factor effects rather than absolute differences in ranking. Analyses of
transformed rankings gave estimates of differences in rankings equal relative importance for
the best- to worst-ranked teams. For example, the difference between teams finishing second
and first is equivalent to the difference between twelfth and eleventh without transformation
(one rank improvement) and between twelfth and sixth with transformation (50%
improvement). Mixed model analyses with a random effect for team were used to calculate
the mean and between- and within-team standard deviations (SD) for team performance
indicators and World Series ranking. Mean values were estimated as the intercept, between-
team standard deviation calculated from the random effect, and the within-team standard
deviation calculated from the residual variance. A standard deviation representing observed
typical differences between teams from World Series to World Series was calculated as the
Chapter 5 – Patterns of Play Associated with Success in International Rugby Sevens
87
square root of the sum of the between-team and within-team variances. Intraclass correlation
coefficients representing series-to-series reliability of ranking and performance indicators
were calculated as the between-team variance divided by the observed variance.
A linear mixed model was used to characterise the relationship between the performance
indicator and World Series ranking. The model specified the performance indicator as a fixed
effect, team as a random effect, and an interaction effect for performance indicator and team.
This model allowed for potential individual team differences in the relationship between the
performance indicator and ranking. A linear association between performance indicators and
ranking was deemed most appropriate after evaluation of a quadratic trend produced no
additional meaningful information. A linear relationship also permitted simpler interpretation
of effects. The effect of a change from series to series within a team in performance indicator
value on ranking was assessed by multiplying the slope of the relationship by two within-
team standard deviations [141]. Two standard deviations represent the change within a team
from a typically low performance indicator value (-1 SD) to a typically high value (+1 SD).
A between-team effect of the team indicators was estimated by averaging the values of the
performance indicator and ranking between the 2008/2009 and 2011/2012 World Series for
each of the 12 teams. The effect of the performance indicator was derived by multiplying the
slope of the linear relationship between the means by twice the standard deviation of the
teams' mean values of the performance indicator. A two standard deviation increase
represented the typical difference between teams from World Series to World Series.
Inferences about effects of performance indicators were assessed using the smallest
meaningful difference in World Series ranking. From the 2012/2013 men’s IRB Sevens
World Series the number of core teams was increased from 12 to 15 and a promotion and
relegation system introduced. Based on this change, the smallest meaningful improvement in
annual ranking was defined as 20% (a factor difference of 0.8 of the original ranking). This
improvement in ranking represents the difference required to move a team from fifteenth
(bottom rank) to twelfth, out of the bottom three teams at risk of relegation and who must re-
qualify for core team status. The equal and opposite smallest meaningful decrement was
defined by a 25% worse ranking (a factor difference of 1/0.8 or 1.25). An inference about the
true value of an effect was based on the uncertainty of its magnitude. When the 90%
confidence interval concurrently crossed the thresholds for the smallest meaningful
decrement and improvement, the effect was deemed unclear [141].
Chapter 5 – Patterns of Play Associated with Success in International Rugby Sevens
88
Results
The centrality and dispersion of World Series ranking (in raw units) and match development,
scoring, set-piece play, and phase play performance indicators are summarised by the mean
and observed standard deviation (Table 5.2). The observed standard deviation is composed of
the between-team standard deviation, representing the stable typical differences between
teams, and the within-team standard deviation, representing the typical variability of a team
between World Series. The observed (×/÷2.10), between-team (×/÷1.80), and within-team
(×/÷1.57) standard deviations of log-transformed World Series ranking were also calculated
and expressed as a factor. The intraclass reliability correlation coefficients, corresponding to
the proportion of variance in performance indicators accounted for by between-team
differences, ranged from 0.00 to 0.82 (Table 5.2). The intraclass correlation coefficient of
log-transformed World Series ranking was 0.63.
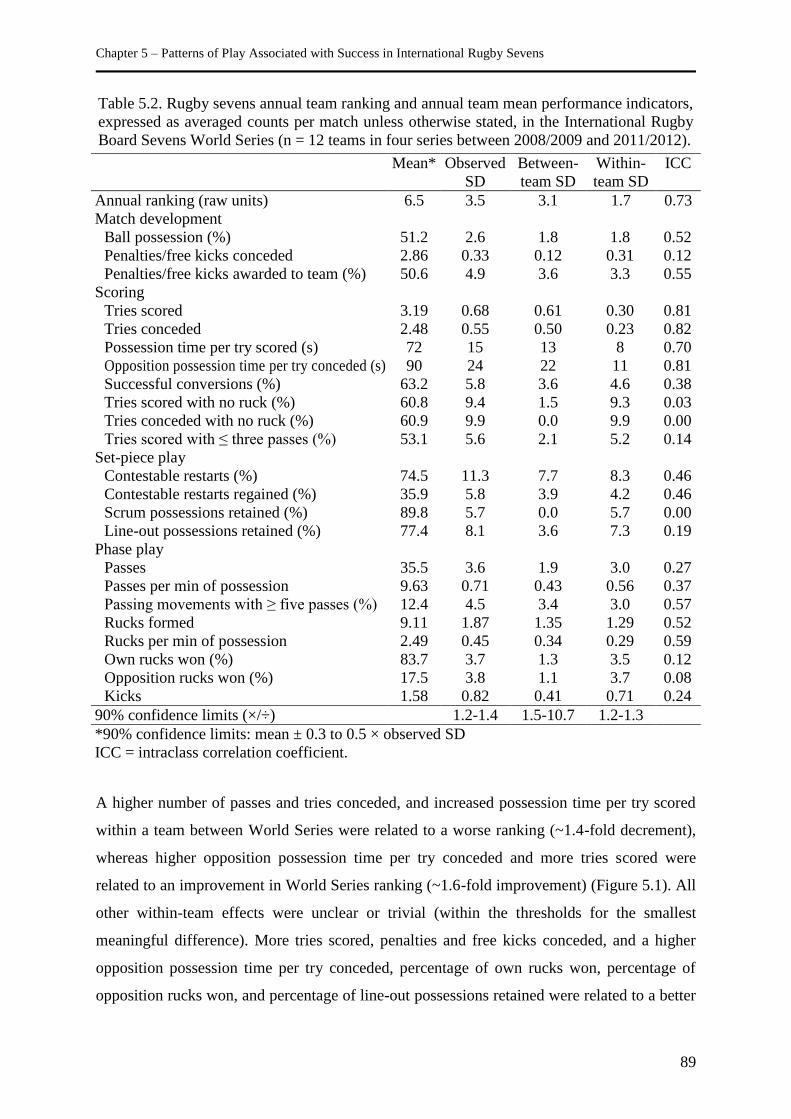
Chapter 5 – Patterns of Play Associated with Success in International Rugby Sevens
89
Table 5.2. Rugby sevens annual team ranking and annual team mean performance indicators,
expressed as averaged counts per match unless otherwise stated, in the International Rugby
Board Sevens World Series (n = 12 teams in four series between 2008/2009 and 2011/2012).
Mean* Observed
SD
Between-
team SD
Within-
team SD
ICC
Annual ranking (raw units) 6.5 3.5 3.1 1.7 0.73
Match development
Ball possession (%) 51.2 2.6 1.8 1.8 0.52
Penalties/free kicks conceded 2.86 0.33 0.12 0.31 0.12
Penalties/free kicks awarded to team (%) 50.6 4.9 3.6 3.3 0.55
Scoring
Tries scored 3.19 0.68 0.61 0.30 0.81
Tries conceded 2.48 0.55 0.50 0.23 0.82
Possession time per try scored (s) 72 15 13 8 0.70
Opposition possession time per try conceded (s) 90 24 22 11 0.81
Successful conversions (%) 63.2 5.8 3.6 4.6 0.38
Tries scored with no ruck (%) 60.8 9.4 1.5 9.3 0.03
Tries conceded with no ruck (%) 60.9 9.9 0.0 9.9 0.00
Tries scored with ≤ three passes (%) 53.1 5.6 2.1 5.2 0.14
Set-piece play
Contestable restarts (%) 74.5 11.3 7.7 8.3 0.46
Contestable restarts regained (%) 35.9 5.8 3.9 4.2 0.46
Scrum possessions retained (%) 89.8 5.7 0.0 5.7 0.00
Line-out possessions retained (%) 77.4 8.1 3.6 7.3 0.19
Phase play
Passes 35.5 3.6 1.9 3.0 0.27
Passes per min of possession 9.63 0.71 0.43 0.56 0.37
Passing movements with ≥ five passes (%) 12.4 4.5 3.4 3.0 0.57
Rucks formed 9.11 1.87 1.35 1.29 0.52
Rucks per min of possession 2.49 0.45 0.34 0.29 0.59
Own rucks won (%) 83.7 3.7 1.3 3.5 0.12
Opposition rucks won (%) 17.5 3.8 1.1 3.7 0.08
Kicks 1.58 0.82 0.41 0.71 0.24
90% confidence limits (×/÷) 1.2-1.4 1.5-10.7 1.2-1.3
*90% confidence limits: mean ± 0.3 to 0.5 × observed SD
ICC = intraclass correlation coefficient.
A higher number of passes and tries conceded, and increased possession time per try scored
within a team between World Series were related to a worse ranking (~1.4-fold decrement),
whereas higher opposition possession time per try conceded and more tries scored were
related to an improvement in World Series ranking (~1.6-fold improvement) (Figure 5.1). All
other within-team effects were unclear or trivial (within the thresholds for the smallest
meaningful difference). More tries scored, penalties and free kicks conceded, and a higher
opposition possession time per try conceded, percentage of own rucks won, percentage of
opposition rucks won, and percentage of line-out possessions retained were related to a better
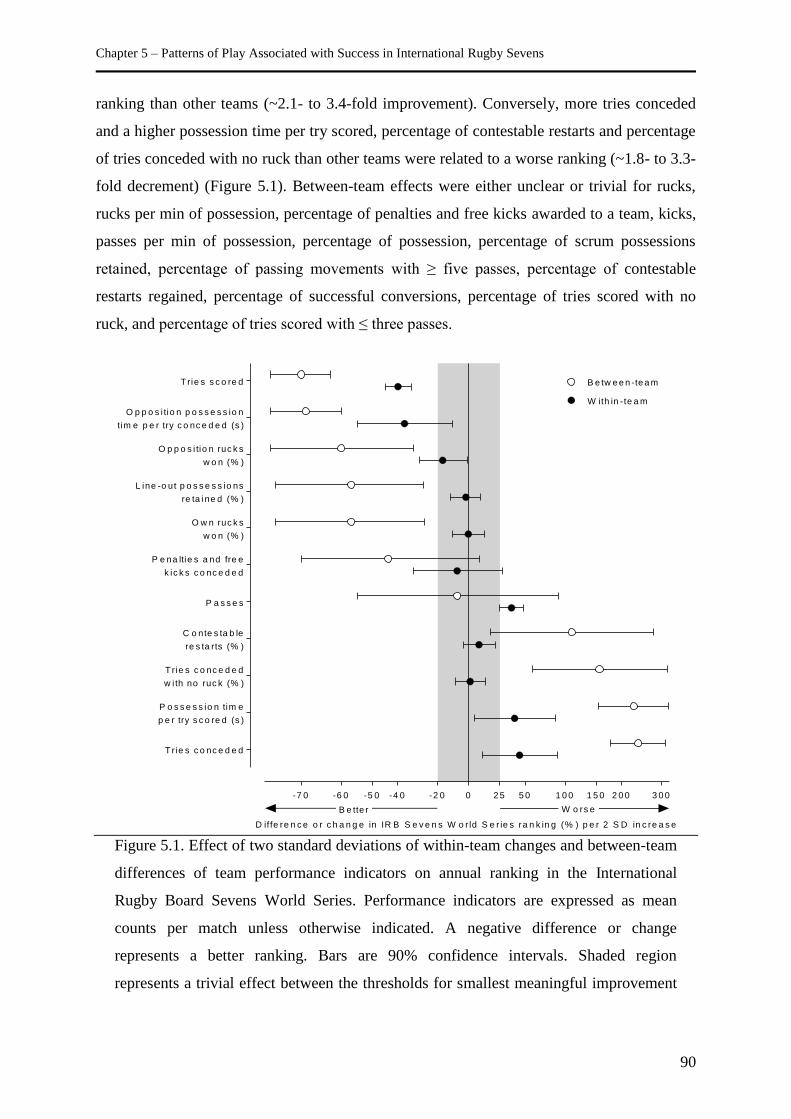
Chapter 5 – Patterns of Play Associated with Success in International Rugby Sevens
90
ranking than other teams (~2.1- to 3.4-fold improvement). Conversely, more tries conceded
and a higher possession time per try scored, percentage of contestable restarts and percentage
of tries conceded with no ruck than other teams were related to a worse ranking (~1.8- to 3.3-
fold decrement) (Figure 5.1). Between-team effects were either unclear or trivial for rucks,
rucks per min of possession, percentage of penalties and free kicks awarded to a team, kicks,
passes per min of possession, percentage of possession, percentage of scrum possessions
retained, percentage of passing movements with ≥ five passes, percentage of contestable
restarts regained, percentage of successful conversions, percentage of tries scored with no
ruck, and percentage of tries scored with ≤ three passes.
D iffe re n c e o r c h a n g e in IR B S e v e n s W o r ld S e r ie s ra n k in g (% ) p e r 2 S D in c re a s e
T rie s c o nc e d e d
P o s s e s s io n tim e
p e r try s c o re d (s )
T rie s c o nc e d e d
w i th no ruc k (% )
C o nte s ta b le
re s ta rts (% )
P a s s e s
P e na ltie s a nd fre e
k ic k s c o nc e d e d
O w n ruc k s
w o n (% )
L ine -o ut p o s s e s s io ns
re ta ine d (% )
O p p o s i tio n ruc k s
w o n (% )
O p p o s i tio n p o s s e s s io n
tim e p e r try c o nc e d e d (s )
T rie s s c o re d B e tw e e n -te a m
W ith in - te a m
-4 0 5 0 1 0 0 1 5 0-2 0 2 5-6 0-7 0 -5 0 2 0 0 3 0 00
B e tte r W o rs e
Figure 5.1. Effect of two standard deviations of within-team changes and between-team
differences of team performance indicators on annual ranking in the International
Rugby Board Sevens World Series. Performance indicators are expressed as mean
counts per match unless otherwise indicated. A negative difference or change
represents a better ranking. Bars are 90% confidence intervals. Shaded region
represents a trivial effect between the thresholds for smallest meaningful improvement
Chapter 5 – Patterns of Play Associated with Success in International Rugby Sevens
91
(-20%) and decrement (25%). The effect is unclear where error bars simultaneously
cross the negative and positive values of the smallest meaningful difference.
Discussion
This study provides important insights into the patterns of play associated with relative team
performance outcomes in international rugby sevens. Unsurprisingly, the mean number of
tries scored and conceded by a team best discriminated higher and lower World Series
rankings within and between teams. Moreover, when averaged over all matches of the World
Series, the most successful teams were those that gained and maintained ball possession by
dominating the ruck contest and retaining line-out possession. Better-ranked teams also
tended to concede more penalties and free kicks and kick fewer short, contestable restarts.
The study’s findings provide practical information on the key performance indicators
associated with success most important for longitudinal monitoring and comparison.
Characterisation of performance indicators from multiple teams during four consecutive IRB
Sevens World Series should be useful for evaluating team performances, establishing match
objectives and planning training programmes.
Aside from supporting the construct validity of the analyses used, whereby the model actually
represents the relationships being investigated, the finding that better-performing teams score
more and concede fewer tries is intuitive, given 344 (88%) of the 392 matches contested in
the 2011/2012 IRB Sevens World Series were won by the team that scored most tries [149].
This investigation adds to the knowledge of patterns of play in rugby sevens by describing
the collective behaviours of successful and less-successful teams. Specifically, the findings
offer information on the tactics employed by successful teams to score more frequently than
their opponents. Although differences between teams may not be clearly evident in any
individual match, when match statistics are averaged over the entire World Series, substantial
disparities emerge between teams in their technical ability and tactical focus associated with
their annual World Series ranking.
The mean percentage of ball possession time in a match had an unclear effect on ranking
between teams and a trivial effect within teams. Instead, better-ranked teams were more
effective in converting possessions into points-scoring movements as well as restricting tries
being scored when their opponents had possession. A two standard deviation difference
between teams in percentage of opposition rucks won was related to a 60% improvement in
World Series ranking, indicating more-successful teams were also effective in capitalising on
Chapter 5 – Patterns of Play Associated with Success in International Rugby Sevens
92
turnovers in possession. For example, a team winning 4.4% more opposition rucks than a
team with a final World Series ranking of eighth would typically finish with a ranking of
third (second to fifth, 90% confidence interval). Turning over ball possession from the
opposition at the breakdown markedly increases a team’s scoring opportunity by allowing a
team to attack when their opponents are vulnerable in the transition from offence to defence.
Better-ranked teams were not only dominant in attack, but also proficient in defence. More-
successful teams conceded fewer tries per match and had a lower proportion of tries scored
against them with no ruck in the preceding phase. It appears the defensive systems of
successful teams are central in conceding tries less frequently and easily than their opponents
and exerting greater dominance in contact situations. Given the greater relative space
available to players in rugby sevens compared with rugby union, effective tackling and
defensive structures enable the most successful teams to more readily transform an
opposition’s breakdown into an attacking opportunity.
Although the number of scrums and line-outs in a rugby sevens match is typically lower than
in a rugby union match [207], there are substantial differences between higher- and lower-
ranked rugby sevens teams in their tactics and technical proficiency during set-piece plays.
Both scrums and line-outs in rugby sevens matches were most frequently won by the team
feeding or throwing the ball in. However, the proportion of line-out possessions retained
(77%) was lower than for scrums (90%). Over an entire World Series, better-ranked teams
retained possession in line-outs more frequently than worse-ranked teams, with the
magnitude of the effect on a team’s ranking similar to that of percentage of own rucks won.
The line-out provides an attacking platform by the off-side distance enforced between the
attacking and defending teams. During the 2011/2012 IRB Sevens World Series, 9% of all
tries originated from line-out possessions [149]. Evidently, more frequently retaining ball
possession at the line-out increases a team’s attacking opportunities. Conversely, by
increasing the proportion of opposition line-outs won, a team’s prospects of gaining territory
and scoring are increased because the opposition back-line players are in a weak position as
they adjust from an offensive to defensive structure. Winning possession of the ball from the
opponent’s lineout simultaneously reduces the opposition’s opportunity to attack and score
points.
The importance of the restart set-piece in deciding match outcomes cannot be
underestimated, given one fifth of all tries in the 2011/2012 IRB Sevens World Series
Chapter 5 – Patterns of Play Associated with Success in International Rugby Sevens
93
originated from restarts [149]. Although the results trended toward an improvement in World
Series ranking, a higher proportion of contestable restarts regained had an unclear effect
between teams and a clear trivial effect within teams. Better-performing teams more
frequently chose longer restart kicks over shorter, contestable kicks landing closer to the half-
way line. It appears successful teams more often choose to kick longer at the restart to gain a
territorial advantage and pressure the opposition with strong defence, even if it means
conceding possession of the ball. It is also plausible longer kicks may reduce the potential for
errors at the restart. However, this assertion requires further empirical investigation.
A higher number of penalties and free kicks conceded relative to other teams was associated
with a better World Series ranking. Although a purported relationship between poorer
discipline and team performance is somewhat counterintuitive, it supports observations
contrasting successful (winning rate ≥70%) and less-successful teams during international
matches played in 2001 [144]. The disparity in the number of penalties and free kicks
conceded by successful and unsuccessful teams may be explained by better-performing teams
being more likely to utilise the advantage rule. In this case, even though a law infringement is
committed by the opposition, a penalty is not awarded as the team in possession chooses to
continue play. Further investigation of how and when teams concede penalties and free kicks
is required. Indeed, it is possible more-successful teams tend to concede more penalties at the
breakdown. Such an outcome might reflect a risk-reward trade-off as teams try to dominate
the breakdown in search of a turnover in possession.
It is likely a variety of playing styles and tactical approaches are employed by different
teams, or even the same team against different opponents, all of which may be effective
based on the technical strengths and weaknesses of the competing teams. The current method
of analysing a large sample of matches over several teams and years is valuable in identifying
common tendencies and patterns of successful teams. Averaging team performances over the
entire World Series is also robust in compensating for variations in match location,
environmental conditions, officiating styles and other factors that can influence a team’s
performance [247]. However, it is acknowledged that averaging performance indicators over
several matches makes it impossible to distinguish variations in team performances during
individual matches [246]. Practitioners working with a specific team could adopt a case-study
design to quantify the longitudinal effects of particular strategies and tactics on performance.
For almost all of the performance indicators investigated, the magnitude of the association
with World Series ranking was larger between teams than within teams. At the same time, the
Chapter 5 – Patterns of Play Associated with Success in International Rugby Sevens
94
intraclass correlation coefficients were largest for indicators most associated with a team’s
ranking (e.g., tries scored or conceded, possession time per try scored and opposition
possession time per try conceded). These performance indicators therefore had the largest
between-team differences relative to the magnitude of within-team changes from series to
series. This circumstance partially explains the discrepancy between within- and between-
team effects and the reason teams usually have only a small to moderate change in their
ranking from series to series.
This study was limited to routinely-collected official match statistics summarised over all
matches played by each team during the IRB Sevens World Series. Future research may
identify additional performance indicators associated with success in international rugby
sevens competition. Findings from analyses of other indicators representing offensive and
defensive patterns of play may be useful in preparing teams and planning strategies employed
in tournaments. Despite encompassing four World Series between 2008/2009 and 2011/2012,
the current data set was relatively limited in size, especially in regard to examining between-
team relationships. The small sample size yielded many unclear between-team effects with
relatively large uncertainty in relationships. Given official match statistics were not available
for World Series prior to 2008/2009, the inclusion of observations from World Series after
2011/2012 would reduce the magnitude of uncertainty, likely resulting in more performance
indicators becoming clear in their association with an improvement or decrement in a team’s
World Series ranking.
Conclusion
The analysis of match statistics from four years of the IRB Sevens World Series characterised
the within- and between-team variability in patterns of play. Based on the typical differences
between and changes within teams, several indicators discriminated between successful and
less-successful team performances. These performance indicators may be applied to monitor
and compare team performances and should assist coaches in developing strategies that
enhance a team’s probability of success in international competition. To improve a team’s
ranking in the IRB Sevens World Series, tactics should be based on scoring more and
conceding fewer tries by increasing ball retention in line-outs and at the breakdown, turning
the ball over more frequently in opposition rucks, and pressuring the opposition in their
territory by kicking fewer contestable restarts.
Chapter 6 – Movement Patterns in Rugby Sevens: Effects of Tournament Level, Fatigue and Substitute Players
95
Chapter Six - Movement Patterns in Rugby Sevens:
Effects of Tournament Level, Fatigue and Substitute
Players
Higham, D.G., Pyne, D.B., Anson, J.M., & Eddy, A. (2012). Movement patterns in rugby
sevens: effects of tournament level, fatigue and substitute players. Journal of Science and
Medicine in Sport, 15(3), 277-282.
Abstract
Objective: Understanding of the physical demands and the effects of fatigue and substitute
players in rugby sevens is limited. This study quantified the differences in movement patterns
between domestic and international rugby sevens tournaments, the effects of fatigue within
and between matches during tournaments, and movement patterns of second half substitute
players.
Design: Movement patterns of 19 international-level male rugby sevens players were
recorded using a Global Positioning System (GPS) device during 11 international and 16
domestic matches (n = 174 files).
Methods: Maximum velocity, total distance covered, distance covered in velocity zones and
number of moderate and high accelerations and decelerations are reported per min of match
time. Movement patterns were compared between international and domestic matches, first
and second half, first and last tournament match and substitute and full-match players.
Results: Substantially greater distance was covered at high velocity (~27% at ≥6 m·s-1
) and 4
to 39% more accelerations and decelerations were performed in international than domestic
matches. The relative distance covered by players at velocities >2 m·s-1
and the number of
changes in velocity were reduced by 1 to 16% from first to second half. Small differences
were observed in activity at <5 m·s-1
(-8 to 8%) and moderate accelerations (-18%) from first
to last tournament match. All movement variables were higher (2 to 123%) for substitute
players.
Chapter 6 – Movement Patterns in Rugby Sevens: Effects of Tournament Level, Fatigue and Substitute Players
96
Conclusions: International rugby sevens competition is more intense than domestic matches.
Despite reductions in work-rate within individual matches, there is little indication of
accumulated fatigue over a multi-day tournament.
Key words: GPS, time-motion analysis, game analysis, acceleration, sprint
Chapter 6 – Movement Patterns in Rugby Sevens: Effects of Tournament Level, Fatigue and Substitute Players
97
Introduction
The popularity of rugby sevens has spread rapidly in recent years and the sport is now played
at the domestic and international level all over the world. In 2009, rugby sevens was formally
included in the Olympic Games from 2016. Rugby sevens is an abbreviated variant of rugby
union in which two teams, each with seven players on the field, compete for 7-min halves
with a 2-min half-time interval. Rugby sevens is played on a full dimension rugby union field
under substantially the same laws as 15-player rugby union. Given the increasing number of
international competitions in rugby sevens, the transition from the domestic to international
stage is an important consideration for players and coaches, yet to date, there is no scientific
review of the likely differences in game demands between international- and domestic-level
competition.
Rugby sevens competitions differ from 15-player rugby union in that they are usually played
over 2- or sometimes 3-day tournaments. Teams play three group stage matches on day one
and two, typically with ~3 h between matches and then, depending on results, up to three
finals matches on the last day. The ability of players to repeat short-duration, high-intensity
running efforts on multiple occasions over several days and changes in movement patterns
over the duration of a tournament have not been previously examined. The use of tactical
player substitutions in the latter stages of a match is a strategy often adopted by coaches to
mitigate the potential effect of fatigue in reducing individual and team performance.
However, the work-rate contribution of substitute players in rugby sevens is unknown.
Only one previous study has examined the movement patterns of players during rugby sevens
competition [216]. This study was conducted during a tournament in 1996 and its relevance
to the modern game is limited by changing game demands and player characteristics
observed in rugby union over recent years [78,98]. Furthermore, the introduction of new
measurement and analysis techniques such as Global Positioning System (GPS) technology
now allows for the velocity and distances covered by players to be quantified [151,199].
Understanding the movement patterns of rugby sevens will assist coaches prescribing and
implementing sport-specific training programmes that replicate the physical demands of
competition. The aims of this study were to use GPS technology to: (i) quantify the
differences in movement patterns between domestic and international tournaments; (ii)
quantify changes in movement patterns within and between matches during tournaments to
Chapter 6 – Movement Patterns in Rugby Sevens: Effects of Tournament Level, Fatigue and Substitute Players
98
examine the effects of player fatigue; and (iii) assess the movement patterns of second half
substitute players.
Methods
A prospective, observational, longitudinal study design was used to assess the movement
patterns of 19 international-level male rugby sevens players (age 21.2 ± 2.7 years; body mass
89.7 ± 7.3 kg; height 1.81 ± 0.05 m; mean ± SD) during 16 matches played over three
domestic tournaments and 11 matches played over two international (International Rugby
Board World Series) tournaments. Written informed consent was obtained from all players.
The study was approved by the University of Canberra Committee for Ethics in Human
Research and Australian Institute of Sport Ethics Committee.
The international tournaments were in Adelaide, Australia and Wellington, New Zealand in
the Southern Hemisphere summer and autumn months. The domestic Australian tournaments
were played in Central Coast, Gold Coast and Darwin during the spring and summer months.
Domestic tournaments were sanctioned by the Australian Rugby Union but not part of a
formal series. These tournaments were contested for prize money by teams comprising
amateur through to semi-professional players and officiated by local referees. Typically
teams arrive ~4 days before an international tournament and undertake one or two training
sessions each day. For domestic tournaments, most teams arrive 1 to 2 days before
commencement and also undertake a light training session per day. All matches were played
on standard outdoor natural grass fields.
Movement patterns were assessed by fitting players with a MinimaxX GPS device (Team
Sport version 2.5, Catapult Innovations, Melbourne, Australia) recording at 5 Hz. The
standard error of the estimate (validity) of distance covered at <2 to 5 m·s-1
for these units
ranges from 1.7 to 3.8% and coefficient of variation (CV, reliability) from 1.2 to 2.6% [199].
For a 20-m sprint, the estimate for validity is 17% and 23% for reliability [151]. The GPS
device was positioned between the scapulae of the player using an elasticised harness worn
underneath the playing attire. The device was activated and satellite lock established for a
minimum of 15 min before the commencement of each match. Data were downloaded and
analysed using Logan Plus 4.4.0 software (Catapult Innovations, Melbourne, Australia).
Movement patterns were quantified based on distance covered in specific velocity zones (0 to
2 m·s-1
, 2 to 3.5 m·s-1
, 3.5 to 5 m·s-1
, 5 to 6 m·s-1
and ≥6 m·s-1
), maximum instantaneous
velocity and an acceleration/deceleration profile. The chosen velocity zones represent the
Chapter 6 – Movement Patterns in Rugby Sevens: Effects of Tournament Level, Fatigue and Substitute Players
99
range of locomotor activity profiles typical of intermittent team sport and are routinely used
during GPS monitoring in Australian rugby union. Acceleration and deceleration
characteristics were assessed by the number of times a player performed a moderate (2 to 4
m·s-2
) or high (>4 m·s-2
) acceleration or deceleration (moderate -4 to -2 m·s-2
and high <-4
m·s-2
) for a minimum duration of 0.4 s. Matches were categorised based on the tournament
level (domestic or international) and the order of match played within the tournament (first or
last). The effect of player substitutions on movement patterns was assessed by comparing the
second half measures of players that played the entire match with those that played less than
4 min. The half-time interval, any time a player spent off the field and stoppage time were
excluded from analyses. A total of 174 match files were included for analysis.
Data were log-transformed prior to analysis to reduce the non-uniformity of error and back-
transformed to obtain differences in means and variation as percents. Descriptive statistics
(mean ± SD) were used to characterise movement patterns. Data are expressed relative to
game time played (per min) to account for variations in playing time from match to match
and for player substitutions. Magnitude-based inferences on differences within and between
tournaments were made by standardising differences using the between-player SD. Precision
of estimates are indicated with 90% confidence limits (CL). Magnitudes of standardised
effects were assessed as 0 to 0.2 being trivial, 0.2 to 0.6 small, 0.6 to 1.2 moderate, 1.2 to 2.0
large, and >2.0 very large [22]. The effect was reported as unclear when the confidence
interval of the standardised difference crossed the threshold for both substantially positive
(0.2) and negative (-0.2) values. The CV expressed as a percent was calculated to characterise
the variability of movement pattern parameters.
Results
Substantial differences between movement patterns during international and domestic
tournament matches were observed for all variables with the exception of total distance
covered per min (Table 6.1). Players reached an ~6% higher maximum running velocity
during international tournament matches than during domestic tournaments and covered 16%
and 27% greater distance at 5 to 6 and ≥6 m·s-1
, respectively. Similarly, players covered less
distance at lower velocity (2 to 5 m·s-1
) and performed 4 to 39% more moderate and high
accelerations and decelerations per min of play in international competition.
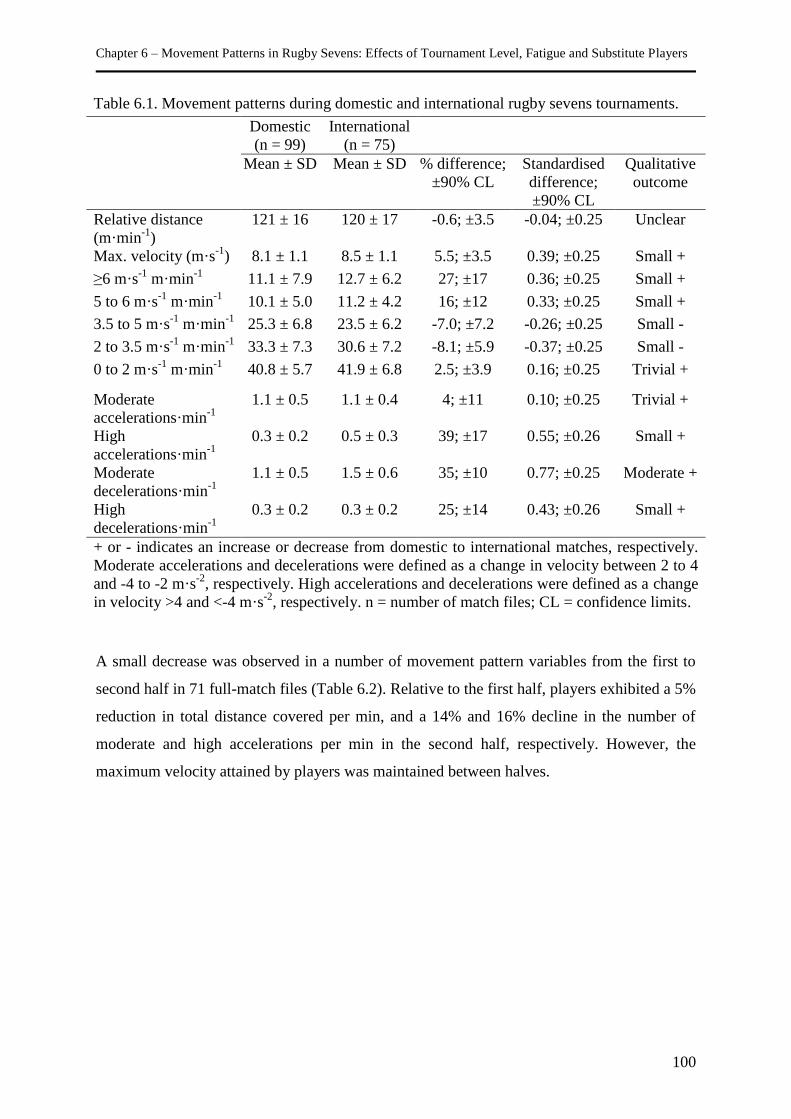
Chapter 6 – Movement Patterns in Rugby Sevens: Effects of Tournament Level, Fatigue and Substitute Players
100
Table 6.1. Movement patterns during domestic and international rugby sevens tournaments.
Domestic
(n = 99)
International
(n = 75)
Mean ± SD Mean ± SD % difference;
±90% CL
Standardised
difference;
±90% CL
Qualitative
outcome
Relative distance
(m·min-1
)
121 ± 16 120 ± 17 -0.6; ±3.5 -0.04; ±0.25 Unclear
Max. velocity (m·s-1
) 8.1 ± 1.1 8.5 ± 1.1 5.5; ±3.5 0.39; ±0.25 Small +
≥6 m·s-1
m·min-1
11.1 ± 7.9 12.7 ± 6.2 27; ±17 0.36; ±0.25 Small +
5 to 6 m·s-1
m·min-1
10.1 ± 5.0 11.2 ± 4.2 16; ±12 0.33; ±0.25 Small +
3.5 to 5 m·s-1
m·min-1
25.3 ± 6.8 23.5 ± 6.2 -7.0; ±7.2 -0.26; ±0.25 Small -
2 to 3.5 m·s-1
m·min-1
33.3 ± 7.3 30.6 ± 7.2 -8.1; ±5.9 -0.37; ±0.25 Small -
0 to 2 m·s-1
m·min-1
40.8 ± 5.7 41.9 ± 6.8 2.5; ±3.9 0.16; ±0.25 Trivial +
Moderate
accelerations·min-1
1.1 ± 0.5 1.1 ± 0.4 4; ±11 0.10; ±0.25 Trivial +
High
accelerations·min-1
0.3 ± 0.2 0.5 ± 0.3 39; ±17 0.55; ±0.26 Small +
Moderate
decelerations·min-1
1.1 ± 0.5 1.5 ± 0.6 35; ±10 0.77; ±0.25 Moderate +
High
decelerations·min-1
0.3 ± 0.2 0.3 ± 0.2 25; ±14 0.43; ±0.26 Small +
+ or - indicates an increase or decrease from domestic to international matches, respectively.
Moderate accelerations and decelerations were defined as a change in velocity between 2 to 4
and 4 to -2 m·s-2
, respectively. High accelerations and decelerations were defined as a change
in velocity >4 and <-4 m·s-2
, respectively. n = number of match files; CL = confidence limits.
A small decrease was observed in a number of movement pattern variables from the first to
second half in 71 full-match files (Table 6.2). Relative to the first half, players exhibited a 5%
reduction in total distance covered per min, and a 14% and 16% decline in the number of
moderate and high accelerations per min in the second half, respectively. However, the
maximum velocity attained by players was maintained between halves.
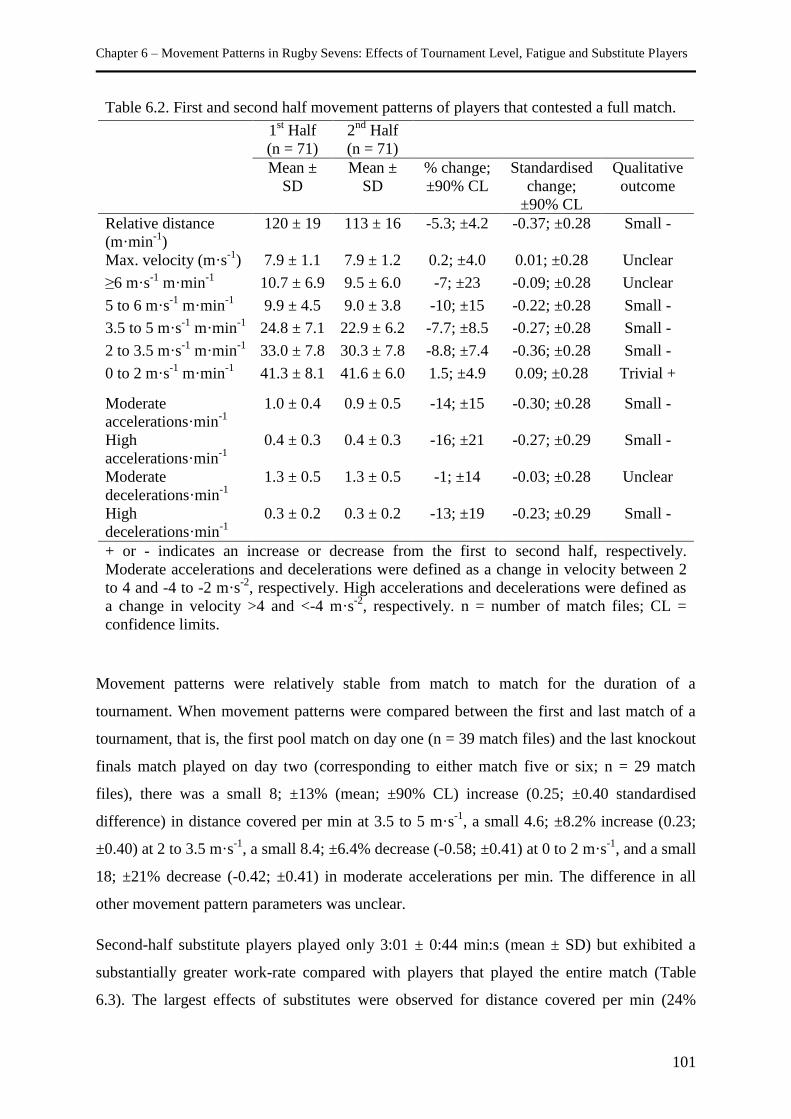
Chapter 6 – Movement Patterns in Rugby Sevens: Effects of Tournament Level, Fatigue and Substitute Players
101
Table 6.2. First and second half movement patterns of players that contested a full match.
1st Half
(n = 71)
2nd
Half
(n = 71)
Mean ±
SD
Mean ±
SD
% change;
±90% CL
Standardised
change;
±90% CL
Qualitative
outcome
Relative distance
(m·min-1
)
120 ± 19 113 ± 16 -5.3; ±4.2 -0.37; ±0.28 Small -
Max. velocity (m·s-1
) 7.9 ± 1.1 7.9 ± 1.2 0.2; ±4.0 0.01; ±0.28 Unclear
≥6 m·s-1
m·min-1
10.7 ± 6.9 9.5 ± 6.0 -7; ±23 -0.09; ±0.28 Unclear
5 to 6 m·s-1
m·min-1
9.9 ± 4.5 9.0 ± 3.8 -10; ±15 -0.22; ±0.28 Small -
3.5 to 5 m·s-1
m·min-1
24.8 ± 7.1 22.9 ± 6.2 -7.7; ±8.5 -0.27; ±0.28 Small -
2 to 3.5 m·s-1
m·min-1
33.0 ± 7.8 30.3 ± 7.8 -8.8; ±7.4 -0.36; ±0.28 Small -
0 to 2 m·s-1
m·min-1
41.3 ± 8.1 41.6 ± 6.0 1.5; ±4.9 0.09; ±0.28 Trivial +
Moderate
accelerations·min-1
1.0 ± 0.4 0.9 ± 0.5 -14; ±15 -0.30; ±0.28 Small -
High
accelerations·min-1
0.4 ± 0.3 0.4 ± 0.3 -16; ±21 -0.27; ±0.29 Small -
Moderate
decelerations·min-1
1.3 ± 0.5 1.3 ± 0.5 -1; ±14 -0.03; ±0.28 Unclear
High
decelerations·min-1
0.3 ± 0.2 0.3 ± 0.2 -13; ±19 -0.23; ±0.29 Small -
+ or - indicates an increase or decrease from the first to second half, respectively.
Moderate accelerations and decelerations were defined as a change in velocity between 2
to 4 and -4 to -2 m·s-2
, respectively. High accelerations and decelerations were defined as
a change in velocity >4 and <-4 m·s-2
, respectively. n = number of match files; CL =
confidence limits.
Movement patterns were relatively stable from match to match for the duration of a
tournament. When movement patterns were compared between the first and last match of a
tournament, that is, the first pool match on day one (n = 39 match files) and the last knockout
finals match played on day two (corresponding to either match five or six; n = 29 match
files), there was a small 8; ±13% (mean; ±90% CL) increase (0.25; ±0.40 standardised
difference) in distance covered per min at 3.5 to 5 m·s-1
, a small 4.6; ±8.2% increase (0.23;
±0.40) at 2 to 3.5 m·s-1
, a small 8.4; ±6.4% decrease (-0.58; ±0.41) at 0 to 2 m·s-1
, and a small
18; ±21% decrease (-0.42; ±0.41) in moderate accelerations per min. The difference in all
other movement pattern parameters was unclear.
Second-half substitute players played only 3:01 ± 0:44 min:s (mean ± SD) but exhibited a
substantially greater work-rate compared with players that played the entire match (Table
6.3). The largest effects of substitutes were observed for distance covered per min (24%
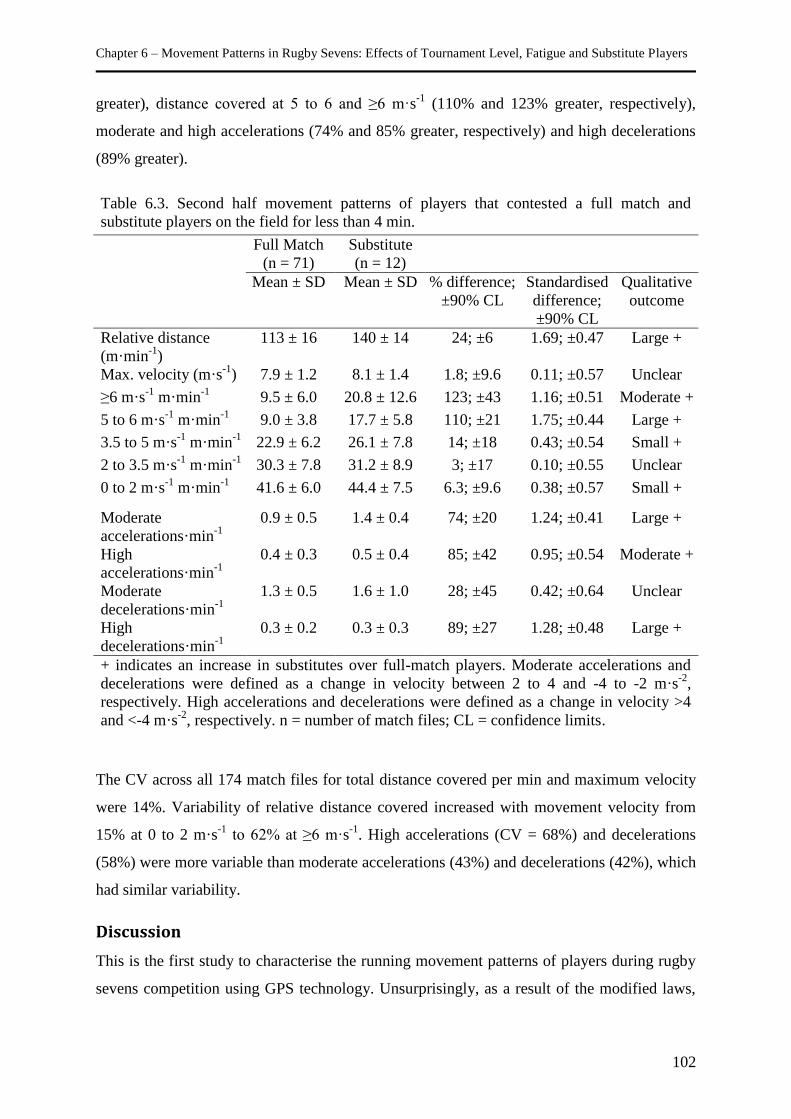
Chapter 6 – Movement Patterns in Rugby Sevens: Effects of Tournament Level, Fatigue and Substitute Players
102
greater), distance covered at 5 to 6 and ≥6 m·s-1
(110% and 123% greater, respectively),
moderate and high accelerations (74% and 85% greater, respectively) and high decelerations
(89% greater).
Table 6.3. Second half movement patterns of players that contested a full match and
substitute players on the field for less than 4 min.
Full Match
(n = 71)
Substitute
(n = 12)
Mean ± SD Mean ± SD % difference;
±90% CL
Standardised
difference;
±90% CL
Qualitative
outcome
Relative distance
(m·min-1
)
113 ± 16 140 ± 14 24; ±6 1.69; ±0.47 Large +
Max. velocity (m·s-1
) 7.9 ± 1.2 8.1 ± 1.4 1.8; ±9.6 0.11; ±0.57 Unclear
≥6 m·s-1
m·min-1
9.5 ± 6.0 20.8 ± 12.6 123; ±43 1.16; ±0.51 Moderate +
5 to 6 m·s-1
m·min-1
9.0 ± 3.8 17.7 ± 5.8 110; ±21 1.75; ±0.44 Large +
3.5 to 5 m·s-1
m·min-1
22.9 ± 6.2 26.1 ± 7.8 14; ±18 0.43; ±0.54 Small +
2 to 3.5 m·s-1
m·min-1
30.3 ± 7.8 31.2 ± 8.9 3; ±17 0.10; ±0.55 Unclear
0 to 2 m·s-1
m·min-1
41.6 ± 6.0 44.4 ± 7.5 6.3; ±9.6 0.38; ±0.57 Small +
Moderate
accelerations·min-1
0.9 ± 0.5 1.4 ± 0.4 74; ±20 1.24; ±0.41 Large +
High
accelerations·min-1
0.4 ± 0.3 0.5 ± 0.4 85; ±42 0.95; ±0.54 Moderate +
Moderate
decelerations·min-1
1.3 ± 0.5 1.6 ± 1.0 28; ±45 0.42; ±0.64 Unclear
High
decelerations·min-1
0.3 ± 0.2 0.3 ± 0.3 89; ±27 1.28; ±0.48 Large +
+ indicates an increase in substitutes over full-match players. Moderate accelerations and
decelerations were defined as a change in velocity between 2 to 4 and -4 to -2 m·s-2
,
respectively. High accelerations and decelerations were defined as a change in velocity >4
and <-4 m·s-2
, respectively. n = number of match files; CL = confidence limits.
The CV across all 174 match files for total distance covered per min and maximum velocity
were 14%. Variability of relative distance covered increased with movement velocity from
15% at 0 to 2 m·s-1
to 62% at ≥6 m·s-1
. High accelerations (CV = 68%) and decelerations
(58%) were more variable than moderate accelerations (43%) and decelerations (42%), which
had similar variability.
Discussion
This is the first study to characterise the running movement patterns of players during rugby
sevens competition using GPS technology. Unsurprisingly, as a result of the modified laws,
Chapter 6 – Movement Patterns in Rugby Sevens: Effects of Tournament Level, Fatigue and Substitute Players
103
rugby sevens is played at a substantially greater running intensity than 15-player rugby union.
Compared with GPS data collected with 1-Hz devices during an 83 min professional rugby
union match, the current group of rugby sevens players covered ~45% greater total distance
per min with a higher proportion of that distance at high velocity (~135% greater distance
covered per min at >5 m·s-1
) [68]. Although comparisons cannot be made regarding the
relative demands of contact situations (tackles, rucks, mauls), the increase in relative running
intensity and volume observed in rugby sevens has implications for the physiological
requirements and preparation of players wishing to transfer between the two formats.
Substantial differences in movement patterns were observed during different levels of
competition, within and between matches and for substitute players. International tournament
matches are played at a higher intensity and elicit a greater physical load than domestic
matches. Although movement patterns are likely influenced by other factors not measured in
the current study such as the opposition’s ability or tactics, international matches required a
higher maximum velocity, greater distances covered at high velocity, and a greater number of
changes in velocity. Players competing at the international level are likely to have superior
physical capacities and skill levels to lower-level players which may, at least partially,
explain the observed increase in match intensity. To optimise the physical preparation of
players, coaches should prescribe training appropriate to the increased demands of
international competition. For example, training drills should include relatively high running
loads incorporating changes in velocity and intermittent maximal or near-maximal sprint
efforts. A schedule of multiple short-duration, high-intensity training sessions on the same
day with limited recovery periods between each may be a useful form of training to increase
the specificity of preparation for the tournament-style competitions. Participation in domestic
tournaments may have limitations as a sole method of preparing and selecting players to be
competitive in international competition.
In agreement with the trend previously observed in rugby sevens and in other elite team sport
athletes, players that contested the entire match demonstrated a decreased work-rate from the
first to second half [11,209,216]. The mechanisms underlying the small decrement in work-
rate are likely to be multifarious and were not examined in the current study. Changes in
movement patterns may be related to central [248] and peripheral [158] factors of fatigue or
to team tactics. However, the inability of players to sustain high intensity activity over the
duration of a match suggests fatigue is an important consideration in performance. Player
fatigue may also be a contributing factor in the higher incidence of injuries reported during
Chapter 6 – Movement Patterns in Rugby Sevens: Effects of Tournament Level, Fatigue and Substitute Players
104
the second half of international rugby sevens matches [98]. It is likely that endurance and
fatigue resistance are principal physiological attributes of top performing rugby sevens
players. Players at higher levels of competition exhibit superior anaerobic and aerobic
endurance capacity in a number of team sports [20,181]. Further investigation is needed to
confirm the relationship between physical characteristics and playing level in rugby sevens
players.
The use of substitute players appears efficacious as a tactical means of maintaining team
work-rate. Under the laws of the game, once substituted, a player cannot re-join the match
unless replacing a player with a bleeding or open wound. Despite the small number of match
files available for analysis, large increases in work-rate variables were observed for second
half substitutes compared with players on the field for the entire match. Substitutes covered
24% more distance per min at a higher velocity and with a greater number of changes in
velocity. Higher substitute player work-rate is in accordance with previous observations in
elite soccer [43,181]. Interestingly, late-game substitute players exhibited a greater work-rate
than in the first half of players that contested the full match. These data suggest players may
be pacing their activity during the early stages of a match to mitigate fatigue later in the
match. This moderation of work-rate occurs despite players not knowing the exact duration of
each match or whether they may play the full match. Team sport athletes’ self-regulation of
activity is an area that requires further investigation. Nonetheless, it is clear that the
replacement of one or more players at a key stage of a match could potentially influence the
match result. Additional research is required to optimise the involvement of substitute players
and examine whether the contribution of substitutes in the latter stages of a match affects the
match outcome.
Over the duration of a tournament, movement patterns of the current group of players were
essentially maintained. Only small differences were observed in activity at <5 m·s-1
and
moderate accelerations from the first to last tournament match. The preservation of work-rate
between matches suggests that fatigue accumulated during a match is transient and the effect
of any residual fatigue on subsequent performance is minimal. An additional explanation is
that the between-match recovery strategies employed with this group of players including a
combination of active and passive recovery, cryotherapy and cold water immersion [255],
compression [111], nutritional intervention [24] and sleep [270] are effective in sustaining
performance over a multi-day tournament.
Chapter 6 – Movement Patterns in Rugby Sevens: Effects of Tournament Level, Fatigue and Substitute Players
105
Despite the relative stability of mean movement patterns between matches within a
tournament, a high degree of variability in movement patterns was observed. Activity in
rugby sevens is mediated by a multitude of factors including the dynamic demands of the
game, the strength of the opposition, the capacity of players to regulate their performance and
the unknown effects of environmental conditions, player fitness, team tactics and officiating
style. Observations of large movement pattern variability are consistent with findings in elite
soccer where variability in distance covered also increased with running velocity [77,117].
Further research is required to establish the longitudinal variability of rugby sevens
movement patterns and the impact of internal (e.g., physiological, psychological) and
external (e.g., environmental conditions, game styles) variables and their interaction. Future
research incorporating GPS technology with a larger sample of teams may also identify
positional differences in movement patterns and distinctions between successful and
unsuccessful teams.
Conclusion
This study reported for the first time the differences in movement patterns within and
between rugby sevens tournaments. The gross movement demands per min of rugby sevens
are ~45% greater and relative high velocity running demands more than double those of
rugby union. Although the total distance covered by players was similar between
international and domestic matches, international matches were more intense owing to the
greater distance covered at high velocities and higher number of accelerations and
decelerations. Within matches, a small decrement in work-rate from the first to second half
was observed. The relative distance covered by players at velocities >2 m·s-1
and the number
of changes in velocity were reduced. Despite reductions in performance within individual
matches, when recovery strategies are implemented there is little evidence of accumulated
fatigue over a tournament. The findings of this preliminary study have implications for the
selection and physical preparation of rugby sevens players.
Practical Implications
Successful rugby sevens players are likely to require superior aerobic and anaerobic
endurance capacity to rugby union players to tolerate the higher running demands.
To optimise physical preparation of players, training should be specific to the
competition tournament level (domestic or international).
Chapter 6 – Movement Patterns in Rugby Sevens: Effects of Tournament Level, Fatigue and Substitute Players
106
Small reductions in player work-rate can be expected between the first and second
half of a rugby sevens match. Tactical player substitutions in the latter stages of a
match can be used to maintain team work-rate.
Player movement patterns should be reported per min of play and on an individual
basis to account for differences in match time and between-player variability.
Acknowledgements
We gratefully acknowledge the cooperation of the players and the coaching and support staff
in this project. This study was funded by the Australian Institute of Sport, Australian Rugby
Union and the University of Canberra.
Chapter 7 – Physiological, Anthropometric and Performance Characteristics of Rugby Sevens Players
107
Chapter Seven - Physiological, Anthropometric and
Performance Characteristics of Rugby Sevens Players
Higham, D.G., Pyne, D.B., Anson, J.M., & Eddy, A. (2013). Physiological, anthropometric
and performance characteristics of rugby sevens players. International Journal of Sports
Physiology and Performance, 8(1), 19-27.
Abstract
Although the characteristics of 15-a-side rugby union players have been well defined, little
information exists on rugby sevens players.
Purpose: We profiled the anthropometric, physiological and performance qualities of elite-
level rugby sevens players, and quantified relationships between these characteristics.
Methods: Eighteen male international rugby sevens players undertook anthropometric (body
mass, height, sum of seven skinfolds, lean mass index), acceleration and speed (40-m sprint),
muscular power (vertical jump), repeated-sprint ability (6 × 30-m sprint) and endurance (Yo-
Yo intermittent recovery test and treadmill V̇O2max) testing. Associations between
measurements were assessed by correlation analysis.
Results: Rugby sevens players had anthropometric characteristics (body mass 89.7 ± 7.6 kg,
height 1.83 ± 0.06 m, sum of skinfolds 52.2 ± 11.5 mm; mean ± SD) similar to backs in
international 15-player rugby union. Acceleration and speed (40-m sprint 5.11 ± 0.15 s),
muscular power (vertical jump 66 ± 7 cm), and endurance (V̇O2max 53.8 ± 3.4 mL·kg-1
·min-1
)
qualities were similar to, or better than, professional 15-a-side players. Coefficients of
variation ranged from 2.5 to 22%. Relative V̇O2max was largely correlated with Yo-Yo
distance (r = 0.60, 0.21 to 0.82; 90% confidence interval) and moderately correlated with 40-
m sprint time (r = -0.46, -0.75 to -0.02) and repeated-sprint ability (r = -0.38, -0.72 to 0.09).
Conclusions: International rugby sevens players require highly-developed speed, power and
endurance to tolerate the demands of competition. The small between-athlete variability of
characteristics in rugby sevens players highlights the need for relatively uniform physical and
performance standards in contrast with 15-a-side players.

Chapter 7 – Physiological, Anthropometric and Performance Characteristics of Rugby Sevens Players
108
Key words: fitness testing, speed, endurance, training, team sports
Chapter 7 – Physiological, Anthropometric and Performance Characteristics of Rugby Sevens Players
109
Introduction
Rugby union is an international sport with demands broadly characterised by a high
frequency of physical contacts and repeated intermittent bouts of high intensity activity [78].
To perform under these physiological demands, players need to develop endurance, power,
speed and acceleration, and sport-specific skills. However, the specific demands of
competition differ markedly between 15-player rugby union and rugby sevens. Rugby sevens
is a format of rugby union that has increased in popularity in recent years and will be
contested at the Olympic Games from 2016. The laws of rugby sevens, including the field
dimensions, are substantially the same as 15-player rugby union with the major exceptions
being the reduced number of players (seven per team) and shorter match duration (7-min
halves). Differences in the physiological requirements of the two rugby formats suggest the
characteristics of high-level players in each format may also differ.
Given the ~45% greater relative running volume and ~135% greater high velocity (>5 m·s-1
)
running demands than 15-player rugby union [132], it is likely that international-level rugby
sevens players will have high levels of endurance and different body fat and lean mass
profiles compared with 15-a-side rugby union players. Although additional body fat may act
as a protective buffer in contact situations, excess fat reduces a player’s power-to-weight
ratio, ability to accelerate and increases energy expenditure [81]. As rugby sevens players are
often selected based on their superior speed and endurance qualities, it is likely that a typical
international-level player would have a relatively lower level of adipose tissue when
compared with a 15-a-side player.
Studies of injury epidemiology [98], kinanthropometry and work-rate profiles [216],
competition movement patterns [132,241], and immune markers [244] in rugby sevens
indicate the basic anthropometric characteristics of players are substantially different from
15-a-side rugby players [96]. International rugby sevens backs are ~2 cm shorter and ~6 kg
lighter than international 15-a-side backs, while forwards are ~1 cm shorter and ~13 kg
lighter than their 15-a-side counterparts [98]. Although the physiological capacities of 15-a-
side rugby union players have been reported [78], this information is not available on rugby
sevens players. A comprehensive understanding of the anthropometric and fitness
characteristics of top-level rugby sevens players is needed to guide talent identification and
development programmes, individualise training prescription, and facilitate the transition of
players to the more specialised sevens format. Furthermore, examining the association
Chapter 7 – Physiological, Anthropometric and Performance Characteristics of Rugby Sevens Players
110
between anthropometric and fitness attributes in rugby sevens players is needed for effective
prescription of sport-specific strength and conditioning programmes. Quantifying
relationships between laboratory- and field-based assessments will bridge the gap between
cross-sectional player evaluations and on-field performance monitoring. The purpose of this
study was to profile the physiological, anthropometric and performance characteristics of
high-level rugby sevens players, and compare these results with previously published values
for 15-a-side rugby union players. A secondary aim was to quantify the relationships between
various anthropometric, physiological and performance test results.
Methods
Experimental Approach
A cross-sectional study design was used to assess the anthropometric, physiological and
performance characteristics of members of a national men’s rugby sevens squad. Players
were tested for anthropometry, acceleration and speed, lower-body muscular power,
repeated-sprint ability and endurance in a seven day period during the international
competition season. Tests were selected using recommendations for the assessment of rugby
union players [81]. Players completed a standardised warm-up before starting the physical
assessments. Sufficient recovery times were allowed between tests to ensure players gave a
maximal effort and limit the influence of residual or cumulative fatigue on test results.
Anthropometric assessments were performed prior to physiological testing to ensure players
presented in a hydrated state. Players received verbal encouragement for each test to support
a maximal effort. All equipment was calibrated before testing.
Participants
Eighteen male players (age 21.9 ± 2.0 years, mean ± SD) from a national rugby sevens squad
provided written informed consent to participate in the study. Players were instructed to
consume their normal pre-training diet and refrain from intense exercise at least 48 hours
before the first day of testing. Only data collected on players free of injury and illness are
reported. The study was approved by the University of Canberra Committee for Ethics in
Human Research and Australian Institute of Sport Ethics Committee.
Anthropometric Assessment
Overnight fasted body mass, height and skinfold thickness were measured by an experienced,
accredited anthropometrist using standard laboratory techniques [170]. The sum of biceps,
Chapter 7 – Physiological, Anthropometric and Performance Characteristics of Rugby Sevens Players
111
triceps, subscapular, suprailiac, abdomen, front thigh and medial calf skinfolds is reported.
The typical error of measurement (TE) previously established through testing in our
laboratory for sum of seven skinfolds is 1.3 mm and <1% for body mass and height. A lean
mass index was calculated for each player as M·S-0.14
, where M is body mass (kg) and S is
sum of skinfolds (mm) [82].
Physiological and Performance Assessments
40-m Sprint
To concurrently assess the players’ acceleration and maximum running velocity (vmax), a
maximal sprint test over 40-m with intermediate split distances of 10-, 20- and 30-m was
conducted indoors on a synthetic running track. Split and total times were recorded to the
nearest 0.01 s using dual-beam electronic timing gates (Speedlight TT, Swift Performance
Equipment, Lismore, Australia). Players started from a stationary standing (crouched)
position 0.3 m behind the start timing gate. Players were given three trials and the fastest split
times from the three trials were recorded for analysis. An estimate of vmax was obtained by
subtracting the 30-m split time from the 40-m time and converting time to velocity (m·s-1
).
Momentum (kg·m·s-1
) over the last 10-m of the sprint was calculated as the product of vmax
and the player’s body mass (kg). The TE for the 40-m sprint is 0.04 s.
Vertical Jump
Lower-body muscular power was estimated using a jump height measuring device
(Yardstick, Swift Performance Equipment, Lismore, Australia). A minimum of three double-
foot stance counter-movement jumps with arm swing were performed until each player
achieved their maximum jump height. Vertical jump height was calculated as the difference
between maximum standing reach height and the highest point reached during the vertical
jump. The TE for the vertical jump test is 1.5 cm.
Yo-Yo Intermittent Recovery Level 1 Test
The Yo-Yo intermittent recovery level 1 test (Yo-Yo IR1) was performed on an indoor
synthetic running track under standardised conditions as a measure of endurance [20].
Briefly, the Yo-Yo IR1 consists of 2 × 20-m shuttle runs of increasing speed, interspersed
with a 10-s activity recovery period. The Yo-Yo IR1 involves acceleration, deceleration and
change of direction making it more specific to the work demands of rugby union than
continuous running endurance tests. The total distance covered was recorded as the
performance measure. The TE for the Yo-Yo IR1 is 90 m.
Chapter 7 – Physiological, Anthropometric and Performance Characteristics of Rugby Sevens Players
112
6 × 30-m Repeated-Sprint Ability Test
The 6 × 30-m repeated-sprint ability test is designed to evaluate a player’s speed-endurance
qualities and ability to resist fatigue under time and distance demands similar to those
experienced during a rugby union match. The test requires players to perform six maximal
effort 30-m sprints starting on a 20-s cycle [203]. The repeated-sprint ability test was
performed indoors on a synthetic track with players starting 1.0 m behind the electronic
timing gates (Speedlight TT, Swift Performance Equipment, Lismore, Australia) for each
sprint to reduce the likelihood of a false start. The cumulative time to complete the six sprints
was recorded to the nearest 0.01 s for analysis. The TE for the repeated-sprint ability test is
0.7%.
V̇O2max Test
An incremental running test was conducted on a motorised treadmill under standardised
laboratory conditions to determine players’ maximal oxygen uptake (V̇O2max) and running
velocity at V̇O2max (vV̇O2max). The test started at 11 km·h-1
(0% gradient) increasing by 1
km·h-1
·min-1
to a speed of 14 km·h-1
. Thereafter, the gradient increased by 1% each min until
volitional exhaustion. Expired gas was analysed using a custom-built, automated Douglas bag
gas analysis system. Velocity at V̇O2max was calculated by the linear regression of the sub-
maximal speed-V̇O2 relationship. Maximal oxygen uptake is reported in absolute units
(L·min-1
) and relative to body mass (mL·kg-1
·min-1
). The TE for the V̇O2max test is 2.1%.
All players were familiar with the physiological assessment protocols except the V̇O2max and
repeated-sprint ability tests, although players had been exposed to repeated-effort short
interval sprints during previous fitness training sessions. Four players did not complete the
repeated-sprint ability test, three players did not complete the V̇O2max test and Yo-Yo IR1,
and two players did not complete the vertical jump and 40-m sprint due to injury or illness.
Statistical Analysis
Measures of centrality and spread are reported as mean ± SD. The between-athlete variability
of measurements was calculated as the coefficient of variation expressed as a percent. The
smallest worthwhile change for each assessment measure was calculated as 0.2 × between-
athlete SD [139]. The smallest worthwhile change is defined as the smallest change in a test
score likely to be relevant physiologically, or in performance terms, to the average player.
Pearson product-moment correlation analyses were conducted to determine linear
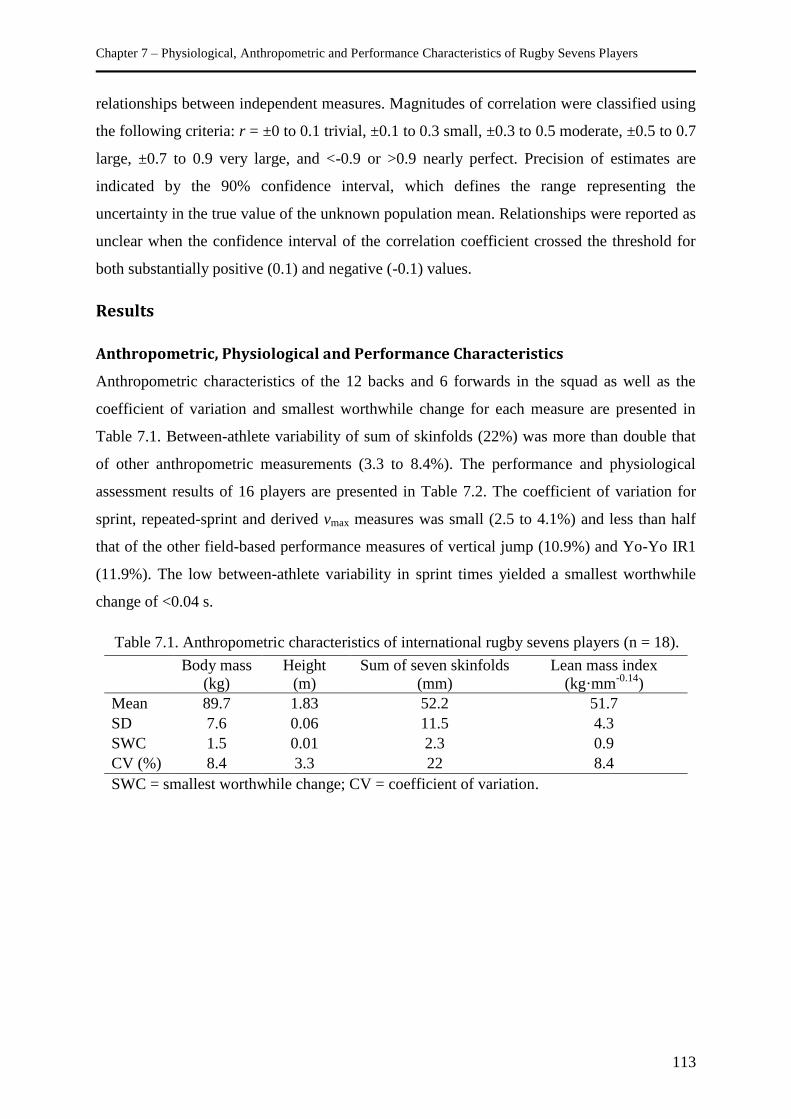
Chapter 7 – Physiological, Anthropometric and Performance Characteristics of Rugby Sevens Players
113
relationships between independent measures. Magnitudes of correlation were classified using
the following criteria: r = ±0 to 0.1 trivial, ±0.1 to 0.3 small, ±0.3 to 0.5 moderate, ±0.5 to 0.7
large, ±0.7 to 0.9 very large, and <-0.9 or >0.9 nearly perfect. Precision of estimates are
indicated by the 90% confidence interval, which defines the range representing the
uncertainty in the true value of the unknown population mean. Relationships were reported as
unclear when the confidence interval of the correlation coefficient crossed the threshold for
both substantially positive (0.1) and negative (-0.1) values.
Results
Anthropometric, Physiological and Performance Characteristics
Anthropometric characteristics of the 12 backs and 6 forwards in the squad as well as the
coefficient of variation and smallest worthwhile change for each measure are presented in
Table 7.1. Between-athlete variability of sum of skinfolds (22%) was more than double that
of other anthropometric measurements (3.3 to 8.4%). The performance and physiological
assessment results of 16 players are presented in Table 7.2. The coefficient of variation for
sprint, repeated-sprint and derived vmax measures was small (2.5 to 4.1%) and less than half
that of the other field-based performance measures of vertical jump (10.9%) and Yo-Yo IR1
(11.9%). The low between-athlete variability in sprint times yielded a smallest worthwhile
change of <0.04 s.
Table 7.1. Anthropometric characteristics of international rugby sevens players (n = 18).
Body mass
(kg)
Height
(m)
Sum of seven skinfolds
(mm)
Lean mass index
(kg·mm-0.14
)
Mean 89.7 1.83 52.2 51.7
SD 7.6 0.06 11.5 4.3
SWC 1.5 0.01 2.3 0.9
CV (%) 8.4 3.3 22 8.4
SWC = smallest worthwhile change; CV = coefficient of variation.
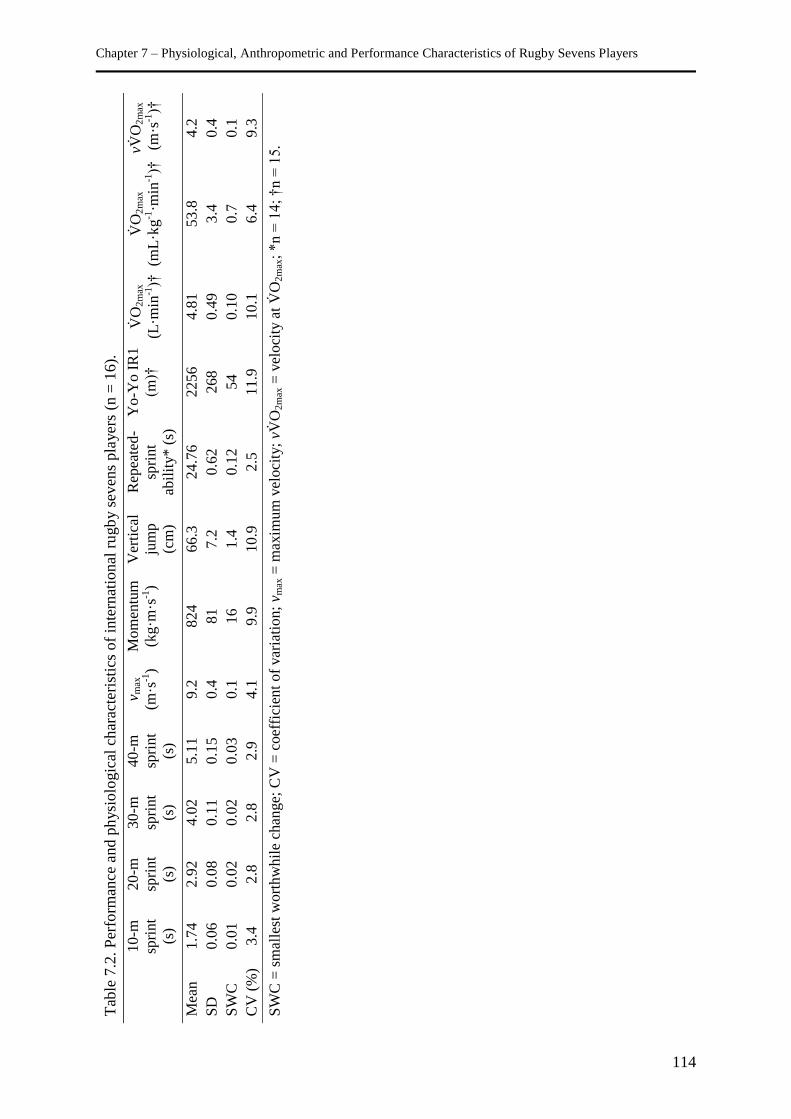
Chapter 7 – Physiological, Anthropometric and Performance Characteristics of Rugby Sevens Players
114
Tab
le 7
.2. P
erfo
rman
ce a
nd p
hysi
olo
gic
al c
har
acte
rist
ics
of
inte
rnat
ional
ru
gb
y s
even
s pla
yer
s (n
= 1
6).
10
-m
spri
nt
(s)
20
-m
spri
nt
(s)
30-m
spri
nt
(s)
40-m
spri
nt
(s)
v max
(m·s
-1)
Mo
men
tum
(kg·m
·s-1
)
Ver
tica
l
jum
p
(cm
)
Rep
eate
d-
spri
nt
abil
ity*
(s)
Yo
-Yo
IR
1
(m)†
V̇
O2
max
(L·m
in-1
)†
V̇O
2m
ax
(mL
·kg
-1·m
in-1
)†
vV̇O
2m
ax
(m·s
-1)†
Mea
n
1.7
4
2.9
2
4.0
2
5.1
1
9.2
8
24
66
.3
24
.76
2
25
6
4.8
1
53
.8
4.2
SD
0.0
6
0.0
8
0.1
1
0.1
5
0.4
8
1
7.2
0
.62
2
68
0
.49
3.4
0
.4
SW
C
0.0
1
0.0
2
0.0
2
0.0
3
0.1
1
6
1.4
0
.12
5
4
0.1
0
0.7
0
.1
CV
(%
) 3.4
2.8
2.8
2.9
4.1
9.9
10.9
2
.5
11.9
10.1
6.4
9.3
SW
C =
sm
alle
st w
ort
hw
hil
e ch
ange;
CV
= c
oef
fici
ent
of
var
iati
on
; v m
ax =
max
imu
m v
eloci
ty;
vV̇O
2m
ax =
vel
oci
ty a
t V̇
O2
max
; *
n =
14
; †
n =
15.
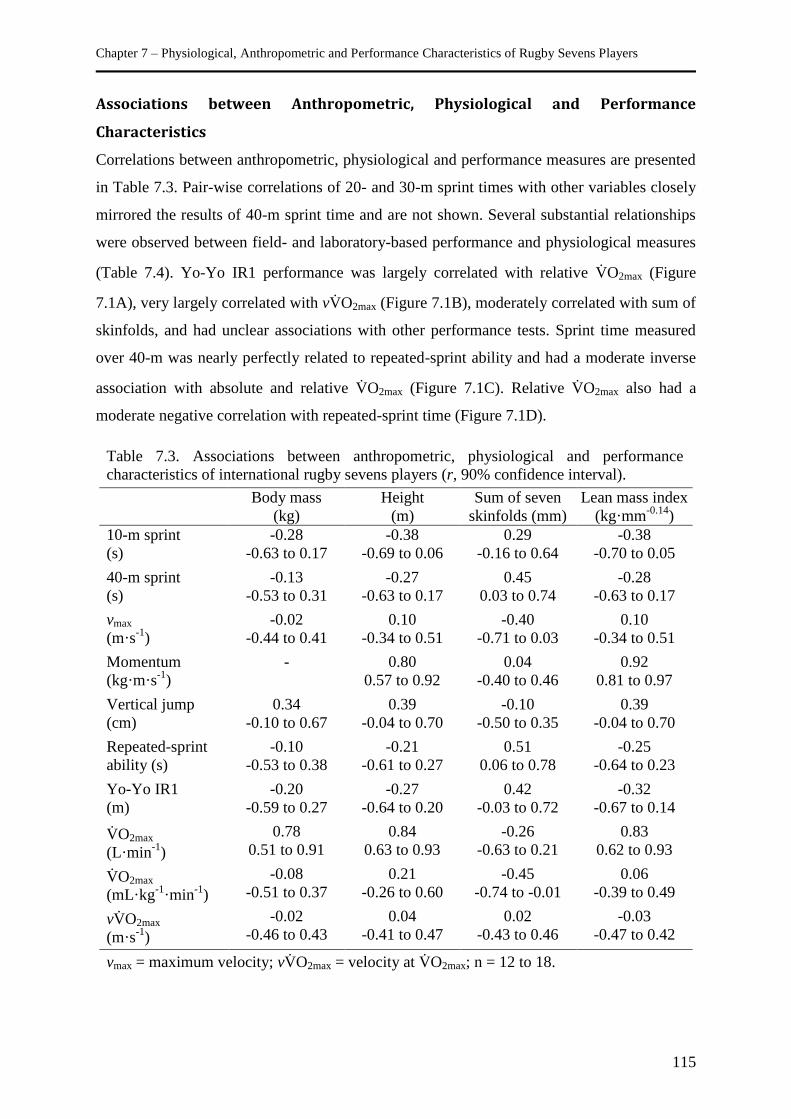
Chapter 7 – Physiological, Anthropometric and Performance Characteristics of Rugby Sevens Players
115
Associations between Anthropometric, Physiological and Performance
Characteristics
Correlations between anthropometric, physiological and performance measures are presented
in Table 7.3. Pair-wise correlations of 20- and 30-m sprint times with other variables closely
mirrored the results of 40-m sprint time and are not shown. Several substantial relationships
were observed between field- and laboratory-based performance and physiological measures
(Table 7.4). Yo-Yo IR1 performance was largely correlated with relative V̇O2max (Figure
7.1A), very largely correlated with vV̇O2max (Figure 7.1B), moderately correlated with sum of
skinfolds, and had unclear associations with other performance tests. Sprint time measured
over 40-m was nearly perfectly related to repeated-sprint ability and had a moderate inverse
association with absolute and relative V̇O2max (Figure 7.1C). Relative V̇O2max also had a
moderate negative correlation with repeated-sprint time (Figure 7.1D).
Table 7.3. Associations between anthropometric, physiological and performance
characteristics of international rugby sevens players (r, 90% confidence interval).
Body mass
(kg)
Height
(m)
Sum of seven
skinfolds (mm)
Lean mass index
(kg·mm-0.14
)
10-m sprint
(s)
-0.28
-0.63 to 0.17
-0.38
-0.69 to 0.06
0.29
-0.16 to 0.64
-0.38
-0.70 to 0.05
40-m sprint
(s)
-0.13
-0.53 to 0.31
-0.27
-0.63 to 0.17
0.45
0.03 to 0.74
-0.28
-0.63 to 0.17
vmax
(m·s-1
)
-0.02
-0.44 to 0.41
0.10
-0.34 to 0.51
-0.40
-0.71 to 0.03
0.10
-0.34 to 0.51
Momentum
(kg·m·s-1
)
- 0.80
0.57 to 0.92
0.04
-0.40 to 0.46
0.92
0.81 to 0.97
Vertical jump
(cm)
0.34
-0.10 to 0.67
0.39
-0.04 to 0.70
-0.10
-0.50 to 0.35
0.39
-0.04 to 0.70
Repeated-sprint
ability (s)
-0.10
-0.53 to 0.38
-0.21
-0.61 to 0.27
0.51
0.06 to 0.78
-0.25
-0.64 to 0.23
Yo-Yo IR1
(m)
-0.20
-0.59 to 0.27
-0.27
-0.64 to 0.20
0.42
-0.03 to 0.72
-0.32
-0.67 to 0.14
V̇O2max
(L·min-1
)
0.78
0.51 to 0.91
0.84
0.63 to 0.93
-0.26
-0.63 to 0.21
0.83
0.62 to 0.93
V̇O2max
(mL·kg-1
·min-1
)
-0.08
-0.51 to 0.37
0.21
-0.26 to 0.60
-0.45
-0.74 to -0.01
0.06
-0.39 to 0.49
vV̇O2max
(m·s-1
)
-0.02
-0.46 to 0.43
0.04
-0.41 to 0.47
0.02
-0.43 to 0.46
-0.03
-0.47 to 0.42
vmax = maximum velocity; vV̇O2max = velocity at V̇O2max; n = 12 to 18.
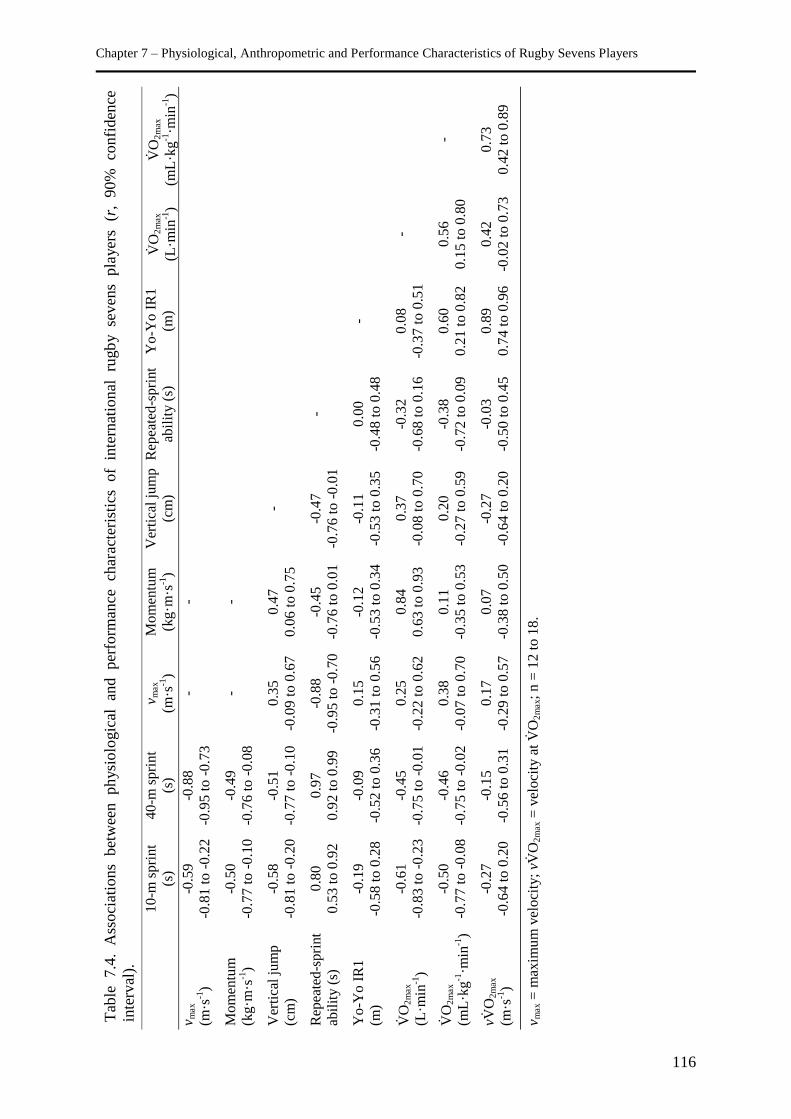
Chapter 7 – Physiological, Anthropometric and Performance Characteristics of Rugby Sevens Players
116
Tab
le
7.4
. A
ssoci
atio
ns
bet
wee
n
ph
ysi
olo
gic
al
and
per
form
ance
ch
arac
teri
stic
s of
inte
rnat
ional
ru
gb
y
sev
ens
pla
yer
s (r
, 90%
co
nfi
den
ce
inte
rval
).
10-m
sp
rin
t (s
) 4
0-m
spri
nt
(s)
vm
ax
(m·s
-1)
Mom
entu
m
(kg·m
·s-1
) V
erti
cal
jum
p
(cm
) R
epea
ted
-sp
rint
abil
ity (
s)
Yo
-Yo
IR
1
(m)
V̇O
2m
ax
(L·m
in-1
) V̇
O2
max
(mL
·kg
-1·m
in-1
) v
max
(m·s
-1)
-0.5
9
-0.8
1 t
o -
0.2
2
-0.8
8
-0.9
5 t
o -
0.7
3
- -
Mom
entu
m
(kg·m
·s-1
) -0
.50
-0.7
7 t
o -
0.1
0
-0.4
9
-0.7
6 t
o -
0.0
8
- -
Ver
tica
l ju
mp
(cm
) -0
.58
-0.8
1 t
o -
0.2
0
-0.5
1
-0.7
7 t
o -
0.1
0
0.3
5
-0.0
9 t
o 0
.67
0.4
7
0.0
6 t
o 0
.75
-
Rep
eate
d-s
pri
nt
abil
ity (
s)
0.8
0
0.5
3 t
o 0
.92
0.9
7
0.9
2 t
o 0
.99
-0.8
8
-0.9
5 t
o -
0.7
0
-0.4
5
-0.7
6 t
o 0
.01
-0.4
7
-0.7
6 t
o -
0.0
1
-
Yo
-Yo I
R1
(m)
-0.1
9
-0.5
8 t
o 0
.28
-0.0
9
-0.5
2 t
o 0
.36
0.1
5
-0.3
1 t
o 0
.56
-0.1
2
-0.5
3 t
o 0
.34
-0.1
1
-0.5
3 t
o 0
.35
0.0
0
-0.4
8 t
o 0
.48
-
V̇O
2m
ax
(L·m
in-1
)
-0.6
1
-0.8
3 t
o -
0.2
3
-0.4
5
-0.7
5 t
o -
0.0
1
0.2
5
-0.2
2 t
o 0
.62
0.8
4
0.6
3 t
o 0
.93
0.3
7
-0.0
8 t
o 0
.70
-0.3
2
-0.6
8 t
o 0
.16
0.0
8
-0.3
7 t
o 0
.51
-
V̇O
2m
ax
(mL
·kg
-1·m
in-1
)
-0.5
0
-0.7
7 t
o -
0.0
8
-0.4
6
-0.7
5 t
o -
0.0
2
0.3
8
-0.0
7 t
o 0
.70
0.1
1
-0.3
5 t
o 0
.53
0.2
0
-0.2
7 t
o 0
.59
-0.3
8
-0.7
2 t
o 0
.09
0.6
0
0.2
1 t
o 0
.82
0.5
6
0.1
5 t
o 0
.80
-
vV̇O
2m
ax
(m·s
-1)
-0.2
7
-0.6
4 t
o 0
.20
-0.1
5
-0.5
6 t
o 0
.31
0.1
7
-0.2
9 t
o 0
.57
0.0
7
-0.3
8 t
o 0
.50
-0.2
7
-0.6
4 t
o 0
.20
-0.0
3
-0.5
0 t
o 0
.45
0.8
9
0.7
4 t
o 0
.96
0.4
2
-0.0
2 t
o 0
.73
0.7
3
0.4
2 t
o 0
.89
vm
ax =
max
imu
m v
elo
city
; vV̇
O2
max =
vel
oci
ty a
t V̇
O2
max;
n =
12 t
o 1
8.
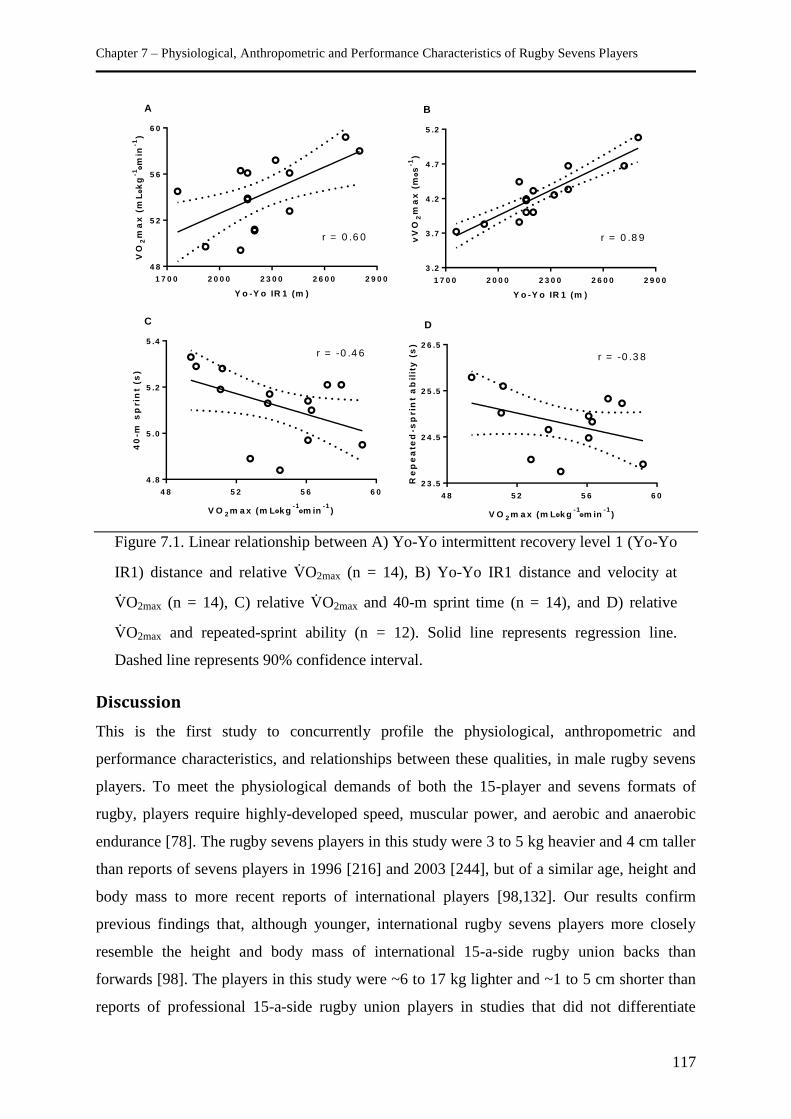
Chapter 7 – Physiological, Anthropometric and Performance Characteristics of Rugby Sevens Players
117
A
1 7 0 0 2 0 0 0 2 3 0 0 2 6 0 0 2 9 0 0
4 8
5 2
5 6
6 0
Y o -Y o IR 1 (m )
VO
2m
ax
(m
Lk
g-1m
in-1
)
r = 0 .6 0
B
1 7 0 0 2 0 0 0 2 3 0 0 2 6 0 0 2 9 0 0
3 .2
3 .7
4 .2
4 .7
5 .2
Y o -Y o IR 1 (m )
vV
O2
ma
x (
ms
-1)
r = 0 .8 9
C
4 8 5 2 5 6 6 0
4 .8
5 .0
5 .2
5 .4
V O 2 m a x (m L k g-1m in
-1)
40
-m s
prin
t (s
)
r = -0 .4 6
D
4 8 5 2 5 6 6 0
2 3 .5
2 4 .5
2 5 .5
2 6 .5
V O 2 m a x (m L k g-1m in
-1)
Re
pe
ate
d-s
prin
t a
bil
ity
(s
)
r = -0 .3 8
Figure 7.1. Linear relationship between A) Yo-Yo intermittent recovery level 1 (Yo-Yo
IR1) distance and relative V̇O2max (n = 14), B) Yo-Yo IR1 distance and velocity at
V̇O2max (n = 14), C) relative V̇O2max and 40-m sprint time (n = 14), and D) relative
V̇O2max and repeated-sprint ability (n = 12). Solid line represents regression line.
Dashed line represents 90% confidence interval.
Discussion
This is the first study to concurrently profile the physiological, anthropometric and
performance characteristics, and relationships between these qualities, in male rugby sevens
players. To meet the physiological demands of both the 15-player and sevens formats of
rugby, players require highly-developed speed, muscular power, and aerobic and anaerobic
endurance [78]. The rugby sevens players in this study were 3 to 5 kg heavier and 4 cm taller
than reports of sevens players in 1996 [216] and 2003 [244], but of a similar age, height and
body mass to more recent reports of international players [98,132]. Our results confirm
previous findings that, although younger, international rugby sevens players more closely
resemble the height and body mass of international 15-a-side rugby union backs than
forwards [98]. The players in this study were ~6 to 17 kg lighter and ~1 to 5 cm shorter than
reports of professional 15-a-side rugby union players in studies that did not differentiate
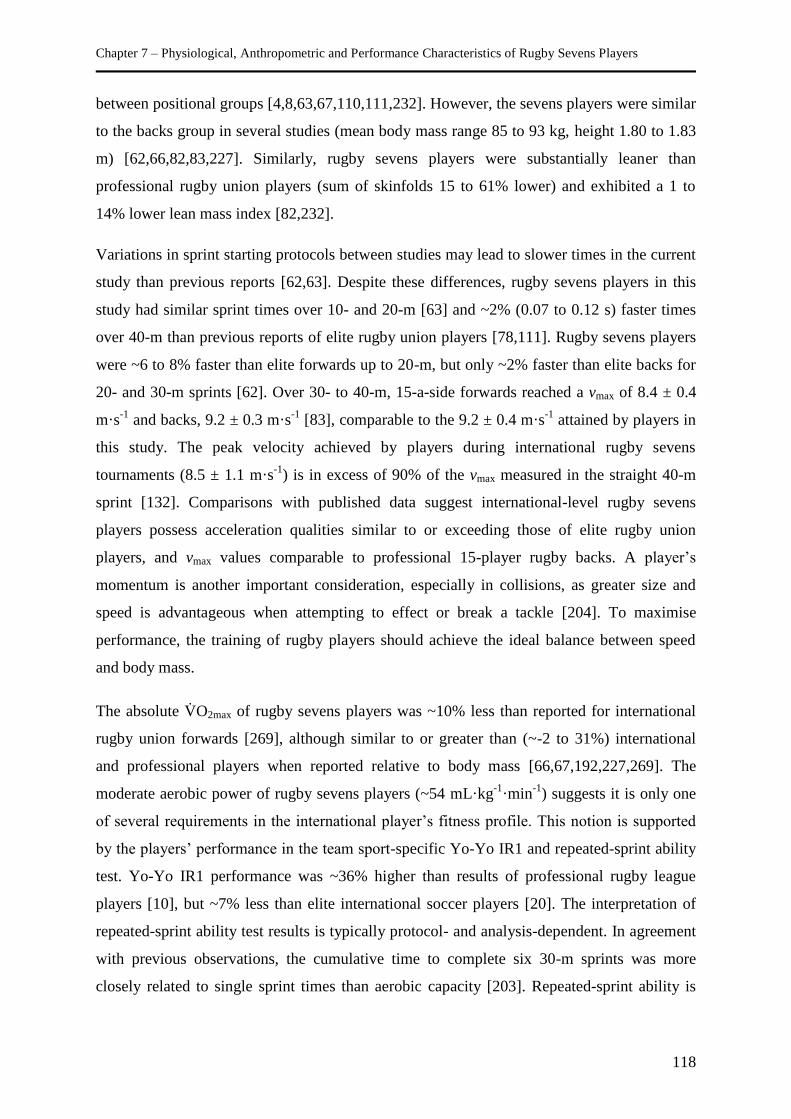
Chapter 7 – Physiological, Anthropometric and Performance Characteristics of Rugby Sevens Players
118
between positional groups [4,8,63,67,110,111,232]. However, the sevens players were similar
to the backs group in several studies (mean body mass range 85 to 93 kg, height 1.80 to 1.83
m) [62,66,82,83,227]. Similarly, rugby sevens players were substantially leaner than
professional rugby union players (sum of skinfolds 15 to 61% lower) and exhibited a 1 to
14% lower lean mass index [82,232].
Variations in sprint starting protocols between studies may lead to slower times in the current
study than previous reports [62,63]. Despite these differences, rugby sevens players in this
study had similar sprint times over 10- and 20-m [63] and ~2% (0.07 to 0.12 s) faster times
over 40-m than previous reports of elite rugby union players [78,111]. Rugby sevens players
were ~6 to 8% faster than elite forwards up to 20-m, but only ~2% faster than elite backs for
20- and 30-m sprints [62]. Over 30- to 40-m, 15-a-side forwards reached a vmax of 8.4 ± 0.4
m·s-1
and backs, 9.2 ± 0.3 m·s-1
[83], comparable to the 9.2 ± 0.4 m·s-1
attained by players in
this study. The peak velocity achieved by players during international rugby sevens
tournaments (8.5 ± 1.1 m·s-1
) is in excess of 90% of the vmax measured in the straight 40-m
sprint [132]. Comparisons with published data suggest international-level rugby sevens
players possess acceleration qualities similar to or exceeding those of elite rugby union
players, and vmax values comparable to professional 15-player rugby backs. A player’s
momentum is another important consideration, especially in collisions, as greater size and
speed is advantageous when attempting to effect or break a tackle [204]. To maximise
performance, the training of rugby players should achieve the ideal balance between speed
and body mass.
The absolute V̇O2max of rugby sevens players was ~10% less than reported for international
rugby union forwards [269], although similar to or greater than (~-2 to 31%) international
and professional players when reported relative to body mass [66,67,192,227,269]. The
moderate aerobic power of rugby sevens players (~54 mL·kg-1
·min-1
) suggests it is only one
of several requirements in the international player’s fitness profile. This notion is supported
by the players’ performance in the team sport-specific Yo-Yo IR1 and repeated-sprint ability
test. Yo-Yo IR1 performance was ~36% higher than results of professional rugby league
players [10], but ~7% less than elite international soccer players [20]. The interpretation of
repeated-sprint ability test results is typically protocol- and analysis-dependent. In agreement
with previous observations, the cumulative time to complete six 30-m sprints was more
closely related to single sprint times than aerobic capacity [203]. Repeated-sprint ability is
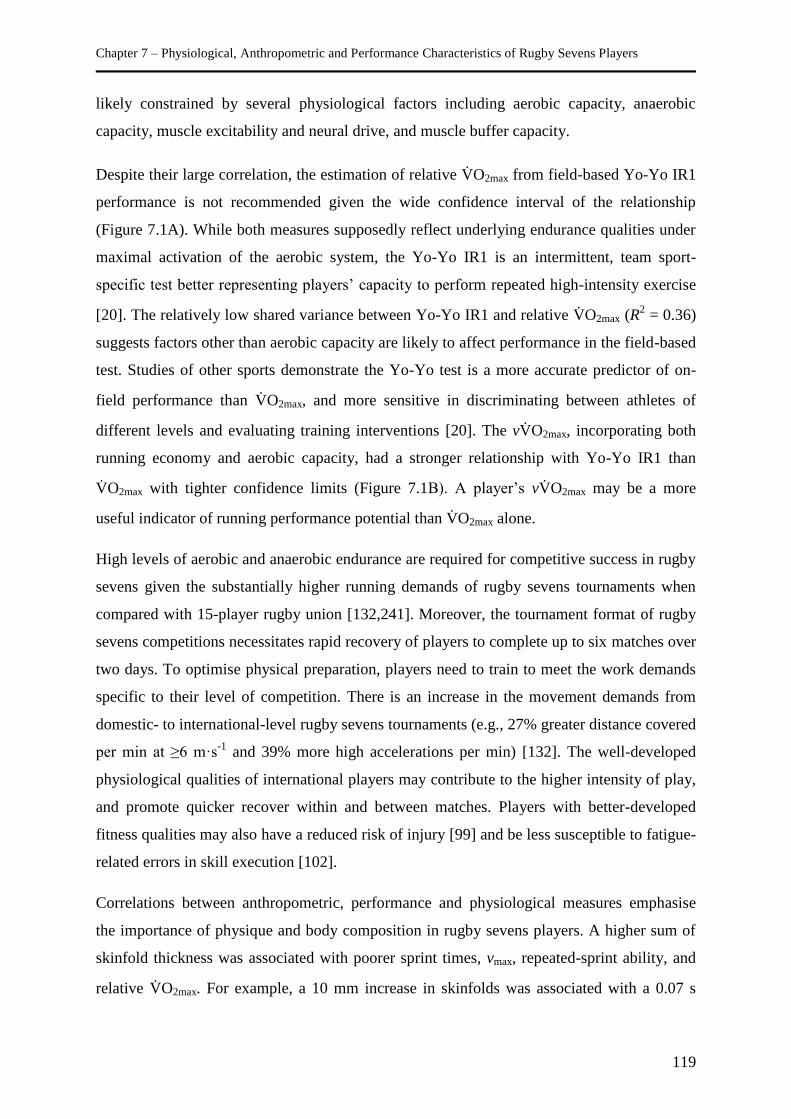
Chapter 7 – Physiological, Anthropometric and Performance Characteristics of Rugby Sevens Players
119
likely constrained by several physiological factors including aerobic capacity, anaerobic
capacity, muscle excitability and neural drive, and muscle buffer capacity.
Despite their large correlation, the estimation of relative V̇O2max from field-based Yo-Yo IR1
performance is not recommended given the wide confidence interval of the relationship
(Figure 7.1A). While both measures supposedly reflect underlying endurance qualities under
maximal activation of the aerobic system, the Yo-Yo IR1 is an intermittent, team sport-
specific test better representing players’ capacity to perform repeated high-intensity exercise
[20]. The relatively low shared variance between Yo-Yo IR1 and relative V̇O2max (R2 = 0.36)
suggests factors other than aerobic capacity are likely to affect performance in the field-based
test. Studies of other sports demonstrate the Yo-Yo test is a more accurate predictor of on-
field performance than V̇O2max, and more sensitive in discriminating between athletes of
different levels and evaluating training interventions [20]. The vV̇O2max, incorporating both
running economy and aerobic capacity, had a stronger relationship with Yo-Yo IR1 than
V̇O2max with tighter confidence limits (Figure 7.1B). A player’s vV̇O2max may be a more
useful indicator of running performance potential than V̇O2max alone.
High levels of aerobic and anaerobic endurance are required for competitive success in rugby
sevens given the substantially higher running demands of rugby sevens tournaments when
compared with 15-player rugby union [132,241]. Moreover, the tournament format of rugby
sevens competitions necessitates rapid recovery of players to complete up to six matches over
two days. To optimise physical preparation, players need to train to meet the work demands
specific to their level of competition. There is an increase in the movement demands from
domestic- to international-level rugby sevens tournaments (e.g., 27% greater distance covered
per min at ≥6 m·s-1
and 39% more high accelerations per min) [132]. The well-developed
physiological qualities of international players may contribute to the higher intensity of play,
and promote quicker recover within and between matches. Players with better-developed
fitness qualities may also have a reduced risk of injury [99] and be less susceptible to fatigue-
related errors in skill execution [102].
Correlations between anthropometric, performance and physiological measures emphasise
the importance of physique and body composition in rugby sevens players. A higher sum of
skinfold thickness was associated with poorer sprint times, vmax, repeated-sprint ability, and
relative V̇O2max. For example, a 10 mm increase in skinfolds was associated with a 0.07 s
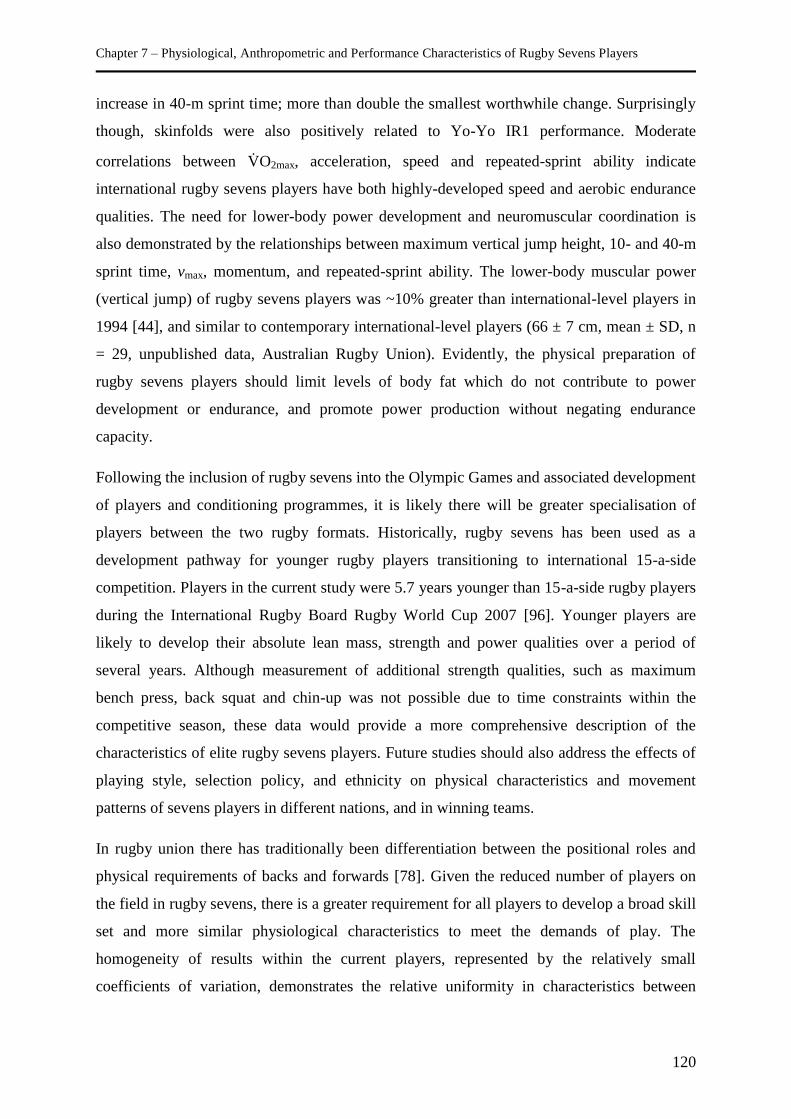
Chapter 7 – Physiological, Anthropometric and Performance Characteristics of Rugby Sevens Players
120
increase in 40-m sprint time; more than double the smallest worthwhile change. Surprisingly
though, skinfolds were also positively related to Yo-Yo IR1 performance. Moderate
correlations between V̇O2max, acceleration, speed and repeated-sprint ability indicate
international rugby sevens players have both highly-developed speed and aerobic endurance
qualities. The need for lower-body power development and neuromuscular coordination is
also demonstrated by the relationships between maximum vertical jump height, 10- and 40-m
sprint time, vmax, momentum, and repeated-sprint ability. The lower-body muscular power
(vertical jump) of rugby sevens players was ~10% greater than international-level players in
1994 [44], and similar to contemporary international-level players (66 ± 7 cm, mean ± SD, n
= 29, unpublished data, Australian Rugby Union). Evidently, the physical preparation of
rugby sevens players should limit levels of body fat which do not contribute to power
development or endurance, and promote power production without negating endurance
capacity.
Following the inclusion of rugby sevens into the Olympic Games and associated development
of players and conditioning programmes, it is likely there will be greater specialisation of
players between the two rugby formats. Historically, rugby sevens has been used as a
development pathway for younger rugby players transitioning to international 15-a-side
competition. Players in the current study were 5.7 years younger than 15-a-side rugby players
during the International Rugby Board Rugby World Cup 2007 [96]. Younger players are
likely to develop their absolute lean mass, strength and power qualities over a period of
several years. Although measurement of additional strength qualities, such as maximum
bench press, back squat and chin-up was not possible due to time constraints within the
competitive season, these data would provide a more comprehensive description of the
characteristics of elite rugby sevens players. Future studies should also address the effects of
playing style, selection policy, and ethnicity on physical characteristics and movement
patterns of sevens players in different nations, and in winning teams.
In rugby union there has traditionally been differentiation between the positional roles and
physical requirements of backs and forwards [78]. Given the reduced number of players on
the field in rugby sevens, there is a greater requirement for all players to develop a broad skill
set and more similar physiological characteristics to meet the demands of play. The
homogeneity of results within the current players, represented by the relatively small
coefficients of variation, demonstrates the relative uniformity in characteristics between
Chapter 7 – Physiological, Anthropometric and Performance Characteristics of Rugby Sevens Players
121
positions in rugby sevens. Irrespective of playing position, all rugby sevens players require
speed, ball-handling skills, change of direction pace, adroit defensive skills, and strength and
power to secure the ball in contact situations. Indeed, it is not uncommon for players
competing as backs in 15-a-side rugby to play as forwards in rugby sevens.
The utility of fitness and anthropometric testing in rugby sevens players relates to the
reliability (noise, expressed as a TE) of the test relative to the smallest worthwhile change
(signal). The relatively low between-athlete variation in test results means the smallest
worthwhile change likely to impact performance is also small for most tests. For example, the
sum of skinfolds is a useful assessment for measuring changes in body fat levels because the
signal exceeds the noise, while the vertical jump and 40-m sprint are acceptable because the
signal is similar to the noise. Conversely, the Yo-Yo IR1 offers only marginal utility given
the test reliability (90 m) is poorer than the smallest worthwhile change (54 m). Although
tests such as the Yo-Yo IR1 are only marginally useful in detecting practically important
changes in performance, this does not necessarily diminish their relative importance. Clearly,
most coaches would regard sport-specific endurance as an important aspect of rugby
performance. The reliability of laboratory- and field-based tests requires strict adherence to
test protocols and calibration procedures, subject familiarisation, motivation and warm-up
and, when appropriate, repeat trials. Collectively, the battery of assessments in this study
provides an acceptable level of reliability to detect practically important changes in rugby
sevens performance.
Practical Applications
Our findings provide an important first step toward the development of physical performance
standards for players training to compete at the international level. Top-level rugby sevens
players exhibit highly-developed characteristics across a range of fitness measures implying
training programmes should develop all physical capacities. Endurance, speed, acceleration,
repeated-sprint and power measures may be improved without compromising other qualities
pertinent to performance. Based on the potential for competing demands, players training
concurrently for both rugby union and rugby sevens should prioritise their training
programme according to specific anthropometric and fitness requirements and timing of
competitive seasons.
Although position-specific skill and physiological requirements must be considered when
interpreting testing results, there is a need for players of all positions to achieve minimum
Chapter 7 – Physiological, Anthropometric and Performance Characteristics of Rugby Sevens Players
122
performance standards for competitive success at the international level. Assessing an
individual player’s strengths and weaknesses facilitates the prescription of an individualised
training programme [81]. Regular physiological and anthropometric assessments are
recommended to monitor the physical development and progression of players. Simple field-
based measures may be employed to assess training adaptations and prescribe velocity
thresholds for performance monitoring in place of time-consuming and expensive laboratory-
based tests. A structured testing regime conducted at various phases of the season (e.g., off-
season, pre-season, mid-season) will assist in planning periodised training programmes and
evaluating their effectiveness.
Conclusion
Elite male rugby sevens players have anthropometric characteristics similar to backs in
international 15-player rugby union and acceleration and speed, lower-body muscular power,
and relative maximal aerobic power attributes similar to, or exceeding, those of professional
15-a-side players. To meet the demands of competition, rugby sevens players require highly-
developed speed, power and endurance qualities. The small between-athlete variability of
characteristics in rugby sevens players highlights the need for relatively uniform physical and
performance standards in contrast with 15-a-side players. Field-based testing provides a
simple, inexpensive and effective method of evaluating fitness qualities in rugby sevens
players.
Acknowledgements
We gratefully acknowledge the cooperation of the players and the coaching and support staff.
Thank you to Laura Juliff and Stuart Graham of the Australian Institute of Sport for their
assistance with data collection. No external financial assistance was obtained for this study.
Chapter 8 – Distribution of Fat, Non-osseous Lean and Bone Mineral Mass in International Rugby Union and
Rugby Sevens Players
123
Chapter Eight - Distribution of Fat, Non-osseous Lean and
Bone Mineral Mass in International Rugby Union and
Rugby Sevens Players
Higham, D.G., Pyne, D.B., Anson, J.M., Dziedzic, C.E., & Slater, G.J. (2014). Distribution of
fat, non-osseous lean and bone mineral mass in international Rugby Union and Rugby Sevens
players. International Journal of Sports Medicine. (in press).
Abstract
Differences in the body composition of international rugby union and rugby sevens players,
and between players of different positions are poorly understood. The purpose of this study
was to examine differences in the quantity and regional distribution of fat, non-osseous lean
and bone mineral mass between playing units in rugby union and rugby sevens. Male rugby
union (n = 21 forwards, 17 backs) and rugby sevens (n = 11 forwards, 16 backs) players from
the Australian national squads were measured using dual-energy X-ray absorptiometry. The
digital image of each player was partitioned into anatomical regions including the arms, legs,
trunk, and android and gynoid regions. Compared with backs, forwards in each squad were
heavier and exhibited higher absolute regional fat (union 43 to 67%; ±~17%, range of %
differences; ±~95% confidence limits (CL); sevens 20 to 26%; ±~29%), non-osseous lean
(union 14 to 22%; ±~5.8%; sevens 6.9 to 8.4%; ±~6.6%) and bone mineral (union 12 to 26%;
±~7.2%; sevens 5.0 to 11%; ±~7.2%) mass. When tissue mass was expressed relative to
regional mass, differences between rugby sevens forwards and backs were mostly unclear.
Rugby union forwards had higher relative fat mass (1.7 to 4.7%; ±~1.9%, range of
differences; ±~95% CL) and lower relative non-osseous lean mass (-4.2 to -1.8%; ±~1.8%)
than backs in all body regions. Competing in rugby union or rugby sevens characterised the
distribution of fat and non-osseous lean mass to a greater extent than a player’s positional
group, whereas the distribution of bone mineral mass was associated more with a player’s
position. Differences in the quantity and distribution of tissues appear to be related to
positional roles and specific demands of competition in rugby union and rugby sevens.
Key words: anthropometry, physique, body composition, adiposity, dual-energy X-ray
absorptiometry
Chapter 8 – Distribution of Fat, Non-osseous Lean and Bone Mineral Mass in International Rugby Union and
Rugby Sevens Players
124
Introduction
Physique traits of players are important factors associated with success in international rugby
union. In the Rugby World Cup, the height and mass of players increased progressively
between 1987 and 2007, with higher ranking teams having taller backs and heavier forwards
[228]. A greater body mass is advantageous during physical contests for the ball. However,
when additional mass is carried as fat, a player’s power-to-weight ratio, acceleration and
metabolic efficiency may be compromised [277]. Higher relative fat mass is also associated
with a greater reliance on carbohydrate metabolism [154] and may impair thermoregulation
[230]. Quantifying a player’s body composition therefore provides valuable information for
dietary and training prescription.
Rugby sevens is a shortened format of rugby union that will debut at the Olympic Games in
2016. Rugby sevens competitions are contested in a tournament format where matches are
played over 7-min halves (10-min halves in tournament finals) with seven players on the field
for each team. The relationship between kinanthropometric measures and performance in
rugby sevens is unclear [216]. Given the higher relative movement demands and reduced
emphasis on physical contact of rugby sevens compared with rugby union [132], it is likely
the body composition of international-level players in each format also differ [133].
Understanding the physique characteristics of rugby union and rugby sevens players could
assist in directing players into the rugby format and positional group to which they are best
physically suited. This information could also be used to increase the specificity of physical
preparation and dietary programmes.
Although body composition is typically described at a whole-body level, dual-energy X-ray
absorptiometry (DXA) enables valid and reliable measurement of regional body composition
[184]. Limited information exists regarding the relationship between regional distribution of
tissue and sporting performance. Faster sprinters have lower relative body fat and greater
muscle thickness in the upper thigh than their slower peers [160]. Deposition of mass more
proximal to the joint may enhance biomechanical efficiency, offering a performance
advantage [221]. Preliminary research has identified differences in the quantity and
distribution of fat, non-osseous lean and bone mineral mass between rugby union backs and
forwards [27]. These differences appear to be related to variations in competition
requirements and playing roles of positional groups. However, to date no published data exist
on players competing at the highest level of international rugby union or rugby sevens
Chapter 8 – Distribution of Fat, Non-osseous Lean and Bone Mineral Mass in International Rugby Union and
Rugby Sevens Players
125
competition. The purpose of this study was to quantify and compare the regional distribution
of fat, non-osseous lean and bone mineral mass measured by DXA between positional groups
in international-level rugby union and rugby sevens.
Methods
Experimental Approach
A cross-sectional design was employed to compare the regional quantity and distribution of
fat, non-osseous lean and bone mineral mass. Rugby union players underwent a DXA scan 20
± 3 days (mean ± SD), and rugby sevens players 43 ± 16 days, prior to the commencement of
their respective international competitions.
Participants
Thirty-eight rugby union and 27 rugby sevens players in the national men’s squads
representing Australia in international competition (world ranking at the time of the study:
rugby union, 2nd; rugby sevens, 6th) provided informed consent to participate in the study.
Players in each squad were assigned to groups based on their playing position as either
forwards (union n = 21; sevens n = 11) or backs (union n = 17; sevens n = 16). The study
procedures had institutional ethics committee approval and conformed to the standards of the
International Journal of Sports Medicine [127].
Standardised DXA Measurement and Analysis
The body composition of players was measured using a whole-body DXA scan. Players were
scanned in the morning following an overnight fast and had not undertaken any exercise on
the morning of the scan. Players were scanned with standardised positioning wearing light
clothing and with all jewellery and metal objects removed [184]. Given geographical
constraints and player availability it was not possible to use the same DXA scanner for all
players. Rugby union players were measured using a Hologic Discovery A fan-beam scanner
(Hologic Inc., Bedford, MA) and rugby sevens players with a Lunar Prodigy narrow-angle
fan-beam scanner (GE Healthcare, Madison, WI). Scanners were calibrated according to
manufacturers’ guidelines. Quality assurance and quality control procedures were conducted
daily before measurement using phantom blocks of known density. One experienced operator
conducted and analysed all scans for rugby union players, and another experienced operator
conducted and analysed all scans for the rugby sevens squad. Players too large to fit within
the scan area of the machine were measured using multiple scans [185]. The typical error of

Chapter 8 – Distribution of Fat, Non-osseous Lean and Bone Mineral Mass in International Rugby Union and
Rugby Sevens Players
126
measurement expressed as a coefficient of variation (%) for whole-body and regional DXA
measurements in males using the Lunar Prodigy scanner is 1.9 to 3.7% for fat, 0.4 to 1.5% for
non-osseous lean and 0.5 to 2.2% for bone mineral mass [184]. The Hologic scanner
demonstrates coefficients of variation ranging from 0.2 to 3.5% [224].
Scans of rugby union players were analysed using Apex software (version 3.3, Hologic Inc.,
Bedford, MA) and rugby sevens players with enCORE software (version 13.6, GE
Healthcare, Madison, WI). The digital image of the player was partitioned into anatomical
regions including the head, arms, legs, trunk, android and gynoid regions (Figure 8.1).
Horizontal lines were placed directly inferior to the mandible to mark the head and at the
level of the iliac crests. Lines running through the glenohumeral joints, isolating the arms
from the trunk, joined the superior and inferior horizontal lines. Oblique lines running from
the horizontal line at the level of the iliac crest through the femoral necks separated the trunk
and legs. Lines placed lateral to the legs separated the arms and legs, and a line placed medial
to the legs separated left and right leg. The android region was defined by an inferior border
at the iliac crest line, a superior border 20% of the distance between iliac crest and mandible
lines, and lateral borders at the lines separating the trunk and arms. The gynoid region was
defined by a superior border below the iliac crest line at a level 1.5 times the vertical length
of the android region. The vertical length of the gynoid region was twice the vertical length
of the android region with lateral borders at the lines lateral to each leg.
Figure 8.1. Example DXA scan image partitioned into regions of interest for analysis.
Chapter 8 – Distribution of Fat, Non-osseous Lean and Bone Mineral Mass in International Rugby Union and
Rugby Sevens Players
127
Statistical Analysis
Given differences in the partitioning of tissue measured using DXA scanners of different
models and lack of population-specific cross-calibration equations for each tissue and region
of interest [231], total mass along with absolute and relative quantities of each tissue mass in
the arms, legs, trunk, android and gynoid segments were analysed separately for the rugby
union and rugby sevens squads. In the android and gynoid regions, only fat mass was
analysed. In the context of this study, “fat” refers to extractable lipids such as triglycerides
and fatty acids, primarily found in adipose tissue but also present in skeletal muscle, organs
and bone marrow. Conversely, “adipose tissue” refers to masses under the skin
(subcutaneous) and surrounding muscles and organs (visceral) separable by dissection,
composed chiefly of lipids, but also water, protein and minerals [46]. The proportion of mass
in each region relative to DXA-derived whole-body mass was also analysed for each
positional group within each squad. Descriptive data are presented as mean ± SD. A ratio of
each tissue mass in the arms, legs and trunk to the corresponding whole-body tissue mass was
calculated to indicate the regional distribution of tissue independent of the absolute quantity
of tissue. Principal components analyses were conducted on the ratio values to identify the
distribution of each tissue for all players. Components with eigenvalues >1.0 were considered
meaningful. Component scores were compared between backs and forwards regardless of
their squad, between rugby sevens and rugby union players and between positional groups
within and between squads.
Magnitude-based inferences on differences between positional groups and squads were made
by standardising differences using the between-player SD. Positional group differences in
whole-body mass and the absolute mass of each tissue in each region were assessed via log-
transformed data to reduce the non-uniformity of error, and back-transformed to obtain
differences in means as percents. Magnitudes of standardised differences in means were
assessed as 0 to 0.2 being trivial, 0.2 to 0.6 small, 0.6 to 1.2 moderate, 1.2 to 2.0 large and
>2.0 very large. To reduce the chance of errors regarding inferences, precision of estimates
were indicated with 95% confidence limits. Differences were reported as unclear when the
confidence interval of the standardised difference crossed the threshold for both substantially
positive (0.2) and negative (-0.2) values.
Chapter 8 – Distribution of Fat, Non-osseous Lean and Bone Mineral Mass in International Rugby Union and
Rugby Sevens Players
128
Results
Age and Body Mass
Rugby union forwards (25.3 ± 3.4 years) and backs (24.5 ± 1.9 years) were older than their
rugby sevens counterparts (forwards 22.4 ± 2.3 years; backs 21.5 ± 2.0 years), but there were
no clear differences in the ages of backs and forwards within the same squad. Backs were
lighter than forwards in each squad. There was a large difference in whole-body mass
between rugby sevens forwards (95.0 ± 5.1 kg) and backs (87.4 ± 7.3 kg), whereas the
difference between rugby sevens forwards and rugby union backs (92.3 ± 6.8 kg) was
unclear. Rugby union backs were moderately heavier than rugby sevens backs, while rugby
union forwards (111.7 ± 7.9 kg) exhibited very large differences in body mass compared with
all other groups.
Absolute Regional Tissue Mass
Forwards in rugby union had large to very large positive differences in every tissue mass
across all regions compared with backs, with the exception of only moderately greater bone
mass in the left leg (Table 8.1). Forwards in rugby sevens had more absolute fat mass in the
gynoid region, but an unclear difference in the android region compared with backs. Rugby
sevens forwards also had moderately greater fat, non-osseous lean and bone mineral mass
than backs in the arms, legs and trunk (Table 8.1).
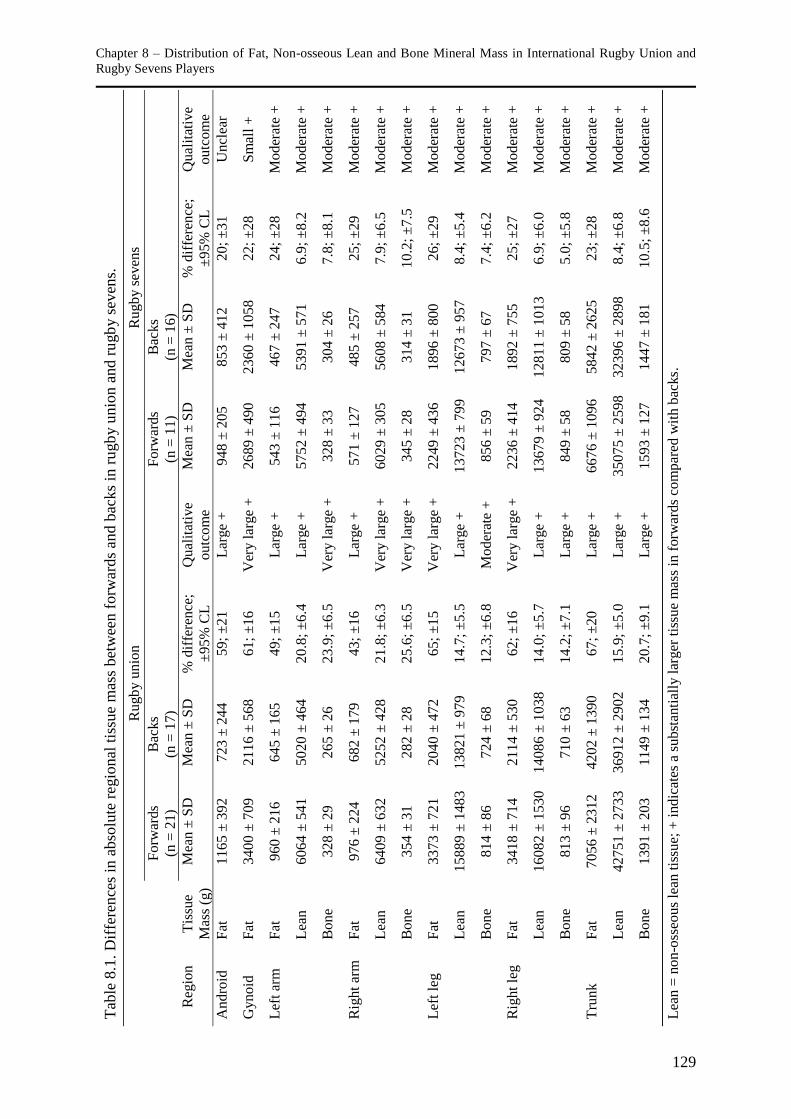
Chapter 8 – Distribution of Fat, Non-osseous Lean and Bone Mineral Mass in International Rugby Union and
Rugby Sevens Players
129
Tab
le 8
.1. D
iffe
ren
ces
in a
bso
lute
reg
ional
tis
sue
mas
s bet
wee
n f
orw
ards
and b
acks
in r
ugb
y u
nio
n a
nd r
ugb
y s
even
s.
Ru
gb
y u
nio
n
Rugby s
even
s
Fo
rwar
ds
(n =
21)
Bac
ks
(n =
17)
Forw
ards
(n =
11)
Bac
ks
(n =
16)
Reg
ion
Tis
sue
Mas
s (g
) M
ean
± S
D
Mea
n ±
SD
%
dif
fere
nce
;
±95%
CL
Q
ual
itat
ive
outc
om
e M
ean ±
SD
M
ean
± S
D
% d
iffe
ren
ce;
±9
5%
CL
Q
ual
itat
ive
ou
tco
me
Andro
id
Fat
1
16
5 ±
39
2
723 ±
244
59;
±21
Lar
ge
+
948 ±
20
5
85
3 ±
41
2
20
; ±
31
Un
clea
r
Gynoid
F
at
34
00
± 7
09
2116 ±
568
61;
±16
Ver
y l
arge
+
2689 ±
49
0
23
60
± 1
05
8
22
; ±
28
Sm
all
+
Lef
t ar
m
Fat
9
60
± 2
16
645 ±
165
49;
±15
Lar
ge
+
543 ±
11
6
46
7 ±
24
7
24
; ±
28
Mo
der
ate
+
L
ean
60
64
± 5
41
5020 ±
464
20.8
; ±
6.4
L
arge
+
5752 ±
49
4
53
91
± 5
71
6.9
; ±
8.2
M
od
erat
e +
B
on
e 3
28
± 2
9
265 ±
26
23.9
; ±
6.5
V
ery l
arge
+
328 ±
33
30
4 ±
26
7.8
; ±
8.1
M
od
erat
e +
Rig
ht
arm
F
at
97
6 ±
22
4
682 ±
179
43;
±16
Lar
ge
+
571
± 1
27
48
5 ±
25
7
25
; ±
29
Mo
der
ate
+
L
ean
64
09
± 6
32
5252 ±
428
21.8
; ±
6.3
V
ery l
arge
+
6029 ±
30
5
56
08
± 5
84
7.9
; ±
6.5
M
od
erat
e +
B
on
e 3
54
± 3
1
282 ±
28
25.6
; ±
6.5
V
ery l
arge
+
345 ±
28
31
4 ±
31
10
.2;
±7
.5
Mo
der
ate
+
Lef
t le
g
Fat
3373 ±
721
20
40
± 4
72
65
; ±
15
Ver
y l
arge
+
22
49
± 4
36
1896 ±
800
26;
±29
Moder
ate
+
L
ean
15
88
9 ±
14
83
13821 ±
979
14.7
; ±
5.5
L
arge
+
13723 ±
79
9
12
67
3 ±
95
7
8.4
; ±
5.4
M
od
erat
e +
B
on
e 8
14
± 8
6
724 ±
68
12.3
; ±
6.8
M
oder
ate
+
856 ±
59
79
7 ±
67
7.4
; ±
6.2
M
od
erat
e +
Rig
ht
leg
Fat
3
41
8 ±
71
4
2114 ±
530
62;
±16
Ver
y l
arge
+
2236 ±
41
4
18
92
± 7
55
25
; ±
27
Mo
der
ate
+
L
ean
16
08
2 ±
15
30
14086 ±
1038
14.0
; ±
5.7
L
arge
+
13679 ±
92
4
12
81
1 ±
10
13
6.9
; ±
6.0
M
od
erat
e +
B
on
e 8
13
± 9
6
710 ±
63
14.2
; ±
7.1
L
arge
+
849 ±
58
80
9 ±
58
5.0
; ±
5.8
M
od
erat
e +
Tru
nk
Fat
7
05
6 ±
23
12
4202 ±
1390
67;
±20
Lar
ge
+
6676 ±
10
96
58
42
± 2
62
5
23
; ±
28
Mo
der
ate
+
L
ean
42
75
1 ±
27
33
36912 ±
2902
15.9
; ±
5.0
L
arge
+
35075 ±
25
98
32
39
6 ±
28
98
8.4
; ±
6.8
M
od
erat
e +
B
on
e 1
39
1 ±
20
3
1149 ±
134
20.7
; ±
9.1
L
arge
+
1593 ±
12
7
14
47
± 1
81
10
.5;
±8
.6
Mo
der
ate
+
Lea
n =
non
-oss
eou
s le
an t
issu
e; +
ind
icat
es a
subst
anti
ally
lar
ger
tis
sue
mas
s in
forw
ards
com
par
ed w
ith
bac
ks.
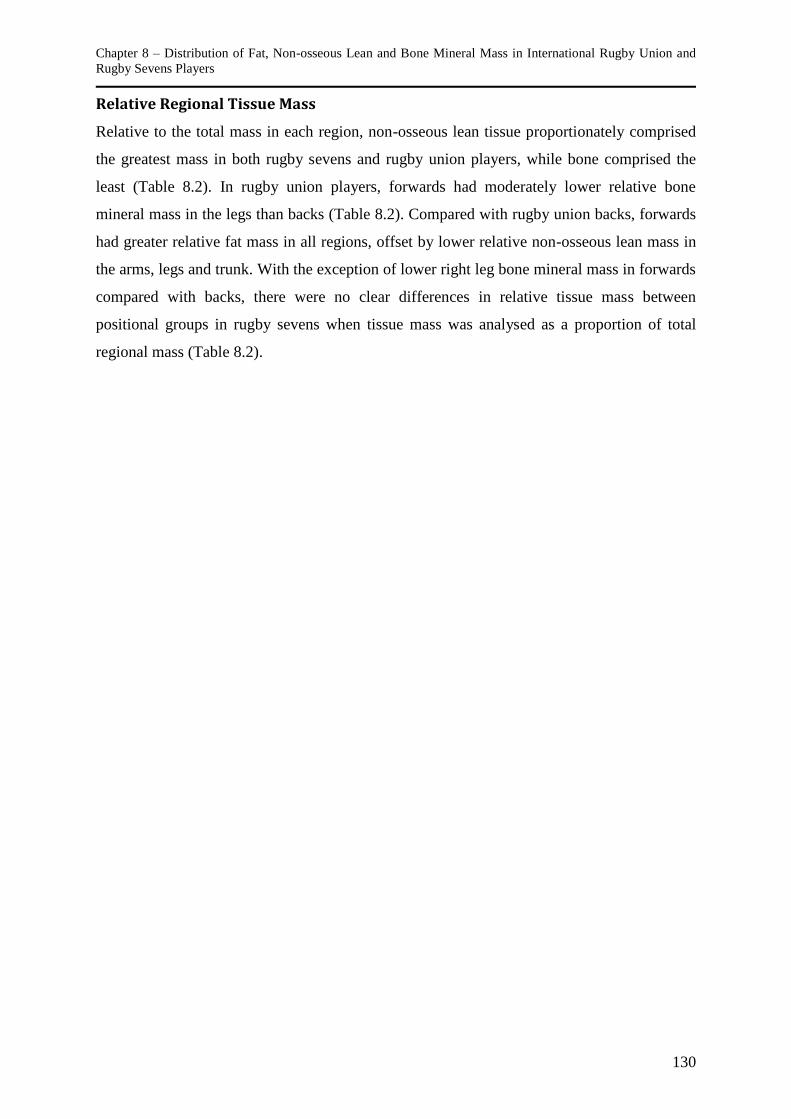
Chapter 8 – Distribution of Fat, Non-osseous Lean and Bone Mineral Mass in International Rugby Union and
Rugby Sevens Players
130
Relative Regional Tissue Mass
Relative to the total mass in each region, non-osseous lean tissue proportionately comprised
the greatest mass in both rugby sevens and rugby union players, while bone comprised the
least (Table 8.2). In rugby union players, forwards had moderately lower relative bone
mineral mass in the legs than backs (Table 8.2). Compared with rugby union backs, forwards
had greater relative fat mass in all regions, offset by lower relative non-osseous lean mass in
the arms, legs and trunk. With the exception of lower right leg bone mineral mass in forwards
compared with backs, there were no clear differences in relative tissue mass between
positional groups in rugby sevens when tissue mass was analysed as a proportion of total
regional mass (Table 8.2).
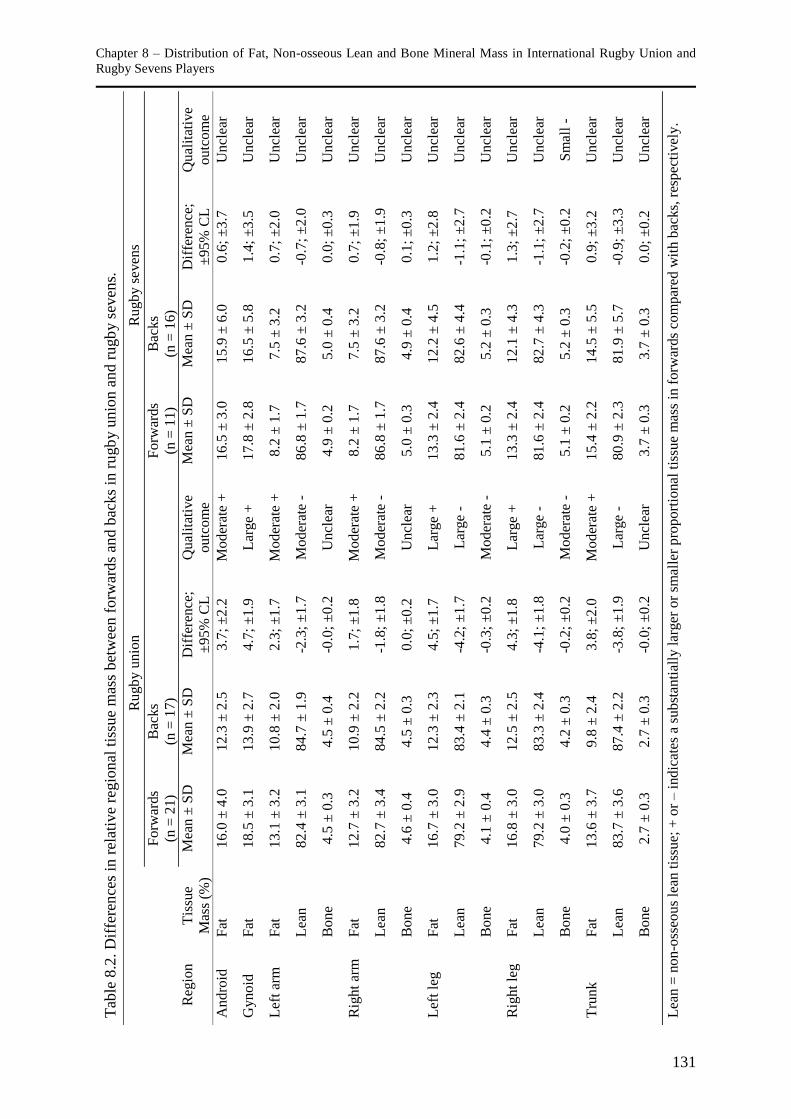
Chapter 8 – Distribution of Fat, Non-osseous Lean and Bone Mineral Mass in International Rugby Union and
Rugby Sevens Players
131
Tab
le 8
.2. D
iffe
ren
ces
in r
elat
ive
regio
nal
tis
sue
mas
s bet
wee
n f
orw
ards
and b
acks
in r
ugb
y u
nio
n a
nd r
ugb
y s
even
s.
Rugby u
nio
n
Ru
gb
y s
even
s
Fo
rwar
ds
(n =
21)
Bac
ks
(n =
17)
Forw
ards
(n =
11)
Bac
ks
(n =
16)
Reg
ion
Tis
sue
Mas
s (%
) M
ean
± S
D
Mea
n ±
SD
D
iffe
rence
;
±95%
CL
Q
ual
itat
ive
outc
om
e M
ean ±
SD
M
ean
± S
D
Dif
fere
nce
;
±9
5%
CL
Q
ual
itat
ive
ou
tco
me
Andro
id
Fat
1
6.0
± 4
.0
12.3
± 2
.5
3.7
; ±
2.2
M
oder
ate
+
16.5
± 3
.0
15
.9 ±
6.0
0
.6;
±3
.7
Un
clea
r
Gynoid
F
at
18
.5 ±
3.1
13.9
± 2
.7
4.7
; ±
1.9
L
arge
+
17.8
± 2
.8
16
.5 ±
5.8
1
.4;
±3
.5
Un
clea
r
Lef
t ar
m
Fat
1
3.1
± 3
.2
10.8
± 2
.0
2.3
; ±
1.7
M
oder
ate
+
8.2
± 1
.7
7.5
± 3
.2
0.7
; ±
2.0
U
ncl
ear
L
ean
82
.4 ±
3.1
84.7
± 1
.9
-2.3
; ±
1.7
M
oder
ate
- 86.8
± 1
.7
87
.6 ±
3.2
-0
.7;
±2
.0
Un
clea
r
B
on
e 4
.5 ±
0.3
4.5
± 0
.4
-0.0
; ±
0.2
U
ncl
ear
4.9
± 0
.2
5.0
± 0
.4
0.0
; ±
0.3
U
ncl
ear
Rig
ht
arm
F
at
12
.7 ±
3.2
10.9
± 2
.2
1.7
; ±
1.8
M
oder
ate
+
8.2
± 1
.7
7.5
± 3
.2
0.7
; ±
1.9
U
ncl
ear
L
ean
82.7
± 3
.4
84
.5 ±
2.2
-1
.8;
±1
.8
Mo
der
ate
- 8
6.8
± 1
.7
87.6
± 3
.2
-0.8
; ±
1.9
U
ncl
ear
B
on
e 4
.6 ±
0.4
4.5
± 0
.3
0.0
; ±
0.2
U
ncl
ear
5.0
± 0
.3
4.9
± 0
.4
0.1
; ±
0.3
U
ncl
ear
Lef
t le
g
Fat
1
6.7
± 3
.0
12.3
± 2
.3
4.5
; ±
1.7
L
arge
+
13.3
± 2
.4
12
.2 ±
4.5
1
.2;
±2
.8
Un
clea
r
L
ean
79
.2 ±
2.9
83.4
± 2
.1
-4.2
; ±
1.7
L
arge
- 81.6
± 2
.4
82
.6 ±
4.4
-1
.1;
±2
.7
Un
clea
r
B
on
e 4
.1 ±
0.4
4.4
± 0
.3
-0.3
; ±
0.2
M
oder
ate
- 5.1
± 0
.2
5.2
± 0
.3
-0.1
; ±
0.2
U
ncl
ear
Rig
ht
leg
Fat
1
6.8
± 3
.0
12.5
± 2
.5
4.3
; ±
1.8
L
arge
+
13.3
± 2
.4
12
.1 ±
4.3
1
.3;
±2
.7
Un
clea
r
L
ean
79
.2 ±
3.0
83.3
± 2
.4
-4.1
; ±
1.8
L
arge
- 81.6
± 2
.4
82
.7 ±
4.3
-1
.1;
±2
.7
Un
clea
r
B
on
e 4
.0 ±
0.3
4.2
± 0
.3
-0.2
; ±
0.2
M
oder
ate
- 5.1
± 0
.2
5.2
± 0
.3
-0.2
; ±
0.2
S
mal
l -
Tru
nk
Fat
1
3.6
± 3
.7
9.8
± 2
.4
3.8
; ±
2.0
M
oder
ate
+
15.4
± 2
.2
14
.5 ±
5.5
0
.9;
±3
.2
Un
clea
r
L
ean
83
.7 ±
3.6
87.4
± 2
.2
-3.8
; ±
1.9
L
arge
- 80.9
± 2
.3
81
.9 ±
5.7
-0
.9;
±3
.3
Un
clea
r
B
on
e 2
.7 ±
0.3
2.7
± 0
.3
-0.0
; ±
0.2
U
ncl
ear
3.7
± 0
.3
3.7
± 0
.3
0.0
; ±
0.2
U
ncl
ear
Lea
n =
non-o
sseo
us
lean
tis
sue;
+ o
r – i
nd
icat
es a
su
bst
anti
ally
lar
ger
or
smal
ler
pro
port
ional
tis
sue
mas
s in
forw
ards
com
par
ed w
ith b
acks,
res
pec
tivel
y.
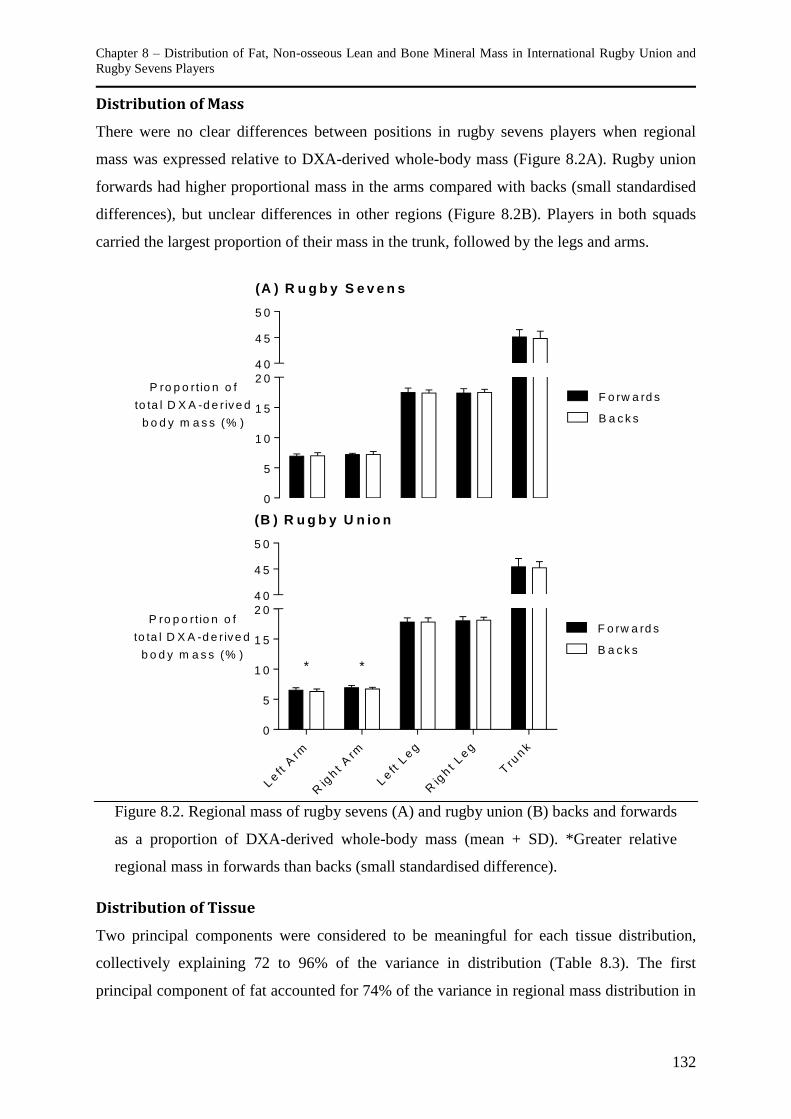
Chapter 8 – Distribution of Fat, Non-osseous Lean and Bone Mineral Mass in International Rugby Union and
Rugby Sevens Players
132
Distribution of Mass
There were no clear differences between positions in rugby sevens players when regional
mass was expressed relative to DXA-derived whole-body mass (Figure 8.2A). Rugby union
forwards had higher proportional mass in the arms compared with backs (small standardised
differences), but unclear differences in other regions (Figure 8.2B). Players in both squads
carried the largest proportion of their mass in the trunk, followed by the legs and arms.
P ro p o rt io n o f
to ta l D X A -d e r iv e d
b o d y m a s s (% )
0
5
1 0
1 5
2 0
4 0
4 5
5 0
F o rw a rd s
B a c k s
(A ) R u g b y S e v e n s
P ro p o rt io n o f
to ta l D X A -d e r iv e d
b o d y m a s s (% )
Left A
rm
Rig
ht A
rm
Left L
eg
Rig
ht Leg
Tru
nk
0
5
1 0
1 5
2 0
4 0
4 5
5 0
F o rw a rd s
B a c k s
(B ) R u g b y U n io n
* *
Figure 8.2. Regional mass of rugby sevens (A) and rugby union (B) backs and forwards
as a proportion of DXA-derived whole-body mass (mean + SD). *Greater relative
regional mass in forwards than backs (small standardised difference).
Distribution of Tissue
Two principal components were considered to be meaningful for each tissue distribution,
collectively explaining 72 to 96% of the variance in distribution (Table 8.3). The first
principal component of fat accounted for 74% of the variance in regional mass distribution in
Chapter 8 – Distribution of Fat, Non-osseous Lean and Bone Mineral Mass in International Rugby Union and
Rugby Sevens Players
133
all players. The first component of fat distribution characterised a trunk-extremity contrast,
representing a continuum from total fat deposition at the trunk to total deposition at the limbs,
through a high negative loading of the trunk (-0.98) and high positive loading of the arms
(left 0.81, right 0.83) and legs (left 0.82, right 0.84) (Table 8.3). The second fat component
accounted for 22% of the distribution variance and identified a lower limb-upper limb
contrast. The first non-osseous lean tissue component characterised a trunk-upper limb
contrast, while the second component demonstrated an upper body-lower body contrast. The
first bone mineral mass component contrasted the trunk and legs with the arms, while the
second component characterised a trunk-extremity contrast.
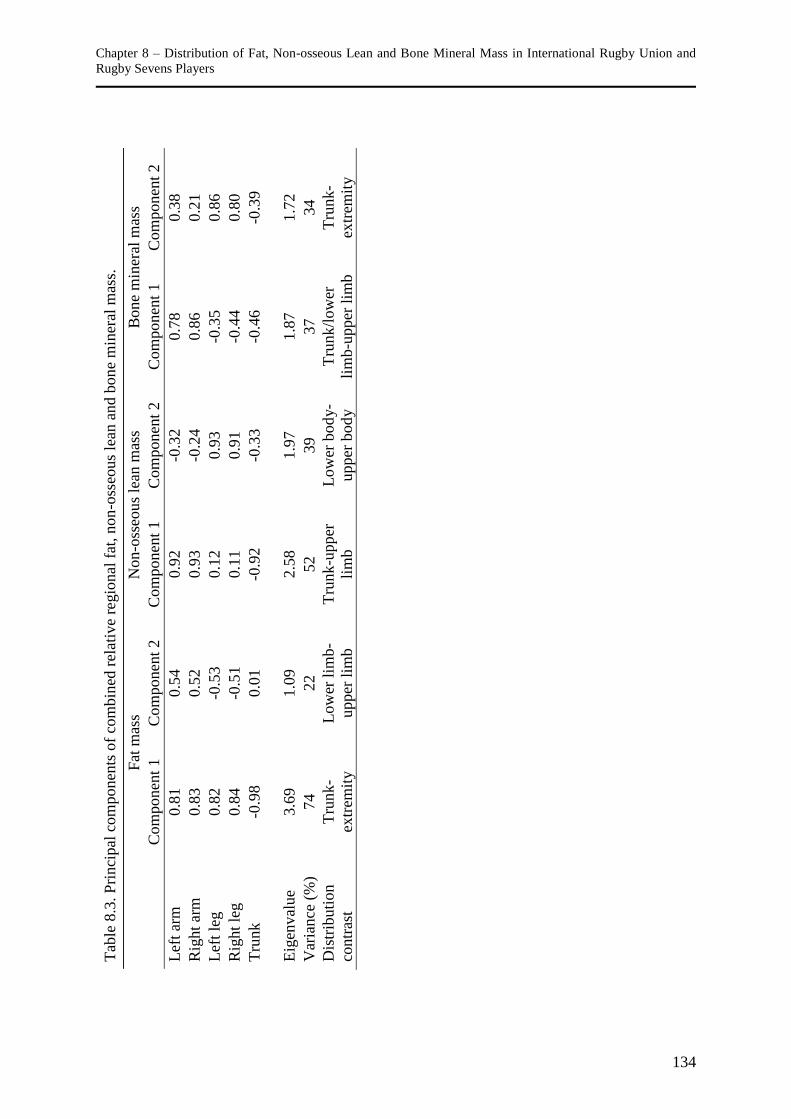
Chapter 8 – Distribution of Fat, Non-osseous Lean and Bone Mineral Mass in International Rugby Union and
Rugby Sevens Players
134
Tab
le 8
.3. P
rinci
pal
com
ponen
ts o
f co
mbin
ed r
elat
ive
regio
nal
fat
, non
-oss
eous
lean
and b
on
e m
iner
al m
ass.
F
at m
ass
Non-o
sseo
us
lean
mas
s B
one
min
eral
mas
s
C
om
ponen
t 1
C
om
ponen
t 2
C
om
ponen
t 1
C
om
ponen
t 2
C
om
ponen
t 1
C
om
ponen
t 2
Lef
t ar
m
0.8
1
0.5
4
0.9
2
-0.3
2
0.7
8
0.3
8
Rig
ht
arm
0.8
3
0.5
2
0.9
3
-0.2
4
0.8
6
0.2
1
Lef
t le
g
0.8
2
-0.5
3
0.1
2
0.9
3
-0.3
5
0.8
6
Rig
ht
leg
0.8
4
-0.5
1
0.1
1
0.9
1
-0.4
4
0.8
0
Tru
nk
-0.9
8
0.0
1
-0.9
2
-0.3
3
-0.4
6
-0.3
9
E
igen
val
ue
3.6
9
1.0
9
2.5
8
1.9
7
1.8
7
1.7
2
Var
iance
(%
) 74
22
52
39
37
34
Dis
trib
uti
on
contr
ast
Tru
nk
-
extr
emit
y
Low
er l
imb
-
upper
lim
b
Tru
nk
-upper
lim
b
Low
er b
od
y-
upper
bod
y
Tru
nk/l
ow
er
lim
b-u
pper
lim
b
Tru
nk
-
extr
emit
y
Chapter 8 – Distribution of Fat, Non-osseous Lean and Bone Mineral Mass in International Rugby Union and
Rugby Sevens Players
135
There was substantial variation in principal component scores by squad and positional group
for fat (Figure 8.3A), non-osseous lean (Figure 8.3B) and bone mineral (Figure 8.3C) mass.
Substantial differences between rugby union and rugby sevens players were observed for
both fat components (first component very large standardised difference; second component
small difference), both non-osseous lean components (first component very large difference;
second component small difference) and the first bone mineral component (moderate
difference). In other words, compared with rugby union players, rugby sevens players had
greater fat deposition in the trunk than limbs and in the lower rather than upper limbs, stored
greater lean soft-tissue mass in the arms than trunk, and stored more bone mineral mass in
their trunk and legs than arms.
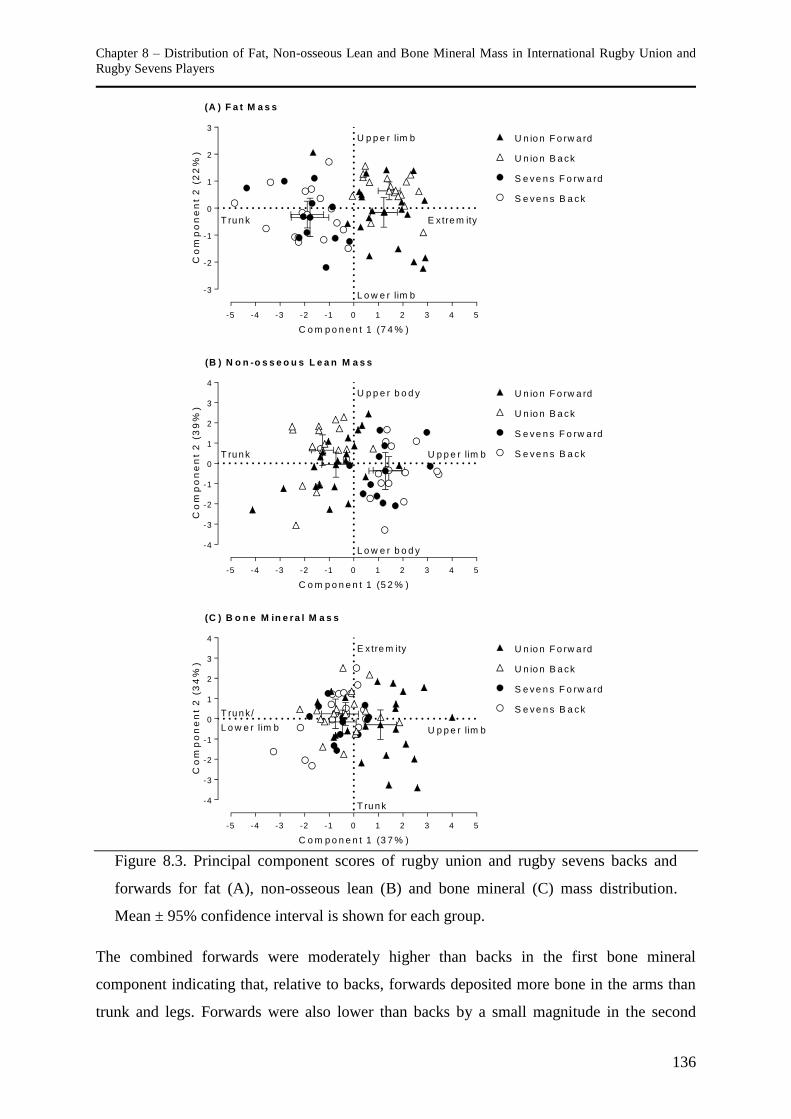
Chapter 8 – Distribution of Fat, Non-osseous Lean and Bone Mineral Mass in International Rugby Union and
Rugby Sevens Players
136
C o m p o n e n t 1 (7 4 % )
Co
mp
on
en
t 2
(2
2%
)
-5 -4 -3 -2 -1 0 1 2 3 4 5
-3
-2
-1
0
1
2
3
U n io n F o rw a rd
U n io n B a ck
S e v e n s F o rw a rd
S e v e n s B a c k
E x tre m ityT ru n k
U p p e r lim b
L o w e r lim b
(A ) F a t M a s s
C o m p o n e n t 1 (5 2 % )
Co
mp
on
en
t 2
(3
9%
)
-5 -4 -3 -2 -1 0 1 2 3 4 5
-4
-3
-2
-1
0
1
2
3
4
U n io n F o rw a rd
U n io n B a ck
S e v e n s F o rw a rd
S e v e n s B a c kU p p e r lim bT ru n k
U p p e r b o d y
L o w e r b o d y
(B ) N o n -o s s e o u s L e a n M a s s
T ru n k /
L o w e r lim b
C o m p o n e n t 1 (3 7 % )
Co
mp
on
en
t 2
(3
4%
)
-5 -4 -3 -2 -1 0 1 2 3 4 5
-4
-3
-2
-1
0
1
2
3
4
U n io n F o rw a rd
U n io n B a ck
S e v e n s F o rw a rd
S e v e n s B a c k
U p p e r lim b
E x tre m ity
T ru n k
(C ) B o n e M in e r a l M a s s
Figure 8.3. Principal component scores of rugby union and rugby sevens backs and
forwards for fat (A), non-osseous lean (B) and bone mineral (C) mass distribution.
Mean ± 95% confidence interval is shown for each group.
The combined forwards were moderately higher than backs in the first bone mineral
component indicating that, relative to backs, forwards deposited more bone in the arms than
trunk and legs. Forwards were also lower than backs by a small magnitude in the second
Chapter 8 – Distribution of Fat, Non-osseous Lean and Bone Mineral Mass in International Rugby Union and
Rugby Sevens Players
137
components of fat and bone mineral mass, indicating that, relative to backs, forwards
deposited more fat in the legs than arms and more bone in the trunk than limbs. Positional
group differences were unclear for non-osseous lean mass distribution.
Compared with all other players, rugby union backs carried relatively more fat in the arms
than legs (Figure 8.3A; moderate differences with other groups) and greater lean soft tissue in
the trunk than arms (Figure 8.3B; small to very large differences). In contrast, rugby union
forwards deposited relatively greater bone mineral mass in the arms than trunk and legs
compared with all other players (Figure 8.3C; moderate to large differences). Rugby union
forwards also had more non-osseous lean mass in the trunk than arms compared with rugby
sevens players (large differences), but less than rugby union backs (small difference) (Figure
8.3B).
Discussion
Knowledge of the body size and composition characteristics of elite-level rugby players is
important for monitoring adaptations to training and diet, as well as informing the selection
of players in apposite positions and/or rugby formats. This is the first study to compare the
regional composition and distribution of mass between backs and forwards in international-
level rugby union and rugby sevens. The findings offer insight into the quantity and
distribution of tissue mass of internationally-competitive players in regard to playing position
and game format. Given the international standard of the players in this study, the results
provide reference values useful for talent identification and transfer purposes. Forwards are
characterised by a higher whole-body mass, as well as greater fat, lean and bone mass
compared with backs, although to a lesser extent in rugby sevens. In addition, the anatomical
distribution of tissue varies between positional groups and rugby formats.
Positional Group Differences in Tissue Mass
Forwards have a greater body mass than backs in both rugby union and rugby sevens, which
is not surprising given differences in positional roles during competition. The primary
objective of forwards is to contest possession in set-piece plays as well as rucks and mauls,
while backs use possession to gain territory and score points. Whole-body mass differences
between positions derive from forwards having more adipose, non-osseous lean and bone
tissue. Although the positional group differences are consistent between rugby union and
rugby sevens, the magnitude of difference between forwards and backs was greater in union
players. Smaller positional group differences in rugby sevens players in absolute tissue
Chapter 8 – Distribution of Fat, Non-osseous Lean and Bone Mineral Mass in International Rugby Union and
Rugby Sevens Players
138
masses are consistent with previous findings of relatively uniform anthropometric,
physiological and performance characteristics [133].
Linear momentum is the product of mass and velocity. When other attributes remain
constant, a higher body mass produces a higher momentum regardless of the type of tissue of
the additional mass. Greater momentum is beneficial during contests for the ball and when
effecting or breaking a tackle. However, applying Newton’s second law of motion (F = m·a)
suggests that additional mass (m) in the form of non-functional adipose tissue will be
detrimental to a player’s ability to accelerate (a) without a corresponding increase in the
muscle force (F) applied. Despite this, there has been a progressive increase in the body mass
of rugby players of all positions in recent decades as players attempt to gain a physical
advantage over opponents [193,205,228]. Increasing whole-body mass through excess energy
intake alone typically results in greater proportional gains in fat than fat-free mass [162], as
optimising muscle hypertrophy is a multifactorial process [225]. The comparative complexity
of increasing lean rather than fat mass may partially explain the higher absolute and relative
fat mass in rugby union forwards compared with backs in the same squad.
Forwards in rugby union sprint less [13,84,220] and have more contacts [256] than backs
during competition. It is likely an increase in fat mass has less of an effect on the movement
profile of a forward compared with a back. However, given the higher requirements for speed
and endurance [132] and smaller differences in the activity profiles of forwards and backs in
rugby sevens competition [134], the greater homogeneity of regional tissue mass proportions
observed in this study was not unexpected. Although positional differences in rugby sevens
players were unclear when tissue mass was expressed as a proportion of total regional mass,
differences between backs and forwards followed the trends observed in the rugby union
players. In other words, forwards tended to have slightly greater relative fat mass, lower
relative non-osseous lean mass and similar or lower relative bone mineral mass than backs
across all regions. The greater fat mass in forwards may attenuate the high forces transferred
during contact [26]. Despite the purported role of fat mass as a physical buffer, there is little
evidence the quantity or distribution of adipose tissue offers such protection [201].
Longitudinal research utilising large numbers of players of different positions is needed to
elucidate relationships between physique characteristics and risk of injury.
A compromise between a player’s size and mobility may be necessary for fully meeting the
position-specific demands of training and competition. The ideal physique characteristics
Chapter 8 – Distribution of Fat, Non-osseous Lean and Bone Mineral Mass in International Rugby Union and
Rugby Sevens Players
139
most likely to positively influence locomotion and movement patterns typical of rugby
competition, including the translation of force during contact, require further investigation.
Although the technical skill components of rugby-specific tasks must be acknowledged,
additional research is needed to examine associations between the quantity and distribution of
tissue in rugby players and functional measures, such as power, agility, running speed and
scrummaging force.
Distribution of Mass
Quantifying the regional distribution of mass may be useful in highlighting priorities for
physical player development. The combined mass of the legs expressed as a proportion of
whole-body DXA-derived mass of players in this study (~35 to 36%) was similar to lower-
level rugby union players and their recreationally-active controls matched for body mass
index (~35%) [27], but less than U.S. Army Rangers candidates (~39%) [190]. Trunk mass
comprised ~45% of whole-body DXA mass, which was greater than U.S. Army Rangers
candidates (~43%) [190], but less than lower-level rugby union players and controls (~48%)
[27]. Combined arm mass accounted for ~13 to 14% of DXA-derived mass, higher than both
U.S. Army Rangers candidates (~12%) [190] and lower-level rugby union players (~12%)
[27]. The arms are important for many rugby-specific skills. With the exception of passing,
many of these skills relate to contact situations, such as fending, lifting, tackling, grappling
and turning opposition players, and binding during scrums, rucks and mauls. The relatively
high proportional arm mass in international-level players indicates the importance of
supporting these skills by increasing arm mass, primarily through the development of lean
tissue. Rugby union forwards had a greater proportion of total mass in the arms compared
with rugby union backs, again highlighting the importance of mass in the upper limbs for
contact-related skills.
The lower body of rugby players contributes to performance through power produced during
skills such as rucking, mauling, scrummaging, jumping during line-outs, and running. The
trunk is also an important constituent of a player’s physique, creating a stable framework for
generating and transferring force during contact [179]. It is apparent that a strong trunk and
legs are essential constituents in optimising a player’s performance. The trunk contains a high
proportion of non-osseous lean mass from organs, whereas the soft-tissue lean mass of limbs
is composed almost entirely of skeletal muscle tissue. Although non-osseous lean tissue is not
a substitute for muscle tissue, a higher proportional lean mass is likely to improve a player’s
ability to produce force and power. Given variations in competition demands, the optimal
Chapter 8 – Distribution of Fat, Non-osseous Lean and Bone Mineral Mass in International Rugby Union and
Rugby Sevens Players
140
total mass and ratio of regional lean and fat mass differ substantially between positions and
between rugby union and rugby sevens. Specialised training and dietary interventions may be
necessary for optimising a player’s physique specific to their position and game format.
Distribution of Fat
The first principal component of fat distribution characterised a trunk-extremity contrast,
consistent with previous observations in athletes and non-athletes [23,169,183]. This pattern
of fat deposition is consistent across ethnic groups and reflects a masculine characteristic
associated with sex-hormone levels [23]. Explanations for substantial differences in fat
distribution between rugby union and rugby sevens players regardless of position, and a small
difference between forwards and backs in lower limb-upper limb fat distribution regardless of
squad, require further study. Although sport participation and specialised training for
competition have a larger effect on absolute body-fat levels than fat distribution [169], other
lifestyle and biological factors may influence differences in fat deposition. For example,
testosterone is an important regulator of the distribution of central and peripheral adipose
tissue in men [34]. Anatomical fat distribution is also influenced by ethnicity [23,169]. Eight
players in each squad (backs and forwards) were of Polynesian, Melanesian or Aboriginal
Australian ethnicity. Although the distribution of tissue mass appears to be largely biological
with relatively little influence of competing in sport, the interaction of genetic and
environmental factors influencing tissue distribution requires further examination.
Distribution of Non-osseous Lean Mass
Magnitudes of difference between the squads in non-osseous lean mass distribution were
concordant with differences in fat distribution. Rugby union backs and forwards had trunk-
upper limb distribution contrasts that were not only distinct from rugby sevens players, but
also each other. However, differences in distribution between backs and forwards regardless
of the rugby format they played were unclear. A previous study of non-osseous lean tissue
distribution in lower-level rugby union players concluded that the arms and legs contribute
equally to playing performance based on similar principal component loadings at these sites
[27]. Our investigation of international-level players produced different results, showing a
primary trunk-arm contrast explaining 52% of variance in distribution. The legs had a high
positive loading in the second non-osseous lean mass component, but as with fat and bone
mass, the second component scores were closer to zero than the first component in all groups,
indicating less contrast between the lower and upper body. The observed distribution patterns
highlight the importance of lean mass development in the upper body for top-level players.
Chapter 8 – Distribution of Fat, Non-osseous Lean and Bone Mineral Mass in International Rugby Union and
Rugby Sevens Players
141
Distribution of Bone Mineral Mass
The two components of bone mineral mass explained a similar proportion of the variance in
distribution. Differences between squads and between positional groups in the first
component were moderate. However, a small difference was present between backs and
forwards in the second component regardless of their squad, while the difference between
rugby sevens and rugby union was unclear. The distribution of bone mineral mass was
distinct for rugby union forwards by their propensity to store a greater proportion of mass in
the arms than all other groups. Enhanced appendicular skeletal mass accretion in the arms of
rugby union forwards is likely the result of adaptation to bone deformations due to vibration
and strain induced by muscle contractions and a high frequency of impacts [87,90]. The
higher body mass and frequency of engagement of forwards in contact situations, including
pushing in scrums and jumping and supporting in line-outs, increase the osteogenic
mechanical stimuli compared with backs. As with the other tissues, higher bone mineral mass
in forwards than backs may be explained by the combination of selection of playing position
based on genetic predisposition and adaptation to the specific role requirements of
competition.
Conclusion
While forwards have a greater quantity of fat, lean and bone mass than backs in both rugby
union and rugby sevens, the magnitude of difference between the positional groups is greater
in rugby union players. These differences likely represent variation in the physical demands
of competition between positional groups in each rugby format. When regional tissue mass is
expressed as a proportion of total regional mass, positional group differences persist in rugby
union players, but become predominantly unclear in rugby sevens players. It appears the
advantage of higher body mass gained through an increase in absolute fat mass and
proportional decrease in non-osseous lean mass in international rugby union forwards is
greater than any potential detriment to physical performance and work capacity. Achieving
the ideal ratio of fat and lean mass in each anatomical region should contribute to optimal
physical performance. The most effective absolute and relative tissue masses vary between
rugby formats, positions and individuals. Competing at the international level in rugby union
or rugby sevens characterises the distribution of fat and non-osseous lean mass to a greater
extent than a player’s positional group. However, the distribution of bone mineral mass is
associated more with a player’s position than the rugby format in which they compete.
Chapter 9 – Comparison of Activity Profiles and Physiological Demands between International Rugby Sevens
Matches and Training
142
Chapter Nine - Comparison of Activity Profiles and
Physiological Demands between International Rugby
Sevens Matches and Training
Higham, D.G., Pyne, D.B., Anson, J.M., Hopkins, W.G., & Eddy, A. (2013). Comparison of
activity profiles and physiological demands between international rugby sevens matches and
training. Journal of Strength and Conditioning Research. (in press).
Abstract
The specificity of contemporary training practices of international rugby sevens players is
unknown. We quantified the positional group-specific activity profiles and physiological
demands of on-field training activities and compared these to match demands. Twenty-two
international matches and 63 rugby-specific training drills were monitored in 25 backs and 17
forwards from a national squad of male rugby sevens players over a 21-month period. Drills
were classified into three categories: low-intensity skill-refining (n = 23 drills, 560
observations), moderate- to high-intensity skill-refining (n = 28 drills, 600 observations), and
game-simulation (n = 12 drills, 365 observations). Movement patterns (via GPS devices) and
physiological load (via heart rate monitors) were recorded for all activities and differences
between training and matches quantified using magnitude-based inferential statistics.
Distance covered in total and at ≥3.5 m·s-1
, maximal velocity, and frequency of accelerations
and decelerations were lower in forwards during competition compared with backs by a small
but practically important magnitude. No clear positional group differences were observed for
physiological load during matches. Training demands exceeded match demands only for
frequency of decelerations of forwards during moderate- to high-intensity skill-refining drills
and only by a small amount. Accelerations and distance covered at ≥6 m·s-1
were closer to
match values for forwards than backs during all training activities, but training drills
consistently fell below the demands of international competition. Coaches could therefore
improve physical and physiological specificity by increasing the movement demands and
intensity of training drills.
Key words: Global Positioning System, GPS, rugby union, time-motion analysis, physical
preparation, specificity
Chapter 9 – Comparison of Activity Profiles and Physiological Demands between International Rugby Sevens
Matches and Training
143
Introduction
Success in rugby union and the abbreviated rugby sevens format requires a high degree of
skill, tactics and physical ability. The efficacy of practice and training interventions on
factors related to rugby performance is well established [4,110,126,138]. However, the
physical and physiological demands and specificity of individual training drills are largely
unknown. Training drills are often designed with a specific learning or adaptation objective,
such as strength and conditioning, skill development, tactical team play, or a combination
thereof. Match-specific drills simulating game scenarios are designed to prepare players for
the physiological, skill, and decision-making demands of competition. The development of
all facets of performance including skill, decision-making, fitness, and team structures
warrant dedicated training time. An overemphasis on training these facets in isolation could
limit the opportunities for match-specific drills that purportedly replicate physical and tactical
competition demands using appropriate work-to-rest ratios. Despite the ostensible advantages
of match-specific training, it is unrealistic and potentially undesirable for training to
consistently reproduce match loads [70]. The positive relationship between on-field training
loads and injury rates observed in professional contact team sports highlights the need to
minimise the risks to players’ health and performance without compromising training
adaptations [105].
The capability to define and monitor the demands of training and competition in team sports
has improved as a result of measurement techniques such as Global Positioning System
(GPS) technology [103,200]. Portable micro-technology worn by players now allows for
heart rate, physical impacts, distance and velocity to be quantified without interference to the
training and match environment [12]. Comparisons of training and competition demands have
been examined in several team sports, including field hockey [103], volleyball [101], soccer
[107], cricket [200], rugby league [106] and Australian football [70]. Research comparing the
demands of training and matches in rugby union is limited to a single study of adolescent
players [128]. The demands of competition and requirements for physical development in
international rugby sevens are unique [132,133], yet the effectiveness and specificity of
training of rugby sevens players remain unclear. An investigation of contemporary training
practices is required to assist development of approaches that consider the duration, volume,
intensity and frequency of training relative to the athlete’s needs and phase of the season.
Understanding the activity profile and demands of various training drills, and quantifying the
disparity between training and match demands, provide a useful scientific framework for
Chapter 9 – Comparison of Activity Profiles and Physiological Demands between International Rugby Sevens
Matches and Training
144
coaches to prescribe periodised training programmes. Therefore, the purpose of this study
was to quantify the positional group-specific (backs and forwards) activity profile and
physiological demands of different types of rugby sevens training activities and compare
them with the demands of competition.
Methods
Experimental Approach to the Problem
A prospective, longitudinal, observational study was conducted to characterise the physical
and physiological demands of training activities of a national rugby sevens team. Team
members had their movement patterns and heart rate recorded throughout various drills
during on-field training sessions. The demands of training activities were then compared with
the demands of a sample of international-level matches played by the same players during the
data collection period.
Participants
Forty-two male rugby sevens players from a national team that competes as a core (top 15)
team in the International Rugby Board (IRB) Sevens World Series provided written informed
consent and volunteered to participate in the study. Players were classified as either forwards
(n = 17, age 21.6 ± 2.4 years, height 1.85 ± 0.05 m, body mass 95.8 ± 6.7 kg; mean ± SD at
the start of data collection) or backs (n = 25, age 21.0 ± 2.2 years, height 1.81 ± 0.06 m, body
mass 86.2 ± 5.6 kg) based on their primary playing position. Results are only reported for
players free of injury and illness during match and training activities. The study was
approved by the University of Canberra Committee for Ethics in Human Research and
Australian Institute of Sport Ethics Committee.
Procedures
Sixty-three on-field training sessions were monitored over a 21-month period. Data were
collected on 63 training drills. Drills were classified by the coaches and team physiologist
into one of three types of training activity based on the primary purpose and perceived
physical intensity of the drill: low-intensity skill-refining (n = 560 observations during 23
drills), moderate- to high-intensity skill-refining (n = 600 observations during 28 drills), and
game-simulation (n = 365 observations during 12 drills). Skill-refining drills aimed to
improve technical aspects of match play, such as tackling and rucking technique, defensive
line shape and speed, set-piece play, and passing and catching ability. Game-simulation drills
Chapter 9 – Comparison of Activity Profiles and Physiological Demands between International Rugby Sevens
Matches and Training
145
were designed to practice skills and tactical aspects of play under match-like conditions. The
study was delimited to rugby-specific training activities with the ball. Therefore, conditioning
drills and warm-up activities were excluded from analyses. Training activities were compared
with data from 22 matches collected on the same group of players during four international
tournaments (IRB Sevens World Series and Federation of Oceania Rugby Unions Oceania
Sevens Championship) played during the data collection period (n = 306 observations). Any
training or match observation with a duration <1 min was excluded from analysis. Matches
were split by each half, and the half-time interval and any time a player spent off the field
were excluded. Each match half, or part thereof, was treated as a single observation.
Although differences in the movement patterns between first and second halves, matches
within a tournament, and full-match and substitute players are evident and acknowledged
[132], match activities and demands were characterised by the mean of all observed
competition data.
Activity profiles were assessed during training and matches by fitting players with a portable
GPS device sampling at 15 Hz (SPI Pro X, GPSports Systems, Canberra, Australia). The
validity and reliability of GPS micro-technology for monitoring sports performance have
been reviewed previously [65]. Physiological demands were assessed during selected training
activities by fitting players with a heart rate transmitter strap (T34, Polar Electro Oy,
Kempele, Finland). Heart rate data were recorded to the GPS device at 1 Hz. The GPS device
was positioned between the scapulae of each player using a vest worn underneath the training
or match attire. The unit was activated and satellite lock established for a minimum of 10 min
before the commencement of each session. All players were familiar with the data collection
procedure. After each session, recorded data were analysed using the manufacturer’s software
(Team AMS release 1 2011 revision 8, GPSports Systems, Canberra, Australia).
Activity profiles were quantified by the frequency of efforts and cumulative distance covered
in five velocity zones (0 to 2 m·s-1
, 2 to 3.5 m·s-1
, 3.5 to 5 m·s-1
, 5 to 6 m·s-1
and ≥6 m·s-1
)
[132]. Acceleration and deceleration characteristics were assessed by the frequency a player
performed an acceleration (≥1 m·s-2
) or deceleration (≤-1 m·s-2
) for a minimum duration of 1
s. The frequency and intensity (reported in gravitational (g)-force) of mechanical loading
(impacts) on players was recorded by a 100 Hz tri-axial accelerometer housed within the GPS
device. Given the questionable validity of accelerometers in quantifying the contact loads on
athletes [104], the total number of impacts measured at ≥5 g was measured instead of
categorising impact measurements by magnitude as has been reported previously [68]. A
Chapter 9 – Comparison of Activity Profiles and Physiological Demands between International Rugby Sevens
Matches and Training
146
magnitude of ≥5 g encompasses a range from a light impact characterised by a heavy foot-
strike during a rapid acceleration, deceleration, or change of direction to a severe collision
with opposition players [68].
Mean and peak heart rate measured during training drills and matches were recorded. Heart
rate data were categorised into five zones corresponding to the percentage of each player’s
maximum heart rate (HRmax) recorded during the Yo-Yo intermittent recovery level 1 test
[20], or an incremental running test on a motorised treadmill. Maximum heart rate values
were subsequently updated if the testing values were exceeded during training or a match.
The cumulative time in five heart rate zones was multiplied by a weighting factor (50 to 59%
HRmax = 1, 60 to 69% HRmax = 2, 70 to 79% HRmax = 3, 80 to 89% HRmax = 4, and ≥90%
HRmax = 5) to linearly scale the intensity of activity. The adjusted values were then summed
to indicate the cardiovascular load in arbitrary units [86]. An index describing the efficiency
of movement with respect to the relative internal load on the player, termed the performance
efficiency index and measured in arbitrary units, was calculated for each training drill and
match half as the relative distance covered (m·min-1
) per %HRmax [21].
Statistical Analyses
Most movement and heart rate variables were expressed per min of activity time to account
for variations in match and training duration. Descriptive statistics (mean ± SD) are reported
to characterise movement patterns and physiological load. Variability within players was
calculated as the mean of each player's SD, while differences between players in activity and
physiological load parameters were calculated as the SD of all observations. These SD were
expressed as coefficients of variation (percents of the overall means). Standardised
differences in the means of the various training activities and match demands for each
positional group were used to assess magnitudes of effect by dividing the differences by the
between-player SD. Magnitudes of standardised differences in means were assessed with the
following scale: 0 to 0.2 trivial, 0.2 to 0.6 small, 0.6 to 1.2 moderate, 1.2 to 2.0 large, 2.0 to
4.0 very large, and ≥4.0 extremely large [141]. To address the issue of quantification of
longitudinal changes in performance characteristics, the signal-to-noise ratio of each variable
for both positional groups during each activity was calculated as 0.2 × between-player
SD/within-player SD.
Precision of the estimate of the difference is shown with a confidence interval derived as the
appropriate percentiles of 3000 bootstrapped sample values. Bootstrapping was used because
Chapter 9 – Comparison of Activity Profiles and Physiological Demands between International Rugby Sevens
Matches and Training
147
a mixed linear model did not converge on a solution in less than a day for each variable. To
reduce the likelihood of errors about inferred magnitudes, 99% was chosen as the level for
the confidence intervals. A difference was reported as unclear when the confidence interval
of the standardised difference crossed the threshold for both substantially positive (0.2) and
negative (-0.2) values. Analyses were performed with the Statistical Analysis System
(version 9.2, SAS Institute, Cary, NC).
Results
Differences between Positional Groups
Backs recorded higher values than forwards during matches in most movement variables, but
there were unclear differences between positional groups in physiological demands
represented by heart rate parameters (Table 9.1). The difference in relative impacts between
groups was also unclear. The higher total relative distance covered by backs was due to the
small difference in the frequency of entries and relative distance covered in velocity zones
≥3.5 m·s-1
. The small difference in distance covered at a similar relative heart rate resulted in
a moderately higher performance efficiency index in backs than forwards. The within-player
coefficient of variation of movement and physiological measures ranged from 2.6% for peak
heart rate in forwards during matches to 210% for relative distance covered at ≥6 m·s-1
in
forwards during low-intensity skill-refining drills. The coefficient of variation for between-
player differences ranged from 3.2% for peak heart rate in forwards during matches to 280%
for relative distance covered at ≥6 m·s-1
during low-intensity skill-refining drills, also in
forwards. The signal-to-noise ratio ranged from 0.19 (that is, the noise was ~five-fold greater
than the signal) in the frequency of entries in the 3.5 to 5 m·s-1
velocity zone per min in
forwards during moderate- to high-intensity skill-refining drills to 0.43 in relative impacts
during matches in backs.
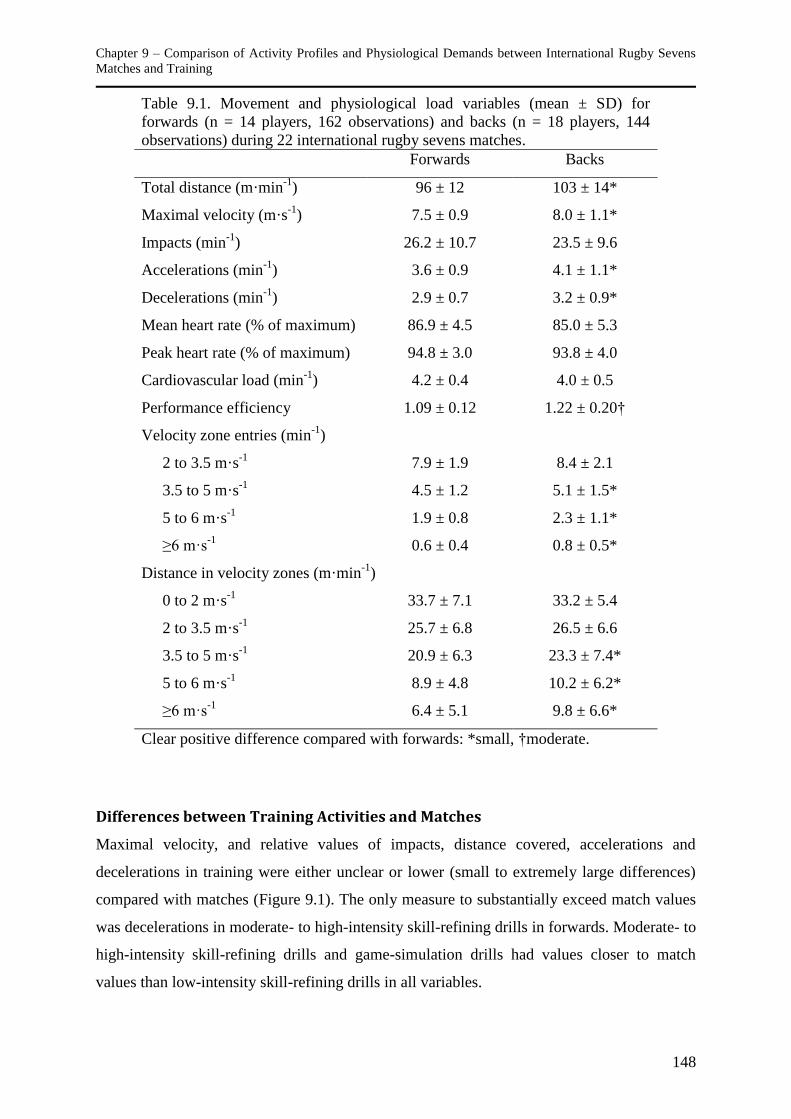
Chapter 9 – Comparison of Activity Profiles and Physiological Demands between International Rugby Sevens
Matches and Training
148
Table 9.1. Movement and physiological load variables (mean ± SD) for
forwards (n = 14 players, 162 observations) and backs (n = 18 players, 144
observations) during 22 international rugby sevens matches.
Forwards Backs
Total distance (m·min-1
) 96 ± 12 103 ± 14*
Maximal velocity (m·s-1
) 7.5 ± 0.9 8.0 ± 1.1*
Impacts (min-1
) 26.2 ± 10.7 23.5 ± 9.6
Accelerations (min-1
) 3.6 ± 0.9 4.1 ± 1.1*
Decelerations (min-1
) 2.9 ± 0.7 3.2 ± 0.9*
Mean heart rate (% of maximum) 86.9 ± 4.5 85.0 ± 5.3
Peak heart rate (% of maximum) 94.8 ± 3.0 93.8 ± 4.0
Cardiovascular load (min-1
) 4.2 ± 0.4 4.0 ± 0.5
Performance efficiency 1.09 ± 0.12 1.22 ± 0.20†
Velocity zone entries (min-1
)
2 to 3.5 m·s-1
7.9 ± 1.9 8.4 ± 2.1
3.5 to 5 m·s-1
4.5 ± 1.2 5.1 ± 1.5*
5 to 6 m·s-1
1.9 ± 0.8 2.3 ± 1.1*
≥6 m·s-1
0.6 ± 0.4 0.8 ± 0.5*
Distance in velocity zones (m·min-1
)
0 to 2 m·s-1
33.7 ± 7.1 33.2 ± 5.4
2 to 3.5 m·s-1
25.7 ± 6.8 26.5 ± 6.6
3.5 to 5 m·s-1
20.9 ± 6.3 23.3 ± 7.4*
5 to 6 m·s-1
8.9 ± 4.8 10.2 ± 6.2*
≥6 m·s-1
6.4 ± 5.1 9.8 ± 6.6*
Clear positive difference compared with forwards: *small, †moderate.
Differences between Training Activities and Matches
Maximal velocity, and relative values of impacts, distance covered, accelerations and
decelerations in training were either unclear or lower (small to extremely large differences)
compared with matches (Figure 9.1). The only measure to substantially exceed match values
was decelerations in moderate- to high-intensity skill-refining drills in forwards. Moderate- to
high-intensity skill-refining drills and game-simulation drills had values closer to match
values than low-intensity skill-refining drills in all variables.
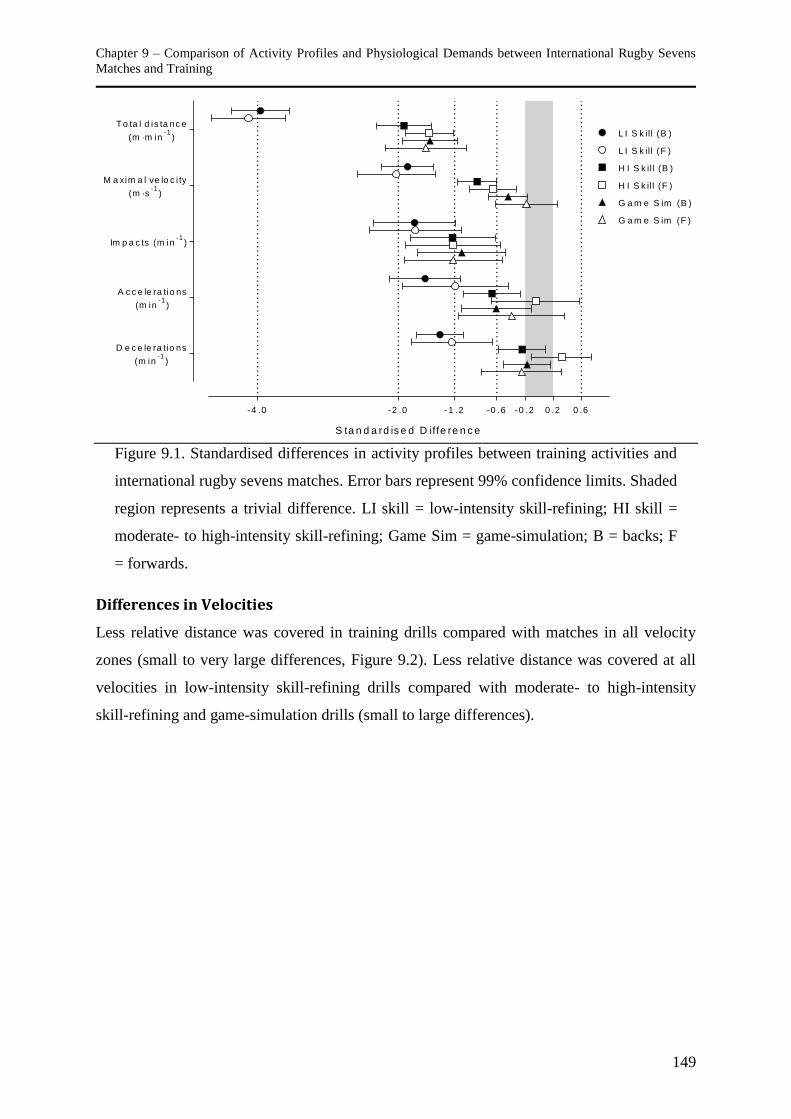
Chapter 9 – Comparison of Activity Profiles and Physiological Demands between International Rugby Sevens
Matches and Training
149
S ta n d a rd is e d D iffe re n c e
D e c e le ra tio ns
(m in-1
)
A c c e le ra tio ns
(m in-1
)
Im p a c ts (m in-1
)
M a xim a l ve lo c i ty
(m ·s-1
)
T o ta l d is ta nc e
(m ·m in-1
)
-4 .0 -2 .0 -1 .2 -0 .6 -0 .2 0 .2 0 .6
G a m e S im (F )
G a m e S im (B )
H I S k ill (F )
H I S k ill (B )
L I S k ill (F )
L I S k ill (B )
Figure 9.1. Standardised differences in activity profiles between training activities and
international rugby sevens matches. Error bars represent 99% confidence limits. Shaded
region represents a trivial difference. LI skill = low-intensity skill-refining; HI skill =
moderate- to high-intensity skill-refining; Game Sim = game-simulation; B = backs; F
= forwards.
Differences in Velocities
Less relative distance was covered in training drills compared with matches in all velocity
zones (small to very large differences, Figure 9.2). Less relative distance was covered at all
velocities in low-intensity skill-refining drills compared with moderate- to high-intensity
skill-refining and game-simulation drills (small to large differences).
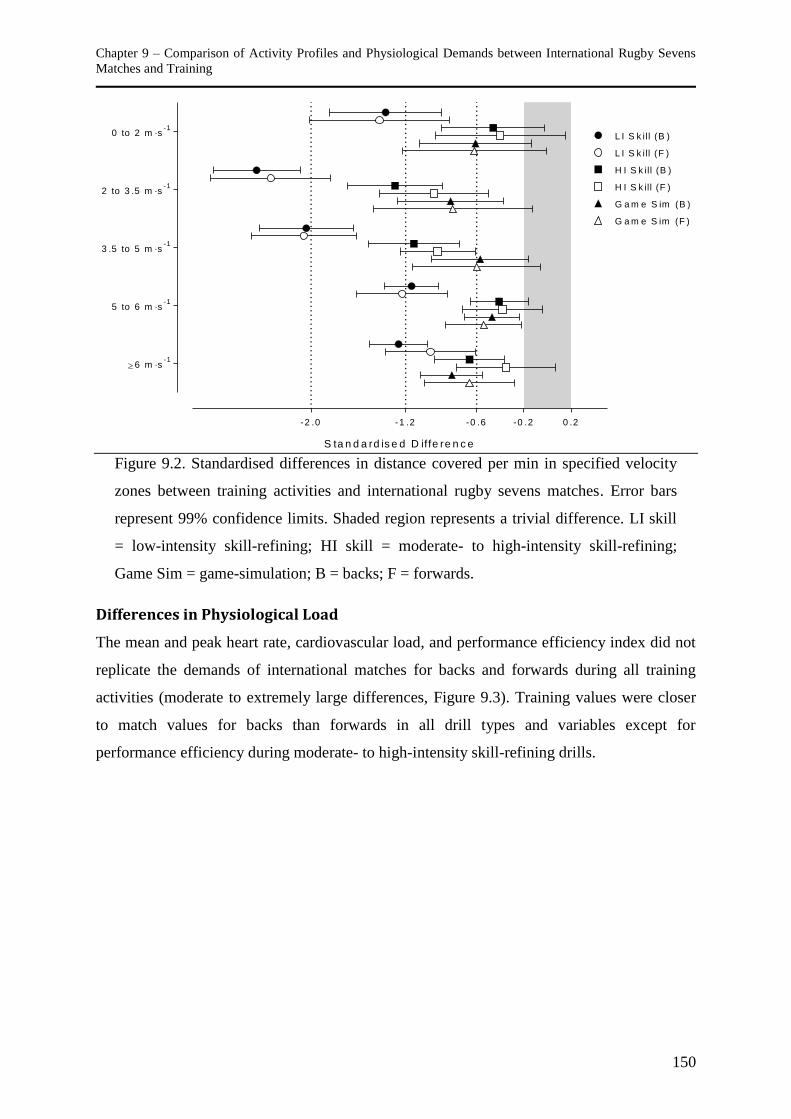
Chapter 9 – Comparison of Activity Profiles and Physiological Demands between International Rugby Sevens
Matches and Training
150
S ta n d a rd is e d D iffe re n c e
6 m ·s-1
5 to 6 m ·s-1
3 .5 to 5 m ·s-1
2 to 3 .5 m ·s-1
0 to 2 m ·s-1
-2 .0 -1 .2 -0 .6 -0 .2 0 .2
G a m e S im (F )
G a m e S im (B )
H I S k ill (F )
H I S k ill (B )
L I S k ill (F )
L I S k ill (B )
Figure 9.2. Standardised differences in distance covered per min in specified velocity
zones between training activities and international rugby sevens matches. Error bars
represent 99% confidence limits. Shaded region represents a trivial difference. LI skill
= low-intensity skill-refining; HI skill = moderate- to high-intensity skill-refining;
Game Sim = game-simulation; B = backs; F = forwards.
Differences in Physiological Load
The mean and peak heart rate, cardiovascular load, and performance efficiency index did not
replicate the demands of international matches for backs and forwards during all training
activities (moderate to extremely large differences, Figure 9.3). Training values were closer
to match values for backs than forwards in all drill types and variables except for
performance efficiency during moderate- to high-intensity skill-refining drills.
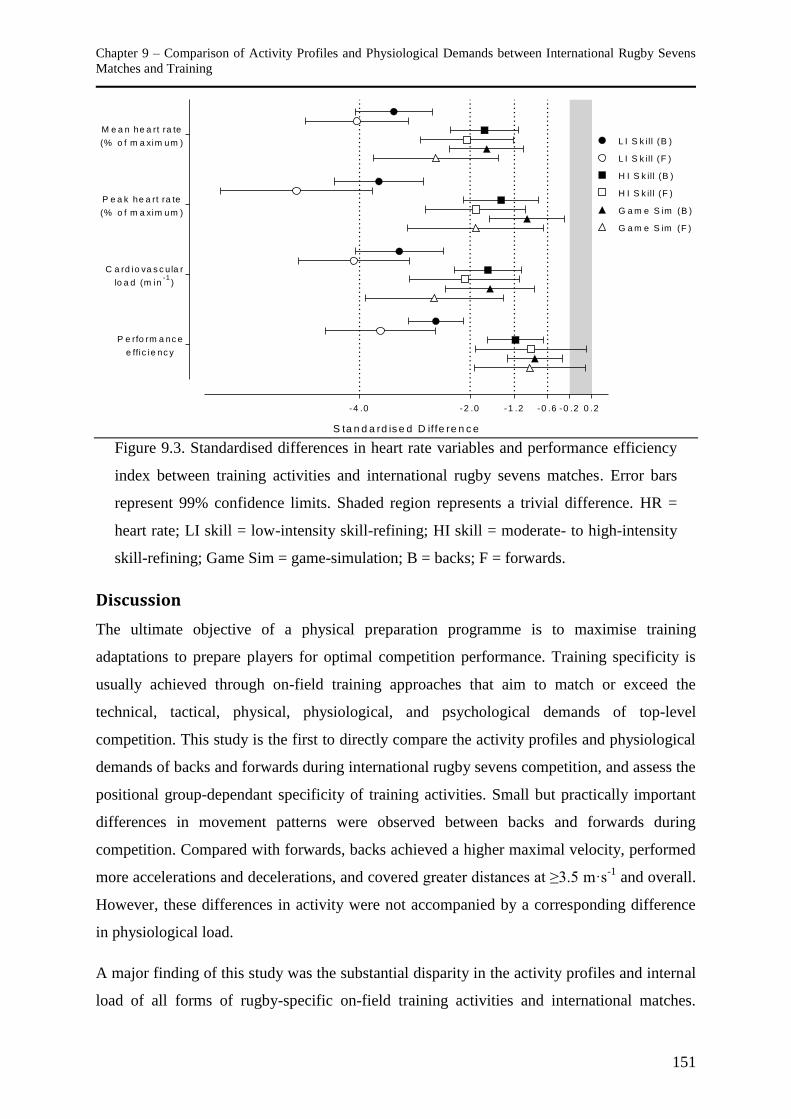
Chapter 9 – Comparison of Activity Profiles and Physiological Demands between International Rugby Sevens
Matches and Training
151
S ta n d a rd is e d D iffe re n c e
P e rfo rm a nc e
e ffic ie nc y
C a rd io va s c ula r
lo a d (m in-1
)
P e a k he a rt ra te
(% o f m a xim um )
M e a n he a rt ra te
(% o f m a xim um )
G a m e S im (F )
G a m e S im (B )
H I S k ill (F )
H I S k ill (B )
L I S k ill (F )
L I S k ill (B )
-4 .0 -2 .0 -1 .2 -0 .6 -0 .2 0 .2
Figure 9.3. Standardised differences in heart rate variables and performance efficiency
index between training activities and international rugby sevens matches. Error bars
represent 99% confidence limits. Shaded region represents a trivial difference. HR =
heart rate; LI skill = low-intensity skill-refining; HI skill = moderate- to high-intensity
skill-refining; Game Sim = game-simulation; B = backs; F = forwards.
Discussion
The ultimate objective of a physical preparation programme is to maximise training
adaptations to prepare players for optimal competition performance. Training specificity is
usually achieved through on-field training approaches that aim to match or exceed the
technical, tactical, physical, physiological, and psychological demands of top-level
competition. This study is the first to directly compare the activity profiles and physiological
demands of backs and forwards during international rugby sevens competition, and assess the
positional group-dependant specificity of training activities. Small but practically important
differences in movement patterns were observed between backs and forwards during
competition. Compared with forwards, backs achieved a higher maximal velocity, performed
more accelerations and decelerations, and covered greater distances at ≥3.5 m·s-1
and overall.
However, these differences in activity were not accompanied by a corresponding difference
in physiological load.
A major finding of this study was the substantial disparity in the activity profiles and internal
load of all forms of rugby-specific on-field training activities and international matches.
Chapter 9 – Comparison of Activity Profiles and Physiological Demands between International Rugby Sevens
Matches and Training
152
Relative to competition, training was characterised by less distance covered (large to
extremely large differences), similar or lower maximal velocities (unclear to very large
differences), less impacts (moderate to large differences), and similar or fewer accelerations
(unclear to large differences). There were also fewer decelerations in training compared with
matches for all training activities except for forwards during moderate- to high-intensity skill-
refining drills. Heart rate-based indicators of the physiological load of training activities were
lower than during matches. Marked differences between some training practices and
competition should be expected, given that consistently reproducing match demands during
training would oversimplify the complex multifaceted factors associated with development of
elite rugby players [81]. Even so, the findings of this study provide important information
that may be used to implement strategies that emphasise the specificity of movements and
conditioning stimuli during training.
Differences in activity profiles between backs and forwards during matches support the need
for position-specific training approaches. Position-specific training is likely to occur to some
extent as players typically train in the positions in which they will compete. Positional
differences in the total distance covered and the distance travelled at high velocity during
competition are consistent with similar observations in 15-player professional rugby union
competition [13,54,68,220]. Although the specificity of movement pattern parameters varied
between positional groups in training, the physiological load of forwards during training was
consistently lower relative to matches compared with backs. It is uncertain whether the higher
values of movement variables for backs compared with forwards during international
competition reflect greater demands related to differences in positional roles, higher fitness
levels of backs, or a combination of these factors. The unclear differences during matches in
the physiological load and distance covered at lower velocity (<3.5 m·s-1
) between backs and
forwards imply lower match-specific fitness of forwards may be an explanation for positional
variations in activity profiles. Indeed, backs performed marginally better than forwards in the
Yo-Yo intermittent recovery level 1 test (2202 ± 288 vs. 2093 ± 389 m; mean ± SD), a
measure of team sport-specific endurance [20].
Despite a lower cardiovascular load, accelerations and distance covered at ≥6 m·s-1
were
closer to match values for forwards than backs during all training activities. The same trend
was observed for maximal velocity during all training activities except low-intensity skill-
refining drills. The variation in maximal velocity achieved in low-intensity skill-refining
drills may be explained by training drills devoted to set-piece plays with minimal
Chapter 9 – Comparison of Activity Profiles and Physiological Demands between International Rugby Sevens
Matches and Training
153
involvement from backline players. Technical drills practicing scrums and line-outs typically
involve little to no maximal sprinting.
The acceleration and deceleration of a player’s body mass increases the mechanical load and
metabolic cost of exercise compared with running the same distance at a constant velocity
[142,196]. Disregarding the frequent changes in running velocity likely underestimates the
true quantity of high-intensity activity of team sport athletes [166]. Frequency of
decelerations of forwards during moderate- to high-intensity skill-refining drills was the only
measure to substantially exceed match demands. Similarly, physical impacts, either through
contact with the ground or other players, increase the mechanical load on players,
concomitantly increasing the time required for recovery from muscle damage and soreness
[111,245,251]. The lower frequency of impacts of ≥5 g in training reflects the combination of
reduced high-velocity running volumes that result in a forceful foot-strike and limited
exposure to “full contact” drills, which increase recovery requirements and potential for
injury [41].
The analysis of training specificity in this study excluded only the periods between training
drills for drinks breaks, and time allocated for drills to be set up and explained. At least part
of the reduced activity and physiological demands of training compared with competition
may be explained by the intermittent breaks in activity within a drill for coaching feedback
and instruction. We chose to include these breaks within drills in our analyses to reflect the
actual physical and physiological demands experienced by players. The other factor that may
contribute to the lower physical and physiological load of training is the use of “closed”
drills, whereby technical development is emphasised through high repetition of skill
executions typically without a decision making component. Closed drills may permit
additional recovery time between activity periods while players wait for their turn to perform
a task. In contrast, “open” drills simulating match-like conditions are more physically and
cognitively demanding [92].
The planning of training programmes for international rugby sevens players is influenced by
a multitude of factors, including the phase of season and proximity of training to competition;
ground firmness and environmental conditions; effects of interstate and international travel;
perceived intensity of previous and upcoming competitions; and team and individual
considerations, such as fitness and form [70]. Despite the importance of these and other
considerations, match-specific drills should aim to replicate or exceed match demands to best
Chapter 9 – Comparison of Activity Profiles and Physiological Demands between International Rugby Sevens
Matches and Training
154
prepare players for the requirements of competition [70]. The game-simulation drills
observed in this study failed to reproduce the physical or physiological demands of matches.
The low specificity of skill-refining drills may be expected, given their lack of explicit
emphasis on conditioning. Unsurprisingly, of the three training activities, low-intensity skill-
refining drills were least reflective of match conditions in every variable measured.
Subsequent analyses of the standardised differences between training activities with respect
to positional groups showed low-intensity skill-refining drills were substantially lower than
moderate- to high-intensity skill-refining and game-simulation drills for all variables (results
not shown). In contrast, differences between moderate- to high-intensity skill-refining and
game-simulation drills were smaller and more variable. Small standardised differences were
observed for some variables, although most comparisons showed unclear to trivial differences
(results not shown). Differences in these training activities may be better reflected by
quantifying the technical and tactical requirements of training drills rather than the physical
and physiological demands alone.
Investigation of the frequency and quality of technical components of match-play, such as
passes, tackles, kicks, set-piece plays, and decision-making ability, was not within the scope
of the current investigation. Future research should investigate the specificity of the technical
and tactical components of rugby sevens training and examine strategies that maximise skill
learning. It is possible there is a compromise between the training time required for optimal
physical and technical development in international rugby sevens players. However, given
the potential impact of fatigue on the execution of physical and cognitive skills [102,220],
training outcomes may be enhanced by the practice of skills under conditions that simulate
the high-intensity activity of competition. The optimal balance and timing of instructional
skills training and match-specific drills, either in isolation or combination, to maximise the
physical and technical development of rugby sevens players also requires further research.
The lower intensity of training may lead to sub-optimal or inappropriate adaptation of the
metabolic pathways utilised during competition. The lower internal load of training, as
indicated by heart rate-based measures, is likely to result in a greater emphasis on the aerobic
system. International rugby sevens players require well-developed aerobic endurance to
tolerate the demands of competition and facilitate rapid recovery within and between matches
[133]. However, the development of anaerobic systems to support short-duration, high-
intensity activity, such as sprinting, should not be neglected. The ability to quickly recover
from and repeat performances of high-intensity activity is important in team-sport
Chapter 9 – Comparison of Activity Profiles and Physiological Demands between International Rugby Sevens
Matches and Training
155
competitions [112], especially in rugby sevens. The training specificity of repeated bouts of
high-intensity exercise is also critical, given the task-dependent nature of physiological
adaptations to the performance of this activity. It is unlikely the consistently lower frequency
of, and distance covered during, high-velocity (≥6 m·s-1
) running observed in training
compared with matches offers a sufficient stimulus for optimal adaptation to meet
competition demands.
Mean and peak heart rate and cardiovascular load discriminated independently each training
activity with the exception of moderate- to high-intensity skill-refining and game-simulation
drills (results not shown). However, one could not be confident about quantifying trivial or
small changes in the intensity of drills between sessions, owing to the inherent noise of heart
rate metrics (evident in the relatively poor signal-to-noise ratios). To longitudinally track an
individual player or assess an intervention with a repeated-measures design using realistic
sample sizes, several sessions would need to be monitored and averaged to reduce the within-
player variability to a value comparable with the smallest important change (a signal-to-noise
ratio of ~1.0). The most reliable measure in this study, the frequency of impacts during
matches, would require six repeated observations to quantify trivial changes confidently, and
other measures would require several times more.
The findings of this study highlight the potential to improve the training efficiency of
international rugby sevens players. Training efficiency can be improved through greater
physical specificity for a superior return from on-field training time without compromising a
player’s health or performance. Rugby players are often exposed to high training volumes
during the pre- and in-competition training phases [41]. There is an association between
training load and incidence of injuries [105] and between training volume and injury severity
[41] in professional contact team sports. However, a professional rugby union team’s training
volume does not significantly correlate with their final competition ranking [41].
Furthermore, a reduction of pre-season training volume in sub-elite rugby league players
lowered injury rates without any detrimental effect on training adaptations [100]. The effect
of reducing training volumes on training adaptations, incidence and severity of injuries, and
recovery requirements in rugby sevens players is yet to be determined. Nevertheless, the
results of our analysis support the assertion that modifying training approaches to improve
efficiency may simultaneously reduce the risks associated with high training volumes while
maintaining or improving training adaptations.
Chapter 9 – Comparison of Activity Profiles and Physiological Demands between International Rugby Sevens
Matches and Training
156
Practical Applications
Specificity of training is an important consideration for prescription of physical preparation
programmes to promote physiological adaptations for the benefit of competition
performance. The training activities in this squad over 21 months did not replicate the
physical or physiological demands of top-level competition. Although it may be undesirable
for technically-focused drills to reproduce the physical loads of competition, game-simulation
drills should reflect match demands to adequately prepare players for competition.
Understanding the demands of competition facilitates the modification of match-specific
training drills to improve specificity and adopt position-specific training approaches. The
magnitude-based approach used in this study highlights the priorities for improving the
specificity of movement patterns and velocities based on a player’s position and the type of
training drill. For example, although the maximal running velocity achieved by forwards
during game-simulation drills was similar to competition, the mean velocity (m·min-1
) was
substantially lower. Coaches could improve the management of their players’ training load
and enhance training efficiency by increasing intensity and specificity and reducing training
duration. Furthermore, coaches should consider the influence of interruptions in training
activity for instruction and feedback on the movement patterns and physiological load
imposed on players. Heart rate monitoring provides a useful index of a player’s internal
response to a training stimulus to ensure the appropriate adaptations are achieved, while GPS
devices provide an objective external measure of the work performed by a player. Monitoring
the activity profile and physiological load of training activities should ensure training drills
optimally prepare players for the demands of competition.
Acknowledgements
We gratefully acknowledge the cooperation and involvement of the players and the coaching
and support staff. This study was funded by the Australian Institute of Sport, Australian
Rugby Union, and the National Institute of Sport Studies at the University of Canberra.
Chapter 10 – Discussion
157
Chapter Ten – Discussion
To achieve success at the international level, player development and team preparation
strategies in rugby sevens should be holistic and consider, in isolation and collectively, the
technical, tactical, physical and physiological requirements for competition. Through a
systematic series of studies relating to the analysis of competition and requirements for player
selection and development, it is apparent that the demands of international-level rugby sevens
competition are distinct from 15-player rugby union. Successful player- and team-preparation
programmes need to acknowledge these differences and structure training plans based on
specific development objectives.
Rugby sevens is a tactical, physically-demanding, and skill-based team sport. Consequently,
success at the elite level requires sustained emphasis on developing and maintaining the
physical qualities and technical abilities of players. The first stage of constructing an effective
player- and team-development framework was to accurately define the technical, tactical, and
physical demands of competition (Chapter Three to Chapter Six). The second step was to
define the characteristics of international-level players to determine the priorities for physical
development (Chapter Seven and Chapter Eight). Finally, training methods to improve the
physical qualities of players can be implemented, monitored and refined to ensure the training
programme is specific and efficient in preparing players for competition (Chapter Nine).
Technical and Tactical Requirements of Competition
The use of notational analyses to quantify the technical and tactical components of
competition from a large sample of matches and tournaments provides coaches and support
staff with a contemporary profile of rugby sevens. Moreover, relating the technical and
tactical elements of competition with team success assists in defining the requirements of the
sport. Given rugby sevens is played in a tournament format and the IRB Sevens World Series
is the pre-eminent international competition, the requirements for competition were described
not only by the factors contributing to winning a single match (Chapter Three), but also
success in a tournament (Chapter Four) and across the entire World Series (Chapter Five).
Such information allowed the priorities for technical development of individual players and
teams to be identified and informs tactical approaches to competition directed by coaches.
Chapter 10 – Discussion
158
The studies presented in this thesis highlight differences in technical and skill components
between rugby sevens and rugby union, and between successful and unsuccessful teams.
Although most performance indicators exhibited a high degree of variability between
matches, tournaments and World Series, many were substantially related to a team’s
performance and subsequent relative success (Chapter Three to Chapter Five). Analysis of
large samples and the averaging of team performances to quantify between-team effects
attenuate the variability or noise of the relationship between individual match performances
and success, strengthening the observed associations (Chapters Four and Chapter Five). Such
analyses emphasise priority areas for team development and longitudinal performance
monitoring. Rugby sevens performance at the elite level is dependent not only on the
attainment and repeated execution of high levels of technical skill from individual players,
but also the interaction, cohesion and tactical approach of teams. Player development
programmes must target individual skills necessary for rugby sevens, such as passing,
tackling and contesting the breakdown, as well as team tactics that employ the collective
technical strengths of the team and exploit weaknesses of the opposition.
The importance of set-piece plays in rugby sevens in determining a single match outcome is
lower than in rugby union. While the number of scrums and line-outs in a rugby sevens
match is less than in rugby union, the reduced number of players and variations in the laws of
the game diminish the ascendancy in territory and possession a team can gain by dominating
set-piece plays. Instead, teams most likely to score points and win rugby sevens matches
control ball possession, not only at the line-out, but by more frequently avoiding contact and
retaining a greater proportion of possession at the breakdown. Despite the variable and high-
tempo nature of rugby sevens, teams most likely to win closely-contested matches play a
patient and evasive style of game (Chapter Three).
Over the course of a tournament or an annual World Series, other skills and tactics are
important in determining a team’s relative success. Within a tournament, successful teams
maintain ball possession by having fewer errors and surrendered possessions per match, and
are more efficient in converting possession into tries. The importance of effective tackling
ability and defensive systems in determining a team’s success is highlighted by the fewer
missed tackles and more completed tackles, resulting in a higher rate of tackle completion, in
better-performing teams (Chapter Four). Consequently, to increase the chances of success at
the international level, team preparation should give attention to both offensive and defensive
factors of performance.
Chapter 10 – Discussion
159
When match statistics were aggregated from teams during multiple matches and tournaments,
a team’s effectiveness in gaining or maintaining the ball at the breakdown emerged as a key
discriminating factor of a team’s relative success (Chapter Five). Technical development
programmes should therefore accentuate the ability of players to contest ball possession at the
ruck. Notably, conceding more penalties and free kicks was related to a lower number of
points scored in a single match, but had a trivial effect on a team’s likelihood of winning a
close match (Chapter Three). In contrast, conceding more penalties and free kicks had a
beneficial association with a team’s World Series ranking (Chapter Five). It appears more-
successful teams are not necessarily more disciplined, but instead may be more discretionary
or selective in the period of the match or area of the field in which a penalty or free kick is
conceded.
Movement Patterns and Physiological Demands of Competition
Comprehensively detailing the physical loads on players during competition is a crucial step
in prescribing training to enhance the appropriate physical attributes of players. The short-
duration, high-intensity tournament format of rugby sevens yields different movement
patterns and physiological demands of competition than rugby union. The activity profiles of
and demands on players correspond to having fewer players on the rugby sevens field relative
to rugby union. As a result, rugby sevens players cover ~20 to 45% greater distance relative
to the match duration, with a higher proportion of total distance covered at high velocity
(Chapter Six and Chapter Nine). During a full match, rugby sevens players cover ~1400 to
2000 m at a mean intensity of 96 to 120 m·min-1
. The different style of competition (multi-
day tournament vs. seasonal league) and increased relative movement volume and intensity in
rugby sevens matches warrant different approaches to training and priorities for the physical
development of players.
Although differences in the positional roles and movement patterns of backs and forwards
during matches are less pronounced in rugby sevens than rugby union (Chapter Nine), these
differences should be considered when prescribing a player’s training programme. Relative to
forwards, backs achieve a higher maximal velocity, perform more accelerations and
decelerations, and cover greater distances overall and at ≥3.5 m·s-1
. However, the differences
in activity are not accompanied by corresponding differences in heart rate measures of
internal load (Chapter Nine). Despite the requirement for individually-prescribed training
programmes for each player based on their position-specific requirements for physical
Chapter 10 – Discussion
160
development, the relatively low between-player variability in anthropometric, physical, and
performance qualities observed in a national squad of rugby sevens players highlights the
need for more uniform physical and performance objectives or benchmarks compared with
rugby union players (Chapter Seven and Chapter Eight).
International-level matches are played at a higher intensity than domestic-level matches and
elicit a greater physical load on players (Chapter Six). Despite this observation, analyses of
domestic and international match demonstrate a 1 to 16% reduction in a player’s work-rate
from the first to second half (Chapter Six). The small reduction is most likely the result of
fatigue as players are unable to sustain high-intensity activity. The diminished work-rate of
players in the latter stages of a match highlights the importance of developing endurance and
fatigue resistance in players. Given the small number of players on the field for a rugby
sevens team, decrements in a player’s ability to maintain high-intensity activity could have a
substantial detrimental effect on team performance. Conversely, tactical substitution of a
player at a crucial stage of a match may positively influence a team’s work-rate and have a
decisive effect on a match outcome (Chapter Six).
Rugby sevens matches are characterised by repeated bouts of high-intensity activity.
Approximately 16 to 19% of the distance covered in an international match is at a velocity
exceeding 5 m·s-1
with players attaining mean match heart rates of ~86% of maximum
(Chapter Six and Chapter Nine). To increase the potential for success in a rugby sevens
tournament, players must be able to consistently reproduce high-intensity efforts in multiple
matches over successive days. This requisite has implications for the moderate- to long-term
physical development of players, as well as short-term requirements for recovery between
matches to mitigate the effects of transient and residual fatigue. Training methods to enhance
a rugby sevens player’s ability to perform repeated bouts of high-intensity activity with
limited recovery should include task-specific drills, such as high-intensity interval training
and game-simulation drills, as well as interventions to address the primary factors limiting
performance [32]. Additionally, strategies that promote recovery between matches, such as
nutritional interventions (Appendix A), cryotherapy, and contrast water therapy or cold water
immersion [111,255] may also be beneficial.
Characteristics and Capacities of Rugby Sevens Players
Evaluating the characteristics and functional capacities of players in both the field and
laboratory (Chapter Seven and Chapter Eight) complements information gained through the
Chapter 10 – Discussion
161
quantification of competition demands (Chapter Six and Chapter Nine). These assessments
give immediate feedback to coaches and support staff that is useful for training prescription,
as well as informing long-term player selection and development of junior athletes. The
characteristics of international-level players and the programmes to develop these
characteristics are dictated primarily by the demands of competition. The high-intensity and
collision-based nature of rugby sevens with relatively high running volumes suggests
successful players need well-developed strength, power, speed and endurance qualities.
The enhancement of a player’s endurance, specifically their aerobic capacity, is likely to
assist with the recovery from high-intensity activity within and between matches. A higher
level of fitness may also reduce the risk of injury [99] and susceptibility of players to fatigue-
related errors in skill execution [102]. The relative V̇O2max of international rugby sevens
players is similar to or greater than that of professional and international rugby union players
(Chapter Seven). However, other metabolic and neural factors, such as creatine phosphate
resynthesis, anaerobic capacity, hydrogen ion buffering, and muscle excitability and
recruitment, also contribute greatly to players’ abilities to perform repeated high-intensity
exercise [112]. Measuring performance related to these factors collectively through repeated-
sprint ability and sport-specific endurance tests highlights the need for rugby sevens players
to develop anaerobic capacity and endurance in combination with aerobic fitness (Chapter
Seven).
Both acceleration and maximal velocity qualities are fundamental to successful international-
level rugby sevens players. During international matches, backs covered 9.8 ± 6.6 m·min-1
(mean ± SD) and forwards, 6.4 ± 5.1 m·min-1
at ≥6 m·s-1
(Chapter Nine). In domestic-level
matches, backs and forwards covered maximal distances at >5.6 m·s-1
of 44.5 ± 14.4 m and
37.5 ± 10.0 m, respectively [239]. International players possess acceleration abilities similar
to or exceeding those of elite rugby union players and maximal straight-line sprint velocity
values comparable to those of professional rugby union backs (Chapter Seven). To develop
speed and acceleration qualities, rugby sevens players should be exposed to speed training
during team-based skill drills. Although, given the importance of this characteristic for
success in competition, rugby sevens players may benefit from supplementary specific speed
sessions that focus on developing acceleration and maximal velocity qualities. Furthermore,
in addition to improving running technique and strength characteristics specific to sprinting,
training drills should also incorporate a variety of starting speeds to replicate the movement
Chapter 10 – Discussion
162
patterns of competition [83], as well as the fundamental abilities to catch, pass, and run with
the ball [116,268].
On average, modern male rugby sevens players are shorter, lighter and leaner than their rugby
union counterparts (Chapter Seven). Given the smaller differences in movement patterns and
increased need for mobility in all rugby sevens positions, differences in physique between
rugby sevens backs and forwards are less pronounced than positional differences of rugby
union players (Chapter Eight). Differences in anthropometric attributes of rugby sevens and
rugby union players presumably reflect the lower demands for physical confrontation
(Chapter Eight) and higher running demands in rugby sevens (Chapter Six). Although a
lighter body mass may be beneficial for performing frequent sprints, accelerating,
decelerating, and changing direction when running, a higher body mass is advantageous
during contests for the ball. Rugby sevens players should develop a proportionally high
muscle mass that assists in force production required for accelerating, sprinting, effecting and
breaking tackles, and during rucks and mauls (Chapter Eight). Players should simultaneously
attempt to limit fat mass, which can compromise their power-to-weight ratio, metabolic
efficiency [277] and thermoregulation [230].
Although a relatively light and lean physique may be advantageous in rugby sevens,
anthropometric characteristics of international rugby union players suggest a higher body
mass, potentially at the expense of leanness, may increase a player’s momentum and be
beneficial for the increased contact demands of rugby union (Chapter Eight). Indeed, the
quantity and regional anatomical distribution of fat, non-osseous lean and bone mineral mass
are characterised by both the positional roles and specific demands of rugby union and rugby
sevens (Chapter Eight). The transition of players between rugby union and rugby sevens may
result in conflicting physique requirements and subsequent training and nutritional strategies.
Conversely, information on the regional and whole-body size and composition characteristics
of international-level players may assist in selecting players into the rugby format and/or
position to which they are best physically suited. Information on physique traits that
characterise both international-level rugby sevens and rugby union players presented in this
thesis (Chapter Eight) provides an important step in understanding differences in body
composition associated with different positional groups and rugby formats.
Chapter 10 – Discussion
163
Physical Training and Player Development
The multitude of technical (Chapter Three to Chapter Five) and physical (Chapter Six to
Chapter Eight) qualities required for success in rugby sevens underline the challenge of
developing a programme to prepare international-level players for competition. The
fundamental goals of the development programme are to increase a player’s skill level and
work capacity; improve strength, power and speed; and optimise body size and composition
specific to positional demands. Ideally, these outcomes are achieved in an efficient and
timely manner that minimises the risk of injury, illness, and overtraining. Establishing the
priorities for team and individual player preparation is a prerequisite for the prescription of a
training and preparation programme. Priorities should be based on the requirements of the
annual competition schedule, the rates of adaptation to training, the timeframe for player
development, and assessment of an individual player’s strengths and weaknesses.
Accompanying the increase in profile and international competitiveness of rugby sevens [45]
is a parallel increase in the professionalism and specialisation of athletes in the sport.
Although it is still common for many players to compete in both rugby sevens and rugby
union, the demands of training and competition and the differing competition schedules make
it increasingly difficult for players to compete at the highest level in both formats. The
differences in position-specific competition requirements established in this thesis should be
reflected in the training and nutrition programme, potentially resulting in conflicting or
incompatible demands and objectives. In addition, in its current form, the schedule for
international rugby sevens competition is unique in comparison with most other team sports.
The IRB Sevens World Series is contested annually over a number of individual tournaments
around the world. The men’s 2013/2014 IRB Sevens World Series consists of nine
tournaments between October, 2013 and May, 2014. Consequently, the annual training
programme must prepare players to be in peak physical condition at each individual
tournament over an eight-month period. This objective conflicts with the preparatory and
recovery needs of the more regular (typically weekly) contests during a rugby union season.
The annual training programme of rugby sevens players is typically implemented through a
periodised approach structured around the competition season. The principles of overload,
progression, specificity, and reversibility are applied to increase training loads and fitness in
the pre-competition phase, maintain fitness during the competitive season, and allow
recovery while minimising reversibility of fitness in the off-season [81]. To achieve parallel
Chapter 10 – Discussion
164
improvements in the physical, physiological and technical factors that contribute to
performance, rugby sevens players regularly undertake a mix of training methods including
on-field training, resistance training and recovery [175]. A strategic approach to player
development should consider the individual and combined objectives of these training
methods, the temporal alignment of training sessions within a weekly micro-cycle, and
potential interference of training adaptations [25,118].
It is important that a mixed training programme is designed recognising the short- and long-
term physical effects on the athlete. In a single training session, an overload stimulus results
in acute fatigue that manifests in a decrease in performance as a player’s ability to express
their true physical capacity is temporarily suppressed. Training adaptations are the product of
cumulative responses in the longer term that emerge after a period of recovery. Coaches
applying a variety of training methods should consider the varying rates of recovery and
adaptation for different physical qualities. Acknowledging differences in the time required for
adaptations to occur will allow coaches to prescribe balanced programmes in which any
decrement in physical capacity is less than the beneficial adaptation achieved. Structuring a
programme in such a way should minimise the potential for interference or compromise in
responses to training (Chapter Seven). For example, when attempting to simultaneously
increase maximal power output and aerobic fitness, while allowing players to be in peak
physical state leading into competition. Similarly, the rates of recovery and potential delay in
observable training effects for different training methods also require consideration when
structuring training and planning short- and long-term objectives. For instance, a rugby
sevens training programme micro-cycle may include a single day incorporating three high-
intensity, short-duration training sessions with three to four hours between each to condition
players to the demands of tournament-style competition. Although this approach is likely to
be beneficial to a player’s ability to perform repeated bouts of highly-demanding activity,
coaches must consider the player’s acute response to each session and the potential for
residual fatigue to influence performance in subsequent sessions.
The demands of international competition dictate successful players must simultaneously
develop acceleration and speed, sport-specific endurance, strength and power qualities
(Chapter Seven). The aim of the physical preparation programme is to develop both aerobic
and anaerobic capacities so a player can sustain and reproduce high levels of power output
during repeated bouts of work. Following the well-accepted principle of training specificity,
on-field game-simulation training drills are often employed to enhance technical aspects of
Chapter 10 – Discussion
165
performance, such as skill development and decision-making ability, under physical loads
that replicate competition conditions. Given the observed differences in the physical load and
intensity of domestic- and international-level competition, player selection and preparation
should be specific to the level of competition at which a player is expected to compete
(Chapter Six). Accordingly, game-simulation drills should mimic the duration and density of
high-intensity efforts in competition.
The planned use of game-simulation drills, involving high volumes of maximal or near-
maximal sprints, reactive agility and ball movements, at key stages of a rugby sevens team’s
preparation can be a valuable method of conditioning players to the intensity of competition.
Observations of contemporary training practices suggest international-level players’
development programme may be improved to more effectively use the limited preparation
time available (Chapter Nine). By increasing the intensity and associated physiological load
of game-simulation drills the specificity of training can be enhanced. In turn, coaches may
reduce the overall volume of training for an equivalent load on players, thereby increasing
training efficiency and lowering the risk of detrimental effects associated with high training
volumes, such as injury [41,100], immunosuppression [113], and reduced performance.
Naturally, the volume of high-intensity training requires careful consideration and planning,
especially in regard to subsequent requirements for recovery between sessions to avoid non-
functional overreaching and overtraining [174,188].
Effective testing and monitoring systems are a vital component of player development and
physical preparation programmes [81]. Routine monitoring of training provides important
feedback on players’ short-term responses to training and informs training prescription.
During on-field training sessions, both the internal and external load on players should be
assessed (Chapter Nine). In a rugby sevens context, internal load is typically measured using
objective tools such as heart rate monitoring or more practical techniques such as subjective
player ratings of perceived exertion [94]. External load is typically quantified using micro-
technology, such as GPS devices. Several training drills or sessions must be monitored to
account for the session-to-session variability when assessing changes or differences in
measures of internal and external load within or between players. Averaging activity profile
and physiological load measures over multiple sessions reduces the within-player variability
to a value comparable with the smallest important change (a signal-to-noise ratio of ~1.0)
(Chapter Nine). The number of repeated observations required to confidently quantify trivial
Chapter 10 – Discussion
166
or small changes between sessions is dependent upon the signal-to-noise ratio of the metric
used.
Regular evaluation of the physical and anthropometric attributes of players is useful in
ensuring the appropriate adaptations to training and dietary interventions are being achieved.
An array of tests assessing physical attributes and capacities, including physique and body
composition, speed, power, strength, and endurance, may be administered in isolation or
combination (Chapter Seven). By serially testing players throughout the periodised plan, a
profile of strengths and weaknesses for each player can be used to individually customise the
development programme and update training objectives. Testing players in the field provides
a time- and cost-effective alternative to laboratory-based testing (Chapter Seven). For
instance, the very large correlation (r = 0.89) between the distance covered in the Yo-Yo IR1
test and a player’s running velocity at V̇O2max indicates the field-based measure can be used
to assess players and set velocity thresholds for training and competition monitoring.
Conclusion
To my knowledge, at the commencement of this research programme only four full-text
scientific articles investigating rugby sevens were published. This thesis has made a
substantial contribution to our understanding of rugby sevens and requirements for player
preparation. Each of the research studies contained in this thesis address an important factor
relating to rugby sevens performance. Chapter Three to Chapter Six defined the technical,
tactical, and physical demands of competition. Chapter Seven and Chapter Eight
characterised the physique, physiological and performance qualities of international-level
players. Finally, Chapter Nine assessed the specificity of on-field sport-specific training drills
to refine the physical qualities of players. Clearly, the sport of rugby sevens has unique
requirements that necessitate the development of a sport-specific framework for the technical
and physical development of players. The practical outcomes of this thesis should have long-
term implications for national coaching education and the direction of sport-specific talent
identification and development systems in this rapidly evolving sport.
Chapter 11 – Research Outcomes
167
Chapter Eleven – Research Outcomes
The major findings of the research studies presented in this thesis contribute to and extend the
existing body of knowledge with reference to rugby sevens. The research programme had
eleven specific aims. These aims and the key research outcomes are detailed below.
Research Aims and Key Outcomes
Competition Analysis
1. Identify key performance indicators related to successful rugby sevens performance.
Analyses of match statistics collected from large representative samples of international
matches generated reference values for common team performance indicators. Typical
differences in performance indicator values between teams and variability between matches,
tournaments and World Series competitions for a single team inform both short-term tactics
and long-term strategies in rugby sevens.
2. Develop models for rugby sevens match performance prediction using team
performance indicators.
Ruck and maul retention, possession time, the number of scrums and scrum possessions
retained, the number of line-outs and line-out possessions retained, and kicks are positively
related to the number of points scored by a team and the likelihood of winning a close match.
Conversely, rucks and mauls per min of possession, turnovers conceded and turnovers
conceded per min possession, opposition possession time, rucks and mauls, rucks and mauls
retained, penalties and free kicks conceded, passes per min of possession are negatively
related to scoring points and probability of winning. Higher-scoring and more-successful
rugby sevens teams tend to control possession of the ball and play a patient, disciplined and
evasive style of game.
3. Identify the relationship between team performance indicators and international
rugby sevens tournament outcomes.
In an international rugby sevens tournament, more entries into the opposition’s 22-m zone per
match, tries per entry into the opposition’s 22-m zone, tackles per match, passes per match,
rucks per match and a higher percentage of tackle completion are associated with a better
Chapter 11 – Research Outcomes
168
ranking relative to other teams. Conversely, more passes per try, rucks per try, kicks per try,
errors per match, surrendered possessions per match, and missed tackles per match are related
to a worse ranking. The most successful teams are those that maintain ball possession by
reducing errors and turnovers, are efficient in converting possession into tries, and have
effective defensive structures resulting in a high rate of tackle completion.
4. Identify specific technical and tactical factors (patterns of play) associated with
success in international rugby sevens.
Over an entire IRB Sevens World Series, more tries scored, penalties and free kicks
conceded, and a higher percentage of own rucks won, percentage of opposition rucks won,
and percentage of line-out possessions retained are related to a better ranking than other
teams. Conversely, more tries conceded and a higher percentage of contestable restarts and
percentage of tries conceded with no rucks than other teams are related to a poorer ranking.
5. Quantify the differences in movement patterns between international and domestic
rugby sevens tournaments.
The gross relative movement demands of rugby sevens are ~20 to 45% greater and relative
high velocity running demands more than double those of rugby union. International rugby
sevens matches are more physically demanding than domestic-level matches owing to the
greater distance covered at high velocities and higher frequency of changes in velocity.
Distance covered in total and at ≥3.5 m·s-1
, maximal velocity, and the frequency of
accelerations and decelerations are lower in forwards during international matches compared
with backs. However, there are no clear positional group differences in physiological load
during matches.
6. Quantify changes in movement patterns within and between rugby sevens matches.
The relative distance covered by players at velocities >2 m·s−1 and frequency of changes in
velocity is reduced from the first to second half of a match. There are small differences in
players’ movements at <5 m·s−1 and a small reduction in the number of moderate
accelerations from the first to last match of a tournament.
7. Assess the movement patterns of late-match substitute players in rugby sevens
matches.
Chapter 11 – Research Outcomes
169
Late-match substitute players have greater work-rates in the second half of matches than
players contesting the full match.
Player Selection and Development
8. Profile the physiological, anthropometric and performance characteristics of
national-level rugby sevens players, and compare these results with previously
published values for rugby union players.
Rugby sevens players require highly-developed speed, power, and endurance qualities to
meet the demands of competition. Rugby sevens players have anthropometric characteristics
similar to those of backs in international rugby union, and acceleration and speed, lower-body
muscular power and relative maximal aerobic power similar to, or exceeding, those of
professional rugby union players.
9. Quantify the relationships between anthropometric, physiological and performance
test results in national-level rugby sevens players.
Correlations between anthropometric, performance, and physiological measures emphasise
the importance of physique and body composition in rugby sevens players, and highlight the
need for players to develop speed and endurance without compromising other qualities
pertinent to performance. Associations between laboratory- and field-based tests suggest
field-based testing can provide a more practical method for assessing physical performance
potential.
10. Quantify and compare the distribution of fat, non-osseous lean and bone mineral
mass in international rugby union and rugby sevens players.
While forwards have a greater quantity of fat, lean and bone mass than backs in both rugby
union and rugby sevens, the magnitude of difference between the positional groups is greater
in rugby union players. When regional tissue mass is expressed as a proportion of total
regional mass, positional group differences become predominantly unclear in rugby sevens
players, but persist in rugby union players.
Competing at the international level in either rugby union or rugby sevens characterises the
distribution of fat and non-osseous lean mass to a greater extent than a player’s positional
group. However, the distribution of bone mineral mass is associated more with a player’s
position than the rugby format in which they compete.
Chapter 11 – Research Outcomes
170
Specificity of Training
11. Examine the positional group-specific specificity of contemporary rugby sevens
training practices in relation to the demands of competition.
Contemporary skill-refining and game-simulation drills of rugby sevens players at the
national level generally do not replicate the physical and physiological demands of
international competition for backs or forwards.
Limitations
Although the findings of this thesis have important implications for player development in
the sport of rugby sevens, the following limitations are acknowledged.
Match statistics analysed to model the relationship of team performance indicators
with points scoring during matches, likelihood of winning, and final ranking in
tournaments and over the IRB Sevens World Series were limited to those collected by
the IRB and publicly accessible on the tournament website. The analysis of different
match statistics should provide further insight into technical and tactical performance
indicators related to successful outcomes in international rugby sevens. Despite this
limitation, the analyses of the current match statistics described in the thesis were
warranted as these official data are routinely collected by the sport’s governing body
and available to all teams competing in the IRB Sevens World Series. It is therefore
likely these data are used by coaches in planning their team’s preparation for
competition.
This thesis profiled the anthropometric, physiological, and performance
characteristics of international-level Rugby Sevens players. The cohort of rugby
sevens players investigated represented the national squad players of one country. As
there are only a limited number of players in each national squad, the sample size
available for investigation was limited to the number of available players free from
injury or illness. A sample of this size does not permit normative values representative
of all international-level rugby sevens players competing around the world to be
derived. However, increasing the sample size by recruiting players competing at
lower levels of the sport would have further limited the ability to apply findings to the
target population of international-level players.
Chapter 11 – Research Outcomes
171
Given logistical issues when studying players from national rugby union and rugby
sevens squads during preparation for international competition, it was not possible to
perform all DXA measurements using a single scanner. The use of a single DXA
scanner to measure all players in both national squads would have permitted direct
comparisons of the absolute and relative quantity of regional tissue mass of players in
each squad.
Practical Applications
The findings of this thesis may be applied by coaches, support staff and players to better
understand the nature of the game, the factors contributing to successful performances, the
physical and physiological attributes of players, and training interventions to effectively
prepare players for competition.
Competition Analysis
Reference values for performance indicators derived during individual matches, full
tournaments, or over the entire IRB Sevens World Series may be applied to evaluate
team performances, establish match objectives and plan training programmes that
improve a team’s probability of success in international competition.
Team tactics that increase the amount of points scored and likelihood of winning
should be based on strategies that promote greater ball possession, minimise rucks
and mauls, turnovers, penalties and free kicks, and limit passes.
Technical preparation for international competition should give attention to offence
and defence. Successful teams in international rugby sevens tournaments maintain
ball possession by reducing errors and turnovers, are efficient in converting
possession into tries, and have effective defensive structures resulting in a high rate of
tackle completion.
To improve a team’s ranking in the IRB Sevens World Series, tactics should be based
on scoring more and conceding fewer tries by maximising ball retention in line-outs
and the breakdown, turning the ball over more frequently in opposition rucks, and
pressuring the opposition in their territory by kicking fewer contestable restarts.
Chapter 11 – Research Outcomes
172
Small reductions in player work-rate can be expected between the first and second
half of a rugby sevens match. Tactical player substitutions in the latter stages of a
match may be used to maintain or mitigate decrements in team work-rate.
Movement pattern variables should be reported per min of activity and on an
individual basis to account for differences in match time and between-player
differences.
Player Selection and Development
Physical preparation programmes of international rugby sevens players should aim to
achieve concomitantly well-developed speed, power, and endurance qualities relative
to rugby union players. Although these characteristics may be developed concurrently
or in isolation depending on the individualised periodised training programme, the
development of one aspect of fitness should not compromise another component of
fitness relevant to performance.
The periodised physical preparation programme of rugby sevens players should be
based on an individual’s playing position and fitness profile. A regular testing regime
will inform both team and individual player requirements.
Rugby sevens players are likely to require superior endurance qualities to rugby union
players to tolerate the higher running demands. Aerobic and anaerobic capacity
should be prioritised within the physical preparation programme of rugby sevens
players.
To optimise physical preparation of players, training should be specific to the
domestic or international competition level in which they are competing.
Relatively uniform physical and performance standards should be developed for
rugby sevens players, given the small between-player differences compared with
rugby union players.
Regular physiological and anthropometric assessments are recommended to monitor
players’ physical development and progression. Simple field-based measures, such as
the Yo-Yo IR1, may be employed to assess training adaptations and prescribe velocity
thresholds for performance monitoring in place of time-consuming and expensive
laboratory-based tests. A structured testing regimen conducted at various phases of
Chapter 11 – Research Outcomes
173
the season (e.g., off-season, preseason, midseason) will assist in planning periodised
training programmes and evaluating their effectiveness.
Increasing the body mass of international rugby players is likely to offer a competitive
advantage. Physical preparation and dietary programmes should be designed to
achieve a player’s optimal body mass considering their positional requirements.
Achieving the ideal ratio of fat and lean mass in each anatomical region will
contribute to optimal physical performance. The most effective absolute and relative
tissue masses will vary between rugby formats, positions, and individuals. The
advantage of a higher body mass in international rugby union forwards, even by an
increase in absolute fat mass and at the expense of lower proportional non-osseous
lean mass, appears greater than any potential detriment to speed and work capacity.
Increasing the proportional mass in the upper body of rugby players, particularly
through development of lean tissue in the arms, is likely to improve performance by
assisting in many rugby-specific skills. Hypertrophy and strength training
programmes should be designed to achieve this outcome.
Specificity of Training
Although it may be undesirable for technically-focused drills to reproduce the
physical loads of competition, game-simulation drills should reflect match demands to
adequately prepare players for competition. Coaches could improve the management
of their players’ training load and enhance training efficiency by increasing intensity
and specificity and reducing the duration of sessions.
There is a need for position-specific training approaches in rugby sevens, given
substantial differences in activity profiles between backs and forwards during
competition.
Coaches should consider the influence of interruptions in training activity for
instruction and feedback on the movement patterns and physiological load imposed
on players. Monitoring the activity profile and physiological load of training activities
should ensure training drills optimally prepare players for the demands of
competition. Heart rate monitoring provides a useful index of a player’s internal
response to training stimuli to ensure the appropriate adaptations are achieved, while
Chapter 11 – Research Outcomes
174
time-motion analyses using GPS devices provide an objective external measure of the
work performed by a player.
To longitudinally track an individual player or assess an intervention with a repeated-
measures design using realistic sample sizes, several matches or training sessions
should be monitored and averaged to reduce the within-player variability of
movement patterns and physiological load measures.
Directions for Future Research
Continued progression in the immature and emerging international sport of rugby sevens
means there is also a growing need for scientific research in performance analysis and player
development specific to rugby sevens. Several directions for future research emerge from this
thesis.
Competition Analysis
Subsequent research should examine additional performance indicators not routinely
collected by the IRB that may offer insight into other aspects of individual and team
performance, such as indicators of defensive systems employed, tackle technique, and
methods for contesting the ruck. Furthermore, analysis of the effects of situational
variables, including the quality of opposition, environmental conditions, and match
status, on a team’s technical performance and tactical decisions should further inform
the preparation of teams for competition.
Investigation of movement patterns of rugby sevens players during matches identified
players may be pacing their activity, potentially to mitigate fatigue later in the match.
Pacing and self-regulation of activity in rugby players will influence the prescription
of training programmes and strategic rotation of players in tournaments. Future
research could identify factors related to the development of fatigue and possible self-
regulation of activity.
Studies with a large sample of teams are required to identify individual positional
differences in movement patterns in rugby sevens competition and potential
distinctions between successful and unsuccessful teams. Similarly, investigations of
large samples of international-level players could identify the technical and skill
requirements during competition specific to individual positions. The findings of
Chapter 11 – Research Outcomes
175
studies in these areas should inform training prescription and player development
strategies.
Player Selection and Development
Strength and power are important qualities associated with success in rugby union.
Collection of strength and power data would provide a more comprehensive
description of the characteristics of elite-level rugby sevens players and permit
comparisons between rugby sevens and rugby union players.
Assessments of rugby sevens players competing at different levels of competition
(e.g., local, national and international) is needed to confirm relationships between
anthropometric, physiological, and performance characteristics and playing level.
The typical (within-season) changes in anthropometric, physiological and
performance characteristics of rugby sevens players over the course of an
international season are unclear and require examination.
The assessment of a large sample of international-level players will quantify physical
characteristics and movement patterns during competition associated with different
playing styles, selection policies, and ethnicities. The characteristics of players and/or
movement patterns during matches may be related to whether a team typically adopts
a direct or evasive style of play, the selection of younger or older, more physically
mature and experienced players, or a player’s ethnicity (e.g., European, Melanesian,
Polynesian).
Research is required to identify the position-specific body composition and physique
traits more likely to positively influence locomotion and performance measures, such
as power output, running velocity, and scrummaging force.
The interaction of biological (e.g., ethnicity, hormonal profile) and environmental
factors (e.g., training, diet) that influence adipose, osseous, and non-osseous lean
tissue distribution in rugby players requires further investigation. Knowledge of the
factors affecting tissue distribution may assist in developing targeted dietary and
physical preparation programmes for top-level players.
The technical development of players could be objectively assessed through the
design of empirically-validated match-related skills tests. The development of rugby-
Chapter 11 – Research Outcomes
176
specific skills tests would allow the technical proficiency of players to be monitored
over time, as well as enable the comparison of players competing at different playing
levels. Objective tests may also be applied to evaluate the effect of training
interventions or fatigue on skill performance.
The findings of this thesis may be progressed through an investigation of the
relationships of a player’s physical development and physiological capacities with
their activities and movement patterns during competition. Quantifying these
associations could lead to the ability to predict or account for a degree of the
variability in match activities through periodic physical testing of players. The ability
to detect changes in fitness characteristics related to match performance is
fundamentally important in governing training plans. Relating the results of physical
tests with match activities, such as the volume of high-speed running; the number of
match involvements; or the temporal changes in a player’s work-rate, would also
describe the construct (convergent) validity of the tests to rugby sevens performance.
Specificity of Training
Intervention studies are needed to quantify the effects of manipulating various
training drill parameters on players’ physical and physiological responses and long-
term adaptations. Understanding the effects of modifying training drill parameters,
such as work-to-rest ratios, playing area dimensions, number of players, and rule
changes, will assist in designing programmes that enhance the specificity of training.
Research is required to quantify the specificity of the technical and tactical
components of contemporary rugby sevens training practices and examine strategies
that maximise skill learning. Investigating the optimal balance and sequencing of
instructional skills training and match-specific drills, either in isolation or
combination, would inform training programme design.
Summary
The series of progressive studies presented in this thesis have documented the technical and
tactical elements associated with success in international rugby sevens matches, tournaments
and the IRB Sevens World Series, quantified the physical and physiological requirements of
competition, outlined the characteristics of international-level players and compared them
with professional rugby union players, and examined the specificity of training activities
Chapter 11 – Research Outcomes
177
relative to competition. The outcomes of these investigations may be applied by coaches and
support staff to monitor key measures of performance, prescribe evidence-based programmes,
and develop the physical qualities and technical abilities of international-level players.
Collectively, the information presented in this thesis assists in understanding the current
nature of the emerging sport of rugby sevens and the factors associated with successful
performance at the international level.
References
178
References
1. Achten J, Jeukendrup AE. Heart rate monitoring: applications and limitations. Sports
Medicine 2003; 33: 517-538
2. Alvear-Ordenes I, García-López D, De Paz JA, González-Gallego J. Sweat lactate,
ammonia, and urea in rugby players. International Journal of Sports Medicine 2005;
26: 632-637
3. Appleby B, Newton RU, Cormie P. Changes in strength over a 2-year period in
professional rugby union players. Journal of Strength and Conditioning Research
2012; 26: 2538-2546
4. Argus CK, Gill N, Keogh J, Hopkins WG, Beaven CM. Effects of a short-term pre-
season training programme on the body composition and anaerobic performance of
professional rugby union players. Journal of Sports Sciences 2010; 28: 679-686
5. Argus CK, Gill ND, Keogh JWL. Characterization of the differences in strength and
power between different levels of competition in rugby union athletes. Journal of
Strength and Conditioning Research 2012; 26: 2698-2704
6. Argus CK, Gill ND, Keogh JWL, Blazevich AJ, Hopkins WG. Kinetic and training
comparisons between assisted, resisted, and free countermovement jumps. Journal of
Strength and Conditioning Research 2011; 25: 2219-2227
7. Argus CK, Gill ND, Keogh JWL, Hopkins WG. Assessing lower-body peak power in
elite rugby-union players. Journal of Strength and Conditioning Research 2011; 25:
1616-1621
8. Argus CK, Gill ND, Keogh JWL, Hopkins WG, Beaven CM. Changes in strength,
power, and steroid hormones during a professional rugby union competition. Journal
of Strength and Conditioning Research 2009; 23: 1583-1592
9. Argus CK, Gill ND, Keogh JWL, McGuigan MR, Hopkins WG. Effects of two
contrast training programs on jump performance in rugby union players during a
competition phase. International Journal of Sports Physiology and Performance
2012; 7: 68-75
10. Atkins SJ. Performance of the Yo-Yo Intermittent Recovery Test by elite professional
and semiprofessional rugby league players. Journal of Strength and Conditioning
Research 2006; 20: 222-225
References
179
11. Aughey RJ. Australian football player work rate: evidence of fatigue and pacing?
International Journal of Sports Physiology and Performance 2010; 5: 394-405
12. Aughey RJ. Applications of GPS technologies to field sports. International Journal of
Sports Physiology and Performance 2011; 6: 295-310
13. Austin D, Gabbett T, Jenkins D. The physical demands of Super 14 rugby union.
Journal of Science and Medicine in Sport 2011; 14: 259-263
14. Austin D, Gabbett T, Jenkins D. Repeated high-intensity exercise in professional
rugby union. Journal of Sports Sciences 2011; 29: 1105-1112
15. Babault N, Cometti G, Bernardin M, Pousson M, Chatard J. Effects of
electromyostimulation training on muscle strength and power of elite rugby players.
Journal of Strength and Conditioning Research 2007; 21: 431-437
16. Baker D. Applying the in-season periodization of strength and power training to
football. Strength and Conditioning Journal 1998; 20: 18-24
17. Baker JS, Davies B. Resistive force selection during brief cycle ergometer exercise:
implications for power assessment in international rugby union players. Journal of
Exercise Physiology-online 2004; 7: 68-74
18. Banfi G, Del Fabbro M, Mauri C, Corsi MM, Melegati G. Haematological parameters
in elite rugby players during a competitive season. Clinical and Laboratory
Haematology 2006; 28: 183-188
19. Banfi G, Melegati G, Valentini P. Effects of cold-water immersion of legs after
training session on serum creatine kinase concentrations in rugby players. British
Journal of Sports Medicine 2007; 41: 339
20. Bangsbo J, Iaia FM, Krustrup P. The Yo-Yo intermittent recovery test: a useful tool
for evaluation of physical performance in intermittent sports. Sports Medicine 2008;
38: 37-51
21. Barbero-Álvarez JC, Boullosa DA, Nakamura FY, Andrín G, Castagna C. Physical
and physiological demands of field and assistant soccer referees during America's
cup. Journal of Strength and Conditioning Research 2012; 26: 1383-1388
22. Batterham AM, Hopkins WG. Making meaningful inferences about magnitudes.
International Journal of Sports Physiology and Performance 2006; 1: 50-57
23. Baumgartner RN, Roche AF, Guo S, Lohman T, Boileau RA, Slaughter MH. Adipose
tissue distribution: the stability of principal components by sex, ethnicity and
maturation stage. Human Biology 1986; 58: 719-735
References
180
24. Beelen M, Burke LM, Gibala MJ, van Loon LJC. Nutritional strategies to promote
postexercise recovery. International Journal of Sport Nutrition and Exercise
Metabolism 2010; 20: 515-532
25. Bell GJ, Syrotuik D, Martin TP, Burnham R, Quinney HA. Effect of concurrent
strength and endurance training on skeletal muscle properties and hormone
concentrations in humans. European Journal of Applied Physiology 2000; 81: 418-
427
26. Bell W. Body composition of rugby union football players. British Journal of Sports
Medicine 1979; 13: 19-23
27. Bell W, Evans WD, Cobner DM, Eston RG. The regional placement of bone mineral
mass, fat mass, and lean soft tissue mass in young adult Rugby Union players.
Ergonomics 2005; 48: 1462-1472
28. Bennett M, Manning JT, Cook CJ, Kilduff LP. Digit ratio (2D:4D) and performance
in elite rugby players. Journal of Sports Sciences 2010; 28: 1415-1421
29. Bevan HR, Bunce PJ, Owen NJ, Bennett MA, Cook CJ, Cunningham DJ, Newton
RU, Kilduff LP. Optimal loading for the development of peak power output in
professional rugby players. Journal of Strength and Conditioning Research 2010; 24:
43-47
30. Bevan HR, Cunningham DJ, Tooley EP, Owen NJ, Cook CJ, Kilduff LP. Influence of
postactivation potentiation on sprinting performance in professional rugby players.
Journal of Strength and Conditioning Research 2010; 24: 701-705
31. Bevan HR, Owen NJ, Cunningham DJ, Kingsley MIC, Kilduff LP. Complex training
in professional rugby players: influence of recovery time on upper-body power
output. Journal of Strength and Conditioning Research 2009; 23: 1780-1785
32. Bishop D, Girard O, Mendez-Villanueva A. Repeated-sprint ability - part II:
recommendations for training. Sports Medicine 2011; 41: 741-756
33. Bishop L, Barnes A. Performance indicators that discriminate winning and losing in
the knockout stages of the 2011 Rugby World Cup. International Journal of
Performance Analysis in Sport 2013; 13: 149-159
34. Björntorp P. The regulation of adipose tissue distribution in humans. International
Journal of Obesity and Related Metabolic Disorders 1996; 20: 291-302
35. Boddington M, Lambert M. Quantitative and qualitative evaluation of scoring
opportunities by South Africa in World Cup Rugby 2003. International Journal of
Performance Analysis in Sport 2004; 4: 32-35
References
181
36. Boyle PM, Mahoney CA, Wallace WF. The competitive demands of elite male field
hockey. The Journal of Sports Medicine and Physical Fitness 1994; 34: 235-241
37. Bracewell P. Monitoring meaningful rugby ratings. Journal of Sports Sciences 2003;
21: 611-620
38. Brooks JHM, Fuller CW, Kemp SPT, Reddin DB. Epidemiology of injuries in
English professional rugby union: part 1 match injuries. British Journal of Sports
Medicine 2005; 39: 757-766
39. Brooks JHM, Fuller CW, Kemp SPT, Reddin DB. Epidemiology of injuries in
English professional rugby union: part 2 training injuries. British Journal of Sports
Medicine 2005; 39: 767-775
40. Brooks JHM, Fuller CW, Kemp SPT, Reddin DB. A prospective study of injuries and
training amongst the England 2003 Rugby World Cup squad. British Journal of
Sports Medicine 2005; 39: 288-293
41. Brooks JHM, Fuller CW, Kemp SPT, Reddin DB. An assessment of training volume
in professional rugby union and its impact on the incidence, severity, and nature of
match and training injuries. Journal of Sports Sciences 2008; 26: 863-873
42. Cahill N, Lamb K, Worsfold P, Headey R, Murray S. The movement characteristics
of English Premiership rugby union players. Journal of Sports Sciences 2013; 31:
229-237
43. Carling C, Espié V, Le Gall F, Bloomfield J, Jullien H. Work-rate of substitutes in
elite soccer: a preliminary study. Journal of Science and Medicine in Sport 2010; 13:
253-255
44. Carlson BR, Carter JE, Patterson P, Petti K, Orfanos SM, Noffal GJ. Physique and
motor performance characteristics of US national rugby players. Journal of Sports
Sciences 1994; 12: 403-412
45. Chadwick S, Semens A, Schwarz EC, Zhang D. Economic impact report on global
rugby part III: strategic and emerging markets. 2010. Available from:
http://www.irb.com/mm/Document/NewsMedia/MediaZone/02/04/22/88/2042288_P
DF.pdf
46. Clarys JP, Scafoglieri A, Provyn S, Louis O, Wallace JA, De Mey J. A macro-quality
evaluation of DXA variables using whole dissection, ashing, and computer
tomography in pigs. Obesity 2010; 18: 1477-1485
References
182
47. Collet C. The possession game? A comparative analysis of ball retention and team
success in European and international football, 2007–2010. Journal of Sports Sciences
2013; 31: 123-136
48. Comyns TM, Harrison AJ, Hennessy L, Jensen RL. Identifying the optimal resistive
load for complex training in male rugby players. Sports Biomechanics 2007; 6: 59-70
49. Comyns TM, Harrison AJ, Hennessy LK. Effect of squatting on sprinting
performance and repeated exposure to complex training in male rugby players.
Journal of Strength and Conditioning Research 2010; 24: 610-618
50. Cook C, Beaven CM, Kilduff LP, Drawer S. Acute caffeine ingestion's increase of
voluntarily chosen resistance-training load after limited sleep. International Journal
of Sport Nutrition and Exercise Metabolism 2012; 22: 157-164
51. Cook CJ, Crewther BT. The effects of different pre-game motivational interventions
on athlete free hormonal state and subsequent performance in professional rugby
union matches. Physiology and Behavior 2012; 106: 683-688
52. Cook CJ, Crewther BT, Kilduff LP, Drawer S, Gaviglio CM. Skill execution and
sleep deprivation: effects of acute caffeine or creatine supplementation - a randomized
placebo-controlled trial. Journal of the International Society of Sports Nutrition 2011;
8: 1-8
53. Correia V, Araújo D, Davids K, Fernandes O, Fonseca S. Territorial gain dynamics
regulates success in attacking sub-phases of team sports. Psychology of Sport and
Exercise 2011; 12: 662-669
54. Coughlan GF, Green BS, Pook PT, Toolan E, O'Connor SP. Physical game demands
in elite rugby union: a global positioning system analysis and possible implications
for rehabilitation. Journal of Orthopaedic and Sports Physical Therapy 2011; 41:
600-605
55. Crewther BT, Cook CJ. Effects of different post-match recovery interventions on
subsequent athlete hormonal state and game performance. Physiology and Behavior
2012; 106: 471-475
56. Crewther BT, Cook CJ, Lowe TE, Weatherby RP, Gill N. The effects of short-cycle
sprints on power, strength, and salivary hormones in elite rugby players. Journal of
Strength and Conditioning Research 2011; 25: 32-39
57. Crewther BT, Gill N, Weatherby RP, Lowe T. A comparison of ratio and allometric
scaling methods for normalizing power and strength in elite rugby union players.
Journal of Sports Sciences 2009; 27: 1575-1580
References
183
58. Crewther BT, Heke T, Keogh JWL. The effects of a resistance-training program on
strength, body composition and baseline hormones in male athletes training
concurrently for rugby union 7’s. The Journal of Sports Medicine and Physical
Fitness 2013; 53: 34-41
59. Crewther BT, Kilduff LP, Cook CJ, Cunningham DJ, Bunce P, Bracken RM,
Gaviglio CM. Relationships between salivary free testosterone and the expression of
force and power in elite athletes. The Journal of Sports Medicine and Physical Fitness
2012; 52: 221-227
60. Crewther BT, Kilduff LP, Cook CJ, Cunningham DJ, Bunce PJ, Bracken RM,
Gaviglio CM. Scaling strength and power for body mass differences in rugby union
players. The Journal of Sports Medicine and Physical Fitness 2012; 52: 27-32
61. Crewther BT, Lowe T, Weatherby RP, Gill N. Prior sprint cycling did not enhance
training adaptation, but resting salivary hormones were related to workout power and
strength. European Journal of Applied Physiology 2009; 105: 919-927
62. Crewther BT, Lowe T, Weatherby RP, Gill N, Keogh J. Neuromuscular performance
of elite rugby union players and relationships with salivary hormones. Journal of
Strength and Conditioning Research 2009; 23: 2046-2053
63. Crewther BT, McGuigan MR, Gill ND. The ratio and allometric scaling of speed,
power, and strength in elite male rugby union players. Journal of Strength and
Conditioning Research 2011; 25: 1968-1975
64. Cronin J, Sleivert G. Challenges in understanding the influence of maximal power
training on improving athletic performance. Sports Medicine 2005; 35: 213-234
65. Cummins C, Orr R, O’Connor H, West C. Global positioning systems (GPS) and
microtechnology sensors in team sports: A systematic review. Sports Medicine 2013,
DOI: 10.1007/s40279-013-0069-2: 1-18
66. Cunniffe B, Griffiths H, Proctor W, Davies B, Baker JS, Jones KP. Mucosal
immunity and illness incidence in elite rugby union players across a season. Medicine
and Science in Sports and Exercise 2011; 43: 388-397
67. Cunniffe B, Hore AJ, Whitcombe DM, Jones KP, Baker JS, Davies B. Time course of
changes in immuneoendocrine markers following an international rugby game.
European Journal of Applied Physiology 2010; 108: 113-122
68. Cunniffe B, Proctor W, Baker JS, Davies B. An evaluation of the physiological
demands of elite rugby union using global positioning system tracking software.
Journal of Strength and Conditioning Research 2009; 23: 1195-1203
References
184
69. da Silva JF, Guglielmo LGA, Bishop D. Relationship between different measures of
aerobic fitness and repeated-sprint ability in elite soccer players. Journal of Strength
and Conditioning Research 2010; 24: 2115-2121
70. Dawson B, Hopkinson R, Appleby B, Stewart G, Roberts C. Comparison of training
activities and game demands in the Australian Football League. Journal of Science
and Medicine in Sport 2004; 7: 292-301
71. Deutsch MU, Kearney GA, Rehrer NJ. Lactate equilibrium and aerobic indices of
elite rugby union players. Medicine and Science in Sports and Exercise 1998; 30:
S239
72. Deutsch MU, Kearney GA, Rehrer NJ. A comparison of competition work rates in
elite club and 'Super 12' rugby. In: Spinks W, Reilly T, Murphy A (eds), Science and
Football IV. London, U.K.: Routledge; 2002: 160-166
73. Deutsch MU, Kearney GA, Rehrer NJ. Time - motion analysis of professional rugby
union players during match-play. Journal of Sports Sciences 2007; 25: 461-472
74. Deutsch MU, Maw GJ, Jenkins D, Reaburn P. Heart rate, blood lactate and kinematic
data of elite colts (under-19) rugby union players during competition. Journal of
Sports Sciences 1998; 16: 561-570
75. Diedrick E, van Rooyen M. Line break situations in international rugby. International
Journal of Performance Analysis in Sport 2011; 11: 522-534
76. Dugan EL, Doyle TLA, Humphries B, Hasson CJ, Newton RU. Determining the
optimal load for jump squats: a review of methods and calculations. Journal of
Strength and Conditioning Research 2004; 18: 668-674
77. Dupont G, Nedelec M, McCall A, McCormack D, Berthoin S, Wisløff U. Effect of 2
soccer matches in a week on physical performance and injury rate. The American
Journal of Sports Medicine 2010; 38: 1752-1758
78. Duthie G, Pyne D, Hooper S. Applied physiology and game analysis of rugby union.
Sports Medicine 2003; 33: 973-991
79. Duthie G, Pyne D, Hooper S. The reliability of video based time motion analysis.
Journal of Human Movement Studies 2003; 44: 259-272
80. Duthie G, Pyne D, Hooper S. Time motion analysis of 2001 and 2002 super 12 rugby.
Journal of Sports Sciences 2005; 23: 523-530
81. Duthie GM. A framework for the physical development of elite rugby union players.
International Journal of Sports Physiology and Performance 2006; 1: 2-13
References
185
82. Duthie GM, Pyne DB, Hopkins WG, Livingstone S, Hooper SL. Anthropometry
profiles of elite rugby players: quantifying changes in lean mass. British Journal of
Sports Medicine 2006; 40: 202-207
83. Duthie GM, Pyne DB, Marsh DJ, Hooper SL. Sprint patterns in rugby union players
during competition. Journal of Strength and Conditioning Research 2006; 20: 208-
214
84. Eaton C, George K. Position specific rehabilitation for rugby union players. Part I:
Empirical movement analysis data. Physical Therapy in Sport 2006; 7: 22-29
85. Eaves S, Hughes M. Patterns of play of international rugby union teams before and
after the introduction of professional status. International Journal of Performance
Analysis in Sport 2003; 3: 103-111
86. Edwards S. The heart rate monitor book. Port Washington, NY: Polar CIC; 1993
87. Elloumi M, Courteix D, Sellami S, Tabka Z, Lac G. Bone mineral content and density
of Tunisian male rugby players: differences between forwards and backs.
International Journal of Sports Medicine 2006; 27: 351-358
88. Elloumi M, Makni E, Moalla W, Bouaziz T, Tabka Z, Lac G, Chamari K. Monitoring
training load and fatigue in rugby sevens players. Asian journal of sports medicine
2012; 3: 175-184
89. Elloumi M, Maso F, Michaux O, Robert A, Lac G. Behaviour of saliva cortisol [C],
testosterone [T] and the T/C ratio during a rugby match and during the post-
competition recovery days. European Journal of Applied Physiology 2003; 90: 23-28
90. Elloumi M, Ounis OB, Courteix D, Makni E, Sellami S, Tabka Z, Lac G. Long-term
rugby practice enhances bone mass and metabolism in relation with physical fitness
and playing position. Journal of Bone and Mineral Metabolism 2009; 27: 713-720
91. Elloumi M, Ounis OB, Tabka Z, Van Praagh E, Michaux O, Lac G. Psychoendocrine
and physical performance responses in male Tunisian rugby players during an
international competitive season. Aggressive behavior 2008; 34: 623-632
92. Farrow D, Pyne D, Gabbett T. Skill and physiological demands of open and closed
training drills in Australian football. International Journal of Sports Science and
Coaching 2008; 3: 489-499
93. Finaud J, Scislowski V, Lac G, Durand D, Vidalin H, Robert A, Filaire E. Antioxidant
status and oxidative stress in professional rugby players: evolution throughout a
season. International Journal of Sports Medicine 2006; 27: 87-93
References
186
94. Foster C, Hector LL, Welsh R, Schrager M, Green MA, Snyder AC. Effects of
specific versus cross-training on running performance. European Journal of Applied
Physiology and Occupational Physiology 1995; 70: 367-372
95. Fuller CW, Brooks JHM, Cancea RJ, Hall J, Kemp SPT. Contact events in rugby
union and their propensity to cause injury. British Journal of Sports Medicine 2007;
41: 862-867
96. Fuller CW, Laborde F, Leather RJ, Molloy MG. International Rugby Board Rugby
World Cup 2007 injury surveillance study. British Journal of Sports Medicine 2008;
42: 452-459
97. Fuller CW, Sheerin K, Targett S. Rugby World Cup 2011: International Rugby Board
injury surveillance study. British Journal of Sports Medicine 2012, DOI:
10.1136/bjsports-2012-091155
98. Fuller CW, Taylor A, Molloy MG. Epidemiological study of injuries in international
Rugby Sevens. Clinical Journal of Sport Medicine 2010; 20: 179-184
99. Gabbett T, Ullah S, Finch C. Risk factors for contact injury in elite collision sport
athletes. Football Science 2011; 8: 312
100. Gabbett TJ. Reductions in pre-season training loads reduce training injury rates in
rugby league players. British Journal of Sports Medicine 2004; 38: 743-749
101. Gabbett TJ. Do skill-based conditioning games offer a specific training stimulus for
junior elite volleyball players? Journal of Strength and Conditioning Research 2008;
22: 509-517
102. Gabbett TJ. Influence of fatigue on tackling technique in rugby league players.
Journal of Strength and Conditioning Research 2008; 22: 625-632
103. Gabbett TJ. GPS analysis of elite women's field hockey training and competition.
Journal of Strength and Conditioning Research 2010; 24: 1321-1324
104. Gabbett TJ. Quantifying the physical demands of collision sports: does microsensor
technology measure what it claims to measure? Journal of Strength and Conditioning
Research 2013; 27: 2319-2322
105. Gabbett TJ, Jenkins DG. Relationship between training load and injury in professional
rugby league players. Journal of Science and Medicine in Sport 2011; 14: 204-209
106. Gabbett TJ, Jenkins DG, Abernethy B. Physical demands of professional rugby league
training and competition using microtechnology. Journal of Science and Medicine in
Sport 2012; 15: 80-86
References
187
107. Gabbett TJ, Mulvey MJ. Time-motion analysis of small-sided training games and
competition in elite women soccer players. Journal of Strength and Conditioning
Research 2008; 22: 543-552
108. Gaitanos GC, Williams C, Boobis LH, Brooks S. Human muscle metabolism during
intermittent maximal exercise. Journal of Applied Physiology 1993; 75: 712-719
109. Gamble P. Physical preparation for elite-level rugby union football. Strength and
Conditioning Journal 2004; 26: 10-23
110. Gamble P. A skill-based conditioning games approach to metabolic conditioning for
elite rugby football players. Journal of Strength and Conditioning Research 2004; 18:
491-497
111. Gill ND, Beaven CM, Cook C. Effectiveness of post-match recovery strategies in
rugby players. British Journal of Sports Medicine 2006; 40: 260-263
112. Girard O, Mendez-Villanueva A, Bishop D. Repeated-sprint ability - part I: factors
contributing to fatigue. Sports Medicine 2011; 41: 673-694
113. Gleeson M, McDonald WA, Pyne DB, Cripps AW, Francis JL, Fricker PA, Clancy
RL. Salivary IgA levels and infection risk in elite swimmers. Medicine and Science in
Sports and Exercise 1999; 31: 67-73
114. Gorce-Dupuy AM, Vela C, Badiou S, Bargnoux AS, Josse C, Roagna N, Delage M,
Michel F, Vernet MH, Destizons D, Cristol JP. Antioxidant and oligonutrient status,
distribution of amino acids, muscle damage, inflammation, and evaluation of renal
function in elite rugby players. Clinical Chemistry and Laboratory Medicine 2012;
50: 1777-1789
115. Granatelli G, Gabbett TJ, Briotti G, Padulo J, Buglione A, D'Ottavio S, Ruscello B.
Match analysis and temporal patterns of fatigue in rugby sevens. Journal of Strength
and Conditioning Research 2013, DOI: 10.1519/JSC.0b013e31829d23c3
116. Grant SJ, Oommen G, McColl G, Taylor J, Watkins L, Friel N, Watt I, McLean D.
The effect of ball carrying method on sprint speed in rugby union football players.
Journal of Sports Science 2003; 21: 1009-1015
117. Gregson W, Drust B, Atkinson G, Salvo VD. Match-to-match variability of high-
speed activities in Premier League soccer. International Journal of Sports Medicine
2010; 31: 237-242
118. Häkkinen K, Alen M, Kraemer WJ, Gorostiaga E, Izquierdo M, Rusko H, Mikkola J,
Häkkinen A, Valkeinen H, Kaarakainen E, Romu S, Erola V, Ahtiainen J,
Paavolainen L. Neuromuscular adaptations during concurrent strength and endurance
References
188
training versus strength training. European Journal of Applied Physiology 2003; 89:
42-52
119. Hamlin MJ, Hinckson EA, Wood MR, Hopkins WG. Simulated rugby performance at
1550-m altitude following adaptation to intermittent normobaric hypoxia. Journal of
Science and Medicine in Sport 2008; 11: 593-599
120. Hansen KT, Cronin JB, Newton MJ. The effect of cluster loading on force, velocity,
and power during ballistic jump squat training. International Journal of Sports
Physiology and Performance 2011; 6: 455-468
121. Hansen KT, Cronin JB, Newton MJ. The reliability of linear position transducer, force
plate and combined measurement of explosive power-time variables during a loaded
jump squat in elite athletes. Sports Biomechanics 2011; 10: 46-58
122. Hansen KT, Cronin JB, Pickering SL, Douglas L. Do force–time and power–time
measures in a loaded jump squat differentiate between speed performance and playing
level in elite and elite junior rugby union players? Journal of Strength and
Conditioning Research 2011; 25: 2382-2391
123. Hansen KT, Cronin JB, Pickering SL, Newton MJ. Does cluster loading enhance
lower body power development in preseason preparation of elite rugby union players?
Journal of Strength and Conditioning Research 2011; 25: 2118-2126
124. Harley JA, Lovell RJ, Barnes CA, Portas MD, Weston M. The interchangeability of
global positioning system and semiautomated video-based performance data during
elite soccer match play. Journal of Strength and Conditioning Research 2011; 25:
2334-2336
125. Harris NK, Cronin JB, Hopkins WG, Hansen KT. Relationship between sprint times
and the strength/power outputs of a machine squat jump. Journal of Strength and
Conditioning Research 2008; 22: 691-698
126. Harrison AJ, Bourke G. The effect of resisted sprint training on speed and strength
performance in male rugby players. Journal of Strength and Conditioning Research
2009; 23: 275-283
127. Harriss DJ, Atkinson G. Update - Ethical standards in sport and exercise science
research. International Journal of Sports Medicine 2011; 32: 819-821
128. Hartwig TB, Naughton G, Searl J. Motion analyses of adolescent rugby union players:
a comparison of training and game demands. Journal of Strength and Conditioning
Research 2011; 25: 966-972
References
189
129. Havenith G, van Middendorp H. The relative influence of physical fitness,
acclimatization state, anthropometric measures and gender on individual reactions to
heat stress. European Journal of Applied Physiology and Occupational Physiology
1990; 61: 419-427
130. Hendricks S, Karpul D, Nicolls F, Lambert M. Velocity and acceleration before
contact in the tackle during rugby union matches. Journal of Sports Sciences 2012;
30: 1215-1224
131. Higham DG, Pyne DB, Anson JM, Dziedzic CE, Slater GJ. Distribution of fat, non-
osseous lean and bone mineral mass in international Rugby Union and Rugby Sevens
players. International Journal of Sports Medicine 2014; in press
132. Higham DG, Pyne DB, Anson JM, Eddy A. Movement patterns in rugby sevens:
effects of tournament level, fatigue and substitute players. Journal of Science and
Medicine in Sport 2012; 15: 277-282
133. Higham DG, Pyne DB, Anson JM, Eddy A. Physiological, anthropometric and
performance characteristics of rugby sevens players. International Journal of Sports
Physiology and Performance 2013; 8: 19-27
134. Higham DG, Pyne DB, Anson JM, Hopkins WG, Eddy A. Comparison of activity
profiles and physiological demands between international rugby sevens matches and
training. Journal of Strength and Conditioning Research 2013; in press
135. Higham DG, Pyne DB, Mitchell JA. Rugby union players. In: Tanner RK, Gore CJ
(eds), Physiological Tests for Elite Athletes. second ed. Champaign, IL: Human
Kinetics; 2012
136. Hills AP, Byrne NM, Ramage AJ. Submaximal markers of exercise intensity. Journal
of Sports Sciences 1998; 16: 71-76
137. Hinckson EA, Hamlin MJ, Wood MR, Hopkins WG. Game performance and
intermittent hypoxic training. British Journal of Sports Medicine 2007; 41: 537-539
138. Hooper JJ, James SD, Jones DC, Lee DM, Gál JM. The influence of training with
heavy rugby balls on selected spin pass variables in youth rugby union players.
Journal of Science and Medicine in Sport 2008; 11: 209-213
139. Hopkins WG. Measures of reliability in sports medicine and science. Sports Medicine
2000; 30: 1-15
140. Hopkins WG, Hawley JA, Burke LM. Design and analysis of research on sport
performance enhancement. Medicine and Science in Sports and Exercise 1999; 31:
472-485
References
190
141. Hopkins WG, Marshall SW, Batterham AM, Hanin J. Progressive statistics for studies
in sports medicine and exercise science. Medicine and Science in Sports and Exercise
2009; 41: 3-12
142. Howatson G, Milak A. Exercise-induced muscle damage following a bout of sport
specific repeated sprints. Journal of Strength and Conditioning Research 2009; 23:
2419-2424
143. Hughes M, Franks IM. Notational analysis - a review of the literature. In: Hughes M,
Franks IM (eds), Notational analysis of sport: systems for better coaching and
performance in sport. 2nd ed. London, UK: Routledge; 2004: 59-106
144. Hughes M, Jones R. Patterns of play of successful and unsuccesful teams in men's 7-
a-side rugby union. In: Reilly T, Cabri J, Araújo D (eds), Science and Football V: The
Proceedings of the Fifth World Congress on Science and Football. London:
Routledge; 2005: 247-252
145. Hughes M, Jones R. Patterns of play in men’s elite 7-a-side rugby union. Journal of
Sports Science and Medicine 2007; 6: 13
146. Hughes MD, Bartlett RM. The use of performance indicators in performance analysis.
Journal of Sports Sciences 2002; 20: 739-754
147. Impellizzeri FM, Marcora SM. Test validation in sport physiology: lessons learned
from clinimetrics. International Journal of Sports Physiology and Performance 2009;
4: 269-277
148. International Rugby Board. Dates set for 2010/11 IRB Sevens World Series. 2010.
Retrieved 15 August, 2010, from
http://www.irbsevens.com/news/newsid=2037992.html
149. International Rugby Board. 2011/12 HSBC Sevens World Series statistical review
overall. 2012. Available from:
http://www.irb.com/mm/document/newsmedia/mediazone/02/06/33/07/201112hsbcse
vensoverallreport.pdf
150. James N, Mellalieu SD, Jones NMP. The development of position-specific
performance indicators in professional rugby union. Journal of Sports Sciences 2005;
23: 63-72
151. Jennings D, Cormack S, Coutts AJ, Boyd L, Aughey RJ. The validity and reliability
of GPS units for measuring distance in team sport specific running patterns.
International Journal of Sports Physiology and Performance 2010; 5: 328-341
References
191
152. Jones NMP, James N, Mellalieu SD. An objective method for depicting team
performance in elite professional rugby union. Journal of Sports Sciences 2008; 26:
691-700
153. Jones NMP, Mellalieu SD, James N. Team performance indicators as a function of
winning and losing in rugby union. International Journal of Performance Analysis in
Sport 2004; 4: 61-71
154. Keim NL, Beiko AZ, Barbieri TF. Body fat percentage and gender: associations with
exercise energy expenditure, substrate utilization, and mechanical work efficiency.
International Journal of Sport Nutrition 1996; 6: 356-369
155. Kilduff LP, Bevan H, Owen N, Kingsley MIC, Bunce P, Bennett M, Cunningham D.
Optimal loading for peak power output during the hang power clean in professional
rugby players. International Journal of Sports Physiology and Performance 2007; 2:
260-269
156. Kilduff LP, Bevan HR, Kingsley MIC, Owen NJ, Bennett MA, Bunce PJ, Hore AM,
Maw JR, Cunningham DJ. Postactivation potentiation in professional rugby players:
optimal recovery. Journal of Strength and Conditioning Research 2007; 21: 1134-
1138
157. Kilduff LP, Owen N, Bevan H, Bennett M, Kingsley MIC, Cunningham D. Influence
of recovery time on post-activation potentiation in professional rugby players. Journal
of Sports Sciences 2008; 26: 795-802
158. Kirkendall DT. Mechanisms of peripheral fatigue. Medicine and Science in Sports
and Exercise 1990; 22: 444-449
159. Knuttgen HG, Kraemer WJ. Terminology and measurement in exercise performance.
Journal of Strength and Conditioning Research 1987; 1: 1-10
160. Kumagai K, Abe T, Brechue WF, Ryushi T, Takano S, Mizuno M. Sprint
performance is related to muscle fascicle length in male 100-m sprinters. Journal of
Applied Physiology 2000; 88: 811-816
161. Laird P, Lorimer R. An examination of try scoring in rugby union: a review of
international rugby statistics. International Journal of Performance Analysis in Sport
2004; 4: 72-80
162. Lammert O, Grunnet N, Faber P, Bjørnsbo KS, Dich J, Larsen LO, Neese RA,
Hellerstein MK, Quistorff B. Effects of isoenergetic overfeeding of either
carbohydrate or fat in young men. British Journal of Nutrition 2000; 84: 233-245
References
192
163. LeSuer DA, McCormick JH, Mayhew JL, Wasserstein RL, Arnold MD. The accuracy
of prediction equations for estimating 1-RM performance in the bench press, squat,
and deadlift. Journal of Strength and Conditioning Research 1997; 11: 211-213
164. Lim E, Lay B, Dawson B, Wallman K, Aanderson S. Development of a player impact
ranking matrix in Super 14 rugby union. International Journal of Performance
Analysis in Sport 2009; 9: 354-367
165. Lim E, Lay B, Dawson B, Wallman K, Anderson S. Predicting try scoring in super 14
rugby union - the development of a superior attacking team scoring system.
International Journal of Performance Analysis in Sport 2011; 11: 464-475
166. Little T, Williams AG. Effects of sprint duration and exercise: rest ratio on repeated
sprint performance and physiological responses in professional soccer players.
Journal of Strength and Conditioning Research 2007; 21: 646-648
167. Little T, Williams AG. Measures of exercise intensity during soccer training drills
with professional soccer players. Journal of Strength and Conditioning Research
2007; 21: 367-371
168. Lombard AJJ. Strength and energetics of elite rugby union players. African Journal
for Physical, Health Education, Recreation and Dance 2003; 9: 89-99
169. Malina RM, Mueller WH, Bouchard C, Shoup RF, Lariviere G. Fatness and fat
patterning among athletes at the Montreal Olympic Games, 1976. Medicine and
Science in Sports and Exercise 1982; 14: 445-452
170. Marfell-Jones M, Olds T, Stewart A, Carter L. International standards for
anthropometric assessment. Potchefstroom, South Africa: ISAK; 2006
171. Mashiko T, Umeda T, Nakaji S, Sugawara K. Position related analysis of the
appearance of and relationship between post-match physical and mental fatigue in
university rugby football players. British Journal of Sports Medicine 2004; 38: 617-
621
172. Maso F, Cazorla G, Godemet M, Lac G, Robert A. Physiological features of rugby
players of French team. Science and Sports 2002; 17: 297-301
173. Maso F, Lac G, Filaire E, Michaux O, Robert A. Salivary testosterone and cortisol in
rugby players: correlation with psychological overtraining items. British Journal of
Sports Medicine 2004; 38: 260-263
174. Meeusen R, Duclos M, Gleeson M, Rietjens G, Steinacker J, Urhausen A. Prevention,
diagnosis and treatment of the overtraining syndrome: ECSS position statement ‘task
force’. European Journal of Sport Science 2006; 6: 1-14
References
193
175. Meir R. Training for and competing in sevens rugby: practical considerations from
experience in the International Rugby Board World Series. Strength and Conditioning
Journal 2012; 34: 76-86
176. Meir RA, Brooks LO, Rogerson S. What do changes in prematch vs. postmatch, 1, 2,
and 3 days postmatch body weight tell us about fluid status in English Premiership
rugby union players? Journal of Strength and Conditioning Research 2011; 25: 2337-
2343
177. Meir RA, Halliday AJ. Pre- and post-game body mass changes during an international
rugby tournament: A practical perspective. Journal of Strength and Conditioning
Research 2005; 19: 713-716
178. Mendez-Villanueva A, Hamer P, Bishop D. Fatigue in repeated-sprint exercise is
related to muscle power factors and reduced neuromuscular activity. European
Journal of Applied Physiology 2008; 103: 411-419
179. Milburn PD. Biomechanics of rugby union scrummaging. Technical and safety issues.
Sports Medicine 1993; 16: 168-179
180. Minett G, Duffield R, Bird SP. Effects of acute multinutrient supplementation on
rugby union game performance and recovery. International Journal of Sports
Physiology and Performance 2010; 5: 27-41
181. Mohr M, Krustrup P, Bangsbo J. Match performance of high-standard soccer players
with special reference to development of fatigue. Journal of Sports Sciences 2003; 21:
519-528
182. Morel B, Hautier C, Rouffet D. Repeated sprint ability task dependency: the effect of
rugby union specific tasks. In: Meeusen R, Duchatteau J, Roelands B, De Geus B,
Baudry S, Tsolakidis E eds, 17th Annual Congress of the European College of Sport
Science. Bruges, Belgium; 2012
183. Mueller WH, Shoup RF, Malina RM. Fat patterning in athletes in relation to ethnic
origin and sport. Annals of Human Biology 1982; 9: 371-376
184. Nana A, Slater GJ, Hopkins WG, Burke LM. Effects of daily activities on dual-energy
X-ray absorptiometry measurements of body composition in active people. Medicine
and Science in Sports and Exercise 2012; 44: 180-189
185. Nana A, Slater GJ, Hopkins WG, Burke LM. Techniques for undertaking dual-energy
X-ray absorptiometry whole-body scans to estimate body composition in tall and/or
broad subjects. International Journal of Sport Nutrition and Exercise Metabolism
2012; 22: 313-322
References
194
186. Nevill AM, Bate S, Holder RL. Modeling physiological and anthropometric variables
known to vary with body size and other confounding variables. American Journal of
Physical Anthropology 2005; 128: 141-153
187. Nicholas CW. Anthropometric and physiological characteristics of rugby union
football players. Sports Medicine 1997; 23: 375-396
188. Nicholls AR, McKenna J, Polman RCJ, Backhouse SH. Overtraining during
preseason: stress and negative affective states among professional rugby union
players. Journal of Clinical Sport Psychology 2011; 5: 211-222
189. Nimphius S, McGuigan MR, Newton RU. Relationship between strength, power,
speed, and change of direction performance of female softball players. Journal of
Strength and Conditioning Research 2010; 24: 885-895
190. Nindl BC, Friedl KE, Marchitelli LJ, Shippee RL, Thomas CD, Patton JF. Regional
fat placement in physically fit males and changes with weight loss. Medicine and
Science in Sports and Exercise 1996; 28: 786-793
191. Nirmalendran R, Ingle L. Detraining effect of the post-season on selected aerobic and
anaerobic performance variables in national league rugby union players: A focus on
positional status. Medicina Sportiva 2010; 14: 161-168
192. O'Gorman D, Hunter A, McDonnacha C, Kirwan JP. Validity of field tests for
evaluating endurance capacity in competitive and international-level sports
participants. Journal of Strength and Conditioning Research 2000; 14: 62-67
193. Olds T. The evolution of physique in male rugby union players in the twentieth
century. Journal of Sports Sciences 2001; 19: 253-262
194. Oliver JL. Is a fatigue index a worthwhile measure of repeated sprint ability? Journal
of Science and Medicine in Sport 2009; 12: 20-23
195. Ortega E, Villarejo D, Palao JM. Differences in game statistics between winning and
losing rugby teams in the Six Nations Tournament. Journal of Sports Science and
Medicine 2009; 8: 523-527
196. Osgnach C, Poser S, Bernardini R, Rinaldo R, di Prampero PE. Energy cost and
metabolic power in elite soccer: a new match analysis approach. Medicine and
Science in Sports and Exercise 2010; 42: 170-178
197. Passos P, Araújo D, Davids K, Gouveia L, Milho J, Serpa S. Information-governing
dynamics of attacker-defender interactions in youth rugby union. Journal of Sports
Sciences 2008; 26: 1421-1429
References
195
198. Passos P, Araújo D, Davids K, Shuttleworth R. Manipulating constraints to train
decision making in Rugby Union. International Journal of Sports Science and
Coaching 2008; 3: 125-140
199. Petersen C, Pyne D, Portus M, Dawson B. Validity and reliability of GPS units to
monitor cricket-specific movement patterns. International Journal of Sports
Physiology and Performance 2009; 4: 381-393
200. Petersen CJ, Pyne DB, Dawson BT, Kellett AD, Portus MR. Comparison of training
and game demands of national level cricketers. Journal of Strength and Conditioning
Research 2011; 25: 1306-1311
201. Pond CM. The fats of life. Cambridge, UK: Cambridge University Press; 1998: 214-
216
202. Prim S, van Rooyen M, Lambert M. A comparison of performance indicators between
the four South African teams and the winners of the 2005 Super 12 Rugby
competition. What separates top from bottom? International Journal of Performance
Analysis in Sport 2006; 6: 126-133
203. Pyne DB, Saunders PU, Montgomery PG, Hewitt AJ, Sheehan K. Relationships
between repeated sprint testing, speed, and endurance. Journal of Strength and
Conditioning Research 2008; 22: 1633-1637
204. Quarrie KL, Handcock P, Waller AE, Chalmers DJ, Toomey MJ, Wilson BD. The
New Zealand rugby injury and performance project. III. Anthropometric and physical
performance characteristics of players. British Journal of Sports Medicine 1995; 29:
263-270
205. Quarrie KL, Hopkins WG. Changes in player characteristics and match activities in
Bledisloe Cup rugby union from 1972 to 2004. Journal of Sports Sciences 2007; 25:
895-903
206. Quarrie KL, Hopkins WG. Tackle injuries in professional rugby union. The American
Journal of Sports Medicine 2008; 36: 1705-1716
207. Quarrie KL, Hopkins WG, Anthony MJ, Gill ND. Positional demands of international
rugby union: Evaluation of player actions and movements. Journal of Science and
Medicine in Sport 2013; 16: 353–359
208. Quarrie KL, Wilson BD. Force production in the rugby union scrum. Journal of
Sports Sciences 2000; 18: 237-246
References
196
209. Rampinini E, Impellizzeri FM, Castagna C, Coutts AJ, Wisløff U. Technical
performance during soccer matches of the Italian Serie A league: effect of fatigue and
competitive level. Journal of Science and Medicine in Sport 2009; 12: 227-233
210. Randell AD, Cronin JB, Keogh JWL, Gill ND, Pedersen MC. Effect of instantaneous
performance feedback during 6 weeks of velocity-based resistance training on sport-
specific performance tests. Journal of Strength and Conditioning Research 2011; 25:
87-93
211. Randers MB, Mujika I, Hewitt A, Santisteban J, Bischoff R, Solano R, Zubillaga A,
Peltola E, Krustrup P, Mohr M. Application of four different football match analysis
systems: A comparative study. Journal of Sports Sciences 2010; 28: 171-182
212. Reilly T. The physiology of rugby union football. Biology of Sport 1997; 14: 83-101
213. Reilly T. Assessment of sports performance with particular reference to field games.
European Journal of Sport Science 2001; 1: 1-12
214. Reilly T, Waterhouse J, Edwards B. Jet lag and air travel: implications for
performance. Clinics in Sports Medicine 2005; 24: 367-380
215. Rienzi E, Pérez M, Stefani M, Maiuri C, Rodríguez G. Anthropometric characteristics
of Rugby Sevens players: an evaluation during two consecutive international events.
In: Marfell-Jones M, Reilly T (eds), Kinanthropometry VIII: Proceedings of the 8th
International Conference of the International Society for the Advancement of
Kinanthropometry (ISAK). London, UK: Routledge; 2003: 129-142
216. Rienzi E, Reilly T, Malkin C. Investigation of anthropometric and work-rate profiles
of Rugby Sevens players. The Journal of Sports Medicine and Physical Fitness 1999;
39: 160-164
217. Roberts S, Trewartha G, Stokes K. A comparison of time-motion analysis methods for
field-based sports. International Journal of Sports Physiology and Performance 2006;
1: 388-399
218. Roberts SP, Stokes KA, Trewartha G, Doyle J, Hogben P, Thompson D. Effects of
carbohydrate and caffeine ingestion on performance during a rugby union simulation
protocol. Journal of Sports Sciences 2010; 28: 833-842
219. Roberts SP, Stokes KA, Weston L, Trewartha G. The Bath University Rugby Shuttle
Test (BURST): a pilot study. International Journal of Sports Physiology and
Performance 2010; 5: 64-74
220. Roberts SP, Trewartha G, Higgitt RJ, El-Abd J, Stokes KA. The physical demands of
elite English rugby union. Journal of Sports Sciences 2008; 26: 825-833
References
197
221. Royer TD, Martin PE. Manipulations of leg mass and moment of inertia: Effects on
energy cost of walking. Medicine and Science in Sports and Exercise 2005; 37: 649-
656
222. Sayers MGL. Kinematic analysis of line-out throwing in elite international rugby
union. Journal of Sports Science and Medicine 2011; 10: 553-558
223. Sayers MGL, Washington-King J. Characteristics of effective ball carries in Super 12
rugby. International Journal of Performance Analysis in Sport 2005; 5: 92-106
224. Scafoglieri A, Provyn S, Wallace J, Louis O, Tresignie J, Bautmans I, De Mey J,
Clarys JP. Whole body composition by Hologic QDR 4500/A DXA: system
reliability versus user accuracy and precision. In: Ivanov O ed, Applications and
Experiences of Quality Control: InTech; 2011: 45-62
225. Schoenfeld BJ. The mechanisms of muscle hypertrophy and their application to
resistance training. Journal of Strength and Conditioning Research 2010; 24: 2857-
2872
226. Schwellnus MP, Derman WE, Jordaan E, Page T, Lambert MI, Readhead C, Roberts
C, Kohler R, Collins R, Kara S, Morris MI, Strauss O, Webb S. Elite athletes
travelling to international destinations >5 time zone differences from their home
country have a 2–3-fold increased risk of illness. British Journal of Sports Medicine
2012; 46: 816-821
227. Scott AC, Roe N, Coats AJS, Piepoli MF. Aerobic exercise physiology in a
professional rugby union team. International Journal of Cardiology 2003; 87: 173-
177
228. Sedeaud A, Marc A, Schipman J, Tafflet M, Hager J, Toussaint J. How they won
Rugby World Cup through height, mass and collective experience. British Journal of
Sports Medicine 2012; 46: 580-584
229. Sedeaud A, Vidalin H, Tafflet M, Marc A, Toussaint J. Rugby morphologies: "bigger
and taller", reflects an early directional selection. The Journal of Sports Medicine and
Physical Fitness 2013; 53: 185-191
230. Selkirk GA, McLellan TM. Influence of aerobic fitness and body fatness on tolerance
to uncompensable heat stress. Journal of Applied Physiology 2001; 91: 2055-2063
231. Shepherd JA, Fan B, Lu Y, Wu XP, Wacker WK, Ergun DL, Levine MA. A
multinational study to develop universal standardization of whole‐body bone density
and composition using GE Healthcare Lunar and Hologic DXA systems. Journal of
Bone and Mineral Research 2012; 27: 2208-2216
References
198
232. Slater GJ, Duthie GM, Pyne DB, Hopkins WG. Validation of a skinfold based index
for tracking proportional changes in lean mass. British Journal of Sports Medicine
2006; 40: 208-213
233. Sleivert G, Taingahue M. The relationship between maximal jump-squat power and
sprint acceleration in athletes. European Journal of Applied Physiology 2004; 91: 46-
52
234. Smart D, Hopkins WG, Quarrie KL, Gill N. The relationship between physical fitness
and game behaviours in rugby union players. European Journal of Sport Science
2011, DOI: 10.1080/17461391.2011.635812
235. Smart DJ, Gill ND. Effects of an off-season conditioning program on the physical
characteristics of adolescent rugby union players. Journal of Strength and
Conditioning Research 2013; 27: 708-717
236. Smart DJ, Gill ND, Beaven CM, Cook CJ, Blazevich AJ. The relationship between
changes in interstitial creatine kinase and game-related impacts in rugby union.
British Journal of Sports Medicine 2008; 42: 198-201
237. Sparks M, Coetzee B. The use of heart rates and graded maximal test values to
determine rugby union game intensities. Journal of Strength and Conditioning
Research 2013; 27: 507-513
238. Spinks CD, Murphy AJ, Spinks WL, Lockie RG. The effects of resisted sprint
training on acceleration performance and kinematics in soccer, rugby union, and
Australian football players. Journal of Strength and Conditioning Research 2007; 21:
77-85
239. Suarez-Arrones L, Arenas C, López G, Requena B, Terrill O, Mendez-Villanueva A.
Positional differences in match running performance and physical collisions in men
rugby sevens. International Journal of Sports Physiology and Performance 2013; in
press
240. Suarez-Arrones L, Nuñez FJ, Portillo J, Mendez-Villanueva A. Match running
performance and exercise intensity in elite female Rugby Sevens. Journal of Strength
and Conditioning Research 2012; 26: 1858-1862
241. Suarez-Arrones LJ, Nuñez FJ, Portillo J, Mendez-Villanueva A. Running demands
and heart rate responses in men rugby sevens. Journal of Strength and Conditioning
Research 2012; 26: 3155–3159
References
199
242. Suárez-Arrones LJ, Portillo LJ, González-Ravé JM, Muñoz VE, Sanchez F. Match
running performance in Spanish elite male rugby union using global positioning
system. Isokinetics and Exercise Science 2012; 20: 77-83
243. Suzuki M, Umeda T, Nakaji S, Shimoyama T, Mashiko T, Sugawara K. Effect of
incorporating low intensity exercise into the recovery period after a rugby match.
British Journal of Sports Medicine 2004; 38: 436-440
244. Takahashi I, Umeda T, Mashiko T, Chinda D, Oyama T, Sugawara K, Nakaji S.
Effects of rugby sevens matches on human neutrophil-related non-specific immunity.
British Journal of Sports Medicine 2007; 41: 13-18
245. Takarada Y. Evaluation of muscle damage after a rugby match with special reference
to tackle plays. British Journal of Sports Medicine 2003; 37: 416-419
246. Taylor JB, Mellalieu SD, James N. A comparison of individual and unit tactical
behaviour and team strategy in professional soccer. International Journal of
Performance Analysis in Sport 2005; 5: 87-101
247. Taylor JB, Mellalieu SD, James N, Shearer DA. The influence of match location,
quality of opposition, and match status on technical performance in professional
association football. Journal of Sports Sciences 2008; 26: 885-895
248. Taylor JL, Gandevia SC. A comparison of central aspects of fatigue in submaximal
and maximal voluntary contractions. Journal of Applied Physiology 2008; 104: 542-
550
249. Tenga A, Holme I, Ronglan LT, Bahr R. Effect of playing tactics on goal scoring in
Norwegian professional soccer. Journal of Sports Sciences 2010; 28: 237-244
250. Thomas NE, Baker JS. Optimised and non-optimised high intensity cycle ergometry
and running ability in international rugby union players. Journal of Exercise
Physiology-online 2005; 8: 26-35
251. Thompson D, Nicholas CW, Williams C. Muscular soreness following prolonged
intermittent high-intensity shuttle running. Journal of Sports Sciences 1999; 17: 387-
395
252. Tiidus PM, Ianuzzo CD. Effects of intensity and duration of muscular exercise on
delayed soreness and serum enzyme activities. Medicine and Science in Sports and
Exercise 1983; 15: 461-465
253. Tomlin DL, Wenger HA. The relationship between aerobic fitness and recovery from
high intensity intermittent exercise. Sports Medicine 2001; 31: 1-11
References
200
254. Turner AP, Unholz CN, Potts N, Coleman SGS. Peak power, force, and velocity
during jump squats in professional rugby players. Journal of Strength and
Conditioning Research 2012; 26: 1594-1600
255. Vaile J, Halson S, Gill N, Dawson B. Effect of hydrotherapy on recovery from
fatigue. International Journal of Sports Medicine 2008; 29: 539-544
256. van Rooyen M, Rock K, Prim S, Lambert M. The quantification of contacts with
impact during professional rugby matches. International Journal of Performance
Analysis in Sport 2008; 8: 113-126
257. van Rooyen M, Yasin N, Viljoen W. Characteristics of an ‘effective’ tackle outcome
in Six Nations rugby. European Journal of Sport Science 2012, DOI:
10.1080/17461391.2012.738710
258. van Rooyen MK. A statistical analysis of tackling performance during international
rugby union matches from 2011. International Journal of Performance Analysis in
Sport 2012; 12: 517-530
259. van Rooyen MK, Diedrick E, Noakes TD. Ruck frequency as a predictor of success in
the 2007 Rugby World Cup tournament. International Journal of Performance
Analysis in Sport 2010; 10: 33-46
260. van Rooyen MK, Lambert MI, Noakes TD. A Retrospective analysis of the IRB
statistics and video analysis of match play to explain the performance of four teams in
the 2003 Rugby World Cup. International Journal of Performance Analysis in Sport
2006; 6: 57-72
261. van Rooyen MK, Lombard C, Noakes TD. Playing demands of sevens rugby during
the 2005 Rugby World Cup Sevens tournament. International Journal of
Performance Analysis in Sport 2008; 8: 114-123
262. Varley MC, Fairweather IH, Aughey RJ. Validity and reliability of GPS for
measuring instantaneous velocity during acceleration, deceleration, and constant
motion. Journal of Sports Sciences 2012; 30: 121-127
263. Vaz L, Mouchet A, Carreras D, Morente H. The importance of rugby game-related
statistics to discriminate winners and losers at the elite level competitions in close and
balanced games. International Journal of Performance Analysis in Sport 2011; 11:
130-141
264. Vaz L, van Rooyen M, Sampaio J. Rugby game-related statistics that discriminate
between winning and losing teams in IRB and Super twelve close games. Journal of
Sports Science and Medicine 2010; 9: 51-55
References
201
265. Venter RE, Opperman E, Opperman S. The use of Global Positioning System (GPS)
tracking devices to assess movement demands and impacts in under-19 rugby union
match play. African Journal for Physical, Health Education, Recreation and Dance
2011; 17: 1-8
266. Vivian R, Mullen R, Hughes MD. Performance profiles at league, European Cup and
International levels of male rugby union players, with specific reference to flankers,
number 8s and number 9s. In: Hughes MD, Franks I (eds), Passcom: Fifth World
Congress of Performance Analysis of Sport. Cardiff, U.K.: University of Wales
Institute, Cardiff; 2001
267. von Duvillard SP. Exercise lactate levels: simulation and reality of aerobic and
anaerobic metabolism. European Journal of Applied Physiology 2001; 86: 3-5
268. Walsh M, Young B, Hill B, Kittredge K, Horn T. The effect of ball-carrying
technique and experience on sprinting in rugby union. Journal of Sports Sciences
2007; 25: 185-192
269. Warrington G, Ryan C, Murray F, Duffy P, Kirwan JP. Physiological and metabolic
characteristics of elite tug of war athletes. British Journal of Sports Medicine 2001;
35: 396-401
270. Waterhouse J, Atkinson G, Edwards B, Reilly T. The role of a short post-lunch nap in
improving cognitive, motor, and sprint performance in participants with partial sleep
deprivation. Journal of Sports Sciences 2007; 25: 1557-1566
271. West DJ, Cunningham DJ, Bracken RM, Bevan HR, Crewther BT, Cook CJ, Kilduff
LP. Effects of resisted sprint training on acceleration in professional rugby union
players. Journal of Strength and Conditioning Research 2013; 27: 1014-1018
272. Wheeler K, Sayers M. Contact skills predicting tackle-breaks in rugby union.
International Journal of Sports Science and Coaching 2009; 4: 535-544
273. Wheeler KW, Askew CD, Sayers MG. Effective attacking strategies in rugby union.
European Journal of Sport Science 2010; 10: 237-242
274. Wheeler KW, Sayers MGL. Modification of agility running technique in reaction to a
defender in rugby union. Journal of Sports Science and Medicine 2010; 9: 445-451
275. Wheeler KW, Sayers MGL. Rugby union contact skills alter evasive agility
performance during attacking ball carries. International Journal of Sports Science and
Coaching 2011; 6: 419-432
References
202
276. Williams J, Hughes M, O'Donoghue P. The effect of rule changes on match and ball
in play time in rugby union. International Journal of Performance Analysis in Sport
2005; 5: 1-11
277. Withers RT, Craig NP, Bourdon PC, Norton KI. Relative body fat and anthropometric
prediction of body density of male athletes. European Journal of Applied Physiology
and Occupational Physiology 1987; 56: 191-200
278. Young W, McLean B, Ardagna J. Relationship between strength qualities and
sprinting performance. The Journal of Sports Medicine and Physical Fitness 1995;
35: 13-19
Appendix A – Performance Nutrition Guidelines for International Rugby Sevens Tournaments
203
Appendix A – Performance Nutrition Guidelines for
International Rugby Sevens Tournaments
Dziedzic, C.E. & Higham, D.G. (2014). Performance nutrition guidelines for international
rugby sevens competition. International Journal of Sport Nutrition and Exercise Metabolism.
(in press).
Christine E. Dziedzic1 and Dean G. Higham
2,3
1 Sports Nutrition, Australian Institute of Sport, Canberra, Australia
2 Physiology, Australian Institute of Sport, Canberra, Australia
3 National Institute of Sport Studies, University of Canberra, Canberra, Australia
Abstract
Rugby sevens is an abbreviated version of rugby union, played by teams of seven players
over 7-min halves. International competitions are usually played in a tournament format.
While shorter in duration, the movement demands of rugby sevens per min of match time are
greater than rugby union, resulting in an accentuated load on players. This load can be
repeated up to six times over a typical 2- or 3-day competition period. The potential
cumulative effect of inadequate carbohydrate, protein and/or fluid intake over the course of a
tournament is the greatest nutrition-related concern for players. Nutritional strategies prior to
and during competition are suggested to replenish substrate stores, maintain fluid balance and
promote recovery between matches. The use of ergogenic aids known to enhance
intermittent, high-intensity activity and/or the execution of motor skills may be advantageous
to rugby sevens performance and is discussed. This review provides a best-practice model of
nutritional support for international rugby sevens competition based on our current
understanding of the sport combined with pragmatic guidelines and considerations for the
practitioner.
Key words: rugby union, competition, physiological demands, supplements, nutritional
strategies, recovery
Appendix A – Performance Nutrition Guidelines for International Rugby Sevens Tournaments
204
Introduction
Rugby sevens is an abbreviated version of rugby union, played by teams of seven players
over 7-min halves. A rugby sevens team is composed of three forwards, four backs and five
replacements/substitutes. Given the importance of speed and agility in rugby sevens
(Higham, Pyne, Anson, & Eddy, 2013; van Rooyen, Lombard, & Noakes, 2008), teams
usually consist of mobile players that may compete as backs or loose forwards in 15-player
rugby union. Rugby sevens has traditionally been utilised as part of the development pathway
for younger players to progress to professional and international rugby union. However,
given the burgeoning international popularity of rugby sevens and the differences in tactics,
skills and physical demands between rugby union and rugby sevens, players are increasingly
specialising in one of the two formats (Fuller, Taylor, & Molloy, 2010; Higham et al., 2013).
International men’s rugby sevens has been contested in the annual International Rugby Board
(IRB) Sevens World Series since 1999. In 2012, the corresponding IRB Women’s Sevens
World Series was introduced. The Rugby World Cup Sevens tournament has also been
contested every four years since its inception in 1993. The global profile and participation
rates of rugby sevens are likely to increase following the introduction of men’s and women’s
competition at the 2016 Olympic Games. The sport’s Olympic debut compliments other
multi-sport events where rugby sevens is currently played, such as the Commonwealth
Games, Asian Games, Pacific Games, Pan American Games and World Games.
After considering players’ typical training patterns and physique characteristics, this review
will focus on the physiological demands of competition and subsequent nutritional strategies
that promote optimal performance in an international rugby sevens tournament. While the
potential challenges faced by players training for and competing in both rugby union and
rugby sevens are highlighted, it is beyond the scope of this review to detail energy and
nutrient requirements for such players.
Due to limited literature detailing the physique characteristics of female players and
physiological demands of women’s rugby sevens competition (Suarez-Arrones, Nuñez,
Portillo, & Mendez-Villanueva, 2012), the guidelines presented in this review have been
developed based primarily on research describing the demands of international men’s
competition. Although it is necessary to consider sex-specific physique traits and training
patterns, the nutrition guidelines and strategies for international competition may be equally
Appendix A – Performance Nutrition Guidelines for International Rugby Sevens Tournaments
205
applicable to both male and female athletes, especially given they are presented relative to
body mass.
Typical Training Patterns
Although there is increasing specialisation and professionalism in international rugby sevens,
many players concurrently compete in rugby sevens and rugby union. Training for both rugby
union and rugby sevens introduces many challenges including potentially competing
demands, disparity in training objectives, and differences in the timing of competitive seasons
(Higham et al., 2013). Players typically complete a periodised training programme combining
rugby union training with additional sevens-specific conditioning. Sevens-specific sessions
aim to develop speed, agility, and aerobic and anaerobic endurance. Strength and power
characteristics are trained within a resistance-training programme periodised throughout the
year. Most days of the week players will complete one to three sessions per day of 45–90 min
duration, including on-field sessions as well as gym-based resistance training. Depending on
training objectives, players’ running volume may range from 2–6.5 km per session completed
at ~60–90 m·min-1
(D.G. Higham, unpublished observations). While the gross movement
intensity per min of training is similar to that reported for a 15-player rugby union match
(Cahill, Lamb, Worsfold, Headey, & Murray, 2013; Cunniffe, Proctor, Baker, & Davies,
2009), work-to-rest ratios within training sessions are highly variable and physical contact
demands are typically lower (Higham, Pyne, Anson, Hopkins, & Eddy, in press).
The greater volume and intensity of rugby sevens training compared with typical rugby union
training practices increase the relative need for daily energy and macronutrient intake for
recovery between sessions and maintenance of muscle mass.
Competition
In contrast to the traditional league-style format of rugby union competition where a
maximum of two matches are usually played in any 7-day period, international rugby sevens
competitions are typically played in a tournament format. The pre-eminent men’s rugby
sevens competition is the IRB Sevens World Series, which comprises nine tournaments
played around the world. Each tournament is contested by either 12 or 16 teams over a 2- or
3-day schedule. Teams play three matches in the pool stage on the first, or first and second
day, then, depending on results, up to three matches during the knockout stages on the final
day. Typical tournament scheduling includes periods of three to four hours between matches
on the same day.
Appendix A – Performance Nutrition Guidelines for International Rugby Sevens Tournaments
206
Unlike most team sports where nutrition support for competition occurs around a single
match, rugby sevens players must consider eating and drinking around a 2- or 3-day multi-
match tournament. Nutritional strategies that optimise muscle glycogen and fluid status prior
to a tournament and promote rapid recovery following each match need to be utilised.
Practical issues such as gastrointestinal comfort require consideration.
Movement Patterns and Physiological Demands
Although the duration of a rugby sevens match is considerably shorter than the 80 min of a
rugby union match, relative to match time, male rugby sevens players cover ~20–45% greater
distance (Higham, Pyne, Anson, & Eddy, 2012; Suarez-Arrones, Nuñez, Portillo, & Mendez-
Villanueva, 2012). During a full match, rugby sevens players cover ~1400–2000 m at a mean
intensity of 96–120 m·min-1
(Higham et al., 2012; Higham, Pyne, Anson, Hopkins, et al., in
press). Furthermore, rugby sevens players spend a higher proportion of the match running at
high velocity (Suarez-Arrones et al., 2012) and cover more than double the distance at high
velocity per min of match time than rugby union players (Higham et al., 2012). Although no
published data currently exist comparing the intensity of tackles, scrums, rucks and mauls
between rugby sevens and rugby union, it is likely the contact demands of rugby sevens are
lower than rugby union. Nevertheless, the greater relative running volume and intensity
observed in rugby sevens competition suggest the physiological demands of match-play are
accentuated and that rugby sevens elicits a high physical load compared with rugby union
competition (Higham et al., 2012; Rienzi, Reilly, & Malkin, 1999; Takahashi et al., 2007).
Depending on player substitutions and rotations, this load can be repeated on two more
occasions during the pool stage and again up to three times on the final day of competition.
Although no published information currently exists, the repeated physical load on players is
likely to result in disturbances to metabolic homeostasis and other central and peripheral
factors of fatigue.
The degree of muscle damage experienced during exercise is related to both the intensity and
duration of activity, with intensity having the greatest effect (Tiidus & Ianuzzo, 1983).
Intermittent high-intensity running, typical of rugby sevens matches, results in a significant
increase in muscle damage and soreness, particularly from the eccentric-loading phase of
muscle contraction (Howatson & Milak, 2009; Thompson, Nicholas, & Williams, 1999).
Despite specific training to condition players for these demands, players typically perform in
excess of 40 accelerations (≥2 m·s-2
) and decelerations (≤-2 m·s-2
) in a full rugby sevens
match (Higham et al., 2012). Although fewer rucks and mauls are formed and tackles made
Appendix A – Performance Nutrition Guidelines for International Rugby Sevens Tournaments
207
(Hughes & Jones, 2005) in rugby sevens than rugby union (Quarrie, Hopkins, Anthony, &
Gill, 2013), rugby sevens competition is also characterised by frequent heavy-load collisions.
Muscle damage is related to repeated, direct muscle trauma from impacts with other players
and with the ground (Smart, Gill, Beaven, Cook, & Blazevich, 2008; Takarada, 2003). The
observed rise in a marker of muscle damage in rugby sevens players after only a short
exposure to match time (Takahashi et al., 2007) is an important consideration for coaches and
support staff, especially as players may be required to compete in up to six matches in 2 days.
Given muscle damage results in an increased metabolic cost during exercise and at rest (Tee,
Bosch, & Lambert, 2007) and a reduction in muscle strength (Clarkson, Nosaka, & Braun,
1992), the implementation of recovery strategies including nutritional interventions (Baty et
al., 2007) should be prioritised during rugby sevens tournaments. The physical and
physiological load of rugby sevens, as well as the demanding travel schedule, have nutritional
implications that require consideration to promote optimal performance during international
tournaments.
Physique Characteristics
Despite an increase in the height and mass of rugby sevens players over the past 10 years, on
average, male international rugby sevens backs are ~2 cm shorter and ~6 kg lighter than
international rugby union backs, whereas forwards are ~1 cm shorter and ~13 kg lighter than
their 15-a-side counterparts (Fuller et al., 2010). Furthermore, rugby sevens players are often
leaner than professional rugby union players (Higham et al., 2013). Differences in physique
between rugby sevens backs and forwards are less pronounced than positional differences of
rugby union players, due to the smaller differences in movement patterns and increased need
for mobility in all rugby sevens positions (Higham, Pyne, Anson, Dziedzic, & Slater, in
press). Differences in physical attributes of rugby sevens and rugby union players reflect the
higher running demands (Higham et al., 2012; Suarez-Arrones et al., 2012) and lower
demands for physical confrontation in rugby sevens (Higham, Pyne, Anson, Dziedzic, et al.,
in press). Although a lighter body mass may be beneficial for performing frequent sprints,
accelerating, decelerating, and changing direction when running, a higher body mass can
increase a player’s momentum and be advantageous during contests for the ball.
Rugby sevens players aim to achieve an ideal body mass by developing a proportionally high
muscle mass that assists in force production required for accelerating, sprinting, effecting and
breaking tackles, and during rucks and mauls. Players simultaneously attempt to limit fat
Appendix A – Performance Nutrition Guidelines for International Rugby Sevens Tournaments
208
mass which can compromise their power-to-weight ratio, metabolic efficiency (Withers,
Craig, Bourdon, & Norton, 1987) and thermoregulation (Selkirk & McLellan, 2001). The
transition of players between rugby union and rugby sevens may result in conflicting
physique requirements and subsequent nutritional strategies.
Nutritional Strategies to Promote Optimal Performance
To our knowledge, there is no published data on the energy demands of rugby sevens. The
relationship between heart rate and oxygen consumption has been used to estimate mean
energy expenditure as 3.8–4.2 and 3.3–4.1 MJ in ~40 min of rugby league (Coutts, Reaburn,
& Abt, 2003) and rugby union (Cunniffe et al., 2009), respectively. Including a warm-up, a
single rugby sevens match is usually 30–35 min duration. Given the differences in duration
and intensity, direct comparisons to a rugby sevens match are not possible. Nevertheless,
when combined with the requirements needed to maintain lean mass (Oshima et al., 2011),
the accumulated energy cost over a day in which three matches are played is likely to be
considerable. The inconvenience of feeding around multiple, high-intensity matches
intuitively suggests proactive nutritional strategies prior to the first match of each day, and
aggressive eating and drinking plans after each match will, in addition to meeting acute
recovery requirements, contribute to overall daily energy and macronutrient needs during a 2-
or 3-day tournament. Anecdotally, some players report difficulty maintaining body mass
while touring and competing. This experience emphasises the importance of adequate daily
energy intake, particularly when two tournaments are played within a 10-day period.
The amount of high-intensity running performed by an athlete in multiple-sprint sports is
influenced by pre-exercise muscle glycogen concentration (Balsom, Wood, Olsson, &
Ekblom, 1999). Dietary composition can also affect short-duration (2–7 min), high-intensity
exercise performance. In particular, low carbohydrate intake for 3–4 days prior to exercise
will limit carbohydrate availability and likely compromise exercise capacity (Maughan,
Greenhaff, et al., 1997). Additionally, restoration of muscle glycogen concentrations is higher
when a carbohydrate-enriched diet (~8.4 g carbohydrate per kilogram body mass per day (g
CHO·kg-1
BM·d-1
)) is consumed before competitive team sports (Akermark, Jacobs,
Rasmusson, & Karlsson, 1996). It follows that rugby sevens players should employ a similar
protocol, incorporating a proportionally higher carbohydrate intake in the final days leading
into an international tournament. Consumption of 5–8 g CHO·kg-1
BM·d-1
in combination
with the taper in training load over the final two days of preparation will help optimise
Appendix A – Performance Nutrition Guidelines for International Rugby Sevens Tournaments
209
endogenous substrate stores (Burke et al., 1995). This is of particular importance given
players must compete in multiple matches over a 48- or 72-hour period with as little as three
hours recovery between matches.
Scheduling of matches is dependent on each tournament draw with the first match usually
played between mid-morning and midday on each day of competition. This schedule allows
players the opportunity to consume a substantial carbohydrate-rich meal ~3–4 hours and
another snack 1–2 hours prior to the first match. This is in line with current recommendations
for pre-event nutrition (Rodriguez, DiMarco, & Langley, 2009). In addition, the period prior
to the first match of each day provides athletes with the chance to consume adequate fluid to
ensure they are well hydrated.
Although played at a relatively high intensity, the brief work period allows for, and demands
little emphasis on performance-related nutritional strategies during a single match,
particularly if an appropriate pre-match meal or snack has restored muscle and liver glycogen
levels. The opportunity to consume food or fluid during a rugby sevens match is largely
restricted to a brief 2-min half-time interval. This short recess and the intensity at which a
match is played limit a player’s ability to tolerate large gastrointestinal quantities. Players
often consume between 200–600 mL of water and/or sports drink during the pre-match warm
up and stoppages throughout a match (Dziedzic, 2011), most likely for sensory benefits.
Resynthesis of muscle glycogen stores and repair of muscle tissue damage should be
prioritised following each match, as this is a period not only for recovery but also preparation
for subsequent matches. Since both anaerobic and aerobic energy pathways contribute to
rugby performance (Duthie, Pyne, & Hooper, 2003), considerable carbohydrate utilisation is
expected during competition. While the duration of a single rugby sevens match will not
deplete muscle glycogen stores, partial glycogen depletion is likely, given degradation
increases exponentially with exercise intensity (Maughan, Greenhaff, et al., 1997). Since
muscle damage due to direct impact or eccentric loading interferes with glycogen storage
(Costill et al., 1990), it follows that aggressive carbohydrate feeding during recovery is
important to the rugby sevens player. To maximise muscle glycogen resynthesis, players
should ingest 1–1.5 g CHO·kg-1
BM within 30 min after each match (Kerksick et al., 2008;
Rodriguez et al., 2009). The form of carbohydrate is less important in providing a substrate
for synthesis (Keizer, Kuipers, van Kranenburg, & Geurten, 1987). However, liquid forms are
a practical and appealing way to meet rapid refuelling requirements following a match.
Appendix A – Performance Nutrition Guidelines for International Rugby Sevens Tournaments
210
While difficult to quantify, the cognitive aspects of play significantly contribute to the
outcome of a match (Roberts, Trewartha, Higgitt, El-Abd, & Stokes, 2008). In addition to the
physiological requirements for carbohydrate feeding, the execution of skills and cognition
required for decision making rely on the maintenance of blood-glucose levels (Karelis, Smith,
Passe, & Péronnet, 2010). Furthermore, carbohydrate ingestion may play a role in attenuating
central fatigue related to perception of effort and muscle fatigue (Karelis et al., 2010).
Exercise-induced muscle damage degrades protein structures and may lead to decrements in
muscle function (Twist & Eston, 2005). In addition to potentially augmenting glycogen
synthesis during recovery (Ivy et al., 2002; van Loon, Saris, Kruijshoop, & Wagenmakers,
2000), co-ingestion of protein is essential to repair muscle proteins for energy metabolism
and force production (Rodriguez, Vislocky, & Gaine, 2007). Essential amino acids are
available in the blood ~60 min after protein ingestion and lead to an increased mixed skeletal
muscle fractional synthetic rate, inducing a positive whole-body net protein balance during
recovery (Howarth, Moreau, Phillips, & Gibala, 2009). Ingestion of ~20 g of high biological
value proteins elicits a maximal response of muscle fractional synthetic rate in the immediate
recovery from resistance training (Moore et al., 2009). The ingestion of protein between two
bouts of intense exercise separated by 4 hours has been shown to enhance muscle repair and
reduce muscle soreness (Rowlands, Thorp, Rossler, Graham, & Rockell, 2007), potentially
contributing to subsequent high-intensity performance capacity. Therefore it is reasonable to
suggest players should consume similar quantities (20–25 g) of protein to optimise the repair
of muscle tissue following the damage associated with each rugby sevens match, especially
considering the shortened recovery period between matches and the relatively high lean mass
of players.
An inability to adequately replace body water when training and competing on consecutive
days has been reported in professional rugby league players (Meir & Murphy, 1998), which
may lead to chronic hypohydration. During a domestic-level competition pool match and
standard warm up played in mild environmental conditions (23–25 °C, 60–65% relative
humidity), Australian rugby sevens players averaged a total sweat loss of ~1000 mL,
resulting in a mean net fluid loss of ~1% BM (Dziedzic, 2011). Although it is difficult to
anticipate sweat losses during international competition, it seems reasonable to speculate that
sweat losses may be substantial since World Series tournaments exert a high physiological
load on players and are typically played in hot and potentially humid environments. Fluid
losses as low as 1% BM may affect thermoregulatory function during exercise in the heat
Appendix A – Performance Nutrition Guidelines for International Rugby Sevens Tournaments
211
(Casa et al., 2010). Intermittent sprint performance is also adversely affected by a low to
moderate (~2% BM) fluid deficit (Baker, Dougherty, Chow, & Kenney, 2007). The
impairment of physical and/or mental performance may be amplified if players commence
competition hypohydrated (Maughan & Shirreffs, 2007). Monitoring changes in pre- and
post-match body mass followed by the consumption of 150% of sweat losses in fluid prior to
the next match is recommended (Sawka et al., 2007). Fluid balance requires restoration in a
timely manner, and may be augmented by consuming sodium-containing fluids and food to
drive players’ thirst and increase voluntary intake, as well as enhance fluid retention
(Shirreffs, Armstrong, & Cheuvront, 2004). It is important rehydration at the end of pool
stage days occurs early in the recovery period, as drinking large volumes in the hours before
sleep may lead to overnight interruptions and impact on sleep quality.
Ergogenic Aids
Although there is a dearth of literature on the use and effects of supplementation in rugby
sevens, ergogenic aids known to enhance strength and power, intermittent, high-intensity
activity, and the execution of motor skills or cognitive ability may be advantageous.
Supraphysiological supplementation of creatine improves a player’s work capacity within a
training session and can positively influence changes in muscle protein accretion (Cooper,
Naclerio, Allgrove, & Jimenez, 2012), augmenting training adaptations of muscle strength
and power. The role of creatine in increasing the rate of creatine phosphate resynthesis during
recovery between high-intensity bouts of exercise (Greenhaff, 2000) is also applicable to
match performance, as supplementation enhances power output during short maximal sprints
during intermittent exercise (Terjung et al., 2000). Additionally, creatine ingestion with a
carbohydrate-rich diet can enhance post-exercise glycogen repletion (van Loon et al., 2004),
which is beneficial when recovery time between matches is limited. The timing and dosage of
creatine monohydrate loading must be considered when attempting to enhance rugby sevens
match performance. Rapid-loading protocols have been associated with body water weight
gain (Hultman, Soderlund, Timmons, Cederblad, & Greenhaff, 1996). Therefore, it is
suggested players undertake a slow-loading protocol of 3 g·d-1
over 28 days or schedule an
appropriate rapid-loading phase of 20 g·d-1
over five days, in attempt to avoid weight gain
that may compromise their power-to-weight ratio before a tournament. Muscle creatine
accumulation is likely to be enhanced when co-ingested with 75–100 g of carbohydrate
(Green, Hultman, Macdonald, Sewell, & Greenhaff, 1996).
Appendix A – Performance Nutrition Guidelines for International Rugby Sevens Tournaments
212
Caffeine ingestion in doses of 1–6 mg·kg-1
BM influences processes in the central nervous
system to reduce perception of fatigue, enhance central drive and improve muscle fibre
recruitment (Magkos & Kavouras, 2005). An investigation of caffeine (4 mg·kg-1
BM)
administered in combination with carbohydrate 60 min prior to exercise concluded it was
either the effect of caffeine alone or the interaction of carbohydrate and caffeine that resulted
in improvements in a rugby-specific maximal-intensity test, a 15-m sprint and a motor skills
task (Roberts et al., 2010). Similarly, caffeine ingestion (6 mg·kg-1
BM) improved sprint
times by 0.5–2.9% during a simulated rugby union-specific test and resulted in improved
passing accuracy compared with a placebo (Stuart, Hopkins, Cook, & Cairns, 2005). In a
randomised, double-blinded, placebo-controlled study, the ingestion of a caffeinated beverage
(3 mg·kg-1
BM) by members of the Spanish women’s rugby sevens team 60 min prior to
exercise increased power output during a 15-s maximal jump test and increased total distance
covered per min and distance covered per min at >3.33 m·s-1
during a friendly international
tournament compared with the placebo (Del Coso et al., 2013).
Although beneficial effects of caffeine on physical and skill activities required in an
intermittent, high-intensity team sport have been observed when ingested 60 min prior to
matches, rugby sevens players must make some considerations before use during
competition. Given caffeine is slowly catabolised and has the potential to interfere with sleep
and affect subsequent performance (Burke, 2008), players must consider the effects of
repeated dosing of caffeine, particularly throughout the first day of play. Players considering
the use of caffeine to enhance performance should trial doses of 1–3 mg·kg-1
BM and
monitor tolerance and side-effects during training or domestic tournaments. It would also be
prudent to develop an individualised, strategic plan of caffeine use considering the timing of
matches and importance of each outcome, avoiding doses greater than 6 mg·kg-1
BM·d-1
.
Sodium bicarbonate ingestion can be beneficial for exercise lasting 1–5 min by increasing
extracellular buffering capacity (McNaughton, Siegler, & Midgley, 2008). While ergogenic
effects are observed in multiple bouts of high-intensity, short-duration exercise interspersed
by short recovery intervals (Bishop, Edge, Davis, & Goodman, 2004), sodium bicarbonate
supplementation in rugby sevens is limited by practical issues. Many players are unable to
tolerate the ingestion of large doses based on recommendations relative to body size
combined with the consumption of substantial volumes of fluid required to mitigate
gastrointestinal distress prior to engaging in a high-intensity, contact sport. The adoption of a
chronic-loading protocol may be most appropriate to reduce the risk of gastrointestinal upset.
Appendix A – Performance Nutrition Guidelines for International Rugby Sevens Tournaments
213
In this case, split doses (totaling 0.5 g·kg-1
·d-1
) of bicarbonate are taken for 3–5 days and then
ceased 12–24 hours prior to the first match (Burke & Pyne, 2007). Even so, tolerance should
be trialled in training before use in competition. Emerging evidence that beta-alanine may
elicit ergogenic effects (Artioli, Gualano, Smith, Stout, & Lancha, 2010) due to its role in
increasing muscle carnosine content (Harris et al., 2006), a known intracellular buffer, could
be explored as an alternative to sodium bicarbonate. However, the effects of beta-alanine
supplementation on rugby sevens performance are currently unknown.
The use of liquid meal replacements and sports foods, such as carbohydrate and/or protein
powders and sports bars, may be necessary for travel and to accommodate changes in typical
between-meal snack choices and access. Sports drinks, specifically-formulated recovery
beverages and electrolyte supplements may assist in meeting acute nutritional requirements
before, during and after matches (Sawka et al., 2007).
Practical Challenges and Guidelines
The IRB Sevens World Series is contested in cities around the world, making travel a
significant consideration for the rugby sevens player (for a review of travel nutrition see
Reilly, Waterhouse, Burke, and Alonso, 2007). Acute issues around travel such as food
availability and appropriateness in transit, attenuating the effects of jet lag (Samuels, 2012)
and boosting players’ immunity (Schwellnus et al., 2012) should be considered, but are
beyond the scope of this review. A constraint faced by players during international
tournaments is the standard hotel catering arrangements which accommodate all competing
teams. Access to suitable between-meal and pre- and post-training snacks to meet both acute
and daily energy and nutrient requirements is a concern during the final days of preparation
and while on tour for up to three weeks. Although the eating patterns and dietary composition
of rugby sevens players have not been described, between-meal snacks in elite athletes in
other sports account for 20–30% of typical daily energy intake (Burke et al., 2003; de Wijn &
van Erp-Baart, 1980). Limited availability of snacks while touring may therefore contribute
to a reduction in body mass. Timing and availability of appropriate food choices on match
days must also be considered. Strategies to combat such issues include the organisation and
management of travelling food supplies and player education. Investigating the range of food
options and hours of operation of hotel and competition venue dining facilities will assist in
providing appropriate meals and snacks prior to and during competition. Nutrition guidelines
to optimise performance during a tournament are described in Table A-1. An outline of the
key nutrition guidelines around a typical tournament schedule is presented in Figure A-1.
Appendix A – Performance Nutrition Guidelines for International Rugby Sevens Tournaments
214
While aiming to achieve the nutrition targets that promote optimal performance, a flexible
and individualised approach is necessary. Practical issues such as the players’ food
preferences, psychological aspects of match-day nutrition, and gastrointestinal comfort will
influence the pre-event nutrition strategies for individual players.
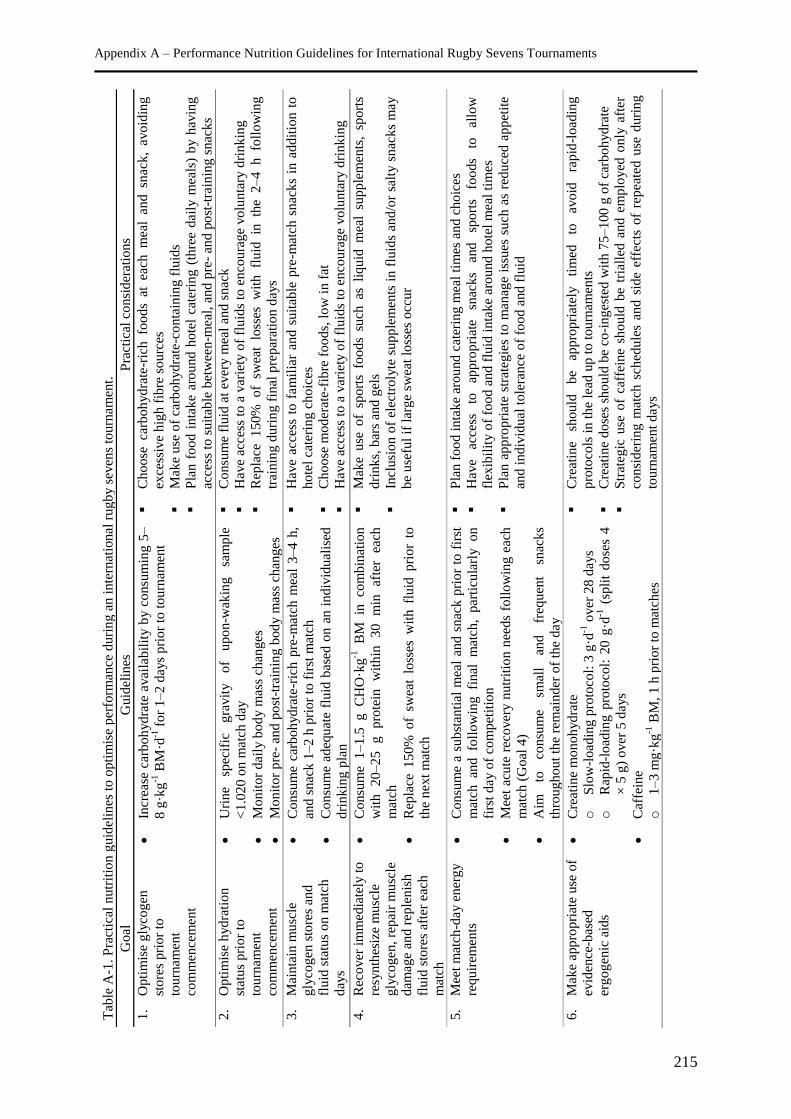
Appendix A – Performance Nutrition Guidelines for International Rugby Sevens Tournaments
215
Tab
le A
-1. P
ract
ical
nutr
itio
n g
uid
elin
es t
o o
pti
mis
e per
form
ance
duri
ng a
n i
nte
rnat
ional
rugby s
even
s to
urn
amen
t.
Goal
G
uid
elin
es
Pra
ctic
al c
on
sid
erat
ion
s
1.
Opti
mis
e gly
cogen
store
s pri
or
to
tourn
amen
t
com
men
cem
ent
In
crea
se c
arboh
ydra
te a
vai
labil
ity b
y c
onsu
min
g 5
–
8 g
·kg
-1 B
M·d
-1 f
or
1–2 d
ays
pri
or
to t
ourn
amen
t
C
hoose
ca
rbo
hyd
rate
-ric
h fo
od
s at
ea
ch m
eal
and
sn
ack
, av
oid
ing
exce
ssiv
e h
igh
fib
re s
ou
rces
M
ake
use
of
carb
oh
yd
rate
-co
nta
inin
g f
luid
s
P
lan f
ood i
nta
ke
aro
un
d h
ote
l ca
teri
ng
(th
ree
dai
ly m
eals
) b
y h
avin
g
acce
ss t
o s
uit
able
bet
wee
n-m
eal,
an
d p
re-
and
po
st-t
rain
ing
sn
ack
s
2.
Opti
mis
e h
ydra
tion
stat
us
pri
or
to
tourn
amen
t
com
men
cem
ent
U
rine
spec
ific
gra
vit
y
of
upon
-wak
ing
sam
ple
<1.0
20 o
n m
atch
day
M
onit
or
dai
ly b
od
y m
ass
chan
ges
M
onit
or
pre
- an
d p
ost
-tra
inin
g b
ody m
ass
chan
ges
C
onsu
me
flu
id a
t ev
ery m
eal
and
sn
ack
H
ave
acce
ss t
o a
var
iety
of
flu
ids
to e
nco
ura
ge
vo
lun
tary
dri
nk
ing
R
epla
ce 1
50%
o
f sw
eat
loss
es w
ith
fl
uid
in
th
e 2
–4 h
fo
llo
win
g
trai
nin
g d
uri
ng
fin
al p
rep
arat
ion
day
s
3.
Mai
nta
in m
usc
le
gly
cogen
sto
res
and
fluid
sta
tus
on m
atch
day
s
C
onsu
me
carb
ohydra
te-r
ich p
re-m
atch
mea
l 3
–4 h
,
and s
nac
k 1
–2 h
pri
or
to f
irst
mat
ch
C
onsu
me
adeq
uat
e fl
uid
bas
ed o
n a
n i
ndiv
idual
ised
dri
nkin
g p
lan
H
ave
acce
ss t
o f
amil
iar
and
su
itab
le p
re-m
atch
sn
ack
s in
ad
dit
ion
to
hote
l ca
teri
ng
ch
oic
es
C
hoose
mo
der
ate-
fib
re f
oo
ds,
lo
w i
n f
at
H
ave
acce
ss t
o a
var
iety
of
flu
ids
to e
nco
ura
ge
vo
lun
tary
dri
nk
ing
4.
Rec
over
im
med
iate
ly t
o
resy
nth
esiz
e m
usc
le
gly
cogen
, re
pai
r m
usc
le
dam
age
and r
eple
nis
h
fluid
sto
res
afte
r ea
ch
mat
ch
C
onsu
me
1–1.5
g C
HO
·kg
-1 B
M in
co
mbin
atio
n
wit
h
20
–25
g
pro
tein
w
ithin
30
min
af
ter
each
mat
ch
R
epla
ce 1
50%
of
swea
t lo
sses
wit
h f
luid
pri
or
to
the
nex
t m
atch
M
ake
use
of
spo
rts
foo
ds
such
as
liq
uid
mea
l su
pp
lem
ents
, sp
ort
s
dri
nks,
bar
s an
d g
els
In
clusi
on o
f el
ectr
oly
te s
up
ple
men
ts i
n f
luid
s an
d/o
r sa
lty s
nac
ks
may
be
use
ful
if l
arg
e sw
eat
loss
es o
ccu
r
5.
Mee
t m
atch
-day
ener
gy
requir
emen
ts
C
onsu
me
a su
bst
anti
al m
eal
and s
nac
k p
rior
to f
irst
mat
ch an
d fo
llow
ing fi
nal
m
atch
, par
ticu
larl
y on
firs
t day
of
com
pet
itio
n
M
eet
acute
rec
over
y n
utr
itio
n n
eeds
foll
ow
ing e
ach
mat
ch (
Goal
4)
A
im
to
consu
me
smal
l an
d
freq
uen
t sn
acks
thro
ugh
out
the
rem
ainder
of
the
day
P
lan f
ood i
nta
ke
aro
und
cat
erin
g m
eal
tim
es a
nd
ch
oic
es
H
ave
acce
ss
to
app
rop
riat
e sn
ack
s an
d
spo
rts
foo
ds
to
allo
w
flex
ibil
ity o
f fo
od
an
d f
luid
in
tak
e ar
ou
nd
ho
tel
mea
l ti
mes
P
lan a
ppro
pri
ate
stra
teg
ies
to m
anag
e is
sues
su
ch a
s re
du
ced
ap
pet
ite
and i
ndiv
idu
al t
ole
ran
ce o
f fo
od
and
flu
id
6.
Mak
e ap
pro
pri
ate
use
of
evid
ence
-bas
ed
ergogen
ic a
ids
C
reat
ine
monohydra
te
oS
low
-load
ing p
roto
col:
3 g
·d-1
over
28 d
ays
oR
apid
-load
ing p
roto
col:
20 g
·d-1
(sp
lit
dose
s 4
× 5
g)
over
5 d
ays
C
affe
ine
o1
–3
mg·k
g-1
BM
, 1 h
pri
or
to m
atch
es
C
reat
ine
should
be
appro
pri
atel
y
tim
ed
to
avoid
ra
pid
-load
ing
pro
toco
ls i
n t
he
lead
up
to
tou
rnam
ents
C
reat
ine
do
ses
sho
uld
be
co-i
ng
este
d w
ith
75–
100
g o
f ca
rbo
hyd
rate
S
trat
egic
use
of
caff
ein
e sh
ou
ld b
e tr
iall
ed a
nd
em
plo
yed
on
ly a
fter
consi
der
ing
mat
ch s
ched
ule
s an
d s
ide
effe
cts
of
rep
eate
d u
se d
uri
ng
tourn
amen
t d
ays
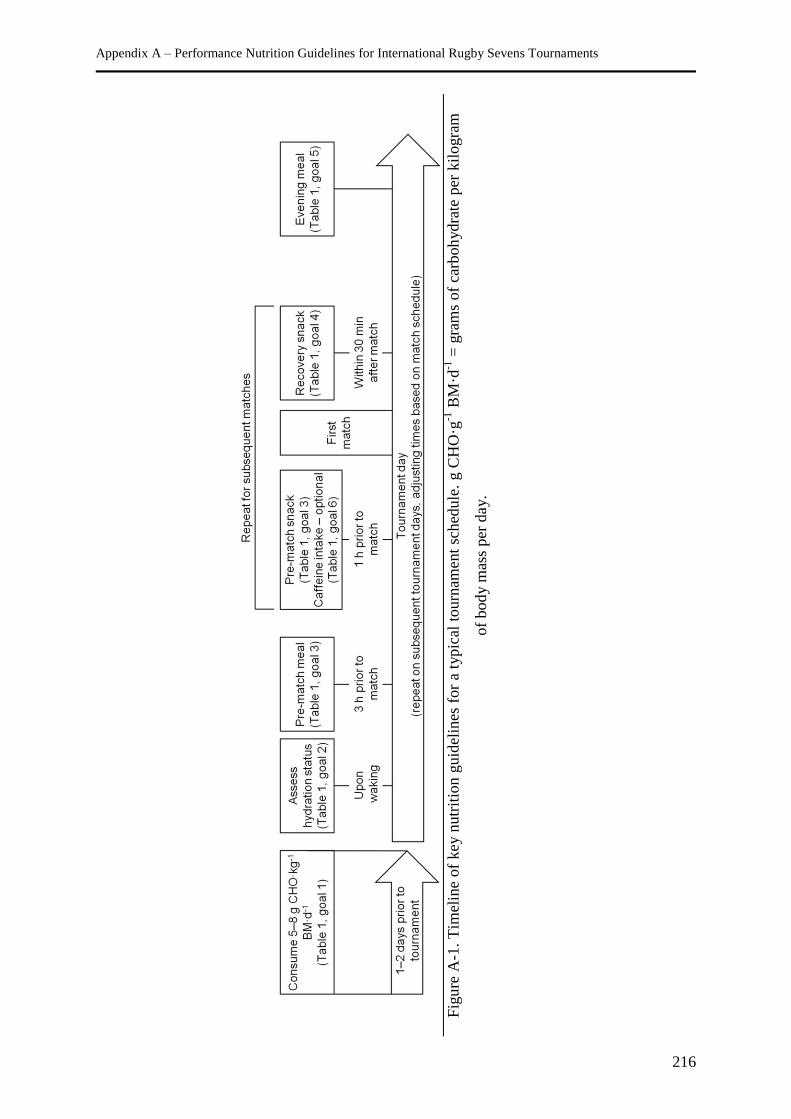
Appendix A – Performance Nutrition Guidelines for International Rugby Sevens Tournaments
216
F
igu
re A
-1.
Tim
elin
e of
key
nutr
itio
n g
uid
elin
es f
or
a ty
pic
al t
ourn
amen
t sc
hed
ule
. g C
HO
·g-1
BM
·d-1
= g
ram
s of
carb
oh
ydra
te p
er k
ilogra
m
of
bod
y m
ass
per
day.
Appendix A – Performance Nutrition Guidelines for International Rugby Sevens Tournaments
217
Conclusion
The popularity and profile of rugby sevens has increased in recent decades, yet literature
detailing the specific demands of the sport and the associated characteristics of players is only
emerging. Current nutrition guidelines to optimise tournament performance have therefore
been inferred from other athletic populations or situations with similar physiological stresses.
The unique demands of rugby sevens warrant further investigation, particularly in relation to
nutritional strategies likely to affect performance. Additionally, future research should aim to
document players’ current nutrition practices during training and competition. This review
provides a best-practice model of nutritional support for international rugby sevens
competition based on our current understanding of the sport and its requirements combined
with pragmatic guidelines and considerations for the practitioner.
Appendix A – Performance Nutrition Guidelines for International Rugby Sevens Tournaments
218
References
Akermark, C., Jacobs, I., Rasmusson, M., & Karlsson, J. (1996). Diet and muscle glycogen
concentration in relation to physical performance in Swedish elite ice hockey players.
International Journal of Sport Nutrition, 6(3), 272-284.
Artioli, G. G., Gualano, B., Smith, A., Stout, J., & Lancha, A. H., Jr. (2010). Role of β-
alanine supplementation on muscle carnosine and exercise performance. Medicine
and Science in Sports and Exercise, 42(6), 1162-1173.
Baker, L. B., Dougherty, K. A., Chow, M., & Kenney, W. L. (2007). Progressive
dehydration causes progressive decline in basketball skill performance. Medicine and
Science in Sports and Exercise, 39(7), 1114-1123.
Balsom, P. D., Wood, K., Olsson, P., & Ekblom, B. (1999). Carbohydrate intake and multiple
sprint sports: with special reference to football (soccer). International Journal of
Sports Medicine, 20(1), 48-52.
Baty, J. J., Hwang, H., Ding, Z., Bernard, J. R., Wang, B., Kwon, B., & Ivy, J. L. (2007). The
effect of a carbohydrate and protein supplement on resistance exercise performance,
hormonal response, and muscle damage. Journal of Strength and Conditioning
Research, 21(2), 321-329.
Bishop, D., Edge, J., Davis, C., & Goodman, C. (2004). Induced metabolic alkalosis affects
muscle metabolism and repeated-sprint ability. Medicine and Science in Sports and
Exercise, 36(5), 807-813.
Burke, L. M. (2008). Caffeine and sports performance. Applied Physiology, Nutrition, and
Metabolism, 33(6), 1319-1334.
Burke, L. M., Collier, G. R., Beasley, S. K., Davis, P. G., Fricker, P. A., Heeley, P., . . .
Hargreaves, M. (1995). Effect of coingestion of fat and protein with carbohydrate
feedings on muscle glycogen storage. Journal of Applied Physiology, 78(6), 2187-
2192.
Burke, L. M., & Pyne, D. B. (2007). Bicarbonate loading to enhance training and competitive
performance. International Journal of Sports Physiology and Performance, 2(1), 93-
97.
Burke, L. M., Slater, G., Broad, E. M., Haukka, J., Modulon, S., & Hopkins, W. G. (2003).
Eating patterns and meal frequency of elite Australian athletes. International Journal
of Sport Nutrition and Exercise Metabolism, 13(4), 521-538.
Appendix A – Performance Nutrition Guidelines for International Rugby Sevens Tournaments
219
Cahill, N., Lamb, K., Worsfold, P., Headey, R., & Murray, S. (2013). The movement
characteristics of English Premiership rugby union players. Journal of Sports
Sciences, 31(3), 229-237.
Casa, D. J., Stearns, R. L., Lopez, R. M., Ganio, M. S., McDermott, B. P., Walker Yeargin,
S., . . . Maresh, C. M. (2010). Influence of hydration on physiological function and
performance during trail running in the heat. Journal of Athletic Training, 45(2), 147-
156.
Clarkson, P. M., Nosaka, K., & Braun, B. (1992). Muscle function after exercise-induced
muscle damage and rapid adaptation. Medicine and Science in Sports and Exercise,
24(5), 512-520.
Cooper, R., Naclerio, F., Allgrove, J., & Jimenez, A. (2012). Creatine supplementation with
specific view to exercise/sports performance: an update. Journal of the International
Society of Sports Nutrition, 9(1), 33-44.
Costill, D. L., Pascoe, D. D., Fink, W. J., Robergs, R. A., Barr, S. I., & Pearson, D. (1990).
Impaired muscle glycogen resynthesis after eccentric exercise. Journal of Applied
Physiology, 69(1), 46-50.
Coutts, A., Reaburn, P., & Abt, G. (2003). Heart rate, blood lactate concentration and
estimated energy expenditure in a semi-professional rugby league team during a
match: a case study. Journal of Sports Sciences, 21(2), 97-103.
Cunniffe, B., Proctor, W., Baker, J. S., & Davies, B. (2009). An evaluation of the
physiological demands of elite rugby union using global positioning system tracking
software. Journal of Strength and Conditioning Research, 23(4), 1195-1203.
de Wijn, J. F., & van Erp-Baart, M. (1980). Foodpattern, body composition and physical
condition of heavy weight competition-rowers. Voeding, 41(1), 13-18.
Del Coso, J., Portillo, J., Muñoz, G., Abián-Vicén, J., Gonzalez-Millán, C., & Muñoz-Guerra,
J. (2013). Caffeine-containing energy drink improves sprint performance during an
international rugby sevens competition. Amino Acids, 44(6), 1511-1519.
Duthie, G., Pyne, D., & Hooper, S. (2003). Applied physiology and game analysis of rugby
union. Sports Medicine, 33(13), 973-991.
Dziedzic, C. E. (2011). Fluid balance and sweat sodium losses of rugby sevens players.
Football Science, 8(S1), 162.
Fuller, C. W., Taylor, A., & Molloy, M. G. (2010). Epidemiological study of injuries in
international Rugby Sevens. Clinical Journal of Sport Medicine, 20(3), 179-184.
Appendix A – Performance Nutrition Guidelines for International Rugby Sevens Tournaments
220
Green, A. L., Hultman, E., Macdonald, I. A., Sewell, D. A., & Greenhaff, P. L. (1996).
Carbohydrate ingestion augments skeletal muscle creatine accumulation during
creatine supplementation in humans. American Journal of Physiology -
Endocrinology and Metabolism, 271(5), E821-E826.
Greenhaff, P. L. (2000). Creatine. In R. Maughan (Ed.), Nutrition in sport (pp. 367-378).
Oxford, UK: Blackwell Science.
Harris, R. C., Tallon, M. J., Dunnett, M., Boobis, L., Coakley, J., Kim, H. J., . . . Wise, J. A.
(2006). The absorption of orally supplied β-alanine and its effect on muscle carnosine
synthesis in human vastus lateralis. Amino Acids, 30(3), 279-289.
Higham, D. G., Pyne, D. B., Anson, J. M., Dziedzic, C. E., & Slater, G. J. (in press).
Distribution of fat, non-osseous lean and bone mineral mass in international Rugby
Union and Rugby Sevens players. International Journal of Sports Medicine.
Higham, D. G., Pyne, D. B., Anson, J. M., & Eddy, A. (2012). Movement patterns in rugby
sevens: effects of tournament level, fatigue and substitute players. Journal of Science
and Medicine in Sport, 15(3), 277-282.
Higham, D. G., Pyne, D. B., Anson, J. M., & Eddy, A. (2013). Physiological, anthropometric
and performance characteristics of rugby sevens players. International Journal of
Sports Physiology and Performance, 8(1), 19-27.
Higham, D. G., Pyne, D. B., Anson, J. M., Hopkins, W. G., & Eddy, A. (in press).
Comparison of activity profiles and physiological demands between international
rugby sevens matches and training. Journal of Strength and Conditioning Research.
Howarth, K. R., Moreau, N. A., Phillips, S. M., & Gibala, M. J. (2009). Coingestion of
protein with carbohydrate during recovery from endurance exercise stimulates
skeletal muscle protein synthesis in humans. Journal of Applied Physiology, 106(4),
1394-1402.
Howatson, G., & Milak, A. (2009). Exercise-induced muscle damage following a bout of
sport specific repeated sprints. Journal of Strength and Conditioning Research, 23(8),
2419-2424.
Hughes, M., & Jones, R. (2005). Patterns of play of successful and unsuccesful teams in
men's 7-a-side rugby union. In T. Reilly, J. Cabri & D. Araújo (Eds.), Science and
Football V: The Proceedings of the Fifth World Congress on Science and Football
(pp. 247-252). London: Routledge.
Hultman, E., Soderlund, K., Timmons, J., Cederblad, G., & Greenhaff, P. (1996). Muscle
creatine loading in men. Journal of Applied Physiology, 81(1), 232-237.
Appendix A – Performance Nutrition Guidelines for International Rugby Sevens Tournaments
221
Ivy, J. L., Goforth Jr, H. W., Damon, B. M., McCauley, T. R., Parsons, E. C., & Price, T. B.
(2002). Early postexercise muscle glycogen recovery is enhanced with a
carbohydrate-protein supplement. Journal of Applied Physiology, 93(4), 1337-1344.
Karelis, A. D., Smith, J. E. W., Passe, D. H., & Péronnet, F. (2010). Carbohydrate
administration and exercise performance: what are the potential mechanisms
involved? Sports Medicine, 40(9), 747-763.
Keizer, H. A., Kuipers, H., van Kranenburg, G., & Geurten, P. (1987). Influence of liquid and
solid meals on muscle glycogen resynthesis, plasma fuel hormone response, and
maximal physical working capacity. International Journal of Sports Medicine, 8(2),
99-104.
Kerksick, C., Harvey, T., Stout, J., Campbell, B., Wilborn, C., Kreider, R., . . . Antonio, J.
(2008). International Society of Sports Nutrition position stand: Nutrient timing.
Journal of the International Society of Sports Nutrition, 5, 17.
Magkos, F., & Kavouras, S. A. (2005). Caffeine use in sports, pharmacokinetics in man, and
cellular mechanisms of action. Critical Reviews in Food Science and Nutrition, 45(7-
8), 535-562.
Maughan, R. J., Greenhaff, P. L., Leiper, J. B., Ball, D., Lambert, C. P., & Gleeson, M.
(1997). Diet composition and the performance of high-intensity exercise. Journal of
Sports Sciences, 15(3), 265-275.
Maughan, R. J., & Shirreffs, S. M. (2010). Development of hydration strategies to optimize
performance for athletes in high-intensity sports and in sports with repeated intense
efforts. Scandinavian Journal of Medicine and Science in Sports, 20(S2), 59-69.
McNaughton, L. R., Siegler, J., & Midgley, A. (2008). Ergogenic effects of sodium
bicarbonate. Current Sports Medicine Reports, 7(4), 230-236.
Meir, R., & Murphy, A. (1998). Fluid loss and rehydration during training and competition in
professional rugby league. Coaching and Sport Science Journal, 3(1), 9-13.
Moore, D. R., Robinson, M. J., Fry, J. L., Tang, J. E., Glover, E. I., Wilkinson, S. B., . . .
Phillips, S. M. (2009). Ingested protein dose response of muscle and albumin protein
synthesis after resistance exercise in young men. The American Journal of Clinical
Nutrition, 89(1), 161-168.
Oshima, S., Miyauchi, S., Kawano, H., Ishijima, T., Asaka, M., Taguchi, M., . . . Higuchi, M.
(2011). Fat-free mass can be utilized to assess resting energy expenditure for male
athletes of different body size. Journal of Nutritional Science and Vitaminology,
57(6), 394-400.
Appendix A – Performance Nutrition Guidelines for International Rugby Sevens Tournaments
222
Quarrie, K. L., Hopkins, W. G., Anthony, M. J., & Gill, N. D. (2013). Positional demands of
international rugby union: Evaluation of player actions and movements. Journal of
Science and Medicine in Sport, 16(4), 353–359.
Reilly, T., Waterhouse, J., Burke, L. M., & Alonso, J. M. (2007). Nutrition for travel. Journal
of Sports Sciences, 25(S1), S125-S134.
Rienzi, E., Reilly, T., & Malkin, C. (1999). Investigation of anthropometric and work-rate
profiles of Rugby Sevens players. The Journal of Sports Medicine and Physical
Fitness, 39(2), 160-164.
Roberts, S. P., Stokes, K. A., Trewartha, G., Doyle, J., Hogben, P., & Thompson, D. (2010).
Effects of carbohydrate and caffeine ingestion on performance during a rugby union
simulation protocol. Journal of Sports Sciences, 28(8), 833-842.
Roberts, S. P., Trewartha, G., Higgitt, R. J., El-Abd, J., & Stokes, K. A. (2008). The physical
demands of elite English rugby union. Journal of Sports Sciences, 26(8), 825-833.
Rodriguez, N. R., DiMarco, N. M., & Langley, S. (2009). Nutrition and athletic performance.
Medicine and Science in Sports and Exercise, 41(3), 709-731.
Rodriguez, N. R., Vislocky, L. M., & Gaine, P. C. (2007). Dietary protein, endurance
exercise, and human skeletal-muscle protein turnover. Current Opinion in Clinical
Nutrition and Metabolic Care, 10(1), 40-45.
Rowlands, D. S., Thorp, R. M., Rossler, K., Graham, D. F., & Rockell, M. J. (2007). Effect of
protein-rich feeding on recovery after intense exercise. International Journal of Sport
Nutrition and Exercise Metabolism, 17(6), 521-543.
Samuels, C. H. (2012). Jet lag and travel fatigue: a comprehensive management plan for sport
medicine physicians and high-performance support teams. Clinical Journal of Sport
Medicine, 22(3), 268-273.
Sawka, M., Burke, L., Eichner, E., Maughan, R., Montain, S., & Stachenfeld, N. (2007).
American College of Sports Medicine position stand. Exercise and fluid replacement.
Medicine and Science in Sports and Exercise, 39(2), 377-390.
Schwellnus, M. P., Derman, W. E., Jordaan, E., Page, T., Lambert, M. I., Readhead, C., . . .
Webb, S. (2012). Elite athletes travelling to international destinations >5 time zone
differences from their home country have a 2–3-fold increased risk of illness. British
Journal of Sports Medicine, 46(11), 816-821.
Selkirk, G. A., & McLellan, T. M. (2001). Influence of aerobic fitness and body fatness on
tolerance to uncompensable heat stress. Journal of Applied Physiology, 91(5), 2055-
2063.
Appendix A – Performance Nutrition Guidelines for International Rugby Sevens Tournaments
223
Shirreffs, S. M., Armstrong, L. E., & Cheuvront, S. N. (2004). Fluid and electrolyte needs for
preparation and recovery from training and competition. Journal of Sports Sciences,
22(1), 57-63.
Smart, D. J., Gill, N. D., Beaven, C. M., Cook, C. J., & Blazevich, A. J. (2008). The
relationship between changes in interstitial creatine kinase and game-related impacts
in rugby union. British Journal of Sports Medicine, 42(3), 198-201.
Stuart, G. R., Hopkins, W. G., Cook, C., & Cairns, S. P. (2005). Multiple effects of caffeine
on simulated high-intensity team-sport performance. Medicine and Science in Sports
and Exercise, 37(11), 1998-2005.
Suarez-Arrones, L., Nuñez, F. J., Portillo, J., & Mendez-Villanueva, A. (2012). Match
running performance and exercise intensity in elite female Rugby Sevens. Journal of
Strength and Conditioning Research, 26(7), 1858-1862.
Suarez-Arrones, L. J., Nuñez, F. J., Portillo, J., & Mendez-Villanueva, A. (2012). Running
demands and heart rate responses in men rugby sevens. Journal of Strength and
Conditioning Research, 26(11), 3155–3159.
Takahashi, I., Umeda, T., Mashiko, T., Chinda, D., Oyama, T., Sugawara, K., & Nakaji, S.
(2007). Effects of rugby sevens matches on human neutrophil-related non-specific
immunity. British Journal of Sports Medicine, 41(1), 13-18.
Takarada, Y. (2003). Evaluation of muscle damage after a rugby match with special reference
to tackle plays. British Journal of Sports Medicine, 37(5), 416-419.
Tee, J. C., Bosch, A. N., & Lambert, M. I. (2007). Metabolic consequences of exercise-
induced muscle damage. Sports Medicine, 37(10), 827-836.
Terjung, R. L., Clarkson, P., Eichner, E., Greenhaff, P. L., Hespel, P. J., Israel, R., . . .
Williams, M. (2000). American College of Sports Medicine roundtable. The
physiological and health effects of oral creatine supplementation. Medicine and
Science in Sports and Exercise, 32(3), 706-717.
Thompson, D., Nicholas, C. W., & Williams, C. (1999). Muscular soreness following
prolonged intermittent high-intensity shuttle running. Journal of Sports Sciences,
17(5), 387-395.
Tiidus, P. M., & Ianuzzo, C. D. (1983). Effects of intensity and duration of muscular exercise
on delayed soreness and serum enzyme activities. Medicine and Science in Sports and
Exercise, 15(6), 461-465.
Appendix A – Performance Nutrition Guidelines for International Rugby Sevens Tournaments
224
Twist, C., & Eston, R. (2005). The effects of exercise-induced muscle damage on maximal
intensity intermittent exercise performance. European Journal of Applied Physiology,
94(5-6), 652-658.
van Loon, L. J. C., Murphy, R., Oosterlaar, A. M., Cameron-Smith, D., Hargreaves, M.,
Wagenmakers, A. J. M., & Snow, R. (2004). Creatine supplementation increases
glycogen storage but not GLUT-4 expression in human skeletal muscle. Clinical
Science, 106(1), 99-106.
van Loon, L. J. C., Saris, W. H. M., Kruijshoop, M., & Wagenmakers, A. J. M. (2000).
Maximizing postexercise muscle glycogen synthesis: carbohydrate supplementation
and the application of amino acid or protein hydrolysate mixtures. The American
Journal of Clinical Nutrition, 72(1), 106-111.
van Rooyen, M. K., Lombard, C., & Noakes, T. D. (2008). Playing demands of sevens rugby
during the 2005 Rugby World Cup Sevens tournament. International Journal of
Performance Analysis in Sport, 8(2), 114-123.
Withers, R. T., Craig, N. P., Bourdon, P. C., & Norton, K. I. (1987). Relative body fat and
anthropometric prediction of body density of male athletes. European Journal of
Applied Physiology and Occupational Physiology, 56(2), 191-200.
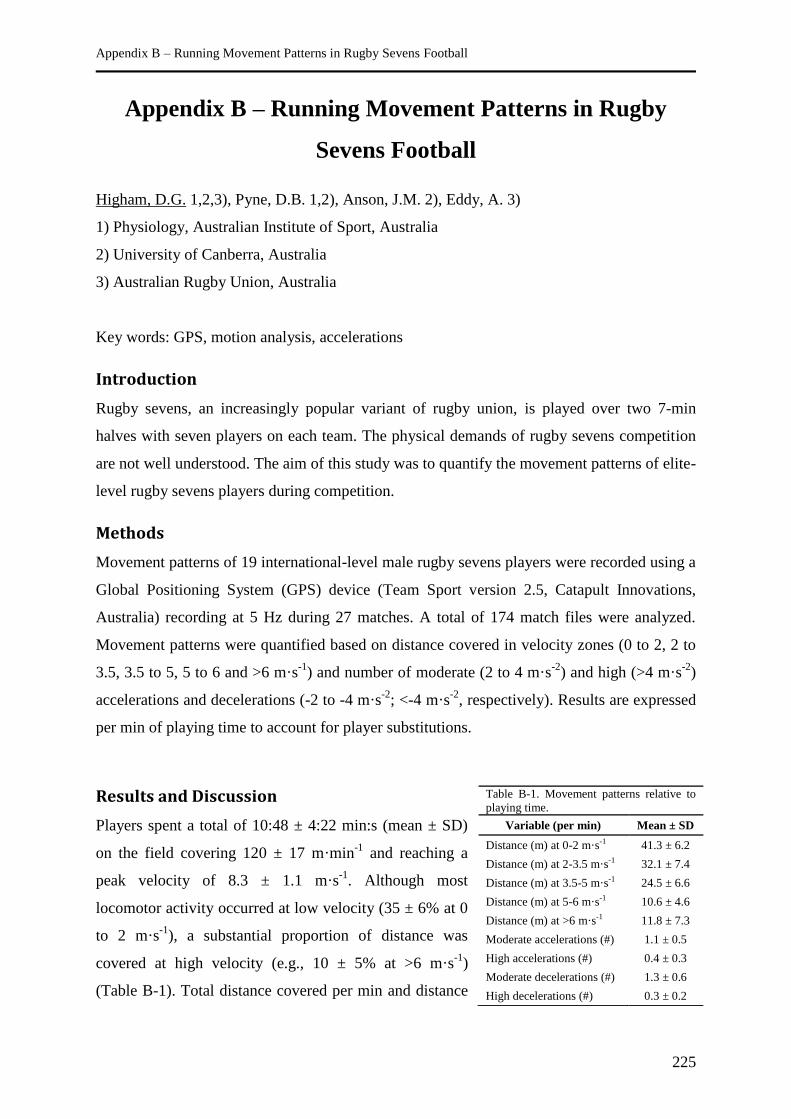
Appendix B – Running Movement Patterns in Rugby Sevens Football
225
Appendix B – Running Movement Patterns in Rugby
Sevens Football
Higham, D.G. 1,2,3), Pyne, D.B. 1,2), Anson, J.M. 2), Eddy, A. 3)
1) Physiology, Australian Institute of Sport, Australia
2) University of Canberra, Australia
3) Australian Rugby Union, Australia
Key words: GPS, motion analysis, accelerations
Introduction
Rugby sevens, an increasingly popular variant of rugby union, is played over two 7-min
halves with seven players on each team. The physical demands of rugby sevens competition
are not well understood. The aim of this study was to quantify the movement patterns of elite-
level rugby sevens players during competition.
Methods
Movement patterns of 19 international-level male rugby sevens players were recorded using a
Global Positioning System (GPS) device (Team Sport version 2.5, Catapult Innovations,
Australia) recording at 5 Hz during 27 matches. A total of 174 match files were analyzed.
Movement patterns were quantified based on distance covered in velocity zones (0 to 2, 2 to
3.5, 3.5 to 5, 5 to 6 and >6 m·s-1
) and number of moderate (2 to 4 m·s-2
) and high (>4 m·s-2
)
accelerations and decelerations (-2 to -4 m·s-2
; <-4 m·s-2
, respectively). Results are expressed
per min of playing time to account for player substitutions.
Results and Discussion
Players spent a total of 10:48 ± 4:22 min:s (mean ± SD)
on the field covering 120 ± 17 m·min-1
and reaching a
peak velocity of 8.3 ± 1.1 m·s-1
. Although most
locomotor activity occurred at low velocity (35 ± 6% at 0
to 2 m·s-1
), a substantial proportion of distance was
covered at high velocity (e.g., 10 ± 5% at >6 m·s-1
)
(Table B-1). Total distance covered per min and distance
Table B-1. Movement patterns relative to
playing time.
Variable (per min) Mean ± SD
Distance (m) at 0-2 m·s-1 41.3 ± 6.2
Distance (m) at 2-3.5 m·s-1 32.1 ± 7.4
Distance (m) at 3.5-5 m·s-1 24.5 ± 6.6
Distance (m) at 5-6 m·s-1 10.6 ± 4.6
Distance (m) at >6 m·s-1 11.8 ± 7.3
Moderate accelerations (#) 1.1 ± 0.5
High accelerations (#) 0.4 ± 0.3
Moderate decelerations (#) 1.3 ± 0.6
High decelerations (#) 0.3 ± 0.2
Appendix B – Running Movement Patterns in Rugby Sevens Football
226
travelled at >5 m·s1
per min were substantially greater (by ~45 and 135%, respectively) in
rugby sevens than in 15-player rugby union (1).
Conclusion
Rugby sevens is characterised by a high frequency of changes in velocity and repeated high
velocity sprints. Game-specific training should include relatively high running volumes
incorporating intermittent maximal or near-maximal sprint efforts.
References
1. Cunniffe, B. et al. (2009). J Strength Cond Res, 23(4): 1195-1203.
Appendix C – What Physical and Performance Qualities Characterise Elite Rugby Sevens Players?
227
Appendix C – What Physical and Performance Qualities
Characterise Elite Rugby Sevens Players?
Higham, D.G.1,2,3; Pyne, D.B.1,2; Anson, J.M.2
1: Australian Institute of Sport (Canberra, Australia), 2: University of Canberra (Canberra,
Australia), 3: Australian Rugby Union (Sydney, Australia)
Introduction
Rugby sevens is a format of rugby union that has increased in popularity in recent years and
will be contested at the Olympic Games from 2016. Marked differences in the specific
demands of competition between 15-player rugby union and rugby sevens suggest the
characteristics of high-level players in each format may also differ (Higham et al., 2011).
Although the characteristics of 15-a-side rugby union players have been well defined, little
information exists on rugby sevens players. We profiled the anthropometric, physiological
and performance qualities of elite-level rugby sevens players, and quantified relationships
between these characteristics.
Methods
Eighteen male international rugby sevens players undertook anthropometric (body mass,
height, sum of seven skinfolds, lean mass index), acceleration and speed (40-m sprint),
muscular power (vertical jump), repeated-sprint ability (6 × 30-m sprint) and endurance (Yo-
Yo intermittent recovery level 1 test and treadmill V̇O2max) testing. Associations between
measurements were assessed by correlation analysis.
Results
Rugby sevens players had anthropometric characteristics (body mass 89.7 ± 7.6 kg, height
1.83 ± 0.06 m, sum of skinfolds 52.2 ± 11.5 mm; mean ± SD) similar to backs in
international 15-player rugby union. Acceleration and speed (40-m sprint 5.11 ± 0.15 s),
muscular power (vertical jump 66 ± 7 cm), and endurance (V̇O2max 53.8 ± 3.4 mL·kg-1
·min-1
)
qualities were similar to, or better than, professional 15-a-side players. Coefficients of
variation ranged from 2.5 to 22%. Relative V̇O2max was largely correlated with Yo-Yo
distance (r = 0.60, 0.21 to 0.82; 90% confidence interval) and moderately correlated with 40-
m sprint time (r = -0.46, -0.75 to -0.02) and repeated-sprint ability (r = -0.38, -0.72 to 0.09).
Appendix C – What Physical and Performance Qualities Characterise Elite Rugby Sevens Players?
228
A very large correlation was observed between velocity at V̇O2max and Yo-Yo distance (r =
0.89, 0.74 to 0.96).
Discussion
Our findings provide an important first step toward the development of physical performance
standards for players training to compete at the international level. International rugby sevens
players require highly-developed speed, power and endurance to tolerate the demands of
competition. The small between-athlete variability of characteristics in rugby sevens players
highlights the need for relatively uniform physical and performance standards in contrast with
15-a-side teams. Simple field-based measures may be employed to assess training adaptations
and prescribe velocity thresholds for performance monitoring in place of time-consuming and
expensive laboratory-based tests.
References
Higham DG, Pyne DB, Anson JM, Eddy A. (2012). J Sci Med Sport,
doi:10.1016/j.jsams.2011.11.256
Appendix D – Comparison of Fitness Characteristics between Men’s and Women’s Rugby Sevens Players
229
Appendix D – Comparison of Fitness Characteristics
between Men’s and Women’s Rugby Sevens Players
David B. Pyne1, Dean G. Higham
1, Anthea Clarke
1, John Mitchell
2, Anthony Eddy
2
1Australian Institute of Sport, Belconnen, Australia.
2Australian Rugby Union, St Leonards,
Australia.
Both men’s and women’s rugby sevens have been added to the program for the 2016
Olympic Games in Rio de Janeiro, Brazil, but little is known about the comparative fitness
requirements.
Purpose
To determine magnitudes of difference, and degree of variability, in standard anthropometric
and fitness characteristics of national-level men and women rugby sevens players.
Methods
National sevens squad players (males n = 32, age 22 ± 3 y; height 1.82 ± 0.06 m; mass 90 ± 8
kg; females n = 32, age 25 ± 6 y, height 1.68 ± 0.06 m; mass 70 ± 9 kg; mean ± SD) age were
tested during routine training camps. All testing was conducted indoors on a synthetic
running track after instruction, warm-up and familiarization with each test protocol. Each
player completed a 40-m maximal sprint test, standing vertical jump and the Yo-Yo
Intermittent Recovery Level 1 (YoYo-IRL1) tests. Difference in mean scores between male
and female players were expressed as a percentage, and variability as a ratio of the
coefficients of variation (CV).
Results
Male players had ~40% more lean mass and 40% lower skinfolds than the women. Speed
(40-m sprint time and maximal running velocity, vmax) was only ~10-20% faster for the men,
while lower body power and momentum (mass × vmax) were 40-50% higher in men. The most
marked difference was in endurance capacity (YoYo-IRL1 distance covered) where the men
(2260 ± 270 m; mean ± SD) were ~two-fold better on the YoYo-IRL1 than women (990 ±

Appendix D – Comparison of Fitness Characteristics between Men’s and Women’s Rugby Sevens Players
230
320 m; mean difference ± 90% confidence limits of 1234 ± 184 m). The women were more
than twice as variable (ratio of CV <0.4) in endurance fitness than the men.
Conclusion
Women rugby sevens players should focus conditioning programs on power, size and
endurance to improve these aspects of fitness.
Appendix E – Comparison of 5- And 10-Hz GPS Technology for Team Sport Analysis
231
Appendix E – Comparison of 5- And 10-Hz GPS
Technology for Team Sport Analysis
David B. Pyne, Carl Petersen, Dean G. Higham, Matthew N. Cramer
Australian Institute of Sport, Belconnen, Australia
Game and training analysis in team sports is increasingly reliant on application of smart
sensor devices and wireless technology.
Purpose
To compare the reliability and validity of 5- and 10-Hz Global Positioning System (GPS)
devices for quantifying distances of short sprints in team sport athletes.
Methods
Twenty trials of maximal effort short sprints over 10-, 20-, 30- and 40-m intervals using a
MinimaxX GPS device (Team Sport version 4.0 10-Hz, Catapult, Melbourne, Australia) were
evaluated against a criterion measure of electronic timing (Swift timing gates, Lismore,
Australia; accurate to 0.01 s). Data were log-transformed before analysis to reduce the non-
uniformity of error. Validity was quantified with the standard error of the estimate (SEE) and
reliability estimated using the typical error expressed as a coefficient of variation. These
estimates were then compared with previously established values for a 5-Hz device (Team
Sport version 2.5) for 20-, 30- and 40-m intervals.
Results
The estimates of validity (standard error of the estimate ± 90% confidence limits) of the new
10-Hz device were: 10-m, 13.9 ± 5.1%; 20-m, 8.8 ± 3.2%; 30-m, 6.2 ± 2.3%; and 40-m, 5.0 ±
1.8%. The estimates of reliability (typical error ± 90% confidence limits) for the 10-Hz
device were: 10-m, 11.7 ± 3.6%; 20-m, 6.9 ± 2.1%; 30-m, 4.7 ± 1.4%; and 40-m, 3.8 ± 1.1%.
Comparable mean estimates for the older 5-Hz device over 20-40 m intervals ranged from
14-24% for validity, and 16-30% for reliability.
Conclusions
The reliability and validity of estimates for quantifying the distance covered in short sprints is
markedly better using 10-Hz GPS technology.