applied investment management (aim) program€¦ · zach bloom marten transportation mrtn 2.0 ......
TRANSCRIPT
Applied Investment Management (AIM) Program
AIM Fund Investment Advisory Board Meeting October 5, 2006
AIM Equity Fund Presentations
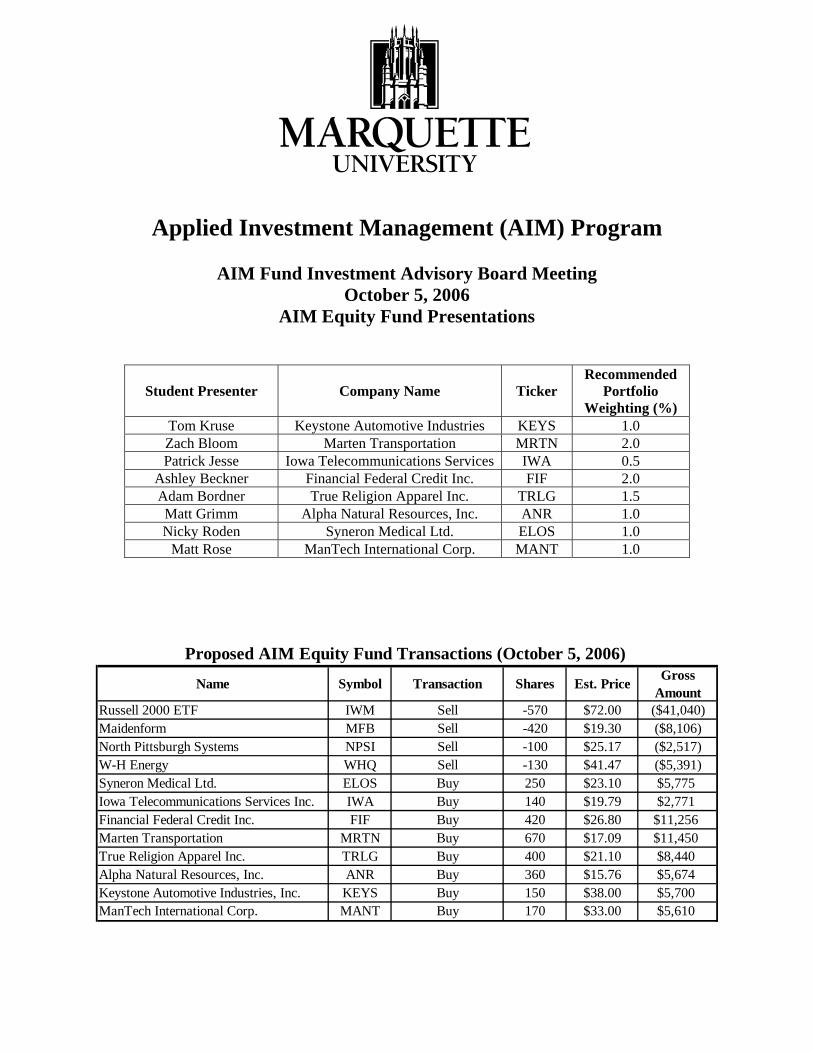
Student Presenter Company Name Ticker Recommended
Portfolio Weighting (%)
Tom Kruse Keystone Automotive Industries KEYS 1.0 Zach Bloom Marten Transportation MRTN 2.0 Patrick Jesse Iowa Telecommunications Services IWA 0.5
Ashley Beckner Financial Federal Credit Inc. FIF 2.0 Adam Bordner True Religion Apparel Inc. TRLG 1.5 Matt Grimm Alpha Natural Resources, Inc. ANR 1.0 Nicky Roden Syneron Medical Ltd. ELOS 1.0
Matt Rose ManTech International Corp. MANT 1.0
Proposed AIM Equity Fund Transactions (October 5, 2006)
Name Symbol Transaction Shares Est. Price Gross Amount
Russell 2000 ETF IWM Sell -570 $72.00 ($41,040)Maidenform MFB Sell -420 $19.30 ($8,106)North Pittsburgh Systems NPSI Sell -100 $25.17 ($2,517)W-H Energy WHQ Sell -130 $41.47 ($5,391)Syneron Medical Ltd. ELOS Buy 250 $23.10 $5,775Iowa Telecommunications Services Inc. IWA Buy 140 $19.79 $2,771Financial Federal Credit Inc. FIF Buy 420 $26.80 $11,256Marten Transportation MRTN Buy 670 $17.09 $11,450True Religion Apparel Inc. TRLG Buy 400 $21.10 $8,440Alpha Natural Resources, Inc. ANR Buy 360 $15.76 $5,674Keystone Automotive Industries, Inc. KEYS Buy 150 $38.00 $5,700ManTech International Corp. MANT Buy 170 $33.00 $5,610

Marquette University AIM Fund October 4, 2005 Page 2
Table of Contents
Page
KEYSTONE AUTOMOTIVE INDUSTRIES, INC..................................................................................... 3 MARTEN TRANSPORTATION................................................................................................................. 6 IOWA TELECOMMUNICATIONS SERVICES INC. ............................................................................... 9 FINANCIAL FEDERAL CREDIT INC..................................................................................................... 12 TRUE RELIGION APPAREL INC............................................................................................................ 15 ALPHA NATURAL RESOURCES, INC. ................................................................................................. 18 SYNERON MEDICAL LTD...................................................................................................................... 21 MANTECH INTERNATIONAL CORP. ................................................................................................... 24
AIM FUND SECTOR MIX VS. RUSSELL 2000
0
5
10
15
20
25
Soft
ware %
Hard
ware %
Med
ia %
Tele
commun
icatio
ns %
Heal
th Care
%
Con
sumer
Service
s %
Busi
ness
Service
s %
Fina
ncial
Service
s %
Con
sumer
Goods
%
Indu
strial
Mate
rials %
Ene
rgy %
Utili
ties %
% o
f Por
tfol
io
AIM EQUITY FUND RUSSELL 2000
Marquette University AIM Fund October 5, 2006 Page 3
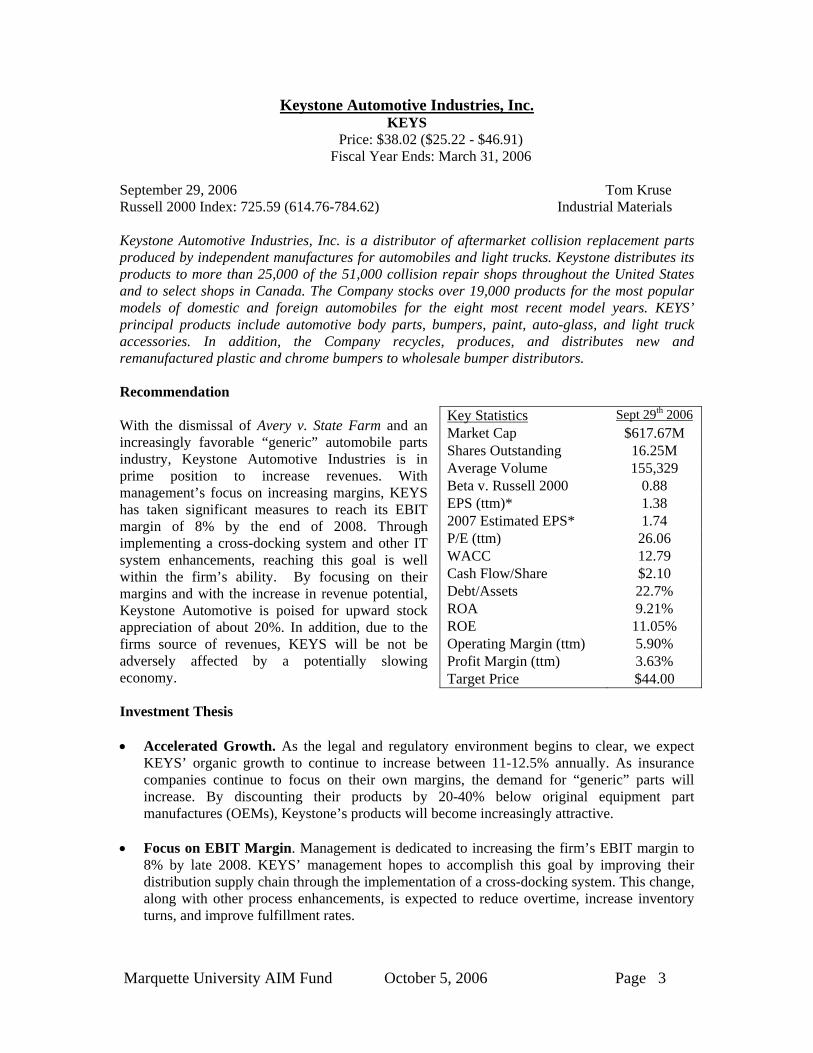
Keystone Automotive Industries, Inc. KEYS
Price: $38.02 ($25.22 - $46.91) Fiscal Year Ends: March 31, 2006
September 29, 2006 Tom Kruse Russell 2000 Index: 725.59 (614.76-784.62) Industrial Materials Keystone Automotive Industries, Inc. is a distributor of aftermarket collision replacement parts produced by independent manufactures for automobiles and light trucks. Keystone distributes its products to more than 25,000 of the 51,000 collision repair shops throughout the United States and to select shops in Canada. The Company stocks over 19,000 products for the most popular models of domestic and foreign automobiles for the eight most recent model years. KEYS’ principal products include automotive body parts, bumpers, paint, auto-glass, and light truck accessories. In addition, the Company recycles, produces, and distributes new and remanufactured plastic and chrome bumpers to wholesale bumper distributors. Recommendation With the dismissal of Avery v. State Farm and an increasingly favorable “generic” automobile parts industry, Keystone Automotive Industries is in prime position to increase revenues. With management’s focus on increasing margins, KEYS has taken significant measures to reach its EBIT margin of 8% by the end of 2008. Through implementing a cross-docking system and other IT system enhancements, reaching this goal is well within the firm’s ability. By focusing on their margins and with the increase in revenue potential, Keystone Automotive is poised for upward stock appreciation of about 20%. In addition, due to the firms source of revenues, KEYS will be not be adversely affected by a potentially slowing economy. Investment Thesis • Accelerated Growth. As the legal and regulatory environment begins to clear, we expect
KEYS’ organic growth to continue to increase between 11-12.5% annually. As insurance companies continue to focus on their own margins, the demand for “generic” parts will increase. By discounting their products by 20-40% below original equipment part manufactures (OEMs), Keystone’s products will become increasingly attractive.
• Focus on EBIT Margin. Management is dedicated to increasing the firm’s EBIT margin to
8% by late 2008. KEYS’ management hopes to accomplish this goal by improving their distribution supply chain through the implementation of a cross-docking system. This change, along with other process enhancements, is expected to reduce overtime, increase inventory turns, and improve fulfillment rates.
Key Statistics Sept 29th 2006 Market Cap $617.67M Shares Outstanding 16.25M Average Volume 155,329 Beta v. Russell 2000 0.88 EPS (ttm)* 1.38 2007 Estimated EPS* 1.74 P/E (ttm) 26.06 WACC 12.79 Cash Flow/Share $2.10 Debt/Assets 22.7% ROA 9.21% ROE 11.05% Operating Margin (ttm) 5.90% Profit Margin (ttm) 3.63% Target Price $44.00

Marquette University AIM Fund October 5, 2006 Page 4
• Economic Independence. With automobile accident frequency as the major factor in revenue growth, an economic slow down will have less of a negative affect than other firms in the business services industry.
Valuation Based on our discounted cash flow model, Keystone should be valued at $43.44. On a relative valuation, based on the forward P/E of KEYS’ competitors, the firm’s stock should be valued at roughly $45. The average analyst price target for KEYS is $43, with a high estimate of $45 and a low estimate of $40. Based upon our analysis, we believe that a target valuation of $44 is reasonable for the stock. Risks • Intellectual Property Rights. Original equipment parts manufactures may pursue legal
actions against Keystone and its associates for intellectual property rights violations. • Legislation. Legislation like Avery v. State Farm, although overturned, prohibiting or
limiting the use of “generic” replacement parts, could decrease future revenues. • Margin Pressure. By focusing on maintaining a discount under OEMs, Keystone’s prices
are a function of their competitors’ pricing. Any decrease in price by the OEM will force Keystone to cut prices and lower revenues. In addition, higher oil prices and any increase in the cost of goods sold may drive down KEYS’ gross margins.
• Supply Chain Disruptions. With the majority of KEYS’ products coming from Asia, any
disruption in the firm’s supply chain could adversely affect their financials. Management In June of 2004, Keystone Automotive experienced a leadership change by hiring Richard Keister, the former president of Delco Remy International’s aftermarket group. This change has brought about significant leadership changes in the human resources and logistics functional areas. These changes are in line with the KEYS’ intent to increase EBIT margins. Key Executives Pay Exercised Options Mr. Richard L. Keister, 60 Chief Exec. Officer, Pres $ 818K $ 0
Mr. Christopher Northup, 46 VP of Operations and Marketing $ 364K $ 119K
Mr. D. Currey Hall, 40 VP of Operations $ 376K $ 522K
Mr. Carl F. Hartman, 52 VP of Operations $ 376K $ 1.29M
Mr. Daniel G. Morrissey, 48 VP of Operations $ 359K $ 57K
Marquette University AIM Fund October 5, 2006 Page 5
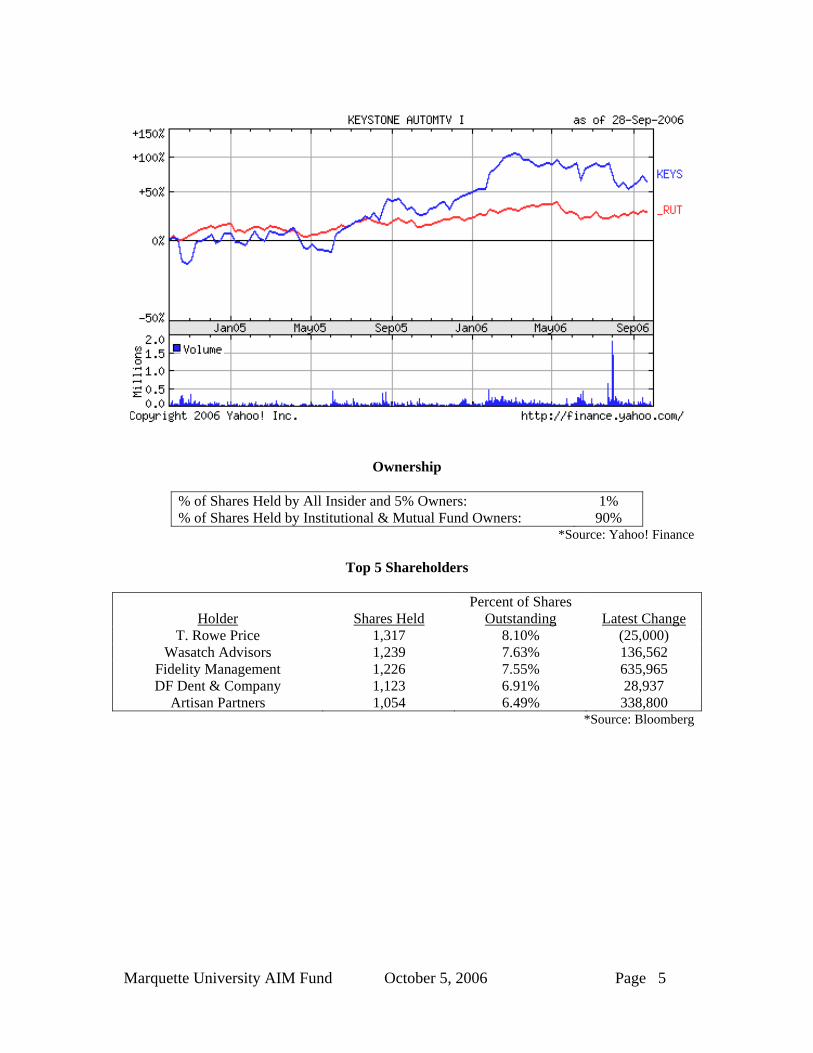
Ownership
% of Shares Held by All Insider and 5% Owners: 1% % of Shares Held by Institutional & Mutual Fund Owners: 90%
*Source: Yahoo! Finance
Top 5 Shareholders
Holder Shares Held Percent of Shares
Outstanding Latest Change T. Rowe Price 1,317 8.10% (25,000)
Wasatch Advisors 1,239 7.63% 136,562 Fidelity Management 1,226 7.55% 635,965 DF Dent & Company 1,123 6.91% 28,937
Artisan Partners 1,054 6.49% 338,800 *Source: Bloomberg

Marquette University AIM Fund October 5, 2006 Page 6
Marten Transportation MRTN
Price: $17.09 ($14.53 - $24.78) Fiscal Year Ends: December 31, 2006
September 30, 2006 Zachary Bloom Russell 2000 Index: 725.59 (614.76-784.62) Business Services Sector Marten Transport, Ltd. is a temperature-sensitive truckload carrier that specializes in the transportation of food and other consumer packaged goods throughout the United States. The company earns revenue through freight (91.1%), logistics (1.6%), and fuel surcharges (7.1%). Freight revenues are derived from transporting refrigerated items (79% of freight) and dry goods (21% of freight), performing loading and unloading services, and equipment detention. In 2005, the average length of haul for MRTN was 950 miles. As of December 31, 2005, the company operated a fleet of 2,618 tractors, including 2,195 company-owned tractors and 423 tractors supplied by independent contractors, as well as a fleet of 3,438 trailers. Recommendation MRTN’s proven track record, strong fundamentals, and dedicated management are what make them the leading temperature-controlled trucking service in the industry. Their focus and commitment to serving customer needs gives them the competitive edge in this niche market. Given the high probability of a reduction in fuel prices serving as a near term catalyst, combined with the long term need for this service, I recommend MRTN for a 2% position in the portfolio. Investment Thesis • Significantly lower driver turnover (71%)
when compared to the industry average (135%). The fact that MRTN is able to retain almost twice as many drivers as the competition should enable them to meet a greater portion of the demand in the coming holiday season by grabbing market share from their “driver crippled” competition.
• One of the best compensating trucking companies in the U.S. MRTN pays well and this
should aid them in attracting additional drivers when supply is tight, as it is presently. Moreover, given the limited number of “free agent” drivers, MRTN stands a good chance to lure drivers from the competition.
• Operating in a niche market with limited competition. While they experience some
competition from the smaller segments of other companies, MRTN is the only public ‘pure play’ temperature-sensitive truckload carrier in the U.S. Their long reputation of high quality service gives them a strong competitive edge in gaining and maintaining a leadership position as a core refrigerated goods carrier.
• The Energy Information Administration (EIA) projects a decline in diesel prices from
2006 to 2007 of 3 cents per gallon. While MRTN partially hedges their tractor fuel costs by collecting a surcharge, additional fuel costs are incurred to keep their trailers cool. The
Key Statistics Sept. 30, 2006 Market Cap $371.8M Shares Outstanding 21.8M Average Volume 168,700 Beta v. Russell 2000 1.20 FCF/Share $(2.25) EPS (TTM) $1.19 EPS (FY’ 06) $1.23 P/E (TTM) 14.4x P/E (FY’ 06) 14.0x Operating Margin 9.32% WACC 12.19% Debt/Assets 44.6% ROE 13.41% ROA 7.05% Target Price $23.00
Marquette University AIM Fund October 5, 2006 Page 7
projected fuel price declines should shield their profit margin from these additional fuel costs through 2007.
• One of the youngest tractor and trailer fleets in the industry (1.4 and 2.3 years
respectively). As the food and grocery industry continues to adopt just-in-time (JIT) inventory, on time delivery becomes extremely important. Their relatively newer fleet should reduce service/breakdown interruptions which will help to insure continued relationships with MRTN’s larger existing customers who adopt the JIT process.
• Accelerated fleet replacement in 2005 and 2006 will insure greater cash flexibility when
the EPA issues its next round of directives. This additional flexibility will help provide stability for MRTN during an uncertain economic environment, allowing them to add capacity to meet growing demand. This will allow MRTN to add tractors to secure more new drivers and/or convert independent contractors to company drivers.
Valuation On August 15, 2005, Knight Transportation (KNX) acquired a private pure play temperature-controlled trucking company, Edward Bros., for approximately 31.5M. By applying the EV/Sales and EV/Tractor multiples KNX paid for Edward to the sales and tractor projections for MRTN in 2007, I arrive at a weighted average target price of $23.00. Risks
• Competition from the larger industry players remains a continuing concern. While these companies do not specialize in temperature-controlled services, any attempt they make to increase that portion of their business will affect MRTN.
• Customer loses to competition would substantially affect growth. MRTN's top 30 customers represent 76% of revenues.
• Further exhaust regulations imposed by the EPA could have an adverse affect on MRTN's operating margin.
• Increases in diesel fuel prices and unpredictable economic factors could have an adverse affect on MRTN's operating margins.
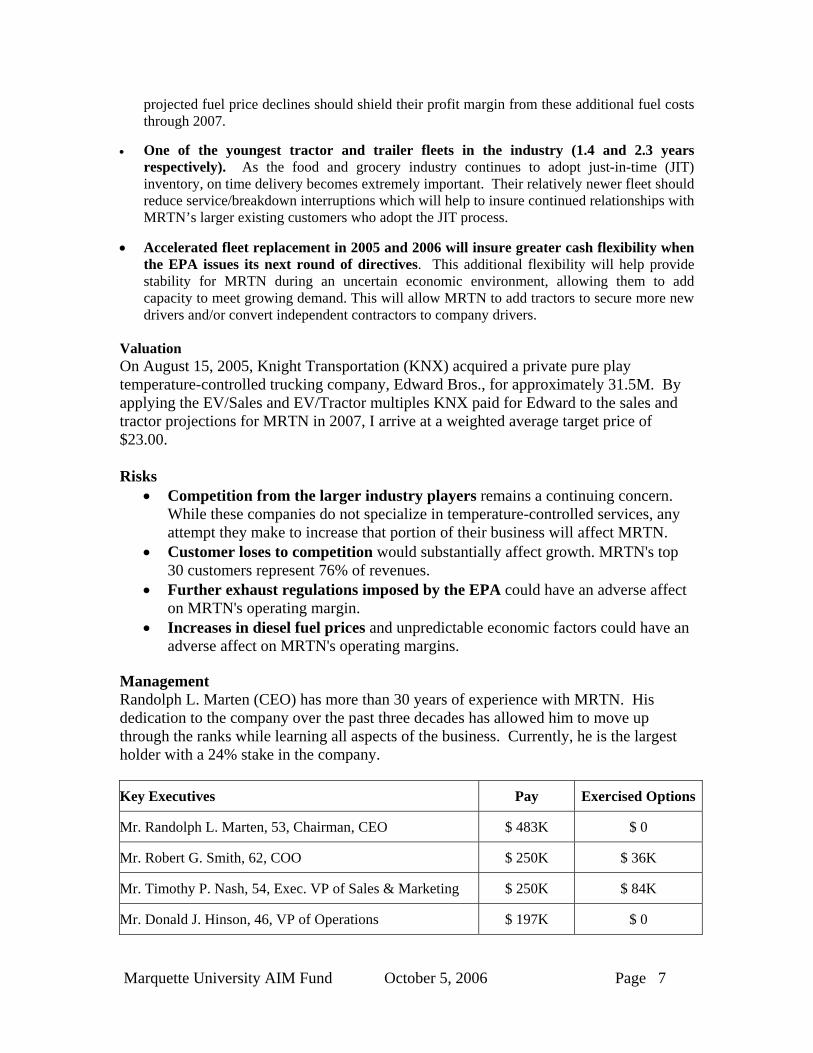
Management Randolph L. Marten (CEO) has more than 30 years of experience with MRTN. His dedication to the company over the past three decades has allowed him to move up through the ranks while learning all aspects of the business. Currently, he is the largest holder with a 24% stake in the company.
Key Executives Pay Exercised Options
Mr. Randolph L. Marten, 53, Chairman, CEO $ 483K $ 0
Mr. Robert G. Smith, 62, COO $ 250K $ 36K
Mr. Timothy P. Nash, 54, Exec. VP of Sales & Marketing $ 250K $ 84K
Mr. Donald J. Hinson, 46, VP of Operations $ 197K $ 0
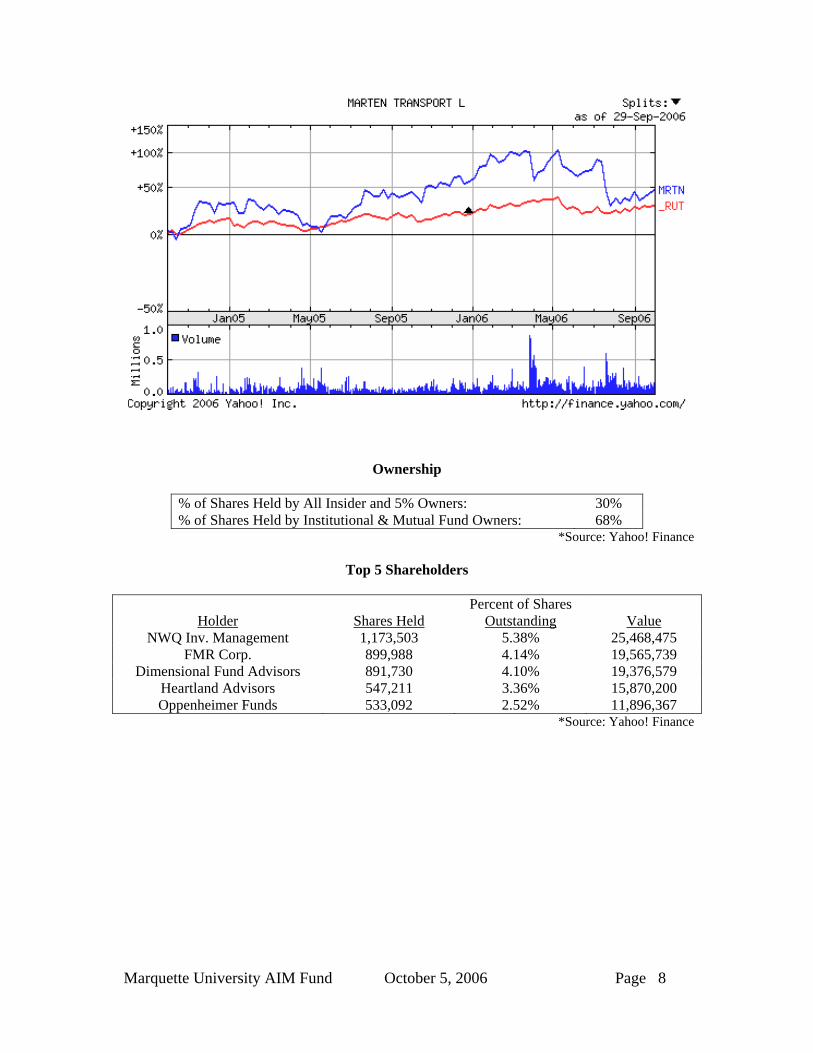
Marquette University AIM Fund October 5, 2006 Page 8
Ownership
% of Shares Held by All Insider and 5% Owners: 30% % of Shares Held by Institutional & Mutual Fund Owners: 68%
*Source: Yahoo! Finance
Top 5 Shareholders
Holder Shares Held Percent of Shares
Outstanding Value NWQ Inv. Management 1,173,503 5.38% 25,468,475
FMR Corp. 899,988 4.14% 19,565,739 Dimensional Fund Advisors 891,730 4.10% 19,376,579
Heartland Advisors 547,211 3.36% 15,870,200 Oppenheimer Funds 533,092 2.52% 11,896,367
*Source: Yahoo! Finance

Marquette University AIM Fund October 5, 2006 Page 9
Iowa Telecommunications Services Inc. IWA
Price: $19.66 ($15.26 - $20.24) Fiscal Year Ends: December 31, 2006
October 5, 2006 Patrick Jesse Russell 2000 Index: 732.54 (614.76 – 784.62) Telecom/Utilities Sector Iowa Telecommunications Services, Inc. (IWA) and its subsidiaries operate as an incumbent local exchange carrier in Iowa. IWA offers local services, which include basic local telephone service and enhanced local services, such as voice mail, caller ID, and call forwarding; network access services to interexchange carriers for the origination and termination of interstate and intrastate long distance phone calls on its network; toll services; and other services and sales, including dial-up and DSL Internet access. As of year end 2005, the company operated 293 telephone exchanges in over 440 towns and provided services to approximately 258,700 access lines in Iowa. IWA was incorporated in 1999 and is headquartered in Newton, Iowa. Recommendation Iowa Telecommunications has continued the drive for expansion throughout rural Iowa. The company has started up a competitive local exchange carrier (CLEC) business, where they will act as a competitor to another provider in 18 communities across the state. Also, IWA is looking towards further consolidation of the 150 small phone companies that currently exist in Iowa and nearby states. As IWA continues to gain market share through acquisition, I believe they are on track to appreciate to $24.28 within our holding period. Investment Thesis Benefit from being a RLEC. Rural Local Exchange Carriers (RLECs) are among the best organizations in the telecommunication services sector in generating consistent profits. This is due to their geographic monopolies and low level of competition from the large urban telecommunication providers. IWA primarily operates in smaller communities that are generally less competitive than larger cities. For the most part, IWA is the connection to the outside world for much of rural Iowa. This leads to long-term revenue sustainability and strong cash flows. Consolidations and acquisitions. Iowa Telecommunications Services recently announced that it acquired all the outstanding stock of Baker Communications, Inc. for $8.25 million in cash. Baker is a leader in the sales and support of communications and data networking for companies across Iowa and Nebraska. This acquisition allows Iowa Telecom to expand their customer base since Baker Communications’ clients are located in communities in which IWA currently has little presence. This consolidation is in line with their criteria for acquisitions to be accretive to cash flow on a per share basis. Another transaction was the acquisition of Montezuma Mutual Telephone Company, headquartered in Montezuma, Iowa. They provide telecommunications, cable and Internet services to customers in its rural Iowa service area. The operations serve approximately 2,299 telephone access lines, 1,300 cable television subscribers, and 900 data customers - including a wireless interest.
Key Statistics Oct 5 2006 Market Cap (MM) $631.0 Shares Outstanding (MM) 32.1 Monthly Volume 221,400 Beta vs. Russell 2000 0.50 EPS (TTM) $1.46 EPS (FY ’06) $1.15 P/E (TTM) 14.2x P/E (FY ’06) 17.1x FCF/Share (FY ’05) 0.8x Operating Margin 33.5% WACC 7.24% Debt/Assets 66% ROE 15.5% ROA 5.8%

Marquette University AIM Fund October 5, 2006 Page 10
Expanding Services. In early May, EchoStar Communications announced a strategic partnership with Iowa Telecomm to provide EchoStar’s DISH network digital satellite TV to IWA’s customers. This allows IWA to offer customers multi-channel digital TV as part of its bundled service offerings, all on one bill. This gives Iowa Telecom a strong strategic position to compete with other service providers by offering the “triple play” of telephone, television and broadband services. Valuation Using a discounted cash flow model, an intrinsic value of $24.28 was computed using a WACC of 7.24% and a near-term, growth rate of 8%. Their relative value measures were in line with the industry. I believe that IWA’s stock is undervalued by approximately 19% compared to its market value. Risks Regulatory Issues. The entire telecommunications industry has been under numerous regulatory issues during the past decade. The state of Iowa is currently on the path of having all primary line services deregulated by 2008. There has also been discussion about the universal service fund, which many rural companies rely upon to help fund their operation. There is uncertainty whether this will change; however, IWA receives little from the fund, so they do not have as much to potentially lose as their peers. In May 2006, the Iowa Legislature implemented a ban on ‘touch play’ machines throughout Iowa. These systems typically require an access line, as well as DSL service, to transmit data. As a result, Iowa Telecom experienced a one-time loss of approximately 500 access lines, as well as 500 DSL subscribers. It is a possibility that certain one-time losses like this could occur in the future due to changes in state and/or federal regulation. Growth is community specific in Iowa. Iowa Telecomm serves all four corners of the state. There are only a handful of counties where they do not provide services; however, across the entire state there are some rural communities that are losing population and others that are gaining at a rapid pace. IWA must meet the challenge of profitably serving both the communities that are shrinking in size and those that are growing significantly. Management Alan L. Wells is President and CEO of IWA and a member of its Board of Directors. He joined the company in 1999 as President and Chief Operating Officer, and was appointed to the role of President and CEO in 2002. Prior to joining Iowa Telecom, Mr. Wells was Senior Vice President and CFO at MidAmerican Energy Holdings Company.
Key Executives Pay Exercised Options
Mr. Alan L. Wells, 46, Chairman, CEO $ 739K $ 255K
Mr. Craig A. Knock, 43, CFO $ 289K $ 82K
Mr. Brian T. Naaden, 46, Chief Information Officer $ 234K $ 205K
Mr. Michael A. Struck, 47, VP of Sales and Marketing $ 194K $ 686K
Mr. David M. Anderson, 51, VP of External Affairs and Marketing $ 202K $ 0
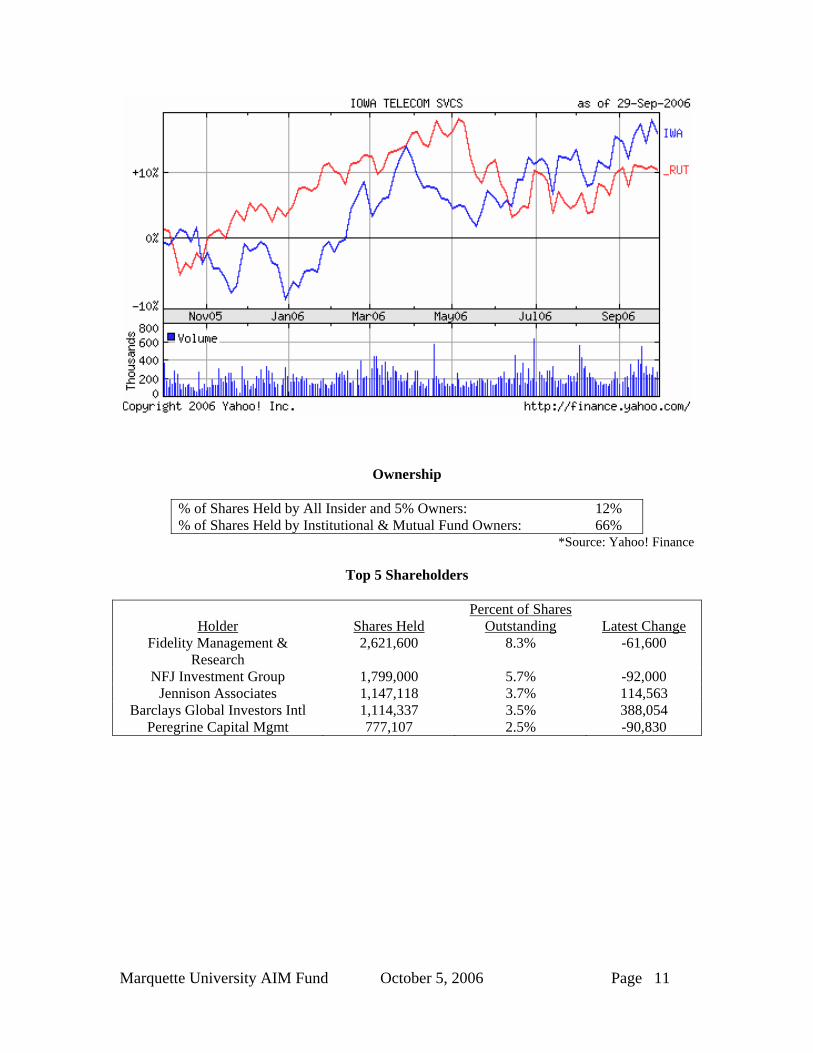
Marquette University AIM Fund October 5, 2006 Page 11
Ownership
% of Shares Held by All Insider and 5% Owners: 12% % of Shares Held by Institutional & Mutual Fund Owners: 66%
*Source: Yahoo! Finance
Top 5 Shareholders
Holder Shares Held Percent of Shares
Outstanding Latest Change Fidelity Management &
Research 2,621,600 8.3% -61,600
NFJ Investment Group 1,799,000 5.7% -92,000 Jennison Associates 1,147,118 3.7% 114,563
Barclays Global Investors Intl 1,114,337 3.5% 388,054 Peregrine Capital Mgmt 777,107 2.5% -90,830

Marquette University AIM Fund October 5, 2006 Page 12
Financial Federal Credit Inc. FIF
Price: $26.80 ($24.17 - $30.13) Fiscal Year Ends: July 31, 2007
September 29, 2006 Ashley Beckner Russell 2000 Index: 725.59 (614.76 – 784.62) Financial Services Sector Financial Federal Credit Inc. finances industrial and commercial equipment through installment sales and leasing programs for dealers, manufacturers, and end users. The company also provides capital loans secured by the same types of equipment and other collateral. The company’s customer base consists of small and medium sized businesses with annual revenues below $25 million in general construction, road and infrastructure construction and repair, road transportation, and waste disposal services. The company has marketing personnel in over twenty locations nationwide with five full-service operations in Texas, North Carolina, New Jersey, Illinois, and California. FIF is headquartered in Chicago, Illinois. Recommendation Financial Federal Credit has experienced significant growth over the past several years, specifically with a 7% increase in receivables origination in FY2006, while still increasing asset quality. They are well-positioned in the market as experts in this area of specialty financing. As the interest rate environment shifts to flat or falling rates, Financial Federal should profit from increasing margins. FIF should also experience overall growth resulting from the recently-enacted transportation bill, as well as the continuing post-Katrina rebuilding efforts. Based on these factors, we see FIF as a strong buy which we believe will appreciate to our target price of $36.35 within the holding period. Investment Thesis • Benefit from transportation bill. The transportation bill signed in August 2005 provides
guaranteed government funding of $244.1 billion over the next five years for transportation and infrastructure construction and repair. One of FIF’s core lines of business, finances the equipment used in these projects, which will provide an opportunity for continued growth.
• Favorable interest rate environment. Financial Federal profits from the ability to obtain
financing at lower rates than they provide to their customers. FIF experienced net interest margin compression of approximately 15 bps resulting from rising interest rates. As the interest rate environment shifts away from rising rates, FIF should be able to lower interest expense and increase their overall profit margins.
• Management expertise. Financial Federal’s management benefits from years of experience
in the construction industry which gives them a competitive edge in client management against their larger, more commercialized competitors.
Key Statistics Sep 29 2006 Market Cap $727.86M Shares Outstanding 27.16M Average Volume 120,694 Beta v. Russell 2000 .75 EPS (TTM) $1.58 2007 Estimated EPS $1.84 P/E (TTM) 16.93 WACC 5.84% Cash Flow/Share $2.35 Debt/Assets 75.80% ROE 11.74% Operating Margin 75.22% EPS Growth Est (5 Year) 12.00% Target Price $36.35
Marquette University AIM Fund October 5, 2006 Page 13
• Increasing asset quality. Lending policy controls have led to higher credit spreads due to
increasing asset quality. Overall, FIF has been able to significantly decrease net charge-offs, non-performing assets, and delinquent receivables.
Valuation Based on our discounted cash flow model, Financial Federal has an intrinsic value of $33.38. This value is heavily dependent on FIF’s weighted average cost of capital which reflects 66% debt financing at an average rate of 3.92%. The valuation assumes the ability of FIF to continue to obtain low-cost financing in the future. A relative P/E valuation approach values the stock at $31.85, and a relative P/BV approach values the stock at $30.34. Based on an average of these values, we believe that a target price of $36.35 is reasonable for the stock. FIF has a dividend yield of 1.50%. Risks • Interest rate risk. Based on FIF’s structure of borrowing and lending, they are always
exposed to a degree of interest rate risk. However, they were able to adjust and maintain profitability during 17 consecutive interest rate hikes by the Federal Reserve, which speaks to management’s ability to control this risk going forward.
• Residential construction slowdown. 41% of FIF’s financing goes into the area of general
construction. With the appearance of a slowdown in the area of residential construction, there could be a potential impact on growth in this line of business. However, because this segment includes commercial construction, the impact might not be as severe since this equipment can also be used for many other types of construction needs outside of solely residential.
• Competition from larger firms in the industry. Many of Financial Federal’s competitors
have an advantage in terms of their ability to provide lower-cost financing because of economies of scale.
Management The management team of Financial Federal collectively has significant experience in both specialty finance and the construction industry. Five of the company’s top executives have been with the company for at least 10 years and most of the executives have had 10 to 25 years of experience in equipment and specialty finance. Insiders and 5% holders currently hold approximately 6% of the shares outstanding.
Key Executives Pay Exercised Options
Mr. Paul R. Sinsheimer, 59, Chairman, CEO $ 1.28M $ 3.11M
Mr. Steven F. Groth, CFA, 54, CFO $ 280K $ 359K
Mr. Troy H. Geisser, 45, Sr. VP and Sec. $ 280K $ 214K
Mr. William M. Gallagher, 57, Chief Credit Officer $ 290K $ 71K
Mr. John V. Golio, 45, Exec. VP $ 300K $ 174K

Marquette University AIM Fund October 5, 2006 Page 14
Ownership
% of Shares Held by All Insider and 5% Owners: 6%
*Source: Yahoo! Finance
Top 5 Shareholders
Holder Shares Held Percent of Shares
Outstanding Latest Change Lord Abbett & Company 3,746,000 13.791% 615,947
Waddell & Reed 2,592,000 9.545% -35,000 Lateef Management 2,002,000 7.370% 39,484
Weatherbie M A & Co. 1,962,000 7.225% 70,204 Kayne Anderson Rudnick 1,750,000 6.442% -125,890
*Source: Bloomberg

Marquette University AIM Fund October 5, 2006 Page 15
True Religion Apparel Inc. TRLG
Price: $21.11 ($11.11 - $24.36) Fiscal Year Ends: December 31, 2006
September 29, 2006 Adam Bordner Russell 2000 Index: 725.59 (614.76 – 784.62) Consumer Goods Sector True Religion Apparel Inc., through its wholly-owned subsidiary, Guru Denim Inc., engages in the design, development, manufacture, marketing distribution and sale of high-fashion denim jeans and other apparel. True Religion Brand Jeans sell in the range of $170 to $300 per pair at retail, with some special edition versions selling for up to $500 or more. Premium denim is sold in multiple channels, including department stores, specialty stores and boutiques in the United States, Japan, Canada, the United Kingdom, Europe, Mexico, Korea, Australia and the Middle East. In 2005, the United States accounted for 55% of revenues, Japan 29% of revenues, and other international 15% of revenues, and the Internet accounted for about 1% of revenues. Recommendation True Religion Apparel Inc. is not just a “jeans company,” but is on track to becoming a lifestyle brand as it broadens its product mix beyond its denim roots by adding new products and categories each season. TRLG is already expanding globally, but is still in the early stages. New licensing agreement should boost sales and earnings in 2007. With the potential of becoming one of the most significant brands in the premium contemporary apparel genre, I think that True Religion Apparel Inc. will appreciate to $27.20 within our holding period. Investment Thesis • Expanding the True Religion Brand
Beyond Denim. TRLG has built its brand in the premium denim category, but is looking to a future beyond denim. Product extensions are crucial to offering retailers additional SKUs to add to their mix. The company’s goal is to have 25% of merchandise in non-denim by the end of 2006, with a long-term goal of 50% of non-denim merchandise. TRLG’s first non-denim success came with fleece separates.
• Global Expansion—Japan and Beyond. In 2005, international sales made up 45% of total
sales, with Japan being the company’s second largest market after the U.S. Additionally, a new relationship with China, announced on April 27, 2006, should begin adding to sales in 2007 when the bulk of orders start to come and as the brand gains traction there. TRLG has hired Bright Unity to be its exclusive China distributor, which has experience representing firms in the region, such as Dolce & Gabbana, Just Cavalli, and Gianfranco Ferre GF.
• Licensing—Significant Profit Opportunity. Licensing can help TRLG build a lifestyle
brand where they do not have core competencies to help grow presence in North American department stores and boutiques, as well as internationally in the longer term. A new
Key Statistics Sep 29 2006 Market Cap $484.75M Shares Outstanding 22.96M Average Volume 413,142 Beta v. Russell 2000 0.97 EPS (TTM) $0.975 2006 Estimated EPS $1.27 P/E (TTM) 21.65 WACC 14.35% Cash Flow/Share $0.58 Debt/Assets 0.00% ROE 63.02% Gross Margin 52.51% Operating Margin 32.53% EPS Growth Est (3 Year) 25.00% Target Price $27.20

Marquette University AIM Fund October 5, 2006 Page 16
licensing agreement should begin to add to sales in the second half of 2007 – with a long-term goal of 45% wholesale, 45% retail and 10% licensing.
• Broadening Senior Management to Support Growth. TRLG has taken rapid steps this
year toward building out its senior management ranks to support rapid growth. In 2006, TRLG added a new President and COO, which should help create a more stable environment to support future growth.
Valuation Based on my discounted cash flow model, True Religion should be valued at $27.20, while an average P/E valuation prices the stock around $25.90. The average analyst price target for TRLG is $25.50, with 6 providing buy ratings and 3 hold. I believe that a target valuation of $27.20 is reasonable for the stock. Risks • Purchases of the merchandise TRLG sells is generally discretionary, and therefore,
possibly susceptible to economic slowdowns. If current economic conditions deteriorate, TRLG’s business, financial condition, and result of operations could be adversely affected. Consumers are generally more willing to make discretionary purchases, including purchases of fashion products, during periods in which favorable economic conditions prevail.
• The company is still in the early stages of growth. The company has been public since
July 28, 2003, and there is little meaningful history of sales and revenues, nor an established business track record. Unanticipated problems, expenses, and delays are frequently encountered in ramping up production and developing new products, especially in the current stage of TRLG’s business.
• Competition from other players in the premium denim market. The apparel industry is
intensely competitive and fragmented, with TRLG competing against other similar small companies, as well as larger established companies. Examples include Seven for All Mankind, Citizens of Humanity, Polo Ralph Lauren, and Giorgio Armani.
Management The husband and wife team of Jeffrey and Kimberly Lubell founded True Religion Brand Jeans in 2002. Collectively, insiders own approximately 37% of the shares outstanding. Despite significant insider ownership, and the fact that Mr. Lubell is able to substantially control all matters requiring a stockholder vote, his interests appear to be aligned with those of other shareholders. Key Executives Pay Exercised OptionsMr. Jeffrey Lubell, 49, Founder, Chairman and Chief Exec. Officer $ 1.90M $ 4.26M Mr. Charles A. Lesser, 59, CFO $ 282K $ 5.84M Mr. Mark Saltzman, 57, Consultant $ 220K $ 1.29M Mrs. Kymberly Gold-Lubell, 39, Director, VP of Women's Design $ 350K $ 1.12M

Marquette University AIM Fund October 5, 2006 Page 17
Ownership
% of Shares Held by All Insider and 5% Owners: 37% % of Shares Held by Institutional & Mutual Fund Owners: 60%
*Source: Yahoo! Finance
Top 5 Shareholders
Holder Shares Held Percent of Shares
Outstanding Latest Change Lubell Family Trust 7,394,000 32.201% -195,000 Columbia Wanger 1,565,000 6.816% 630,200
Haas, Erwin J. 1,200,000 5.226% - Fidelity Management 1,098,000 4.781% 237,151
UBS Global Asset Management 933,700 4.066% 933,700 *Source: Bloomberg

Marquette University AIM Fund October 5, 2006 Page 18
Alpha Natural Resources, Inc. ANR
Price: $15.76 ($14.41 - $30.58) Fiscal Year Ends: December 31, 2006
September 29, 2006 Matt Grimm Russell 2000 Index: 725.59 (614.76 – 784.62) Energy Sector Alpha Natural Resources, Inc. is a leading Appalachian Coal Producer. As of December 31, 2005, the company owned or leased 489.5 million tons of proven and probable reserves, consisting mostly of high Btu, low sulfur steam and metallurgical coal used for electricity generation and steel production, respectively. The company is organized into eight regional business units located in Virginia, West Virginia, Pennsylvania, and Kentucky. These business units operate a total of 69 mines (44 active underground mines and 25 active surface mines) and 11 coal preparation plants. ANR was originally a holding company formed in 2002. In early 2005, there were a series of internal restructuring transactions which allowed Alpha Natural Resources to incorporate and issue an IPO on February 18, 2005. Recommendation Alpha Natural Resources, Inc. has made strategic acquisitions over the past several years to increase its holdings of high quality Appalachian coal reserves. These reserves are highly valued by electricity producers as they contain high heat content and are used to satisfy baseload electricity demand. The company’s metallurgical coal is ideal for steel producers, both domestic and abroad. The long-term macroeconomic picture for coal is favorable despite environmental critics and recent spot market price declines. An investment in ANR would be a good way to diversify the AIM fund’s energy holdings away from Oil and Natural Gas. The stock’s intrinsic value is $18, compared to the market price of $15.76. Investment Thesis • Benefit from secular macroeconomic trends. Coal remains a low cost source of energy in
comparison to other alternatives. The U.S. currently is estimated to have 240 years of supply at current production levels, thus making it a reliable energy source. The weak U.S. dollar makes coal attractive in comparison to foreign sources of energy and also provides for a strong export market.
• Continued demand from electricity producers. Approximately 50% of the U.S. electricity
supply is generated from coal-fired plants. This provides continuous demand for coal to serve baseload electricity needs. Additionally, the U.S. power grid is in desperate need of additional capacity. Given the high and volatile prices of petroleum and natural gas over the past several years, coal-fired plants are being constructed in order to provide a reliable source of electricity.
Key Statistics Sep 29 2006 Market Cap $1.02B Shares Outstanding 65.0M Average Volume 829,054 Beta v. Russell 2000 1.46 EPS (TTM) $1.13 2007 Estimated EPS $2.22 P/E (TTM) 13.96 WACC 11.97% Cash Flow/Share $2.69 Debt/Assets 49.61% ROE 35.81% Gross Margin 14.38% Operating Margin 7.04% EPS Growth Est (5 Year) 20.00% Target Price $18.00

Marquette University AIM Fund October 5, 2006 Page 19
• Diversify AIM Portfolio. The current holdings in the AIM portfolio are highly leveraged to oil and gas producers. ANR provides diversification into a relatively stable energy source.
• Advances in clean coal technology. Companies are currently developing technologies to
utilize coal in a much more environmentally friendly manner. This includes: coal to liquids, carbon dioxide capture and storage, SO2 scrubbers, etc. All of these technologies reduce pollution and will be beneficial to the coal industry as environmental regulations increase.
• Hedging. ANR enters into long-term contracts with electricity producers which range from
1-11 years. The average contract length is 2 years, which serves to lessen their price exposure to spot prices. As of December 2005, the company had priced 91%, 46%, and 25% of their planned 2006, 2007, and 2008 production, respectively.
Valuation The basis of this investment lies in the long-term prospects of the price of coal. At current coal price levels, I believe fair value to be approximately $18. This is based on the considerations of peer analysis (EV/EBITDA and P/E), as well as a DCF. This represents a 14% increase from its current market value. If the price of coal increases, my fair value will be adjusted. Risks • Increased competition and pricing pressures from Powder River Basin Coal. There are
vast surface deposits of coal in portions of Wyoming and Colorado. Much of this coal is being transported via rail to the northeast, thus competing with the Appalachian varieties and creating pricing pressure. PRB coal is of lower quality and sells at a price discount to Appalachian coal.
• Increasing environmental regulations. As the debate on global warming continues,
government mandates on pollution limits will intensify. While the U.S. may not have signed the Kyoto Protocol, this remains an important area to monitor. Many regulations already exist which add significant costs to the price of coal.
• Economic slowdown. The worldwide economy has experienced sustained growth during the
past several years. Not only has this resulted in greater demand for steam coal for electricity generation, but steel production has been very strong. This has dramatically increased demand for metallurgical coal, which made up 37% of the company’s sales in 2005. The price of this coal may drop if an economic slowdown occurs.
Management The management team has a lot of collective experience in the coal and commodities industry. One point to note is that there has been a lot of insider selling over the past year. This does not seem out of the ordinary given the IPO in early 2005. Key Executives Pay Exercised Options Mr. David C. Stuebe, 66, Chief Financial Officer and VP $ 499K $ 0 Mr. Michael D. Brown, 45, VP $ 539K $ 0 Mr. Kevin S. Crutchfield, 45, Exec. VP $ 645K $ 0 Mr. D. Scott Kroh, 56, Exec. VP $ 625K $ 0
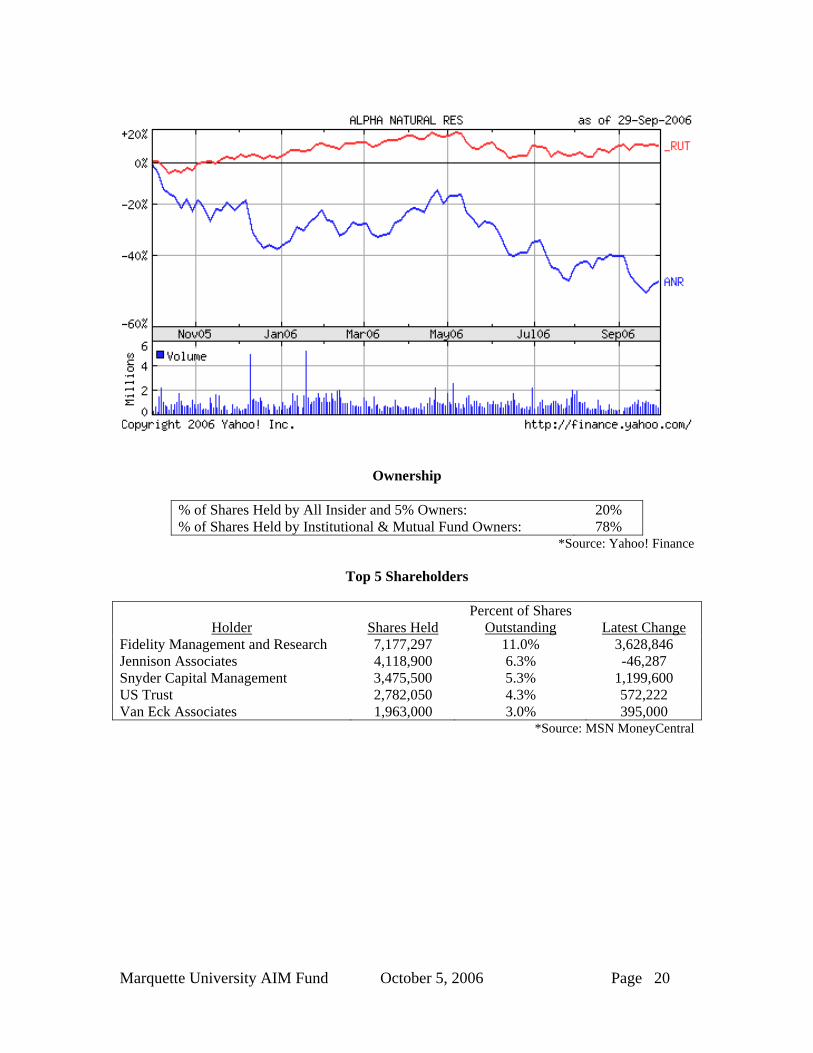
Marquette University AIM Fund October 5, 2006 Page 20
Ownership
% of Shares Held by All Insider and 5% Owners: 20% % of Shares Held by Institutional & Mutual Fund Owners: 78%
*Source: Yahoo! Finance
Top 5 Shareholders
Holder Shares Held Percent of Shares
Outstanding Latest Change Fidelity Management and Research 7,177,297 11.0% 3,628,846 Jennison Associates 4,118,900 6.3% -46,287 Snyder Capital Management 3,475,500 5.3% 1,199,600 US Trust 2,782,050 4.3% 572,222 Van Eck Associates 1,963,000 3.0% 395,000
*Source: MSN MoneyCentral
Marquette University AIM Fund October 5, 2006 Page 21
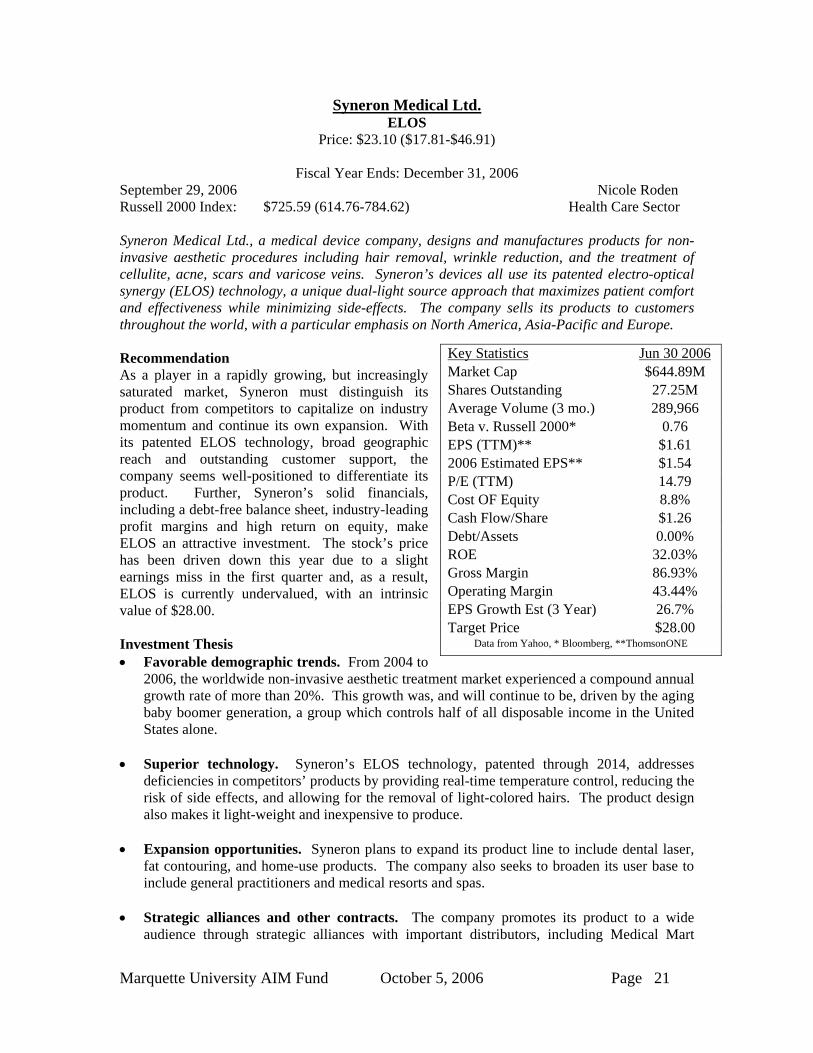
Syneron Medical Ltd. ELOS
Price: $23.10 ($17.81-$46.91)
Fiscal Year Ends: December 31, 2006 September 29, 2006 Nicole Roden Russell 2000 Index: $725.59 (614.76-784.62) Health Care Sector Syneron Medical Ltd., a medical device company, designs and manufactures products for non-invasive aesthetic procedures including hair removal, wrinkle reduction, and the treatment of cellulite, acne, scars and varicose veins. Syneron’s devices all use its patented electro-optical synergy (ELOS) technology, a unique dual-light source approach that maximizes patient comfort and effectiveness while minimizing side-effects. The company sells its products to customers throughout the world, with a particular emphasis on North America, Asia-Pacific and Europe. Recommendation As a player in a rapidly growing, but increasingly saturated market, Syneron must distinguish its product from competitors to capitalize on industry momentum and continue its own expansion. With its patented ELOS technology, broad geographic reach and outstanding customer support, the company seems well-positioned to differentiate its product. Further, Syneron’s solid financials, including a debt-free balance sheet, industry-leading profit margins and high return on equity, make ELOS an attractive investment. The stock’s price has been driven down this year due to a slight earnings miss in the first quarter and, as a result, ELOS is currently undervalued, with an intrinsic value of $28.00. Investment Thesis • Favorable demographic trends. From 2004 to
2006, the worldwide non-invasive aesthetic treatment market experienced a compound annual growth rate of more than 20%. This growth was, and will continue to be, driven by the aging baby boomer generation, a group which controls half of all disposable income in the United States alone.
• Superior technology. Syneron’s ELOS technology, patented through 2014, addresses
deficiencies in competitors’ products by providing real-time temperature control, reducing the risk of side effects, and allowing for the removal of light-colored hairs. The product design also makes it light-weight and inexpensive to produce.
• Expansion opportunities. Syneron plans to expand its product line to include dental laser,
fat contouring, and home-use products. The company also seeks to broaden its user base to include general practitioners and medical resorts and spas.
• Strategic alliances and other contracts. The company promotes its product to a wide
audience through strategic alliances with important distributors, including Medical Mart
Key Statistics Jun 30 2006 Market Cap $644.89M Shares Outstanding 27.25M Average Volume (3 mo.) 289,966 Beta v. Russell 2000* 0.76 EPS (TTM)** $1.61 2006 Estimated EPS** $1.54 P/E (TTM) 14.79 Cost OF Equity 8.8% Cash Flow/Share $1.26 Debt/Assets 0.00% ROE 32.03% Gross Margin 86.93% Operating Margin 43.44% EPS Growth Est (3 Year) 26.7% Target Price $28.00
Data from Yahoo, * Bloomberg, **ThomsonONE

Marquette University AIM Fund October 5, 2006 Page 22
Supplies and Dufort & Lavigne in Canada and Miracle Laser in China. Syneron also recently entered a $6 million private label deal with American Laser Centers, the largest U.S. physician-supervised aesthetic clinic chain.
Valuation Based on a discounted cash flow model, Syneron should be valued at $27.75. According to a relative valuation model based on the forward P/E of ELOS’s competitors, the stock should be valued at $32.00. I believe a target value of $28.00 is reasonable. Risks • Geopolitical risks. While Syneron generates most of its sales outside of Israel, its corporate
headquarters are still based in the country. The stock fell during the July 2006 Hezbollah attacks and may continue to be affected by events in that region.
• Low accounts receivable turnover. Syneron turned over its accounts receivable roughly 6
times in 2005, a rate below the industry average. With a new financing offer rolled out last month, requiring no interest or payments on purchases until 2008, dramatic improvement in this ratio is unlikely.
• Intellectual property. If any of Syneron’s 15 pending patents fail to receive approval, the
company’s innovations and ideas would be vulnerable to exploitation by competitors. The weakness of any of its current patents would similarly erode Syneron’s product differentiation. Finally, the company could be sued for patent infringement by other firms in the industry. At present, competitor Palomar Technologies Inc. (PMTI) poses a threat in this area given the company’s recent suits against other firms in the industry. Despite this, we believe that ELOS will not likely be sued by PMTI.
• Change in Israeli taxes. Syneron currently benefits from special tax treatment because of its
“Enterprise Status,” with an overall effective tax rate of less than 3%. If Israel were to abandon this tax treatment, the company’s bottom line would suffer.
Management Because of Syneron’s limited history, the management team reflects a mix of internally-grown and externally recruited individuals, most of whom have backgrounds in either science or technology. The four main executives of the company currently hold approximately 10% of the shares outstanding and receive combined annual compensation of $1 million. Syneron’s corporate governance policies are explicitly communicated in the annual 20-F filing with the SEC.
Key Executives
Mr. David Schlachet, 60, Chief Exec. Officer
Mr. David Seligman, 47, Chief Financial Officer
Hans Edel, Pres of Syneron Europe
Mr. Doron Gerstel, 46, Pres of Syneron Inc. and Pres of Syneron Canada Corp.
Yoram Sadeh, Principal Accounting Officer and VP of Fin.
Marquette University AIM Fund October 5, 2006 Page 23
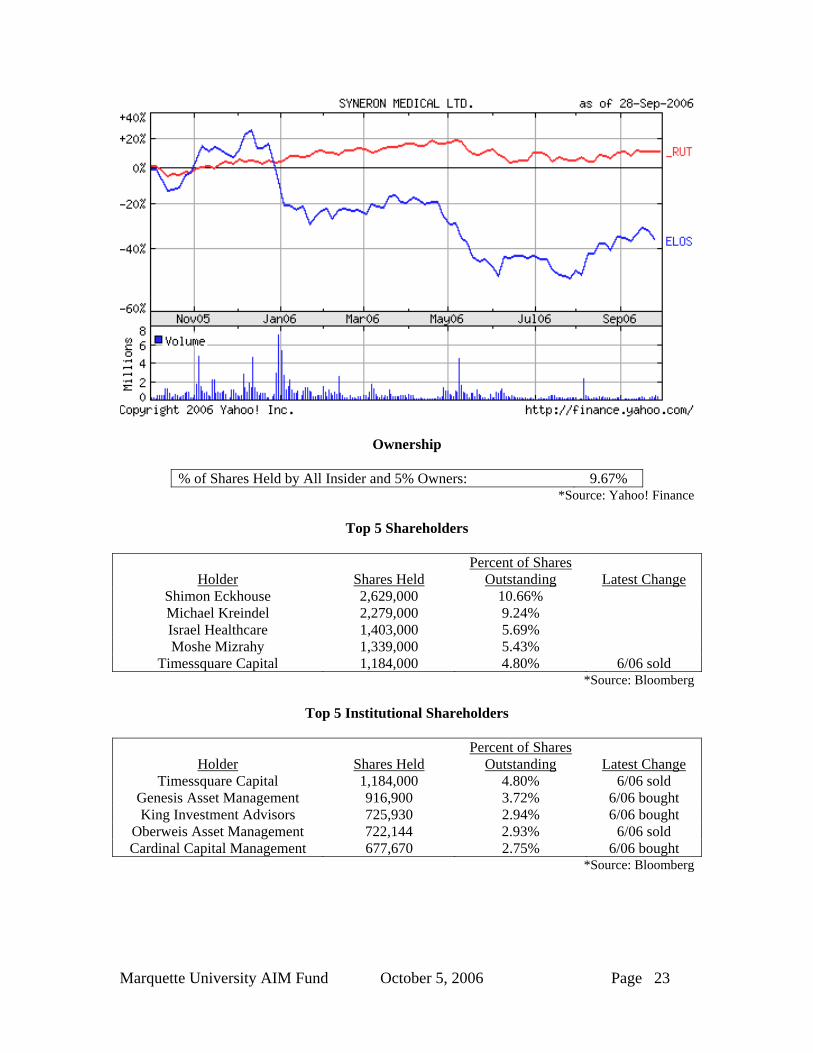
Ownership
% of Shares Held by All Insider and 5% Owners: 9.67% *Source: Yahoo! Finance
Top 5 Shareholders
Holder Shares Held Percent of Shares
Outstanding Latest Change Shimon Eckhouse 2,629,000 10.66% Michael Kreindel 2,279,000 9.24% Israel Healthcare 1,403,000 5.69% Moshe Mizrahy 1,339,000 5.43%
Timessquare Capital 1,184,000 4.80% 6/06 sold *Source: Bloomberg
Top 5 Institutional Shareholders
Holder Shares Held Percent of Shares
Outstanding Latest Change Timessquare Capital 1,184,000 4.80% 6/06 sold
Genesis Asset Management 916,900 3.72% 6/06 bought King Investment Advisors 725,930 2.94% 6/06 bought
Oberweis Asset Management 722,144 2.93% 6/06 sold Cardinal Capital Management 677,670 2.75% 6/06 bought
*Source: Bloomberg

Marquette University AIM Fund October 5, 2006 Page 24
ManTech International Corp. MANT
Price: $33.01 ($24.53 - $38.75) Fiscal Year Ends: December 31, 2006
September 29, 2006 Matthew Rose Russell 2000 Index: 765.14 (614.76 – 784.62) Software Sector ManTech International is a premier provider of innovative technological solutions to mission critical national security programs. Founded in 1968, the company has over 6,000 employees that operate in 44 countries around the globe. Its services fall into three main categories: secure systems and infrastructure solutions, information technology services, and systems engineering. ManTech acquired Gray Hawk Systems in 2005 to expand its intelligence analysis capabilities. Recommendation ManTech derives 95% of its revenues from the federal government. Its principal clients include the Departments of Defense (DoD), Sate, Homeland Security, and NASA. These agencies rely on technology service providers to meet the persistent need for sophisticated intelligence gathering and information sharing systems. MANT is uniquely positioned to take advantage of both DoD spending and the ever-broadening scope of Homeland Security. Investment Thesis • Play on Defense Intelligence Spending.
Defense spending has accelerated at record rates since 9/11. Fiscal pressure from Congress is leading to slower top-line growth in defense spending, but also is shifting the mix towards IT related services. The FY07 budget for Homeland Security is expected to be around $32B, a 6% increase over 2006. IT will account for approximately 10% of total spending, up 22% from 2006. The $437B DoD budget for information assurance will see a 15% increase. The secular trend of an increased focus on the intelligence apparatus to combat the ‘War on Terrorism’ puts MANT in a strong position for sustained long-term growth. Congress has passed an appropriations bill and President Bush is expected to sign it in early October. We expect the end market for intelligence capabilities will see sustained growth.
• High Barriers to Entry. The IT component of national security is fiercely competitive from
a technological perspective and has compelling security concerns. More than 75% of ManTech’s employees have US government clearance and nearly half are cleared to the Top Secret or above levels. Their experience and expertise have lead MANT to be a prime contractor on 70% of its projects.
• Sector End Market Diversification. The US federal government is the single largest
consumer of IT related products and services, the majority of which come from national security and defense agencies with which ManTech has an established relationship. Current software holdings in the AIM Fund are levered to corporate spending and to lesser extent to
Key Statistics Sep 29 2006 Market Cap $1.11B Shares Outstanding 33.564M Average Volume 121,074 Beta v. Russell 2000 0.97 EPS (TTM) $1.38 2006 Estimated EPS $1.63 P/E (TTM) 24.01 WACC 10.80% Free Cash Flow/Share $1.70 Debt/Assets 7.65% ROE 14.44% Gross Margin 17.79% Operating Margin 8.61% EPS Growth Est (3 Yr) 16.67% Target Price $40.00

Marquette University AIM Fund October 5, 2006 Page 25
the consumer. While we anticipate continued high growth from MANT’s exposure to the intelligence business, this investment also may provide some stability in the event of a more pronounced U.S. economic slowdown.
Valuation Based on a discounted cash flow model, MANT should be valued at $42.41. Assuming a buyout in 2011 with an EV/EBITDA of 12x would boost the price into the mid $50’s. The average analyst price target is $37.25. The sub-sector has been down over the summer due to uncertainty about the timing of appropriations bills; however, we believe MANT to be undervalued by about 20%. Risks • Shifts in Priorities. The federal government has a change in management every 4 or 8 years
and along with that comes the risk that spending priorities may shift away from defense. The 2008 election cycle is likely to focus on the strategy in Iraq and the threat of terrorism. Regardless of the political outcome and military strategy, we believe that intelligence and security are likely to remain top priorities.
• Fixed-Price Contract Overruns. MANT has some exposure to fixed-price contracts and
cost overruns, which could hinder future earnings. In 2004, the company missed earnings as a result of overruns and high acquisition costs associated with the purchase of MSM Security Services.
• Acquisition Integration Risk. ManTech’s strategy for growth calls for strong organic
growth - enhanced by disciplined acquisitions. Deals are usually done to acquire technology or key personnel and can be quite complex. Other than the purchase of MSM, MANT has a relatively good history of successful integration.
Management The management team of ManTech International is highly experienced. Co-founder George Pedersen is still with the firm as Chairman and CEO while former Gray Hawk executive Robert Coleman has come on board as President and COO. Mr. Pedersen still has extensive holdings in the firm and his Class B shares carry a 10-1 voting rights ratio over Class A shareholders in most circumstances. The board of directors is highly distinguished and includes former Deputy Secretary of State, Richard Armitage; former Vice Chairman of the Joint Chiefs of Staff, Admiral David Jeremiah; and former Deputy Director of the CIA, Richard Kerr. Due to the secure nature of its business, corporate governance is critical and the company’s independent directors meet regularly in executive session without management present.
Key Executives Pay Exercised Options George J Pedersen $1.8M $0 Robert A. Coleman $820K $0
Kevin Phillips $421K $0 Gen. Eugene C. Renzi $1.25M $367K Kurt J. Snapper, Ph.D. $405K $262K
*Source: Yahoo! Finance
Marquette University AIM Fund October 5, 2006 Page 26
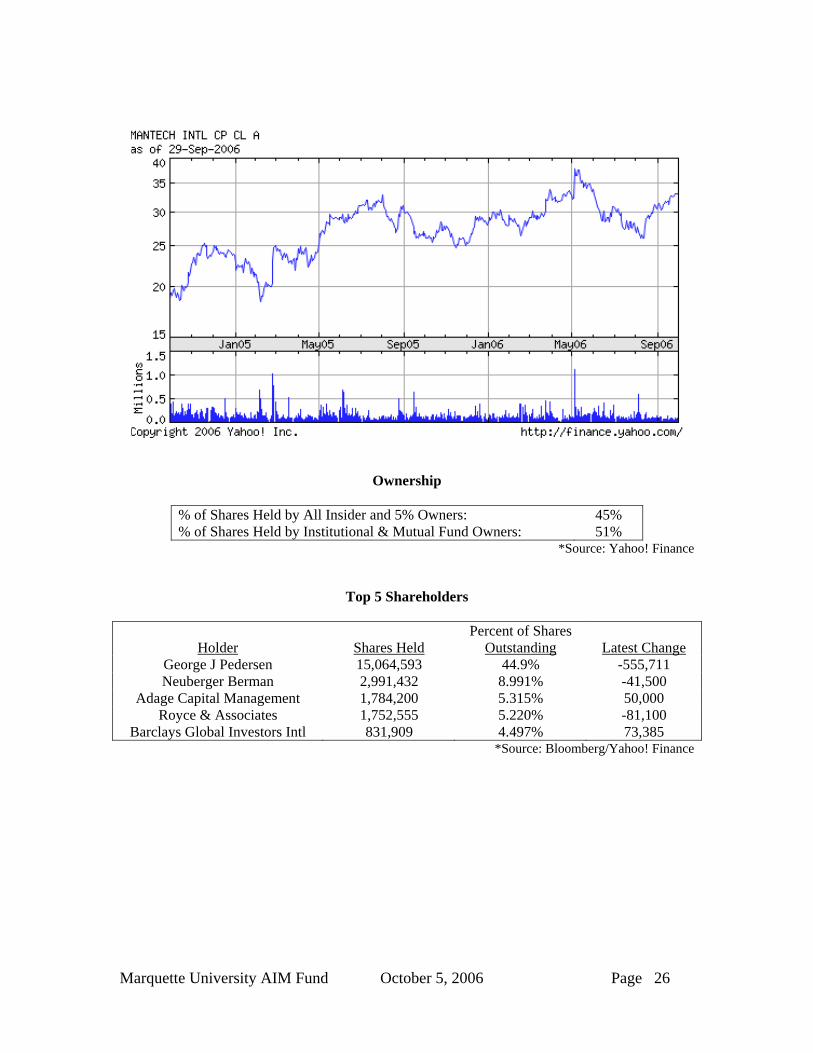
Ownership
% of Shares Held by All Insider and 5% Owners: 45% % of Shares Held by Institutional & Mutual Fund Owners: 51%
*Source: Yahoo! Finance
Top 5 Shareholders
Holder Shares Held Percent of Shares
Outstanding Latest Change George J Pedersen 15,064,593 44.9% -555,711 Neuberger Berman 2,991,432 8.991% -41,500
Adage Capital Management 1,784,200 5.315% 50,000 Royce & Associates 1,752,555 5.220% -81,100
Barclays Global Investors Intl 831,909 4.497% 73,385 *Source: Bloomberg/Yahoo! Finance