applications of whole genome sequencing (wgs) technology on food safety management: us presentation
TRANSCRIPT

U.S. Presentations
Dr. Marc Allard Dr. John Besser
Dr. Stephanie Defibaug-Chavez

John BesserCDC, Enteric Diseases Laboratory Branch
U.S. Nationwide Real-time WGS-based Surveillance

Annual workflow: 60,000-70,000 isolates/yr
PulseNet Database: ~750,000 patterns (2015)
87 laboratories

National Cluster Investigations:30 – 60 monitored per week
State Cluster Investigations:
1,500 – 2,000 per year

Foodborne Disease Surveillance
Farm Transport
Processing
Distribution
Preparation
Disease
surveillance
X
Limit ongoing illness
Fix underlying problems, measure effectiveness of controls
Food monitoring / Genome TrackR

Food Commodities Made Safer Through PulseNet-
Triggered Outbreak Investigations
Ready-to-eat & “ready-to cook” foods
Beef
Spices
Tree nuts
Eggs
Vine vegetables
Leafy greens
Poultry
Peanut products
Sprouts
Mellon
Flour
Deli meats
Cheese and dairy

Listeria Outbreaks and Incidence, 1983-2014
0
1
2
3
4
5
6
7
8
9
0
1
2
3
4
5
6
7
8
1983 1985 1987 1989 1991 1993 1995 1997 1999 2001 2003 2005 2007 2009 2011 2013 2015
Outbreak
Incidence
Pre-PulseNet
0.3
69
Early
PulseNet
2.3
11
Listeria
Initiative
2.9
5.5
No. outbreaksIncidence
(per million pop)
Era
Outbreaks per year
Median cases per
outbreak
WGS
?
?

LM caseState/Local
Health Agency CDC
PulseNet
FDAUSDA
Nationwide Listeriosis Surveillance System
• Food / animal, environment sampling
CasesInterview Case / Food
questionnaire
Isolates
GenomeTrakR
Isolates
WGS PFGE
WGSPFGE
Case-CaseStudiesNCBI-Genbank (U.S.)
DDBJ (Japan)
EMBL (Europe)
upload
analysis
International Nucleotide Sequence Database Collaboration
WGS

PulseNet WGS Requirements
High resolution strain-typing, high epidemiological concordance
Consolidation of subtyping and reference laboratory workflows
Compatible with epidemiology and regulatory tracking systems
Ability to compare and communicate results locally, nationally, globally
Fast, economical
Local control
Minimal need for local bioinformatics, local high performance computing

Public Health WGS Workflow
Nomenclature server
Calculation engineTrimming, mapping, de novo
assembly, SNP detection,
allele detection
PH databases
Users at CDC and in the
States
Allele databases
External storageNCBI, ENA, BaseSpace
Sequencer
Raw sequences
LIMS
Data pathway
Proposed data pathway
Analysis request
Genus/speciesSerotypePathotypeResistance
7-gene MLSTrMLSTcMLSTwgMLST
hqSNP analysis(v. 7.6)

14
N/A1
6
19
6
4 4
21
6
9
3
0
5
10
15
20
25
No. of clustersdetected
No. of clustersdetected sooneror only by WGS
No. of outbreakssolved
(food sourceidentified)
Median no. ofcases per cluster
Pre-WGS (Sept 2012–Aug 2013)
WGS Year 1 (Sept 2013–Aug 2014)
WGS Year 2 (Sept 2014–Aug 2015)
Listeria Cluster Metrics Before and After WGS
Note that cluster 1508MLGX6-1WGS counted as solved with 24 cases

Solved Outbreaks: New Food Sources of Listeriosis

Listeria and Caramel Apples
• 35 cases• 12 states• 34 hospitalizations• 7 deaths

Whole-Genome Multilocus Sequence Typing (wgMLST)
wgMLST (<All Characters>)
100
90
80
70
60
50 Key
.
.
.
.
.
.
.
.
.
.
.
.
.
.
.
.
.
.
.
.
.
RunIds
.
CalculationStatuscdc_id
2014L-6572
2014L-6716
2014L-6704
2014L-6707
2014L-6684
2014L-6710
2014L-6656
2014L-6724
2014L-6681
2014L-6695
2014L-6677
2014L-6679
2014L-6714
2014L-6723
2014L-6660
2014L-6713
2014L-6577
Id
CFSAN023708
PNUSAL001035
PNUSAL001167
PNUSAL001188
PNUSAL001177
PNUSAL001180
PNUSAL001146
PNUSAL001157
PNUSAL001168
PNUSAL001182
PNUSAL001131
PNUSAL001196
PNUSAL001154
PNUSAL001166
PNUSAL001151
PNUSAL001153
PNUSAL001186
PNUSAL001195
PNUSAL001135
PNUSAL001185
PNUSAL001040
State ID
USDA_853178331
MN___C2014016179
MN___C2014019515
TX___TXACB1403719
WI___14MP008990
AZ___AZ00023560
MN___C2014019204
CDC__M14-119
MN___C2014019628
CDC__M14-124
TX___TXACB1403543
AZ___AZ00023800
AZ___AZ00023172
CDC__M14-123
WI___14MP008696
AZ___AZ00023398
NM___2014035025
CDC__M14-127
CDC__2014033414
NM___2014035347
CO___HUM-2014016.
PFGE-AscI-pattern
GX6A16.0012
GX6A16.0012
GX6A16.0012
GX6A16.0012
GX6A16.0012
GX6A16.0012
GX6A16.0012
GX6A16.0012
GX6A16.0012
GX6A16.0012
GX6A16
GX6A16.0135
GX6A16.0135
GX6A16.0135
GX6A16.0135
GX6A16.0135
GX6A16.0135
GX6A16.0135
GX6A16.0135
GX6A16.0135
GX6A16.0135
PFGE-ApaI-pattern
GX6A12.0126
GX6A12.0126
GX6A12.0696
GX6A12.0696
GX6A12.0126
GX6A12.0696
GX6A12.0696
GX6A12.0696
GX6A12.0696
GX6A12.0696
GX6A12.0349
GX6A12.0349
GX6A12.0349
GX6A12.0349
GX6A12.0349
GX6A12.0349
GX6A12.0349
GX6A12.0349
GX6A12.0349
GX6A12.0349
GX6A12.0349
Outbreak
1411MNGX6-1NOT
1411MNGX6-1NOT
1411MNGX6-1
1411MNGX6-1
1411MNGX6-1
1411MNGX6-1
1411MNGX6-1
1411MNGX6-1
1411MNGX6-1
1411MNGX6-1
1411MLGX6-1WGS
1411MLGX6-1WGS
1411MLGX6-1WGS
1411MLGX6-1WGS
1411MLGX6-1WGS
1411MLGX6-1WGS
1411MLGX6-1WGS
1411MLGX6-1WGS
1411MLGX6-1WGS
1411MLGX6-1WGS
1411MLGX6-1WGS
Serotype
.
.
.
.
.
.
.
.
.
.
.
.
.
.
.
.
.
.
.
.
.
IsolatDate
2014-07-18
2014-09-08
2014-11-06
2014-11-05
2014-11-09
2014-10-29
2014-10-26
2014-11-08
2014-10-17
2014-11-08
2014-10-20
2014-11-02
2014-10-29
2014-10-26
2014-11-08
2014-11-06
2014-10-21
2014-11-07
2014-09-12
4 [1–6]
89 [89–89]
5 [1–114]
3 [0–10]
4 [0–44]
1,628 [0–1,694]
Allele differences at node: median [min–max](>5,800 loci analyzed by BioNumerics software)
Cluster 1 (≤6 allele differences)
Cluster 2 (≤10 allele differences)
PFGE
Unrelated isolates (hot dog and patient)
Unrelated patient isolate (Sept. 2014)
Highly-related patient isolate; different PFGE pattern
Not closely related(minimum 1,628 allele
differences)
Data as of December 9, 2014
PFGE Pattern 1
PFGE Pattern 2
PFGE Pattern 3

Inclusion/exclusion of individual cases in clusters
Greater significance of smaller disease clusters
Stronger hypotheses from food/environment to human illness “matches”
Ruling out clusters
Root cause analysis
Real-time WGS Appears Useful for…..

Successful use of WGS requires integrated real-time surveillance (not just a better lab method)
Acquiring and analyzing exposure data is still the limiting factor of sporadic case-based surveillance
More attention needs to be given to cluster detection and epidemiological analysis methods
Lessons Learned

Projected wgMLST Database Validation and Deployment Timeline
Apr 14 Oct 14 Apr 15 Oct 15 Apr 16 Oct 16 Apr 17 Oct 17 Apr 18 Oct 18 Apr19
Development and internal validation
Deployment
Development and internal validation
Deployment
Development and internal validation
Deployment
Development and internal validation
Deployment
Development and internal validation
← External validation
← External validation
← External validation
← External validation
External validation →
Cronobacter &Yersinia
Vibrio, Shigella &other diarrheagenicE. coli
Salmonella
Campylobacteraceae& Shiga toxin-producing E. coli (STEC)
Listeria monocytogenes

The findings and conclusions in this presentation are those of the author and do not necessarily represent the views of the Centers for Disease
Control and Prevention
U.S. Nationwide Real-time WGS-based Surveillance

GenomeTrakr: A Pathogen Database
Marc W. Allard, PhDSenior Biomedical Research Services OfficerDivision of [email protected]
Food and Agriculture Organizationof the United Nations (FAO):
Expert workshop on practical applications of Whole Genome Sequencing (WGS) on food safety management. Dec. 7-8, 2015
Eric W. Brown, PhDDirector Division of [email protected]

PFGE identical in red NGS distinguishes geographical structure among closely related Salmonella Bareilly strains

Same PFGEbut not part of the outbreak
Outbreak Isolates2-5 SNPs
SNP phylogeny for S. Bareilly strains

22

S. Braenderup


GenomeTrakr Fast Facts
First distributed network of labs to utilize WGS for pathogen identification
GenomeTrakr network has sequenced more than 40,000 isolates, and closed more than 100 genomes through November 12, 2015.
Currently sequencing more than 1,000 isolates a month
The need for increased number of well characterized environmental (food, water, facility, etc.) sequences may outweigh the need for extensive clinical samples

GenomeTrakr Labs
• 14 federal labs
• 14 state and university labs
• 1 U.S. hospital lab
• 5 labs outside of the U.S.
• Collaborations with independent academic researchers
• More GenomeTrakr labs coming on-line

27
Nu
mb
er
of
Se
qu
en
ce
s(a
s o
f th
e last day o
f th
e q
uart
er)
Total Number of Sequences in the GenomeTrakr Database
2013 2014 2015
Average Number of SequencesAdded Per Month in 2013 = 184
Average Number of SequencesAdded Per Month in 2014 = 1,049
First sequences uploaded in Feb 2013
Public Health Englanduploads more than 8,000 Salmonella sequences


0
5
10
15
20
25
30
35
40
4 8 12 16 20 24 28 32 36 40 44 48 52 56 60 64 68
Timeline for Foodborne Illness Investigation
Using Whole Genome Sequencing
Contaminated
food enters
commerce
FDA, CDC, FSIS, and States use WGS in
real-time and in parallel on clinical, food,
and environmental samples
Source of contamination
identified early through WGS
combined database queries
Averted Illnesses N
um
be
r o
f C
ase
s
Days

MINIMAL PATHOGEN METADATA
(FOODBORNE OUTBREAKS)
sample_name
organism
strain/isolate
Category (attribute_package)
1a) Clinical/Host-associated
1a1) specific_host
1a2) isolation_source
1a3) host-disease
OR
1b) Environmental/Food/Other
1b1) isolation_source
Countries, Academia, and Food Industry can hold
confidential metadata linked to public records
collection_date
Geographic location
6a) geo_loc_name
OR
6b) lat_lon
collected by
Where
When
Who
What

Immediate impacts of WGS to industry, growers, and distributers, countries, states.
Earlier intervention means:
1) Reduced amount of recalled product;
2) fewer sick patients which means fewer lawsuits;
3) less impact overall and minimal damage to brand recognition.

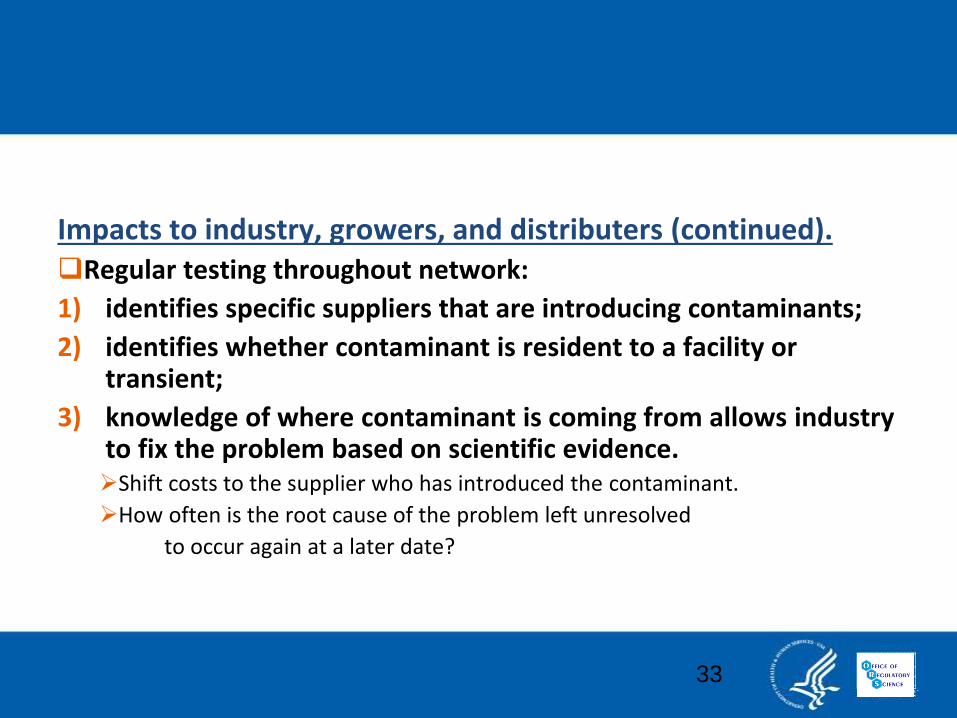
Impacts to industry, growers, and distributers (continued).Regular testing throughout network:
1) identifies specific suppliers that are introducing contaminants;
2) identifies whether contaminant is resident to a facility or transient;
3) knowledge of where contaminant is coming from allows industry to fix the problem based on scientific evidence.Shift costs to the supplier who has introduced the contaminant.
How often is the root cause of the problem left unresolved
to occur again at a later date?
33

Background: CFSAN SNP Pipeline
http://snp-pipeline.rtfd.org
Shttps://github.com/CFSANBiostatistics/snp-pipeline
https://pypi.python.org/pypi/snp-pipeline
Davis S, Pettengill JB, Luo Y, Payne J, Shpuntoff A, Rand H, Strain E. (2015) CFSAN SNP Pipeline: an automated method for constructing SNP matrices from next-generation sequence data. PeerJ Computer Science 1:e20 https://dx.doi.org/10.7717/peerj-cs.20
Intended for use by bioinformaticists (Linux)
Molecular Epidemiology and Ecology of
Multi-drug Resistance (MDR) Salmonella
in Tanzania
Julius MedardusSokoine University of agriculture
Wondwossen A. [email protected]

ICOPHAI GenomeTrakr partnership

FDA GenomeTrakr partnership
924 isolates submitted
to FDA-CFSAN
• Brazil (4)
• Ethiopia (401)
• Kenya (86)
• Mexico (63)
• Tanzania (64)
• Thailand (60)
• U.S. –OSU (247)
37

Tanzania
• WGS- 45 food animal isolates completed
• All Unknown STs
• Plasmid types- ColRNAI, IncI1, IncI2, IncFII, ColpV2
(total 10)- Others?
• Kentucky (16/ 45) and Not conforming with any
known type (n=8)
• Pending- HM and biocide tolerance genes/ efflux
system…
• Comparison with isolates of human origin?

Whole Genome Sequencing Program (WGS)
http://www.fda.gov/Food/FoodScienceResearch/WholeGenomeSequencingProgramWGS/default.htm#trakr
GenomeTrakr
• State and Federal laboratory network
collecting and sharing genomic data
from foodborne pathogens
• Distributed sequencing based network
• Partner with NIH
• Open-access genomic reference
database• http://www.ncbi.nlm.nih.gov/bioproject/183844
• Can be used to find the contamination
sources of current and future outbreaks

For more information:
For information about joining the GenomeTrakr network as a sequencing lab, providing isolates to a current member lab for sequencing, or using the GenomeTrakr database as a research tool, please contact FDA at [email protected]

ORA OCC OFS OC OAO OFVM/SRSC CFSAN CDERCBER CDRH CVM NCTR FDA CHIEF SCIENTIST OIP OARSASCIENCE BOARD IAS FFC FERN JIFSAN ADVISORY COMMITTEE IFSHMOFFETT CENTER CIO DAUPHIN ISLAND CFSAN-OCD CORE WESTERN CENTER
INTERNAL FDA STAKEHOLDERS
FDLIGMAVaFSTFCDCFBIPULSENET-LATIN AM.AM. ACAD MICROBIOLASMFSISARSUNIV VERMONTMINN DOHAZ DOHUNIV FLVA DOHWA DOHTX DOHNY AG LABIRISH FSANOVA SE UNIVIGS BALTIMOREINFORM MEETINGHONGKONG POLYT U
NISTITALIAN FSAEFSAWHO-FOOD SAFETT DIR.WHO-GFNCDC-EUEMERGING INFECTIOUS DIS CONFDANISH TECH UNIVNM STATE UNIV/ NM DOHCARLOS MALBRAN INST/ARGST COULD UNIV/FOOD MICROSENASICAGMINY DOH/WADSWORTH CENTUNIV HAMBURGCHINA CDCNESTLEFERA-UKMD DOHIAFPAPHLAFDOBELGIUM
VaTechUS ARMYUS NAVYMELBOURNE FSA (AUS)UNIV NEBRASKAPUBLIC HEALTH ENGLANDDHSDELMARVA TASKFORCEPENN STATE FOOD SCIENCEPROD MAN ASSOCILLUMINAUNIV IRELAND/DUBLIN COLLEGE
NCBI/NIHGSRS GLOBAL SUMMITFAO/OIEPUBLIC HEALTH CANADACFIAHEALTH CANADAINTL VTEC MEETINGCPS-GAAOACUNITED FRESHCOLUMBIA
HAWAII DOHCA DOHALASKA DOHSOUTH DAK UNIVUNIV GAUNIV IOWA/DOHUNIV CHILEBRAZILOSU VETNETTURKEYMEXICOIEHSILLAKERNEW ENG BIOLABPACIFIC BIOCLC-BIO/QIAGENCON-AGRADUPONTAGILENTUC-DAVISHARVARD MEDINFORM MEETINGTHAILAND

Food Safety and Inspection Service:
42

Food Safety and Inspection Service:
WGS for Food Safety Management: FSIS Perspective
Stephanie Defibaugh-Chavez, Ph.D.Senior Microbiologist, Science Staff
Office of Public Health ScienceUS Department of Agriculture, FSIS
FAO WGS Meeting – December 2015
43

Food Safety and Inspection Service:Food Safety and Inspection Service:
• FSIS is the public health agency in the U.S. Department of Agriculture responsible for ensuring that the nation's commercial supply of meat, poultry, and processed egg products is safe, wholesome, and correctly labeled and packaged
• Regulates more than 6,000 slaughter and processing establishments nationwide
• Verifies safety of approximately 100 billion pounds of product annually
44
FSIS Mission
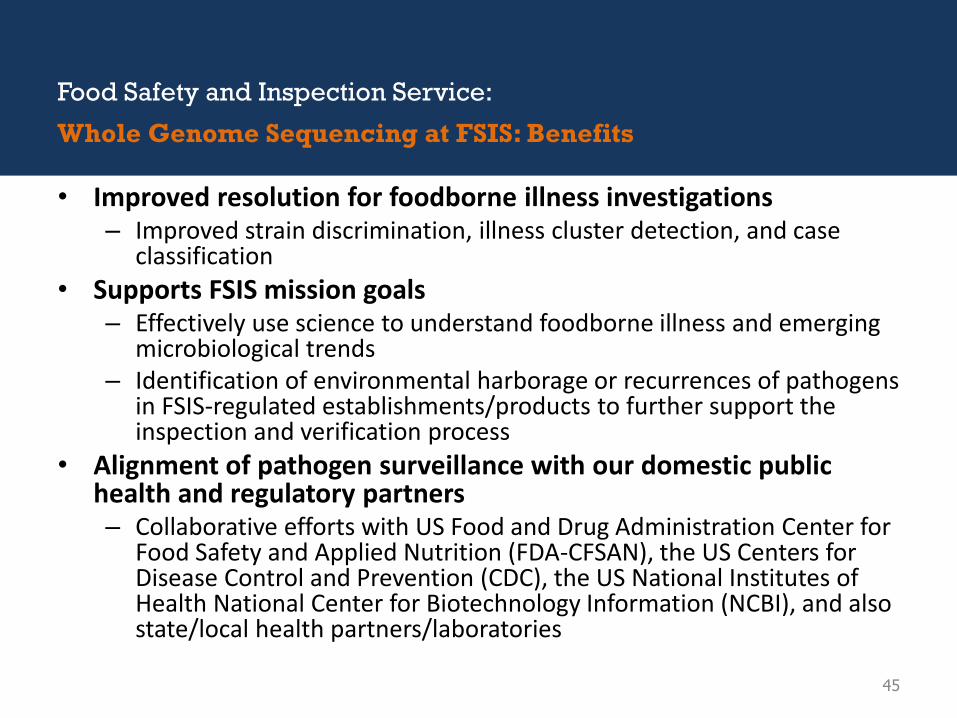
Food Safety and Inspection Service:Food Safety and Inspection Service:
• Improved resolution for foodborne illness investigations– Improved strain discrimination, illness cluster detection, and case
classification
• Supports FSIS mission goals– Effectively use science to understand foodborne illness and emerging
microbiological trends– Identification of environmental harborage or recurrences of pathogens
in FSIS-regulated establishments/products to further support the inspection and verification process
• Alignment of pathogen surveillance with our domestic public health and regulatory partners– Collaborative efforts with US Food and Drug Administration Center for
Food Safety and Applied Nutrition (FDA-CFSAN), the US Centers for Disease Control and Prevention (CDC), the US National Institutes of Health National Center for Biotechnology Information (NCBI), and also state/local health partners/laboratories
45
Whole Genome Sequencing at FSIS: Benefits

Food Safety and Inspection Service:Food Safety and Inspection Service:
• FSIS continues to build capacity for WGS of isolates obtained from FSIS sampling programs– Expect full capacity with 6 sequencers by FY 2017– Goal is to sequence around 5000 isolates per year
• FSIS considers available WGS analyses in addition to PFGE and epidemiological information to further understand the relationship between clinical and food isolates
• FSIS is part of an interagency collaboration with CDC, FDA, and NCBI (Gen-FS) to harmonize efforts for implementation of WGS for food safety purposes within the US
46
WGS at FSIS: Current Status and Short Term Plans

Food Safety and Inspection Service:Food Safety and Inspection Service:
• Product/Source type (Ready to eat product, raw meat/poultry, environmental swab, etc.)
• Year sample was collected• State where sample was collected• Subtyping information when available
– Salmonella – serotype and PFGE data– Adulterant STECs - O-group and PFGE data– Campylobacter – species and PFGE– Listeria monocytogenes - PFGE
• Metadata and sequence data is immediately available for upload to NCBI
47
WGS at FSIS: Data Sharing (Metadata and sequence data)

Food Safety and Inspection Service:Food Safety and Inspection Service:
• Data storage and transmission– Massive volume of data generated
– FTP and other IT-related security issues
• Laboratory considerations– Scope of ISO 17025 accreditation (sequence quality)
– Need for high-throughput sequencing capacity for real-time applications
• Bioinformatics– Interpretation of strain relatedness
• hqSNP, wgMLST, k-mer
• Incorporating epidemiological and other metadata in analyses
48
WGS at FSIS: Challenges

Food Safety and Inspection Service:Food Safety and Inspection Service:
• Case definitions: FSIS depends on its public health partner (CDC/States) for case definitions, the descriptions of the outbreak strain(s) and the subtyping method used to define the strain(s)
• Higher resolution subtyping and evolving strains: Food and environmental samples collected as part of an outbreak investigation may span a period of time longer than the outbreak – genetic drift should be considered
• Using WGS for regulatory decisions: FSIS is exploring how to interpret and apply the case definitions established by our public health partners that include WGS criteria to FSIS surveillance and investigative results
49
WGS at FSIS: Challenges

Food Safety and Inspection Service:Food Safety and Inspection Service:
• BAX speciation – Campylobacter
• Molecular Serotype – Salmonella
• Pulse Field Gel Electrophoresis– Salmonella– Campylobacter– Adulterant STECs– Listeria monocytogenes
• Antimicrobial Susceptibility Testing– Salmonella– Campylobacter– E. coli– Enterococcus
50
WGS at FSIS: Future Considerations
A single WGS workflow could potentially consolidate all analyses

Food Safety and Inspection Service:Food Safety and Inspection Service:
51
Example: Retrospective WGS analysis
51
Primary pattern A
Primary pattern B
Secondary pattern CSecondary pattern DSecondary pattern E
• FSIS food and environmental samples from one investigation were compared to clinical isolates with an epidemiological link to the establishment where sampling occurred
• The isolates from the investigative sampling had 2 different primary PFGE patterns and 3 different secondary PFGE patterns
• WGS was able to show high similarity (0-5 SNP differences) between differing primary PFGE patterns and primary/secondary combinations
