applications of goes and modis aerosol · applications of goes and modis aerosol products in...
TRANSCRIPT
Applications of GOES and MODIS Aerosol
Products in NOAA’s Operational Air
Quality Predictions
Ivanka Stajner
NOAA/NWS
GOES-R AQ Proving Ground, UMBC, Baltimore, MD November 1, 2012
Outline
Background on NAQFC
Progress in 2012
- Ozone predictions
- Smoke predictions
- Dust predictions
- Prototype PM2.5 predictions
- Outreach and feedback
Summary
2
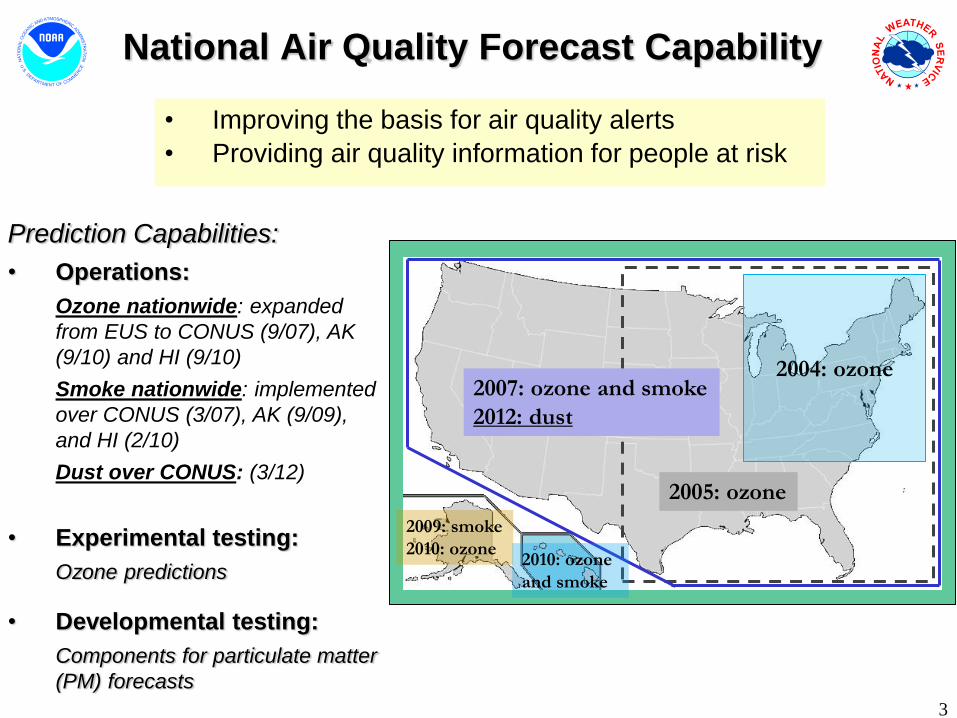
National Air Quality Forecast Capability
• Improving the basis for air quality alerts
• Providing air quality information for people at risk
Prediction Capabilities:
• Operations:
Ozone nationwide: expanded
from EUS to CONUS (9/07), AK
(9/10) and HI (9/10)
Smoke nationwide: implemented
over CONUS (3/07), AK (9/09),
and HI (2/10)
Dust over CONUS: (3/12)
• Experimental testing:
Ozone predictions
• Developmental testing:
Components for particulate matter
(PM) forecasts
2004: ozone
2005: ozone
2007: ozone and smoke
2012: dust
2009: smoke
2010: ozone 2010: ozone
and smoke
3
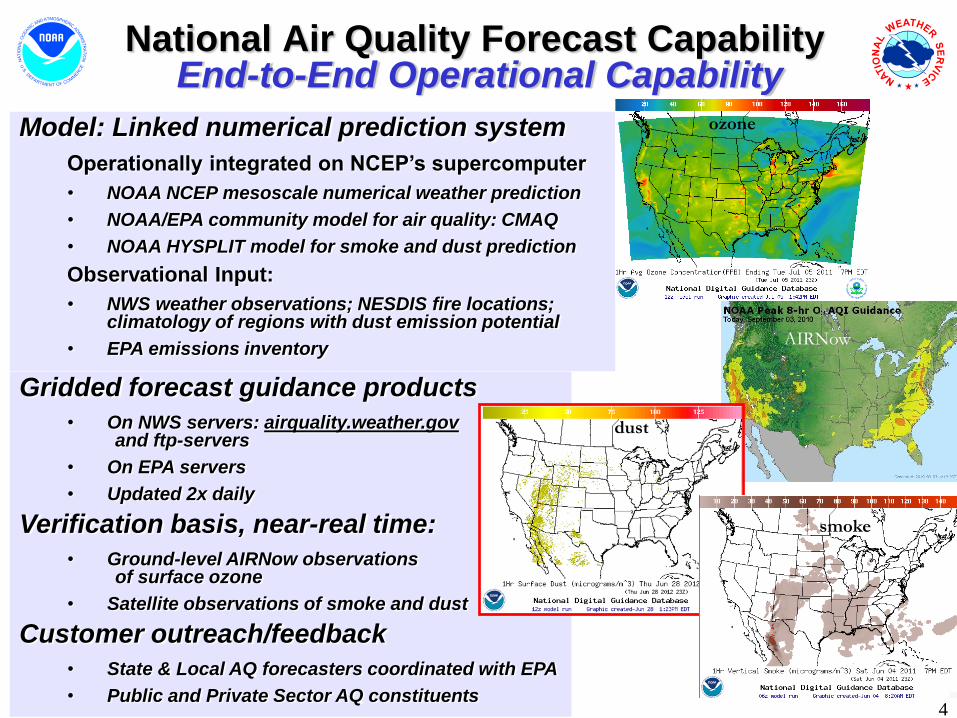
Model: Linked numerical prediction system
Operationally integrated on NCEP’s supercomputer
• NOAA NCEP mesoscale numerical weather prediction
• NOAA/EPA community model for air quality: CMAQ
• NOAA HYSPLIT model for smoke and dust prediction
Observational Input:
• NWS weather observations; NESDIS fire locations; climatology of regions with dust emission potential
• EPA emissions inventory
National Air Quality Forecast Capability End-to-End Operational Capability
Gridded forecast guidance products
• On NWS servers: airquality.weather.gov and ftp-servers
• On EPA servers
• Updated 2x daily
Verification basis, near-real time:
• Ground-level AIRNow observations of surface ozone
• Satellite observations of smoke and dust
Customer outreach/feedback
• State & Local AQ forecasters coordinated with EPA
• Public and Private Sector AQ constituents
AIRNow
ozone
dust
smoke
4
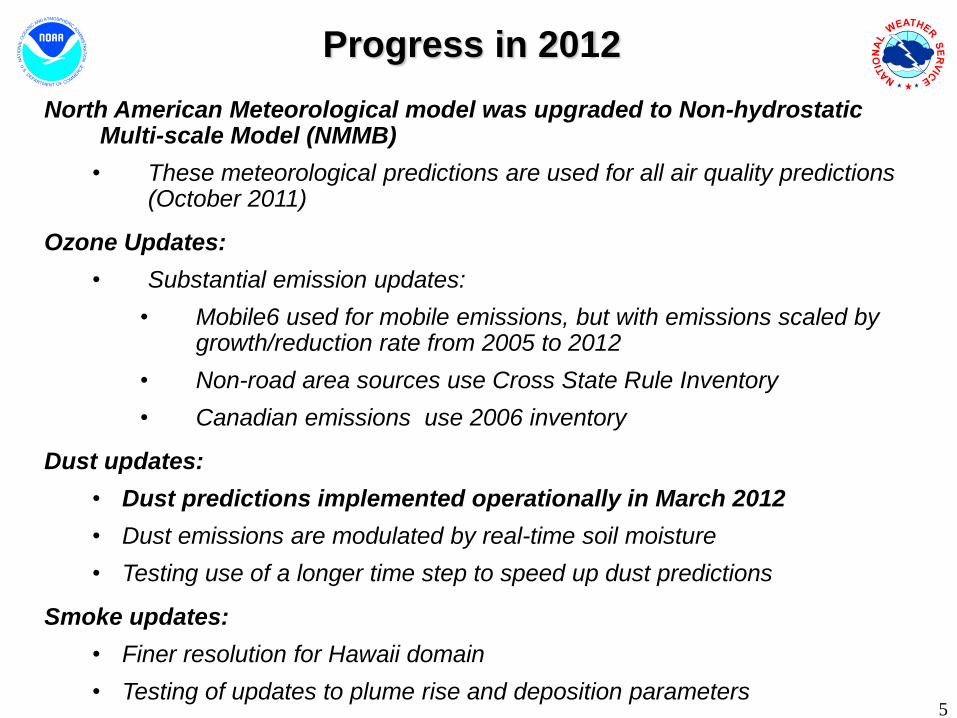
Progress in 2012
North American Meteorological model was upgraded to Non-hydrostatic Multi-scale Model (NMMB)
• These meteorological predictions are used for all air quality predictions (October 2011)
Ozone Updates:
• Substantial emission updates:
• Mobile6 used for mobile emissions, but with emissions scaled by growth/reduction rate from 2005 to 2012
• Non-road area sources use Cross State Rule Inventory
• Canadian emissions use 2006 inventory
Dust updates:
• Dust predictions implemented operationally in March 2012
• Dust emissions are modulated by real-time soil moisture
• Testing use of a longer time step to speed up dust predictions
Smoke updates:
• Finer resolution for Hawaii domain
• Testing of updates to plume rise and deposition parameters
5
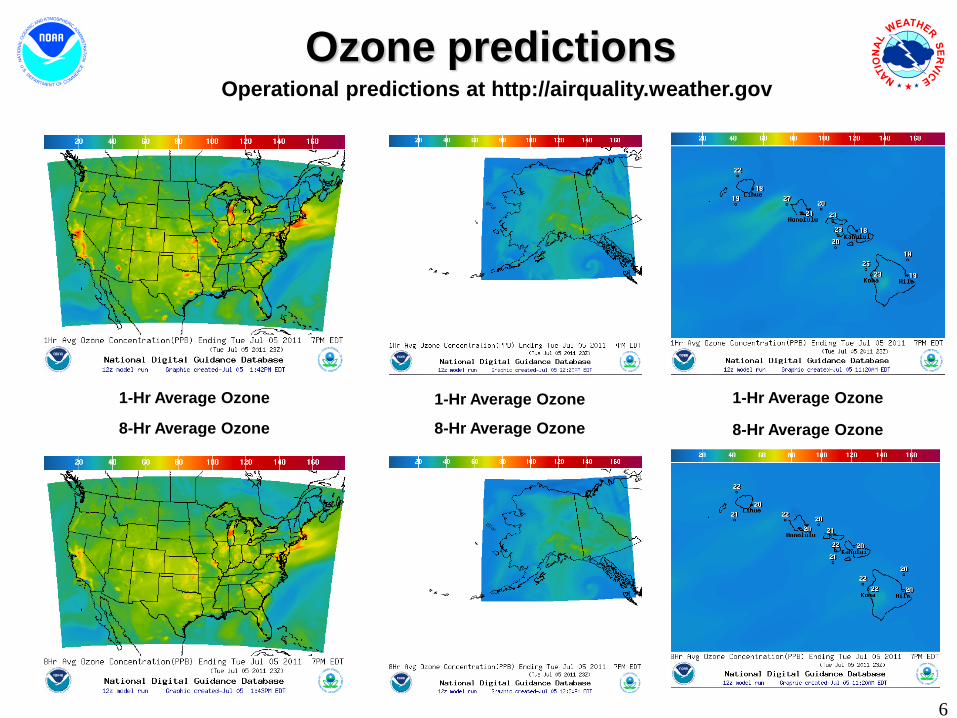
Ozone predictions Operational predictions at http://airquality.weather.gov
1-Hr Average Ozone
8-Hr Average Ozone
1-Hr Average Ozone
8-Hr Average Ozone
1-Hr Average Ozone
8-Hr Average Ozone
6
7
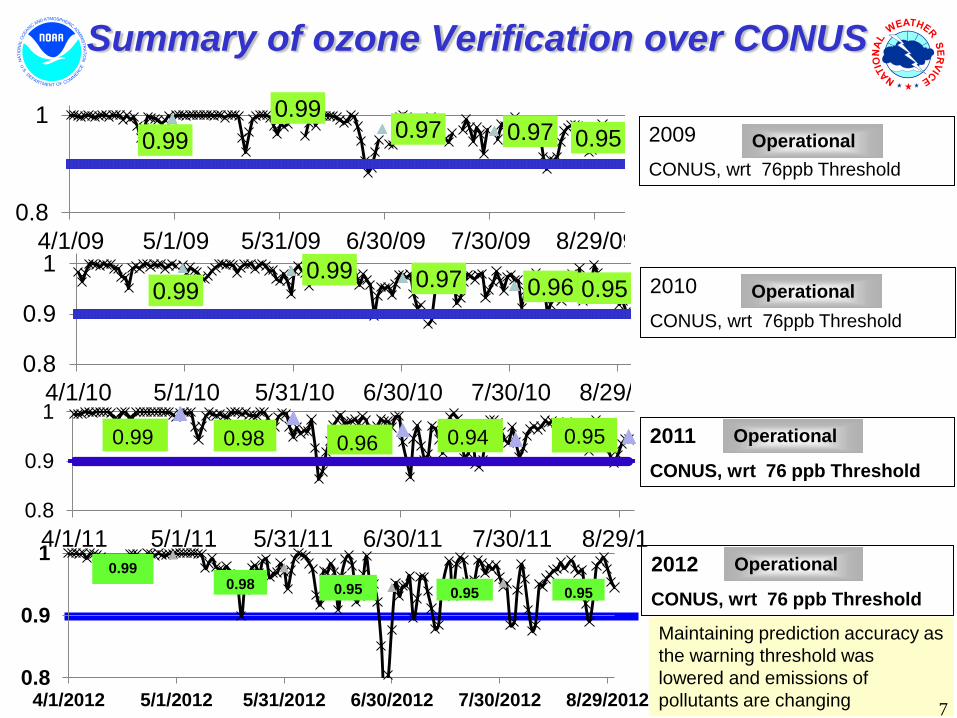
Summary of ozone Verification over CONUS
2009
CONUS, wrt 76ppb Threshold
Operational 0.99
0.99 0.97 0.97 0.95
0.8
1
4/1/09 5/1/09 5/31/09 6/30/09 7/30/09 8/29/09
0.99 0.99 0.97 0.96 0.95
0.8
0.9
1
4/1/10 5/1/10 5/31/10 6/30/10 7/30/10 8/29/10
2010
CONUS, wrt 76ppb Threshold
Operational
2011
CONUS, wrt 76 ppb Threshold
Operational
0.8
0.9
1
4/1/11 5/1/11 5/31/11 6/30/11 7/30/11 8/29/11
0.99 0.95 0.94 0.96 0.98
2012
CONUS, wrt 76 ppb Threshold
Operational
0.8
0.9
1
4/1/2012 5/1/2012 5/31/2012 6/30/2012 7/30/2012 8/29/2012
0.98 0.95 0.95 0.95
0.99
Maintaining prediction accuracy as
the warning threshold was
lowered and emissions of
pollutants are changing 7
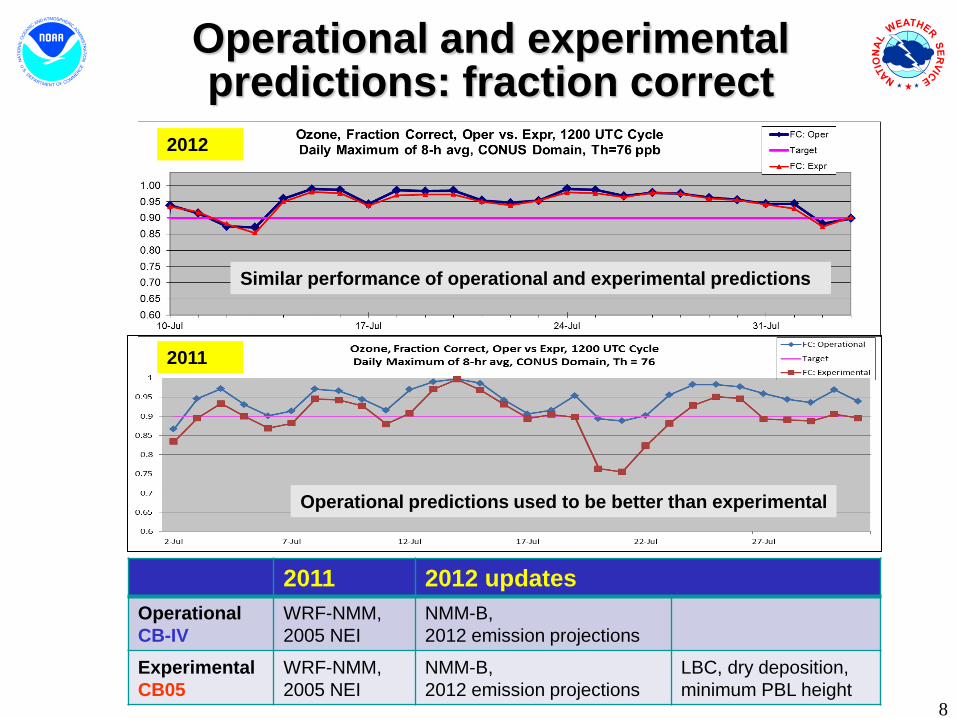
Operational and experimental predictions: fraction correct
8
2012
2011
Similar performance of operational and experimental predictions
Operational predictions used to be better than experimental
2011 2012 updates
Operational
CB-IV
WRF-NMM,
2005 NEI
NMM-B,
2012 emission projections
Experimental
CB05
WRF-NMM,
2005 NEI
NMM-B,
2012 emission projections
LBC, dry deposition,
minimum PBL height
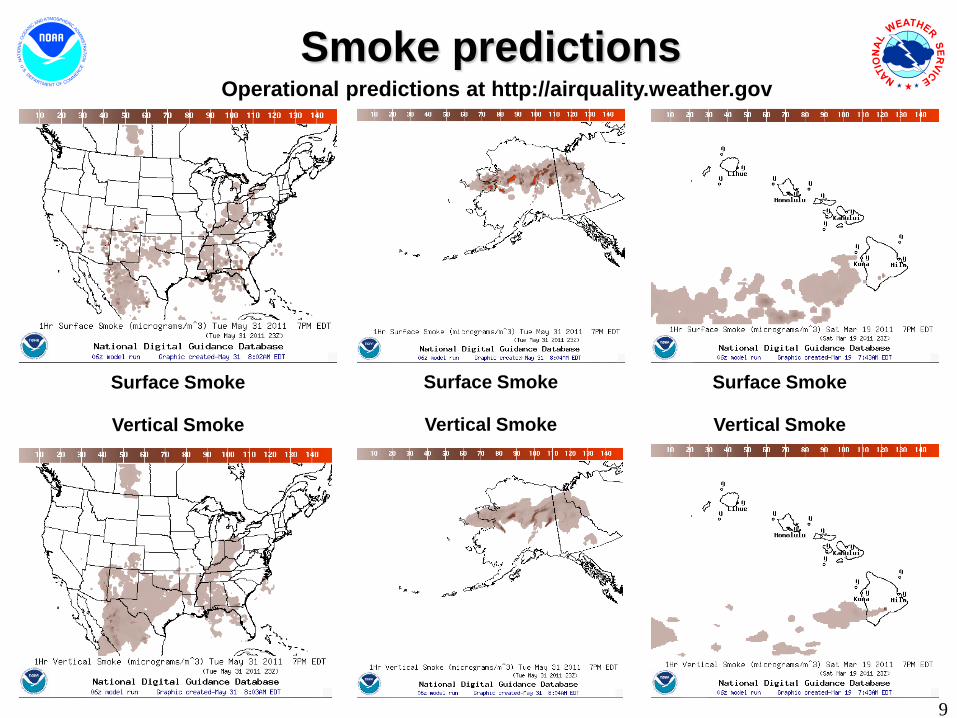
Smoke predictions
Surface Smoke Surface Smoke Surface Smoke
Vertical Smoke Vertical Smoke Vertical Smoke
Operational predictions at http://airquality.weather.gov
9
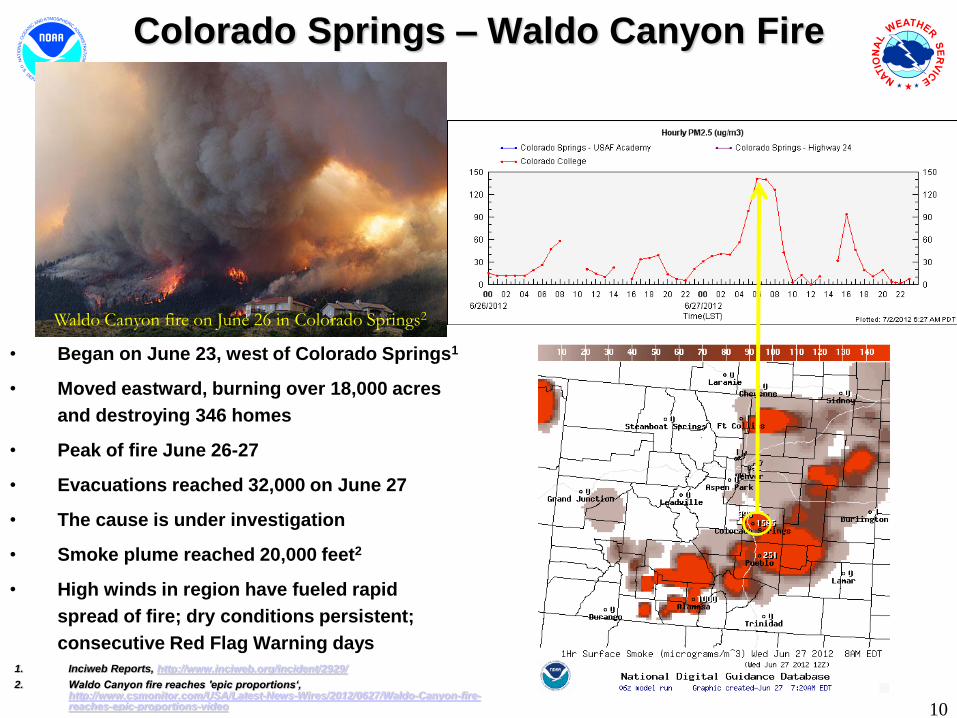
Colorado Springs – Waldo Canyon Fire
• Began on June 23, west of Colorado Springs1
• Moved eastward, burning over 18,000 acres
and destroying 346 homes
• Peak of fire June 26-27
• Evacuations reached 32,000 on June 27
• The cause is under investigation
• Smoke plume reached 20,000 feet2
• High winds in region have fueled rapid
spread of fire; dry conditions persistent;
consecutive Red Flag Warning days
Waldo Canyon fire on June 26 in Colorado Springs2
1. Inciweb Reports, http://www.inciweb.org/incident/2929/
2. Waldo Canyon fire reaches 'epic proportions‘, http://www.csmonitor.com/USA/Latest-News-Wires/2012/0627/Waldo-Canyon-fire-reaches-epic-proportions-video 10
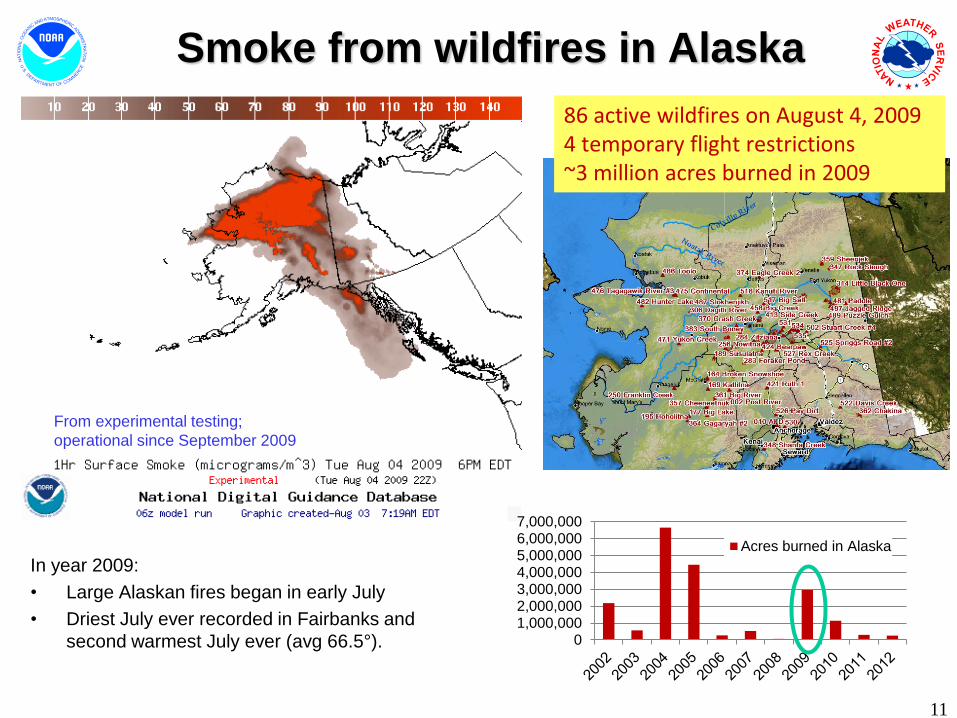
Smoke from wildfires in Alaska
In year 2009:
• Large Alaskan fires began in early July
• Driest July ever recorded in Fairbanks and
second warmest July ever (avg 66.5°).
11
86 active wildfires on August 4, 2009 4 temporary flight restrictions ~3 million acres burned in 2009
From experimental testing;
operational since September 2009
01,000,0002,000,0003,000,0004,000,0005,000,0006,000,0007,000,000
Acres burned in Alaska
12
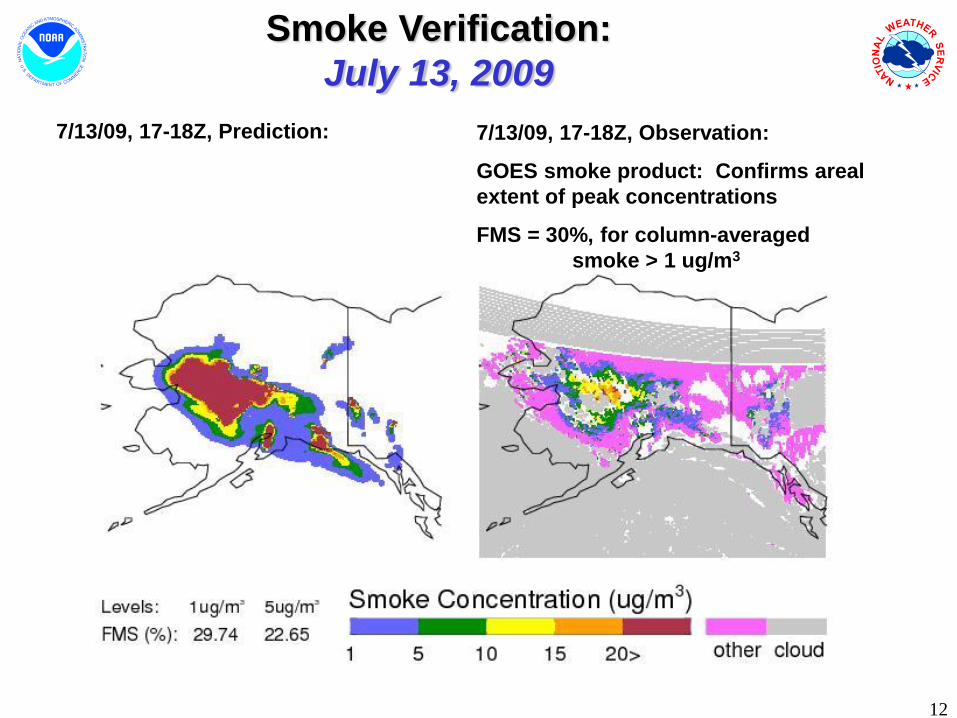
7/13/09, 17-18Z, Prediction:
Smoke Verification:
July 13, 2009
7/13/09, 17-18Z, Observation:
GOES smoke product: Confirms areal
extent of peak concentrations
FMS = 30%, for column-averaged
smoke > 1 ug/m3
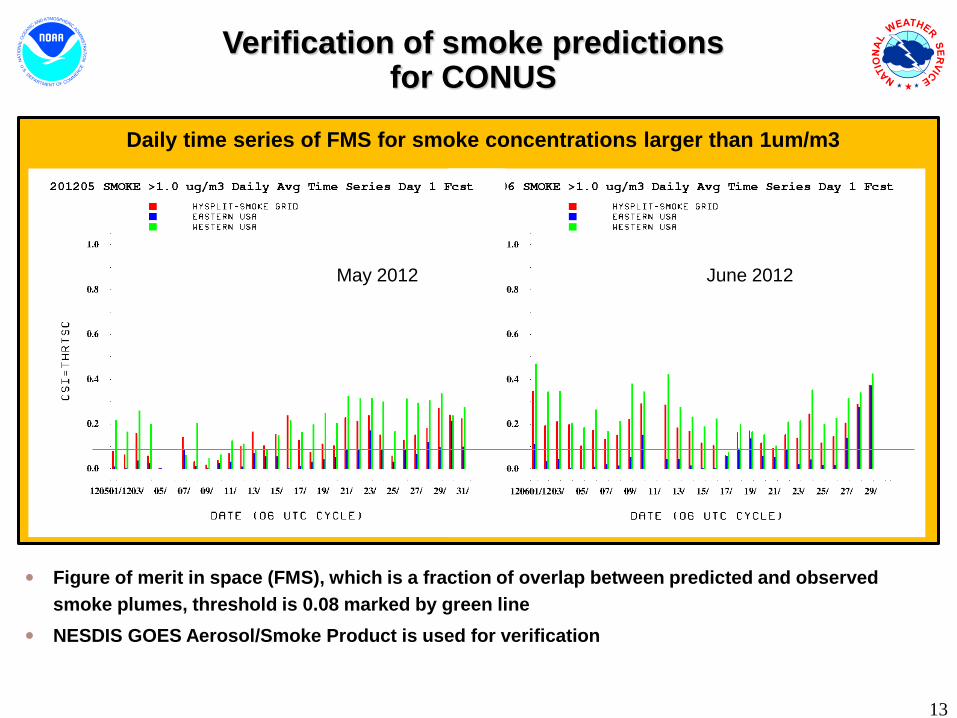
Figure of merit in space (FMS), which is a fraction of overlap between predicted and observed
smoke plumes, threshold is 0.08 marked by green line
NESDIS GOES Aerosol/Smoke Product is used for verification
Verification of smoke predictions for CONUS
Daily time series of FMS for smoke concentrations larger than 1um/m3
June 2012 May 2012
13
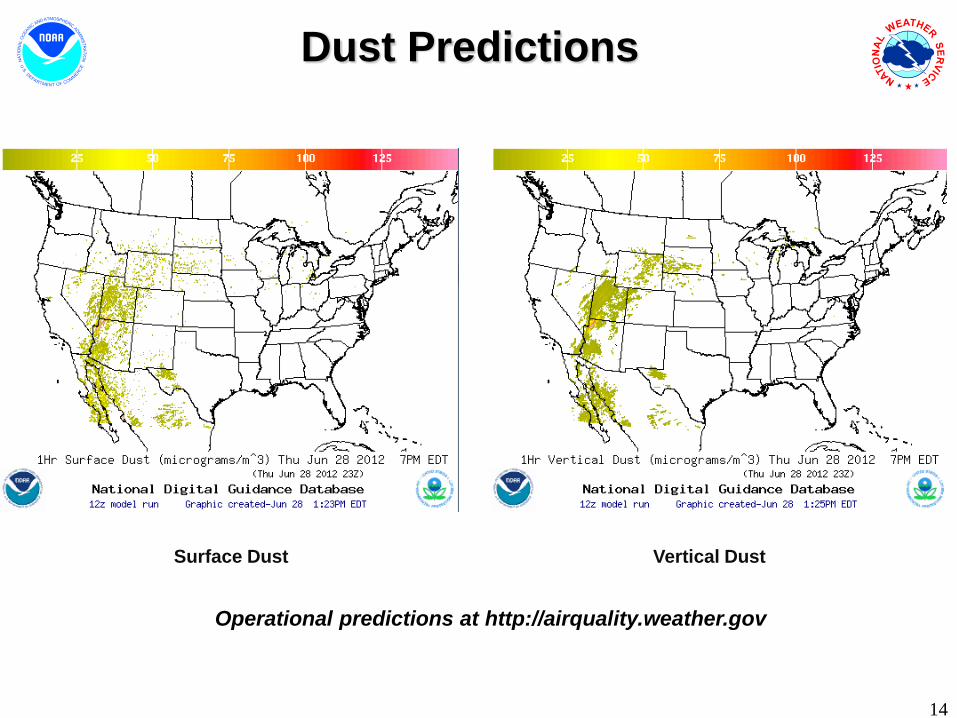
Dust Predictions
Surface Dust Vertical Dust
Operational predictions at http://airquality.weather.gov
14
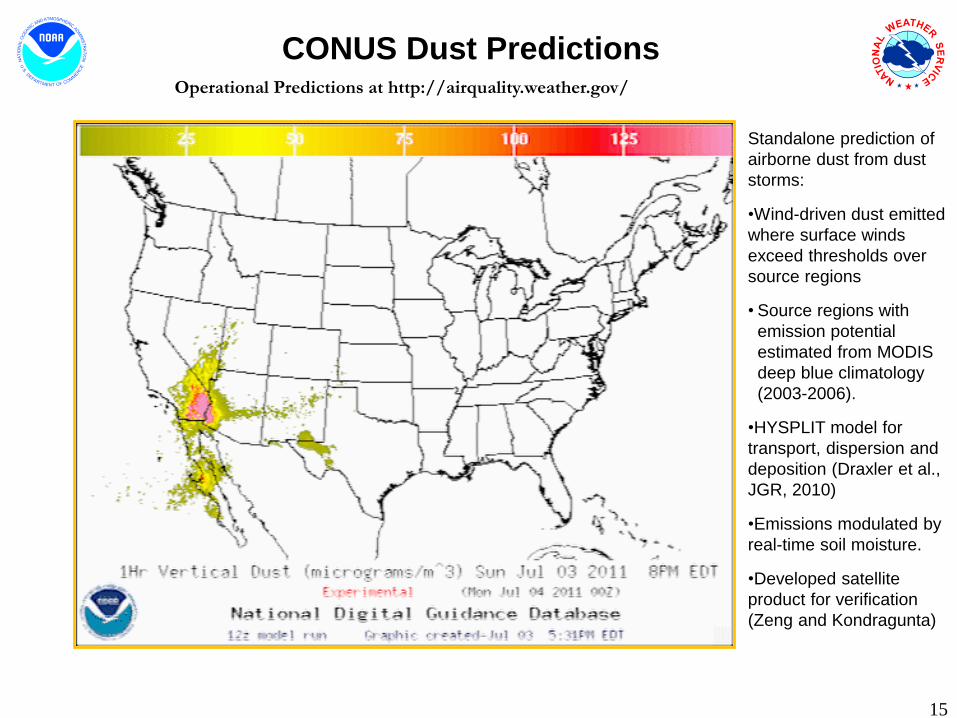
Standalone prediction of
airborne dust from dust
storms:
•Wind-driven dust emitted
where surface winds
exceed thresholds over
source regions
• Source regions with
emission potential
estimated from MODIS
deep blue climatology
(2003-2006).
•HYSPLIT model for
transport, dispersion and
deposition (Draxler et al.,
JGR, 2010)
•Emissions modulated by
real-time soil moisture.
•Developed satellite
product for verification
(Zeng and Kondragunta)
CONUS Dust Predictions Operational Predictions at http://airquality.weather.gov/
15
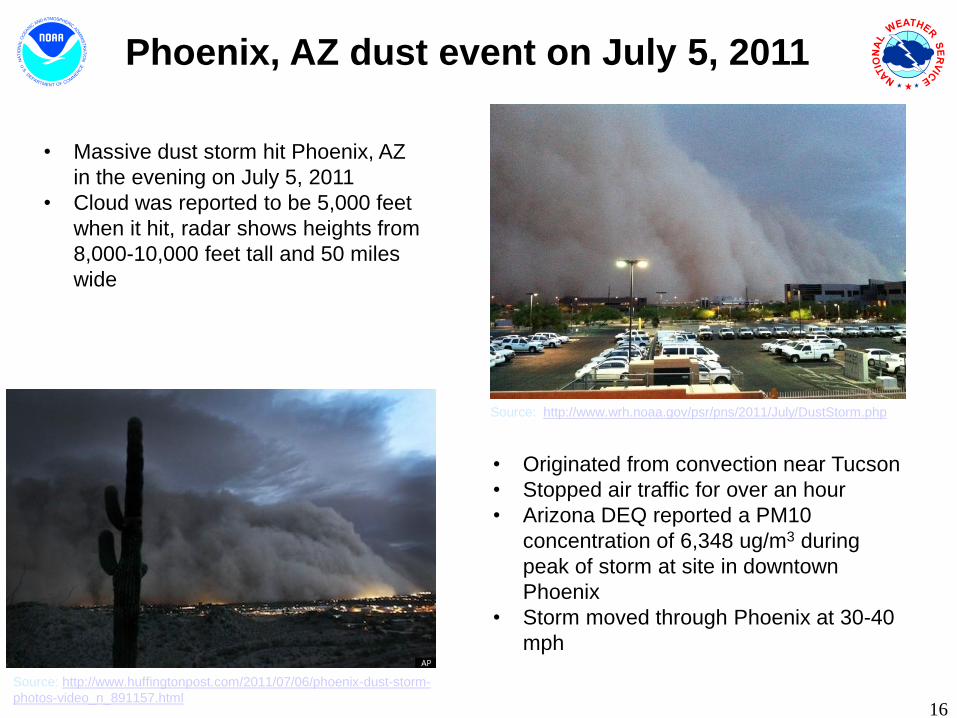
Phoenix, AZ dust event on July 5, 2011
Source: http://www.wrh.noaa.gov/psr/pns/2011/July/DustStorm.php
• Massive dust storm hit Phoenix, AZ
in the evening on July 5, 2011
• Cloud was reported to be 5,000 feet
when it hit, radar shows heights from
8,000-10,000 feet tall and 50 miles
wide
Source: http://www.huffingtonpost.com/2011/07/06/phoenix-dust-storm-
photos-video_n_891157.html 16
• Originated from convection near Tucson
• Stopped air traffic for over an hour
• Arizona DEQ reported a PM10
concentration of 6,348 ug/m3 during
peak of storm at site in downtown
Phoenix
• Storm moved through Phoenix at 30-40
mph
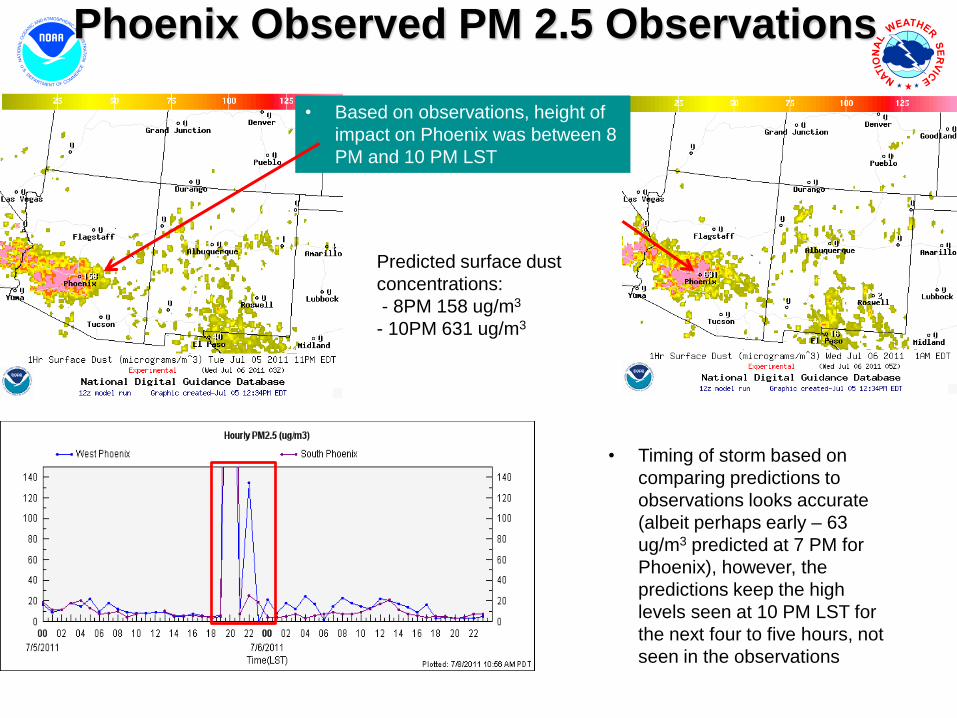
Phoenix Observed PM 2.5 Observations
• Based on observations, height of
impact on Phoenix was between 8
PM and 10 PM LST
*Note* AZ three hours behind in summer
Predicted surface dust
concentrations:
- 8PM 158 ug/m3
- 10PM 631 ug/m3
Peak values: 996 ug/m3 at South Phoenix station at 8PM and 506 ug/m3 at West
Phoenix station at 8 PM (AIRNow Tech)
• Timing of storm based on
comparing predictions to
observations looks accurate
(albeit perhaps early – 63
ug/m3 predicted at 7 PM for
Phoenix), however, the
predictions keep the high
levels seen at 10 PM LST for
the next four to five hours, not
seen in the observations
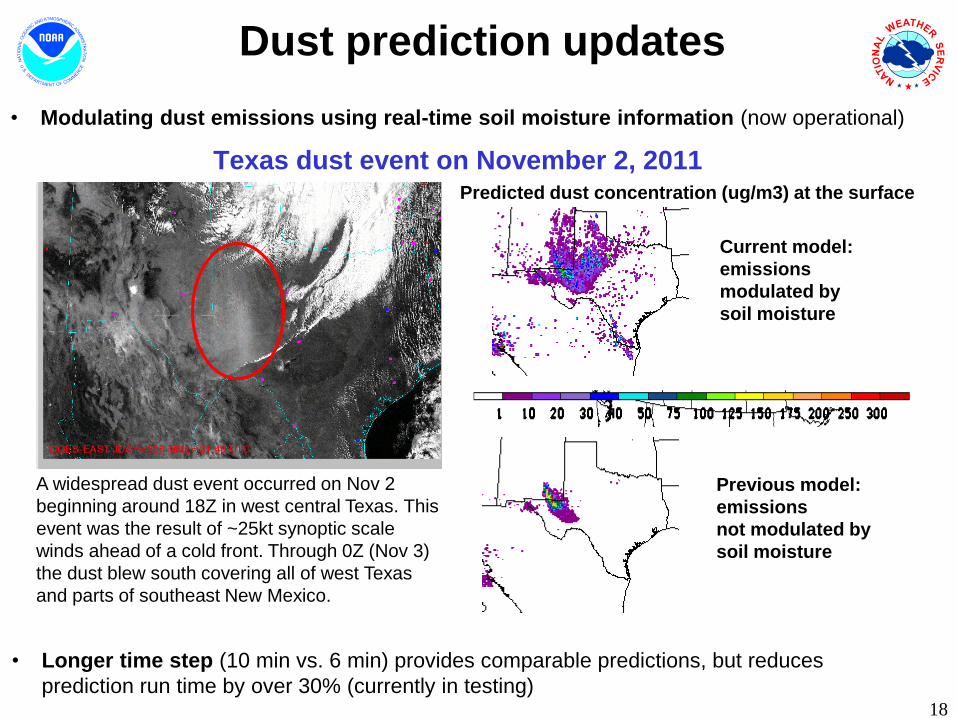
Texas dust event on November 2, 2011
A widespread dust event occurred on Nov 2
beginning around 18Z in west central Texas. This
event was the result of ~25kt synoptic scale
winds ahead of a cold front. Through 0Z (Nov 3)
the dust blew south covering all of west Texas
and parts of southeast New Mexico.
Previous model:
emissions
not modulated by
soil moisture
Current model:
emissions
modulated by
soil moisture
Predicted dust concentration (ug/m3) at the surface
18
• Longer time step (10 min vs. 6 min) provides comparable predictions, but reduces
prediction run time by over 30% (currently in testing)
Dust prediction updates
• Modulating dust emissions using real-time soil moisture information (now operational)
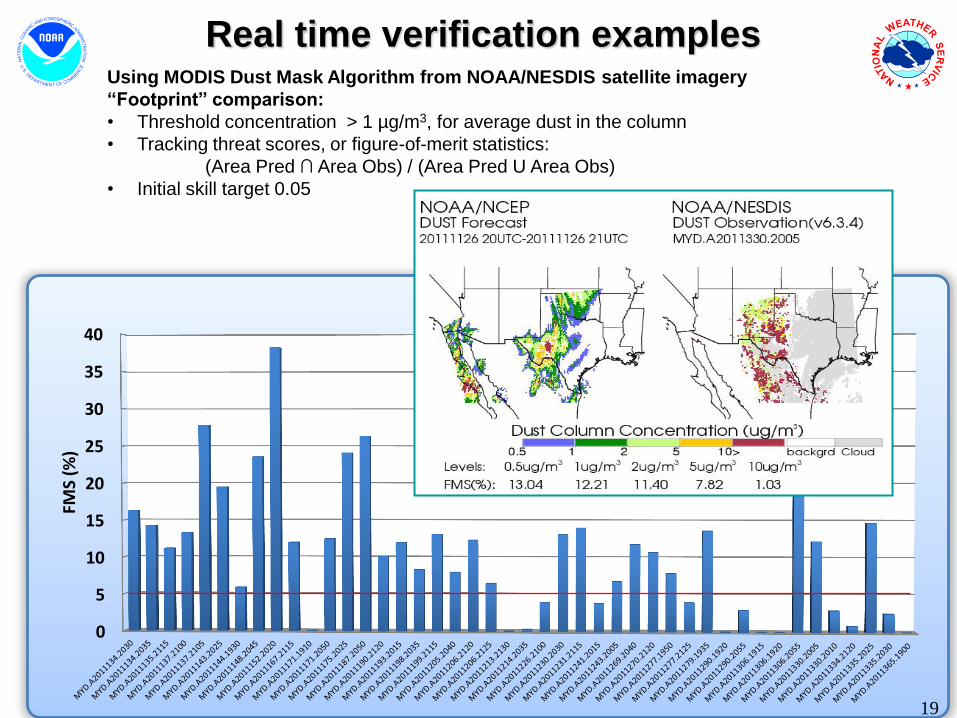
Real time verification examples
0
5
10
15
20
25
30
35
40
FMS
(%)
V6.3.4 (1µg/m3)
19
Using MODIS Dust Mask Algorithm from NOAA/NESDIS satellite imagery
“Footprint” comparison:
• Threshold concentration > 1 µg/m3, for average dust in the column
• Tracking threat scores, or figure-of-merit statistics:
(Area Pred ∩ Area Obs) / (Area Pred U Area Obs)
• Initial skill target 0.05
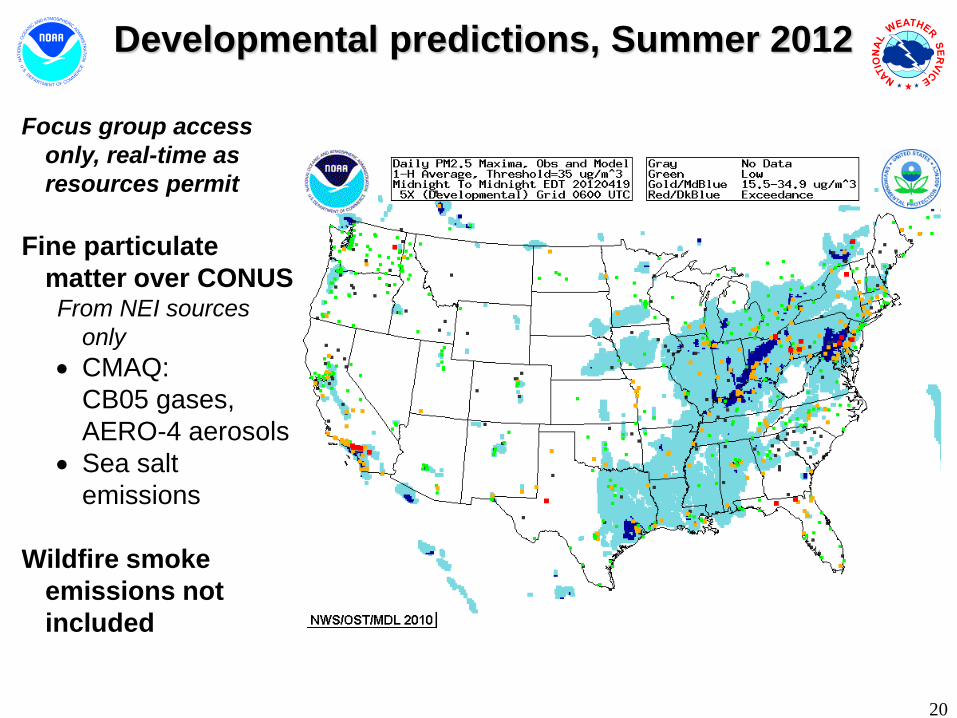
Developmental predictions, Summer 2012
Focus group access
only, real-time as
resources permit
Fine particulate
matter over CONUS From NEI sources
only
CMAQ:
CB05 gases,
AERO-4 aerosols
Sea salt
emissions
Wildfire smoke
emissions not
included
20
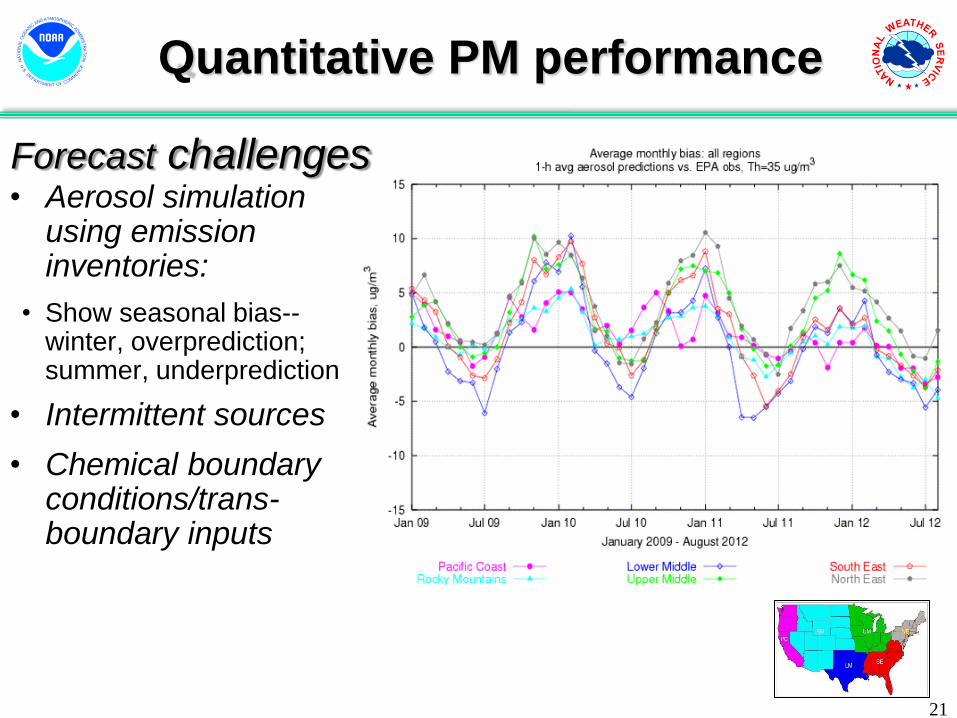
21
• Aerosol simulation using emission inventories:
• Show seasonal bias-- winter, overprediction; summer, underprediction
• Intermittent sources
• Chemical boundary conditions/trans-boundary inputs
Quantitative PM performance
Forecast challenges
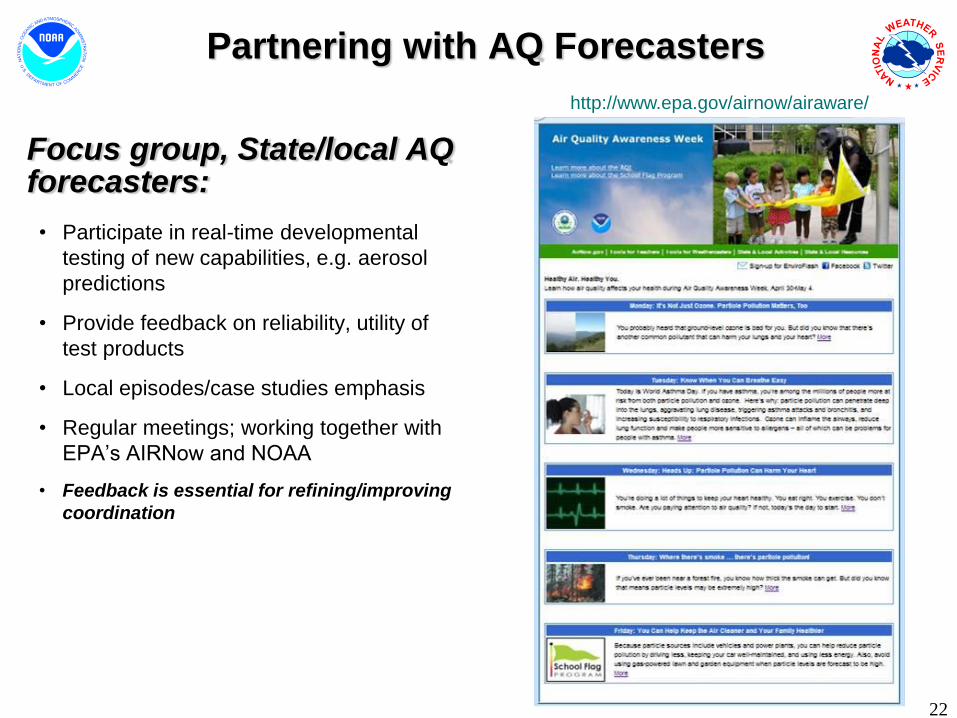
Partnering with AQ Forecasters
Focus group, State/local AQ forecasters:
• Participate in real-time developmental
testing of new capabilities, e.g. aerosol
predictions
• Provide feedback on reliability, utility of
test products
• Local episodes/case studies emphasis
• Regular meetings; working together with
EPA’s AIRNow and NOAA
• Feedback is essential for refining/improving
coordination
http://www.epa.gov/airnow/airaware/
22
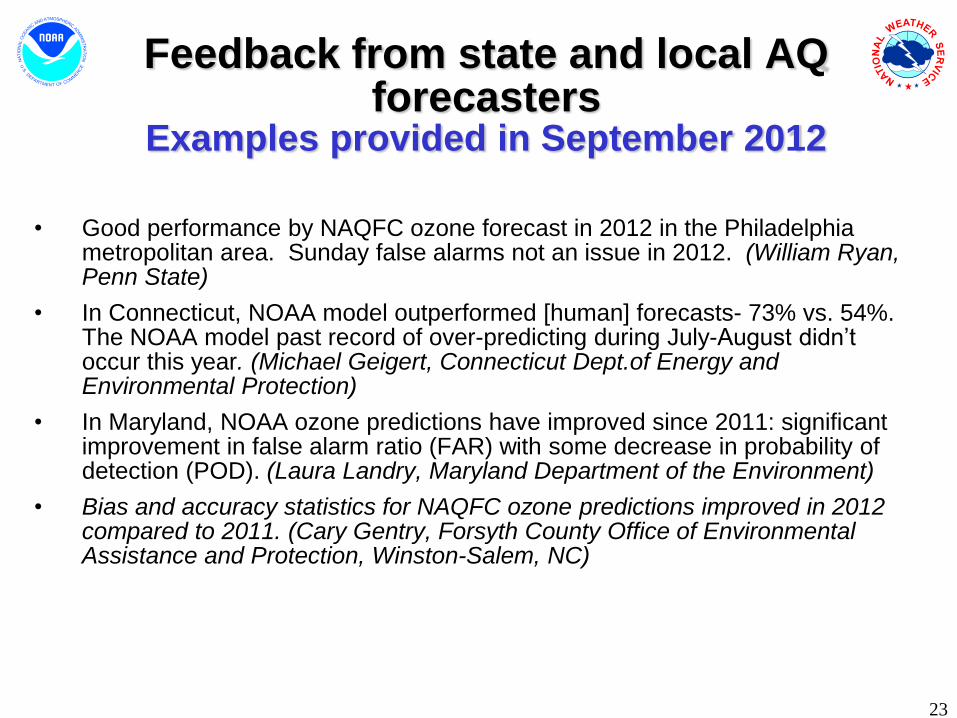
Feedback from state and local AQ forecasters
Examples provided in September 2012
• Good performance by NAQFC ozone forecast in 2012 in the Philadelphia metropolitan area. Sunday false alarms not an issue in 2012. (William Ryan, Penn State)
• In Connecticut, NOAA model outperformed [human] forecasts- 73% vs. 54%. The NOAA model past record of over-predicting during July-August didn’t occur this year. (Michael Geigert, Connecticut Dept.of Energy and Environmental Protection)
• In Maryland, NOAA ozone predictions have improved since 2011: significant improvement in false alarm ratio (FAR) with some decrease in probability of detection (POD). (Laura Landry, Maryland Department of the Environment)
• Bias and accuracy statistics for NAQFC ozone predictions improved in 2012 compared to 2011. (Cary Gentry, Forsyth County Office of Environmental Assistance and Protection, Winston-Salem, NC)
23
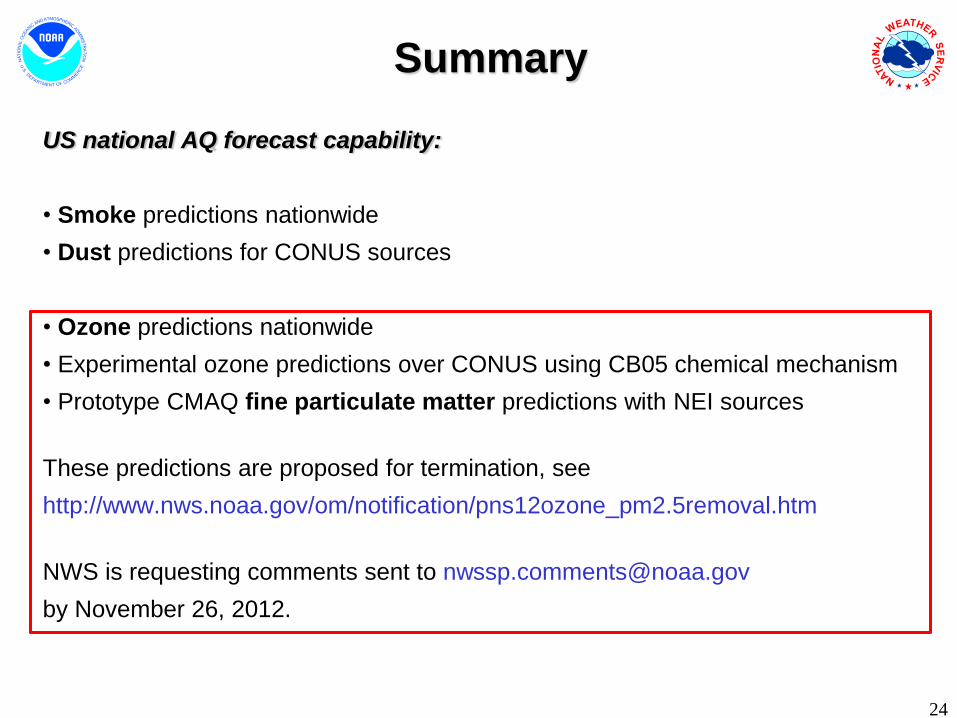
Summary
US national AQ forecast capability:
• Smoke predictions nationwide
• Dust predictions for CONUS sources
• Ozone predictions nationwide
• Experimental ozone predictions over CONUS using CB05 chemical mechanism
• Prototype CMAQ fine particulate matter predictions with NEI sources
These predictions are proposed for termination, see
http://www.nws.noaa.gov/om/notification/pns12ozone_pm2.5removal.htm
NWS is requesting comments sent to [email protected]
by November 26, 2012.
24
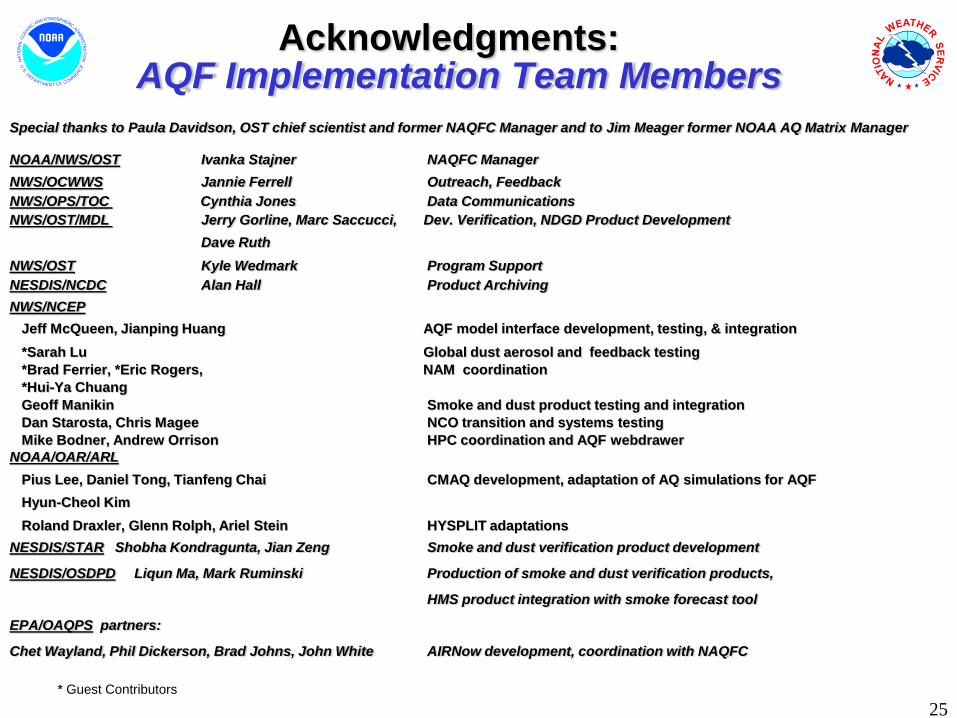
Acknowledgments: AQF Implementation Team Members
Special thanks to Paula Davidson, OST chief scientist and former NAQFC Manager and to Jim Meager former NOAA AQ Matrix Manager
NOAA/NWS/OST Ivanka Stajner NAQFC Manager
NWS/OCWWS Jannie Ferrell Outreach, Feedback
NWS/OPS/TOC Cynthia Jones Data Communications
NWS/OST/MDL Jerry Gorline, Marc Saccucci, Dev. Verification, NDGD Product Development
Dave Ruth
NWS/OST Kyle Wedmark Program Support
NESDIS/NCDC Alan Hall Product Archiving
NWS/NCEP
Jeff McQueen, Jianping Huang AQF model interface development, testing, & integration
*Sarah Lu Global dust aerosol and feedback testing
*Brad Ferrier, *Eric Rogers, NAM coordination
*Hui-Ya Chuang
Geoff Manikin Smoke and dust product testing and integration
Dan Starosta, Chris Magee NCO transition and systems testing
Mike Bodner, Andrew Orrison HPC coordination and AQF webdrawer
NOAA/OAR/ARL
Pius Lee, Daniel Tong, Tianfeng Chai CMAQ development, adaptation of AQ simulations for AQF
Hyun-Cheol Kim
Roland Draxler, Glenn Rolph, Ariel Stein HYSPLIT adaptations
NESDIS/STAR Shobha Kondragunta, Jian Zeng Smoke and dust verification product development
NESDIS/OSDPD Liqun Ma, Mark Ruminski Production of smoke and dust verification products,
HMS product integration with smoke forecast tool
EPA/OAQPS partners:
Chet Wayland, Phil Dickerson, Brad Johns, John White AIRNow development, coordination with NAQFC
* Guest Contributors
25

Operational AQ forecast guidance
airquality.weather.gov
Further information: www.nws.noaa.gov/ost/air_quality
Ozone products Nationwide since 2010
Smoke Products Nationwide since 2010
Dust Products Implemented 2012
26
Backup
27
28
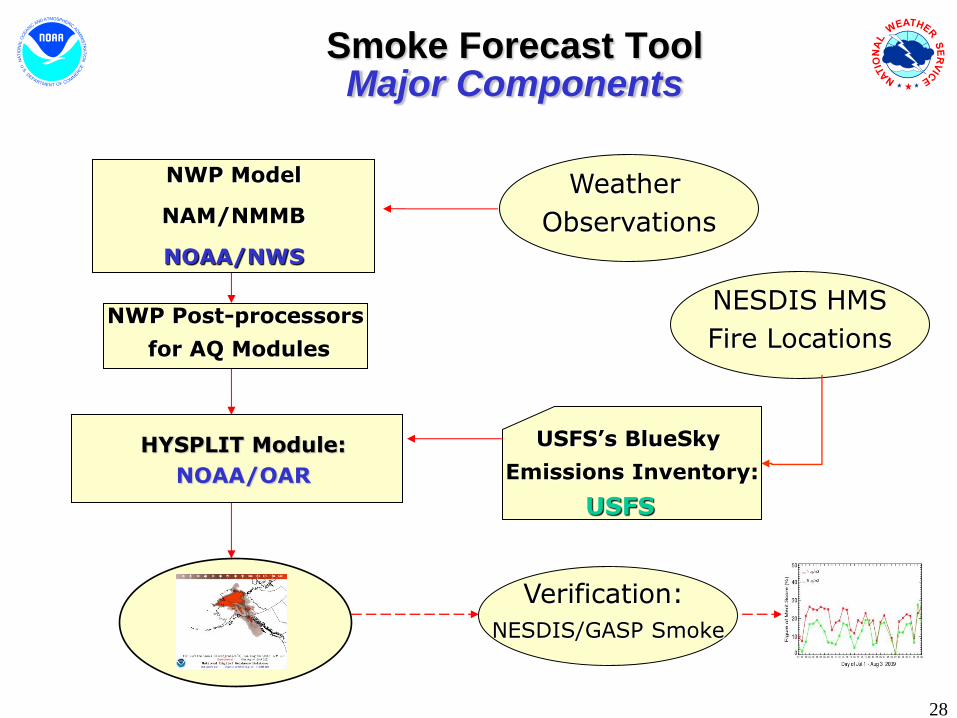
Smoke Forecast Tool Major Components
NWP Model
NAM/NMMB
NOAA/NWS
HYSPLIT Module:
NOAA/OAR
Weather
Observations
USFS’s BlueSky
Emissions Inventory:
USFS
NWP Post-processors
for AQ Modules
NESDIS HMS
Fire Locations
Verification:
NESDIS/GASP Smoke
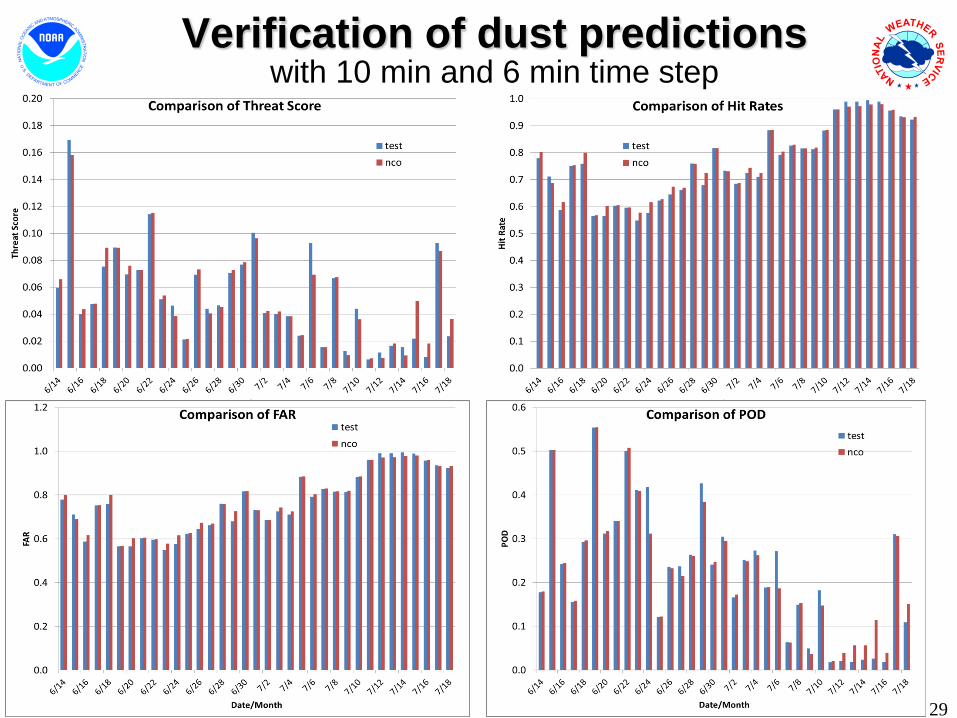
Verification of dust predictions with 10 min and 6 min time step
29