applications of dna tiling arrays for whole-genome analysis · review applications of dna tiling...
TRANSCRIPT

www.elsevier.com/locate/ygeno
Genomics 85 (
Review
Applications of DNA tiling arrays for whole-genome analysis
Todd C. Mocklera, Joseph R. Eckera,b,*
aPlant Biology Laboratory, The Salk Institute for Biological Studies, La Jolla, CA 92037, USAbGenomic Analysis Laboratory, The Salk Institute for Biological Studies, La Jolla, CA 92037, USA
Received 7 July 2004; accepted 14 October 2004
Available online 24 November 2004
Abstract
DNA microarrays are a well-established technology for measuring gene expression levels. Microarrays designed for this purpose use
relatively few probes for each gene and are biased toward known and predicted gene structures. Recently, high-density oligonucleotide-based
whole-genome microarrays have emerged as a preferred platform for genomic analysis beyond simple gene expression profiling. Potential
uses for such whole-genome arrays include empirical annotation of the transcriptome, chromatin-immunoprecipitation-chip studies, analysis
of alternative splicing, characterization of the methylome (the methylation state of the genome), polymorphism discovery and genotyping,
comparative genome hybridization, and genome resequencing. Here we review different whole-genome microarray designs and applications
of this technology to obtain a wide variety of genomic scale information.
D 2004 Elsevier Inc. All rights reserved.
Contents
Applications of whole-genome arrays (WGAs) . . . . . . . . . . . . . . . . . . . . . . . . . . . . . . . . . . . . . . . . . . . . . 2
Unbiased measure of transcriptional activity. . . . . . . . . . . . . . . . . . . . . . . . . . . . . . . . . . . . . . . . . . . . . 2
Alternative splicing . . . . . . . . . . . . . . . . . . . . . . . . . . . . . . . . . . . . . . . . . . . . . . . . . . . . . . . . . 4
Identification of RNA-binding protein targets . . . . . . . . . . . . . . . . . . . . . . . . . . . . . . . . . . . . . . . . . . . . 7
Genome analysis. . . . . . . . . . . . . . . . . . . . . . . . . . . . . . . . . . . . . . . . . . . . . . . . . . . . . . . . . . . . . 7
ChIP-chip . . . . . . . . . . . . . . . . . . . . . . . . . . . . . . . . . . . . . . . . . . . . . . . . . . . . . . . . . . . . . . 7
Methylome analysis . . . . . . . . . . . . . . . . . . . . . . . . . . . . . . . . . . . . . . . . . . . . . . . . . . . . . . . . . 8
Polymorphism analysis and genome resequencing. . . . . . . . . . . . . . . . . . . . . . . . . . . . . . . . . . . . . . . . . . 9
Tiling array design considerations . . . . . . . . . . . . . . . . . . . . . . . . . . . . . . . . . . . . . . . . . . . . . . . . . . 10
Challenges and future directions. . . . . . . . . . . . . . . . . . . . . . . . . . . . . . . . . . . . . . . . . . . . . . . . . . . . . 11
Note added in proof . . . . . . . . . . . . . . . . . . . . . . . . . . . . . . . . . . . . . . . . . . . . . . . . . . . . . . . . . . . 12
Acknowledgments . . . . . . . . . . . . . . . . . . . . . . . . . . . . . . . . . . . . . . . . . . . . . . . . . . . . . . . . . . . . 12
References . . . . . . . . . . . . . . . . . . . . . . . . . . . . . . . . . . . . . . . . . . . . . . . . . . . . . . . . . . . . . . . . 12
The completion of numerous genome sequences has
introduced an era of whole-genome study. Gaining a more
complete understanding of the genome’s information con-
tent will dramatically improve our understanding of various
biological processes. In parallel with the sequencing of
0888-7543/$ - see front matter D 2004 Elsevier Inc. All rights reserved.
doi:10.1016/j.ygeno.2004.10.005
* Corresponding author. Plant Biology Laboratory, The Salk Institute
for Biological Studies, 10010 N. Torrey Pines Rd., La Jolla, CA 92037,
United States. Fax: +1 858 558 6379.
E-mail address: [email protected] (J.R. Ecker).
entire genomes, recent advances in microarray technologies
have made it feasible to interrogate an entire genome
sequence with arrays. Such high-density whole-genome
DNA microarrays can be used as a generic platform for
numerous experimental approaches to decode the informa-
tion contained within the genome. In this review, we discuss
several approaches using high-density whole-genome oli-
gonucleotide microarrays for transcriptome characterization,
novel gene discovery, analysis of alternative splicing,
mapping of regulatory DNA motifs using the chromatin-
2005) 1–15
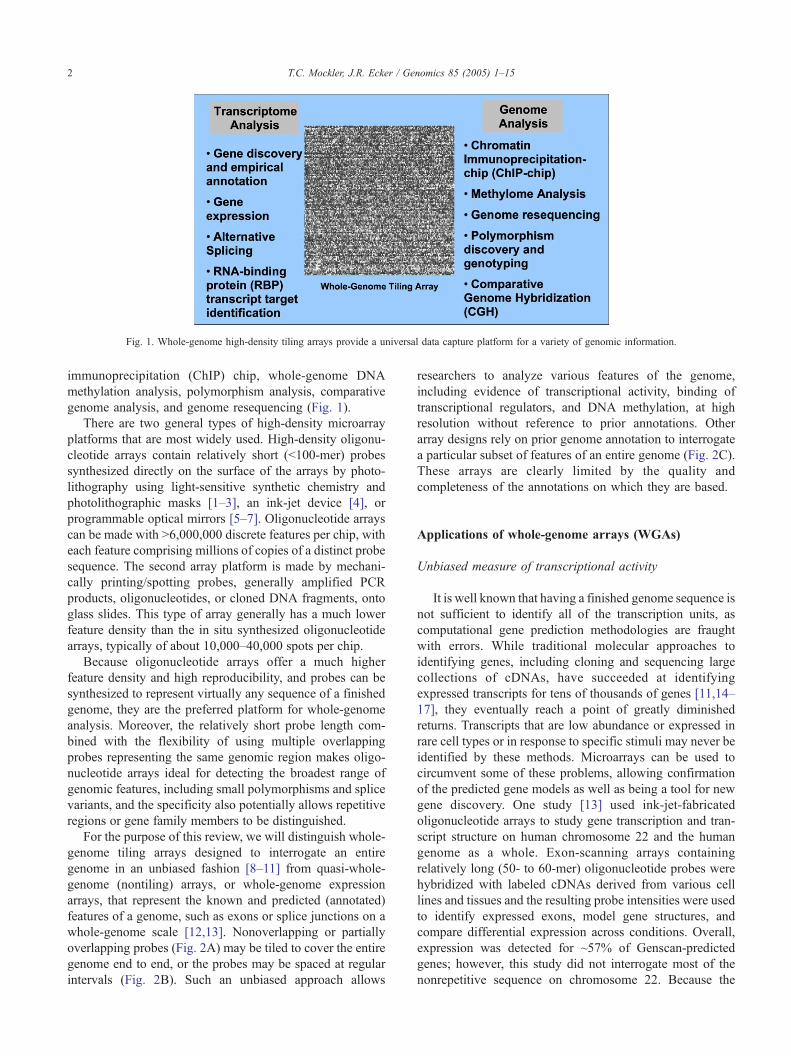
Fig. 1. Whole-genome high-density tiling arrays provide a universal data capture platform for a variety of genomic information.
T.C. Mockler, J.R. Ecker / Genomics 85 (2005) 1–152
immunoprecipitation (ChIP) chip, whole-genome DNA
methylation analysis, polymorphism analysis, comparative
genome analysis, and genome resequencing (Fig. 1).
There are two general types of high-density microarray
platforms that are most widely used. High-density oligonu-
cleotide arrays contain relatively short (b100-mer) probes
synthesized directly on the surface of the arrays by photo-
lithography using light-sensitive synthetic chemistry and
photolithographic masks [1–3], an ink-jet device [4], or
programmable optical mirrors [5–7]. Oligonucleotide arrays
can be made with N6,000,000 discrete features per chip, with
each feature comprising millions of copies of a distinct probe
sequence. The second array platform is made by mechani-
cally printing/spotting probes, generally amplified PCR
products, oligonucleotides, or cloned DNA fragments, onto
glass slides. This type of array generally has a much lower
feature density than the in situ synthesized oligonucleotide
arrays, typically of about 10,000–40,000 spots per chip.
Because oligonucleotide arrays offer a much higher
feature density and high reproducibility, and probes can be
synthesized to represent virtually any sequence of a finished
genome, they are the preferred platform for whole-genome
analysis. Moreover, the relatively short probe length com-
bined with the flexibility of using multiple overlapping
probes representing the same genomic region makes oligo-
nucleotide arrays ideal for detecting the broadest range of
genomic features, including small polymorphisms and splice
variants, and the specificity also potentially allows repetitive
regions or gene family members to be distinguished.
For the purpose of this review, we will distinguish whole-
genome tiling arrays designed to interrogate an entire
genome in an unbiased fashion [8–11] from quasi-whole-
genome (nontiling) arrays, or whole-genome expression
arrays, that represent the known and predicted (annotated)
features of a genome, such as exons or splice junctions on a
whole-genome scale [12,13]. Nonoverlapping or partially
overlapping probes (Fig. 2A) may be tiled to cover the entire
genome end to end, or the probes may be spaced at regular
intervals (Fig. 2B). Such an unbiased approach allows
researchers to analyze various features of the genome,
including evidence of transcriptional activity, binding of
transcriptional regulators, and DNA methylation, at high
resolution without reference to prior annotations. Other
array designs rely on prior genome annotation to interrogate
a particular subset of features of an entire genome (Fig. 2C).
These arrays are clearly limited by the quality and
completeness of the annotations on which they are based.
Applications of whole-genome arrays (WGAs)
Unbiased measure of transcriptional activity
It is well known that having a finished genome sequence is
not sufficient to identify all of the transcription units, as
computational gene prediction methodologies are fraught
with errors. While traditional molecular approaches to
identifying genes, including cloning and sequencing large
collections of cDNAs, have succeeded at identifying
expressed transcripts for tens of thousands of genes [11,14–
17], they eventually reach a point of greatly diminished
returns. Transcripts that are low abundance or expressed in
rare cell types or in response to specific stimuli may never be
identified by these methods. Microarrays can be used to
circumvent some of these problems, allowing confirmation
of the predicted gene models as well as being a tool for new
gene discovery. One study [13] used ink-jet-fabricated
oligonucleotide arrays to study gene transcription and tran-
script structure on human chromosome 22 and the human
genome as a whole. Exon-scanning arrays containing
relatively long (50- to 60-mer) oligonucleotide probes were
hybridized with labeled cDNAs derived from various cell
lines and tissues and the resulting probe intensities were used
to identify expressed exons, model gene structures, and
compare differential expression across conditions. Overall,
expression was detected for ~57% of Genscan-predicted
genes; however, this study did not interrogate most of the
nonrepetitive sequence on chromosome 22. Because the

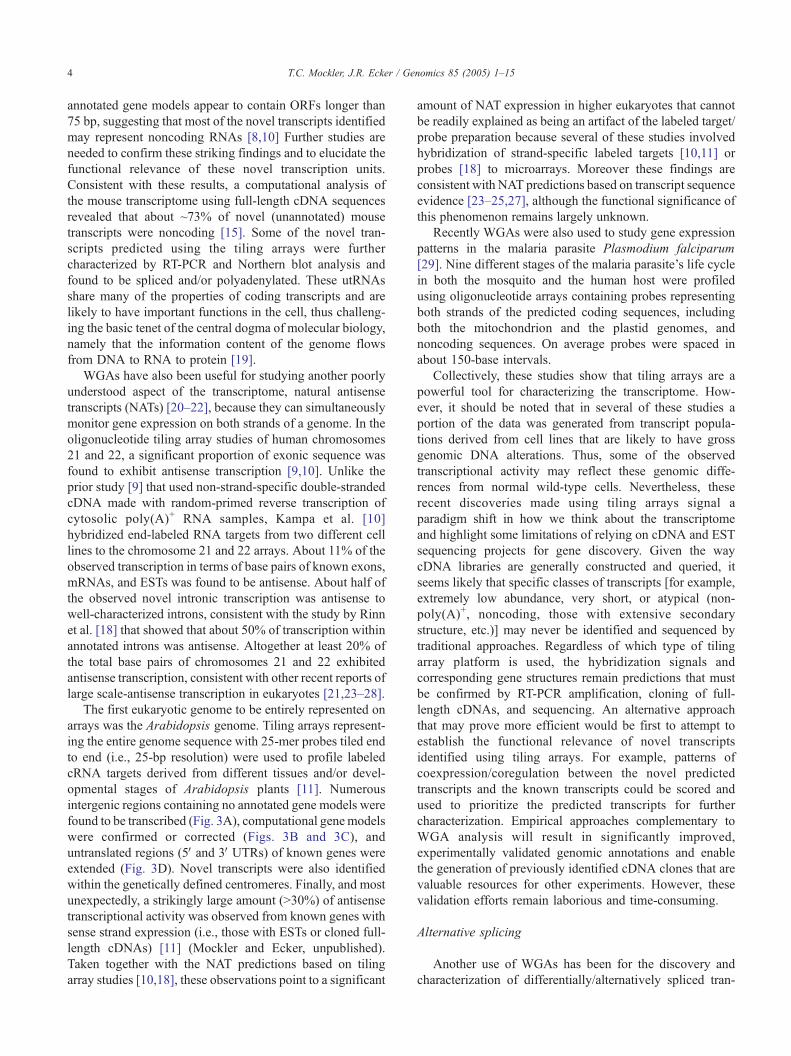
Fig. 2. A comparison of different whole-genome array designs. Unbiased
whole-genome tiling array designs (A and B) contain oligonucleotide probes
representing the entire genomic sequence. Probes may be (A) partially
overlapping or nonoverlapping and tiled end to end or may be (B) spaced at
regular intervals to interrogate the entire genome without annotation bias.
(C) Other biased whole-genome array designs such as typical expression
arrays, splice-junction arrays, and exon-scanning arrays contain only
oligonucleotide probes for the known and predicted features of a genome.
(D) Tiling resequencing arrays represent each nucleotide of the reference
genomic DNA sequence with a set of eight oligonucleotide probes.
T.C. Mockler, J.R. Ecker / Genomics 85 (2005) 1–15 3
exon-scanning arrays were designed using only known and
computationally predicted exons, they were of limited use for
discovering novel genes or gene features, such as terminal
exons that are often missed by the gene prediction
algorithms. For some genomic regions, tiling arrays with
partially overlapping (10-base increments) 60-mer probes
were used to demonstrate the utility of high-resolution tiling
arrays for refining and confirming gene structures predicted
by the exon arrays. These approaches confirmed the utility of
WGAs for at least a first stage of empirical validation of
genome annotations. However, none of the arrays were able
to provide an unbiased view of the genome and thus could not
interrogate portions of the genome outside of the annotations.
Until recently, the traditional view of the genome was that
bgenesQ were the regions of the genome that encoded
proteins or structural RNAs; the regions upstream of genes
were considered regulatory sequences (promoters), and
much of the rest was considered bjunk.Q Recent analyses
of the transcriptome using unbiased WGAs have challenged
this view. Studies involving arrays containing PCR frag-
ments covering all unique regions of human chromosome 22
[18] or high-density oligonucleotide tiling arrays covering
essentially all nonrepetitive regions of human chromosomes
21 and 22 [8–10] or the entire Arabidopsis genome [11] have
been used to map the sites of transcriptional activity in an
unbiased fashion. These studies revealed that up to 10 times
more expression than predicted from prior EST or cDNA
evidence or gene predictions was evident in the human and
plant genomes, although questions remain as to whether
these observations reflect so-called btranscriptional noise.QHigh-density oligonucleotide tiling arrays have been used
to interrogate chromosomes 21 and 22 via 25-mer probes
spaced on average every 35 bp [8–10]. The arrays were
probed with labeled targets prepared from poly(A)+ mRNAs
isolated from several different human cell line and tissue
samples. The results indicated that a much larger portion of
the human genome is transcribed than was previously
appreciated, with as much as 90% of the observed tran-
scription occurring outside of known or otherwise annotated
exons. Using a completely different microarray platform
comprising PCR fragments representing most of the non-
repetitive sequence of human chromosome 22, Rinn et al.
[18] found at least twice as much transcribed sequence as
expected based on the annotation. Rinn et al. also compared
the expressed sequences of chromosome 22 predicted by
their study with those predicted by Kapranov et al. [9] and
found extensive overlap, with ~90% of the ~2500 hybrid-
izing PCR fragments on their array being detected as
expressed in Kapranov’s study. Thus considering that at
least half of the observed transcription in these studies that
used different microarray platforms was outside of any
known annotation, ~45% of the novel transcription was
observed in both studies. The hypothesis that these novel
transcripts derived from previously unannotated portions of
the genome possess some biological function instead of
merely being transcriptional noise is supported by evidence
of evolutionary sequence conservation for some ~20 [10] to
~44% [18] of these transcripts based on comparisons to the
mouse genome. Many of the novel transcription units
observed in these studies correspond to so-called noncoding
RNAs or untranslated (utRNA) transcripts, which may be at
least as prevalent as transcripts encoding proteins. Less than
a quarter of the transcription units found to occur outside of
T.C. Mockler, J.R. Ecker / Genomics 85 (2005) 1–154
annotated gene models appear to contain ORFs longer than
75 bp, suggesting that most of the novel transcripts identified
may represent noncoding RNAs [8,10] Further studies are
needed to confirm these striking findings and to elucidate the
functional relevance of these novel transcription units.
Consistent with these results, a computational analysis of
the mouse transcriptome using full-length cDNA sequences
revealed that about ~73% of novel (unannotated) mouse
transcripts were noncoding [15]. Some of the novel tran-
scripts predicted using the tiling arrays were further
characterized by RT-PCR and Northern blot analysis and
found to be spliced and/or polyadenylated. These utRNAs
share many of the properties of coding transcripts and are
likely to have important functions in the cell, thus challeng-
ing the basic tenet of the central dogma of molecular biology,
namely that the information content of the genome flows
from DNA to RNA to protein [19].
WGAs have also been useful for studying another poorly
understood aspect of the transcriptome, natural antisense
transcripts (NATs) [20–22], because they can simultaneously
monitor gene expression on both strands of a genome. In the
oligonucleotide tiling array studies of human chromosomes
21 and 22, a significant proportion of exonic sequence was
found to exhibit antisense transcription [9,10]. Unlike the
prior study [9] that used non-strand-specific double-stranded
cDNA made with random-primed reverse transcription of
cytosolic poly(A)+ RNA samples, Kampa et al. [10]
hybridized end-labeled RNA targets from two different cell
lines to the chromosome 21 and 22 arrays. About 11% of the
observed transcription in terms of base pairs of known exons,
mRNAs, and ESTs was found to be antisense. About half of
the observed novel intronic transcription was antisense to
well-characterized introns, consistent with the study by Rinn
et al. [18] that showed that about 50% of transcription within
annotated introns was antisense. Altogether at least 20% of
the total base pairs of chromosomes 21 and 22 exhibited
antisense transcription, consistent with other recent reports of
large scale-antisense transcription in eukaryotes [21,23–28].
The first eukaryotic genome to be entirely represented on
arrays was the Arabidopsis genome. Tiling arrays represent-
ing the entire genome sequence with 25-mer probes tiled end
to end (i.e., 25-bp resolution) were used to profile labeled
cRNA targets derived from different tissues and/or devel-
opmental stages of Arabidopsis plants [11]. Numerous
intergenic regions containing no annotated gene models were
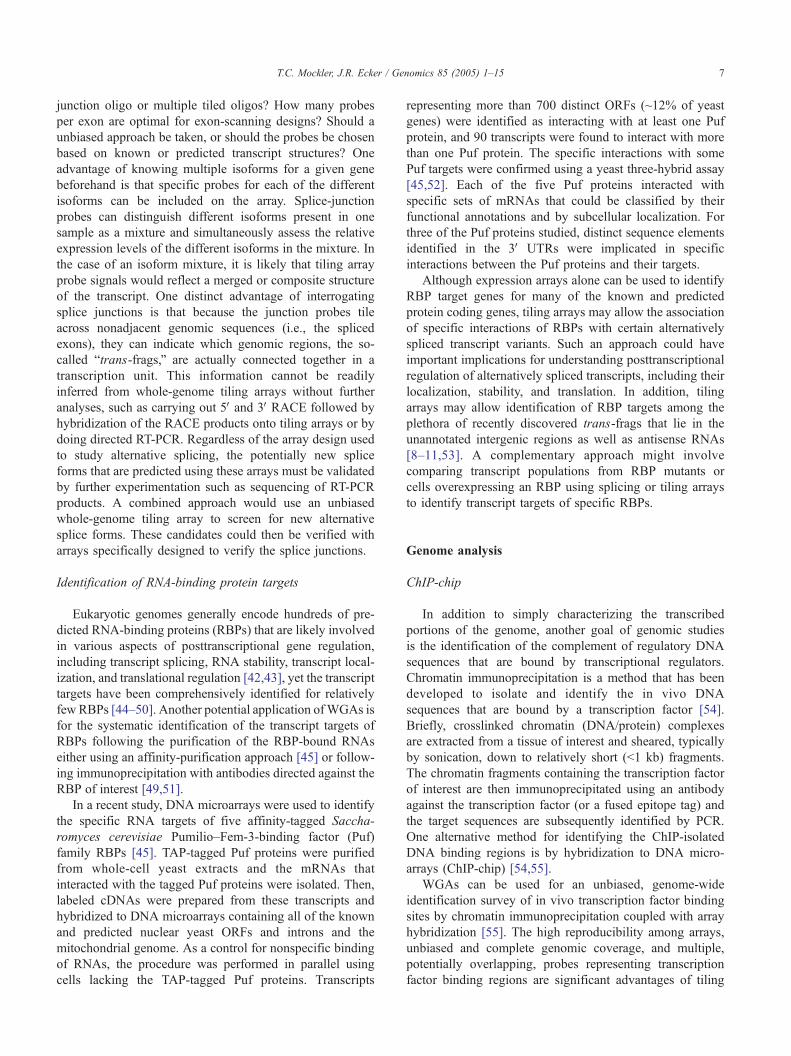
found to be transcribed (Fig. 3A), computational genemodels
were confirmed or corrected (Figs. 3B and 3C), and
untranslated regions (5Vand 3VUTRs) of known genes were
extended (Fig. 3D). Novel transcripts were also identified
within the genetically defined centromeres. Finally, and most
unexpectedly, a strikingly large amount (N30%) of antisense
transcriptional activity was observed from known genes with
sense strand expression (i.e., those with ESTs or cloned full-
length cDNAs) [11] (Mockler and Ecker, unpublished).
Taken together with the NAT predictions based on tiling
array studies [10,18], these observations point to a significant
amount of NAT expression in higher eukaryotes that cannot
be readily explained as being an artifact of the labeled target/
probe preparation because several of these studies involved
hybridization of strand-specific labeled targets [10,11] or
probes [18] to microarrays. Moreover these findings are
consistent with NAT predictions based on transcript sequence
evidence [23–25,27], although the functional significance of
this phenomenon remains largely unknown.
Recently WGAs were also used to study gene expression
patterns in the malaria parasite Plasmodium falciparum
[29]. Nine different stages of the malaria parasite’s life cycle
in both the mosquito and the human host were profiled
using oligonucleotide arrays containing probes representing
both strands of the predicted coding sequences, including
both the mitochondrion and the plastid genomes, and
noncoding sequences. On average probes were spaced in
about 150-base intervals.
Collectively, these studies show that tiling arrays are a
powerful tool for characterizing the transcriptome. How-
ever, it should be noted that in several of these studies a
portion of the data was generated from transcript popula-
tions derived from cell lines that are likely to have gross
genomic DNA alterations. Thus, some of the observed
transcriptional activity may reflect these genomic diffe-
rences from normal wild-type cells. Nevertheless, these
recent discoveries made using tiling arrays signal a
paradigm shift in how we think about the transcriptome
and highlight some limitations of relying on cDNA and EST
sequencing projects for gene discovery. Given the way
cDNA libraries are generally constructed and queried, it
seems likely that specific classes of transcripts [for example,
extremely low abundance, very short, or atypical (non-
poly(A)+, noncoding, those with extensive secondary
structure, etc.)] may never be identified and sequenced by
traditional approaches. Regardless of which type of tiling
array platform is used, the hybridization signals and
corresponding gene structures remain predictions that must
be confirmed by RT-PCR amplification, cloning of full-
length cDNAs, and sequencing. An alternative approach
that may prove more efficient would be first to attempt to
establish the functional relevance of novel transcripts
identified using tiling arrays. For example, patterns of
coexpression/coregulation between the novel predicted
transcripts and the known transcripts could be scored and
used to prioritize the predicted transcripts for further
characterization. Empirical approaches complementary to
WGA analysis will result in significantly improved,
experimentally validated genomic annotations and enable
the generation of previously identified cDNA clones that are
valuable resources for other experiments. However, these
validation efforts remain laborious and time-consuming.
Alternative splicing
Another use of WGAs has been for the discovery and
characterization of differentially/alternatively spliced tran-

Fig. 3. Comparison of Arabidopsis transcription units using computational and WGA analyses. (A) Example of a novel unannotated gene transcription n intergenic region, (B) a computationally derived gene
model (At3g14670) that is annotated on the wrong strand, (C) gene model confirmation and correction for an annotated hypothetical gene (At2g04135), a D) a novel 5Vexon for a known gene (At5g42190) fromArabidopsis whole-genome tiling array data visualized using the ChipViewer software (H. Chen and J. Ecker, unpublished and http://signal.salk.edu/ bin/atta).
T.C.Mockler,
J.R.Ecker
/Genomics
85(2005)1–15
5
in a
nd (
cgi-

T.C. Mockler, J.R. Ecker / Genomics 85 (2005) 1–156
scripts. Alternative splicing is an important mechanism of
genetic regulation in higher eukaryotes that increases
protein diversity by allowing multiple functionally distinct
proteins to be encoded by a single gene, with some genes
potentially generating thousands of isoforms [30–33]. Some
RNA-binding proteins act as trans-acting splicing factors
that bind to numerous exonic splicing enhancers within
transcripts to promote inclusion of alternative exons with
weak splice sites in the pre-mRNA, while others bind to
intronic splicing modifier sequences. Alternative splicing is
hypothesized to result from a dynamic antagonism between
these trans-acting factors that bind to regulatory elements in
the pre-mRNA [30,34]. Numerous computational studies
have examined alternative splicing by analysis of EST and
cDNA transcript sequence evidence [35–38]. Although
these computational approaches have identified thousands
of alternatively spliced transcripts, they are constrained by
the amount and quality of the available transcript sequence
data. Thus human or mouse, with about 10 times more ESTs
than other organisms (http://www.ncbi.nlm.nih.gov/dbEST/),
may seem to have more extensive alternative splicing due to
simply having more EST sequences available. WGAs
potentially offer a powerful platform for both identifying
new alternatively spliced transcript forms and characterizing
the splicing of known transcripts in diverse collections of
samples such as different cell types, tissues, developmental
stages, or drug treatments. In a pioneering study demon-
strating the utility of microarrays for studying splicing,
microarrays containing oligonucleotide probes correspond-
ing to splice junctions, introns, and exons were used to
characterize alternative splicing for all intron-containing
genes of yeast [39]. More recently, ink-jet-synthesized arrays
have been designed that specifically examine alternative
splicing of known gene models [12,40]. These arrays were
not whole-genome tiling arrays per se and thus have an
inherent limitation of being biased for known genes and
predicted gene models. In one study, Castle et al. [40]
demonstrated the utility of ink-jet oligonucleotide arrays for
analyzing transcript structure and alternative splicing.
Optimal probe lengths, tiling densities, probe overlap
requirements, and hybridization conditions were assessed
for the detection of various transcript features, including
differentiating exons from introns, calling exon edges, and
monitoring splice junctions. These pilot experiments deter-
mined that the optimal design for identifying exons used 50-
to 60-mer probes, exon edges could be best defined using
35- to 40-mer overlapping probes tiled across splice
junctions, and 30- to 40-mer splice-junction probes centered
exactly on the splice junction or slightly offset were optimal.
In a follow-up study, ink-jet-fabricated splice-junction
arrays were used for a whole-genome survey of alternatively
spliced transcripts [12,40]. A set of five ink-jet arrays
comprising about 125,000 36-mer splice-junction probes
was used to monitor the splicing of ~10,000 human genes.
Labeled cDNA targets from 52 tissues and cell lines were
hybridized to these arrays in duplicate. Half of the alternative
splicing predictions based on the array data could be
validated by RT-PCR and sequencing. This approach has
provided strong evidence for alternative splicing in thousands
of genes and identified alternative splice variants not
previously predicted from cDNA evidence. Also, completely
novel alternative splicing was found for genes not previously
known to be alternatively spliced. However, the array-based
approach to analyzing alternative splicing also has limita-
tions. For example, for relatively rare splicing events, a large
number of distinct tissues or cell populations must be
surveyed to obtain sufficient confidence to call a splice
variant at a specific splice junction. In addition, the splice
junction arrays cannot distinguish whether two splicing
events observed in one sample occur in the same or distinct
transcripts, if the two isoforms are expressed at similar levels.
Moreover, if two splicing events are mutually exclusive, then
prior knowledge is required to design probes capable of
recognizing both forms. An additional challenge is that
splice-junction probes are constrained by their positions in
the transcripts and therefore cannot be chosen for optimal
binding characteristics (probe affinity, secondary structure,
and specificity).
Unbiased WGAs have also been used to monitor one
type of alternative splicing event—exon-skipping [9,10]. By
comparing the expression levels of all of the exons within
genes, it was shown that a large fraction (~80%) of
expressed genes on chromosomes 21 and 22 exhibit exon
skipping. This estimate is significantly higher than previous
predictions [36,41] based on computational analysis of ESTs
and cDNAs. However, it should be noted that estimates of
alternative splicing based on expressed sequence data (ESTs
and cDNAs) can be problematic for a few reasons and thus
may be underestimates. First, the EST and cDNA data are
biased against low-abundance transcripts that may not be
well represented in the sequence databases, whereas the
array approach can detect alternative splicing even for low-
abundance tissue-specific transcripts. In addition, alternative
splicing predictions based on sequence data are likely biased
toward the termini of transcripts due to the preponderance of
end-sequence reads among ESTs and oligo(dT)-based
priming for reverse transcription.
Much work remains to be done to make microarrays a
preferred platform for routine analysis of alternative
splicing, and it is not yet clear which whole-genome array
design is best for this application. Should unbiased tiling
WGAs, splice-junction arrays, exon scanning, or some
combination of all of the above be used to study alternative
splicing? Regardless of the general array design chosen to
study splicing, a reasonable approach would be to integrate
all available prior evidence for alternative splicing (such as
EST- and cDNA-based predictions) into both the array
design and the probe selection as well as the analysis of the
resulting data to increase the confidence of the microarray-
based alternative splicing calls. Many other equally impor-
tant questions remain as well. For splice-junction analysis,
what is the best density of the junction probes, a single
T.C. Mockler, J.R. Ecker / Genomics 85 (2005) 1–15 7
junction oligo or multiple tiled oligos? How many probes
per exon are optimal for exon-scanning designs? Should a
unbiased approach be taken, or should the probes be chosen
based on known or predicted transcript structures? One
advantage of knowing multiple isoforms for a given gene
beforehand is that specific probes for each of the different
isoforms can be included on the array. Splice-junction
probes can distinguish different isoforms present in one
sample as a mixture and simultaneously assess the relative
expression levels of the different isoforms in the mixture. In
the case of an isoform mixture, it is likely that tiling array
probe signals would reflect a merged or composite structure
of the transcript. One distinct advantage of interrogating
splice junctions is that because the junction probes tile
across nonadjacent genomic sequences (i.e., the spliced
exons), they can indicate which genomic regions, the so-
called btrans-frags,Q are actually connected together in a
transcription unit. This information cannot be readily
inferred from whole-genome tiling arrays without further
analyses, such as carrying out 5Vand 3VRACE followed by
hybridization of the RACE products onto tiling arrays or by
doing directed RT-PCR. Regardless of the array design used
to study alternative splicing, the potentially new splice
forms that are predicted using these arrays must be validated
by further experimentation such as sequencing of RT-PCR
products. A combined approach would use an unbiased
whole-genome tiling array to screen for new alternative
splice forms. These candidates could then be verified with
arrays specifically designed to verify the splice junctions.
Identification of RNA-binding protein targets
Eukaryotic genomes generally encode hundreds of pre-
dicted RNA-binding proteins (RBPs) that are likely involved
in various aspects of posttranscriptional gene regulation,
including transcript splicing, RNA stability, transcript local-
ization, and translational regulation [42,43], yet the transcript
targets have been comprehensively identified for relatively
few RBPs [44–50]. Another potential application ofWGAs is
for the systematic identification of the transcript targets of
RBPs following the purification of the RBP-bound RNAs
either using an affinity-purification approach [45] or follow-
ing immunoprecipitation with antibodies directed against the
RBP of interest [49,51].
In a recent study, DNA microarrays were used to identify
the specific RNA targets of five affinity-tagged Saccha-
romyces cerevisiae Pumilio–Fem-3-binding factor (Puf)
family RBPs [45]. TAP-tagged Puf proteins were purified
from whole-cell yeast extracts and the mRNAs that
interacted with the tagged Puf proteins were isolated. Then,
labeled cDNAs were prepared from these transcripts and
hybridized to DNA microarrays containing all of the known
and predicted nuclear yeast ORFs and introns and the
mitochondrial genome. As a control for nonspecific binding
of RNAs, the procedure was performed in parallel using
cells lacking the TAP-tagged Puf proteins. Transcripts
representing more than 700 distinct ORFs (~12% of yeast
genes) were identified as interacting with at least one Puf
protein, and 90 transcripts were found to interact with more
than one Puf protein. The specific interactions with some
Puf targets were confirmed using a yeast three-hybrid assay
[45,52]. Each of the five Puf proteins interacted with
specific sets of mRNAs that could be classified by their
functional annotations and by subcellular localization. For
three of the Puf proteins studied, distinct sequence elements
identified in the 3V UTRs were implicated in specific
interactions between the Puf proteins and their targets.
Although expression arrays alone can be used to identify
RBP target genes for many of the known and predicted
protein coding genes, tiling arrays may allow the association
of specific interactions of RBPs with certain alternatively
spliced transcript variants. Such an approach could have
important implications for understanding posttranscriptional
regulation of alternatively spliced transcripts, including their
localization, stability, and translation. In addition, tiling
arrays may allow identification of RBP targets among the
plethora of recently discovered trans-frags that lie in the
unannotated intergenic regions as well as antisense RNAs
[8–11,53]. A complementary approach might involve
comparing transcript populations from RBP mutants or
cells overexpressing an RBP using splicing or tiling arrays
to identify transcript targets of specific RBPs.
Genome analysis
ChIP-chip
In addition to simply characterizing the transcribed
portions of the genome, another goal of genomic studies
is the identification of the complement of regulatory DNA
sequences that are bound by transcriptional regulators.
Chromatin immunoprecipitation is a method that has been
developed to isolate and identify the in vivo DNA
sequences that are bound by a transcription factor [54].
Briefly, crosslinked chromatin (DNA/protein) complexes
are extracted from a tissue of interest and sheared, typically
by sonication, down to relatively short (b1 kb) fragments.
The chromatin fragments containing the transcription factor
of interest are then immunoprecipitated using an antibody
against the transcription factor (or a fused epitope tag) and
the target sequences are subsequently identified by PCR.
One alternative method for identifying the ChIP-isolated
DNA binding regions is by hybridization to DNA micro-
arrays (ChIP-chip) [54,55].
WGAs can be used for an unbiased, genome-wide
identification survey of in vivo transcription factor binding
sites by chromatin immunoprecipitation coupled with array
hybridization [55]. The high reproducibility among arrays,
unbiased and complete genomic coverage, and multiple,
potentially overlapping, probes representing transcription
factor binding regions are significant advantages of tiling

T.C. Mockler, J.R. Ecker / Genomics 85 (2005) 1–158
arrays over other array designs. Indeed, at a high probe
tiling resolution, multiple overlapping probes may contain
the actual transcription factor binding motif and thus enable
a fine mapping of the binding site to a resolution of less than
25 bp. Although it may not yet be practical in terms of cost
and the number of chips required for some organisms, when
used for ChIP-chip studies high-density oligonucleotide
arrays coupled with rigorous statistical analysis methods can
provide high-resolution binding site location data with high
sensitivity and reasonably low false-positive rates.
Microarrays containing genomic PCR products have
been used for ChIP-chip studies in yeast [56–62] and in
mammalian cells [56,63–66]. However, many of the ChIP-
chip studies in mammalian cells have analyzed only selected
predicted promoter regions and do not interrogate the entire
genome. Such arrays cannot address the possibility that
transcription factors might bind at other locations. For
example, it has been shown in yeast that forkhead trans-
cription factors can associate with the genomic coding
regions and function to coordinate transcription elongation
and transcript processing [67].
Recently several unbiased chromosome-wide transcrip-
tion factor studies in mammalian cells have been under-
taken. A somewhat surprising finding from this work has
been that a large fraction of in vivo binding sites were
outside of the predicted promoter regions of genes [8,63,68].
It was found that the binding locations of NF-nB [63];
cMyc, Sp1, and p53 [8]; and CREB [68] were located within
both coding and noncoding regions. More binding sites
were found than expected, and only a relatively small
fraction of the sites occurred in regions that would typically
be considered bpromotersQ—near the 5V ends of protein-
coding genes. The binding sites frequently occurred in
introns, coding regions, or unannotated transcriptionally
active regions or near the 3V ends of genes. Collectively,
these results indicate that transcription factor binding is not
restricted to canonical annotated upstream promoter regions
and may herald a paradigm shift for our understanding of
transcriptional regulation. Unbiased genome tiling arrays
were key to these discoveries.
Methylome analysis
Chromatin modifications associated with regulation of
gene expression include methylation of cytosines as well as
the acetylation, methylation, phosphorylation, etc., of
histones [69]. In eukaryotes, cytosine methylation has
evolved into a mechanism that allows dividing cells to
inherit states of gene activity stably, and in most cases DNA
methylation causes gene silencing. The most conserved role
for DNA methylation in eukaryotes is in the silencing of
repetitive elements in the genome, primarily transposons
and retroviruses [70,71]. DNA methylation is also important
in cancer biology, as tumors often show both hypomethy-
lation and hypermethylation of specific tumor suppressor
genes. DNA methylation is generally thought to have
initially evolved as a defense mechanism against bforeignQDNA sequences that pose a threat to genome stability (such
as transposable elements and retroviruses) [71,72] and later
assumed other cellular functions, such as developmental
regulation of gene expression. In addition to its role in
transposon silencing, DNA methylation is involved in a
myriad of epigenetic regulatory processes found throughout
the eukaryotes. In mammals, cytosine methylation plays a
key role in two gene regulatory systems that involve allele-
specific methylation, mammalian parental imprinting [73],
and X-chromosome inactivation [74]. DNA methylation is
also involved in cancer biology [75,76]. Tumors consis-
tently show abnormal patterns of methylation including
genome-wide demethylation and inappropriate hypermethy-
lation of particular genes. Methylation of genic regions is
significant, as heavy cytosine methylation is almost always
associated with histone modifications (e.g., histone H3
lysine 9 methylation), chromatin condensation, and repres-
sion of gene expression. Despite the importance of DNA
methylation, and despite decades of phenomenological
descriptions of epigenetic regulatory systems, genetic
studies of the mechanisms of DNA methylation control
are still in their infancy. In part this is because, even though
methylation is present in most eukaryotes, it has been
curiously lost in some of the most well studied model
organisms including yeast and Caenorhabditis elegans.
Drosophila has a very small amount of methylation, but
has lost most of the methylation machinery found in other
eukaryotes [77].
Bisulfite genomic sequencing is the best technique for
mapping DNA methylation at single-base resolution, but this
technique has not yet been applied to whole-genome
approaches. Sodium bisulfite treatment of DNA deaminates
cytosine to uracil, but 5V-methylcytosine is protected [78].
Thus DNA methylation is detected as cytosine residues that
survive bisulfite treatment and can be assayed by PCR
amplification and DNA sequencing or by restriction enzyme
digestion followed by PCR or DNA hybridization. Sodium
bisulfite conversion can be utilized for microarray analysis
because unmethylated DNA that is treated with bisulfite
contains uracil in place of cytosine and will hybridize
relatively poorly to microarray oligonucleotides that contain
guanines. Methylated cytosines in DNA sequences that
cannot be changed by bisulfite treatment will retain their
ability to hybridize to these oligos (A. Sundaresan and J.R.
Ecker, unpublished). The bisulfite microarray method has
several advantages for assaying DNA methylation. Because
there is no need to fractionate the DNA, every nucleotide of
the genome is inspected, and since hybridization to a
particular oligo is affected by the methylation pattern present
in that 25-mer sequence, regions of methylated DNA can be
accurately defined with single-probe resolution. Moreover,
the effect of sodium bisulfite treatment on the hybridization
of a given microarray element can be predicted, adding to the
usefulness of this method. However, the major limitation of
the bisulfite method is that some regions of lightly methylated

T.C. Mockler, J.R. Ecker / Genomics 85 (2005) 1–15 9
DNA may not be able to hybridize to array oligos after
bisulfite conversion even if the region is partially methylated.
Bisulfite conversion coupled with microarray technology
has been used to detect methylated DNA regions (http://
innovation.swmed.edu/research/instrumentation/higher_pages/inst_doc_about.html). In this work, genomic DNA
fragments are hybridized to the oligonucleotide resequencing
arrays following bisulfite treatment. In this way the methyl-
ation status of several promoter regions was analyzed at 1-
base resolution.
Another potentially useful approach to methylome
analysis would involve using methylation-sensitive restric-
tion enzymes. This method exploits the specificity of
bacterial restriction enzymes to distinguish methylated and
unmethylated DNA sequences. Endonucleolytic cleavage of
DNA can destroy hybridization to a 25-mer oligonucleotide,
particularly if the restriction enzyme site lies close to the
middle of the element. Therefore, oligonucleotides on the
microarray that contain restriction sites will show reduced
hybridization if the site is cleaved, allowing methylated
DNA sequences to be identified. Hybridization of this DNA
to a tiling microarray and comparison with labeled frag-
ments generated from undigested DNA will show a
reduction of hybridization wherever a site has been cleaved
in the middle of an oligonucleotide element. This technique
is feasible only with oligonucleotide arrays containing
relatively short (i.e., 25-mer) probes because long oligos
or larger PCR products will retain hybridization after
restriction digestion. An elaboration of this method involves
restriction enzyme digestion coupled with size selection to
discriminate between methylated and unmethylated DNAs
[79] and will detect regions of light DNA methylation more
effectively than restriction digest without size fractionation.
In this study sucrose gradient sizing and labeling of small
fragments of DNA that had been digested with a methyl-
sensitive restriction enzyme were used and the products
were then hybridized to an array that contained 384 PCR
fragments across the genome [79].
Additional approaches for methylome analysis involve
the identification of methylated DNA by immunoprecipi-
tation or affinity chromatography, followed by hybridi-
zation of the purified genomic fragments to microarrays.
Methylated DNAs can be isolated by immunoprecipitation
of fragmented DNAs with anti-5-methylcytosine antibo-
dies, as has been shown previously [80], and then the
purified products could be labeled and hybridized to tiling
arrays. Alternatively, methylated DNA could be purified by
affinity chromatography. Methyl-binding domains are
found in a family of eukaryotic chromatin proteins and
specifically recognize methylcytosine. For example,
MeCP2 will bind if only a single methylated CG is
present [81], and it has been shown that methyl-binding-
domain (MBD) agarose chromatography fractionates DNA
according to its degree of CG methylation [82]. This
approach was recently used to survey the methylated
component of the Neurospora crassa genome, by large-
scale sequencing of fragments purified by MBD agarose
chromatography [83]. Thus, affinity-purified methylated
gDNA fractions could be hybridized to tiling microarrays
to identify unmethylated, lightly methylated, and heavily
methylated portions of the genome. Both immunoprecipi-
tation and affinity chromatography are likely to have
extremely high sensitivity for detecting lightly methylated
DNA sequences; however, one limitation of these
approaches is that the purified fragments will be relatively
long (~200–500 bp). Although these methods would be
very useful in defining all of the methylated regions in the
genome, they will not precisely identify the DNA
methylation at specific cytosine residues.
Methods such as those described above have not yet been
applied to whole-genome tiling arrays to survey comprehen-
sively the methylome at high resolution. In principle,
oligonucleotide tiling arrays that cover the entire genome
will allow a truly genome-wide DNA analysis of DNA
methylation. Because genome tiling arrays can be synthe-
sized to contain relatively short (25-nucleotide) oligonucleo-
tides, they can potentially identify sites of DNA methylation
with unparalleled precision, in some cases with single-
nucleotide resolution. Because tiling arrays are universal
platforms they are ideal for assessing the correlation of a
variety of types of genomic information. WGAs can be used
for detecting correlations between DNA methylation and
global transcriptome mapping and between patterns of DNA
methylation with sense transcripts, antisense gene transcripts,
or noncoding transcripts on a whole-genome scale using
wild-type tissues, cancer cells, or specific genetic mutant
backgrounds (i.e., mutations in specific methylases, acetyl-
transferases, DNA binding proteins, etc.).
Polymorphism analysis and genome resequencing
WGAs can be used for several related approaches aimed
at comparing genomic DNA sequences to a reference
sequence and thus identifying genome-wide sequence
polymorphisms in a single array hybridization experiment.
Comparative genome hybridization (CGH), single-feature
polymorphism (SFP) detection and genotyping, and tiling
array-based genome resequencing essentially represent
whole-genome resequencing at low, medium, and high
resolution, respectively. CGH has been used mainly to
identify relatively large insertions and deletions in cancer
cell lines by hybridization of labeled DNA from different
cell lines either to arrays of BAC clones tiled to cover the
whole genome [84] or to cDNA expression arrays [85].
More recently, tiling DNA arrays containing BAC clones
representing the entire human genome [86] and oligonu-
cleotide arrays [87] have been used for CGH. Clearly,
WGAs can be useful for high-resolution CGH.
Another potential application of WGAs is for the
characterization and detection of DNA sequence variations
in individuals or populations compared to a reference
genome sequence. Identifying and cataloging such poly-

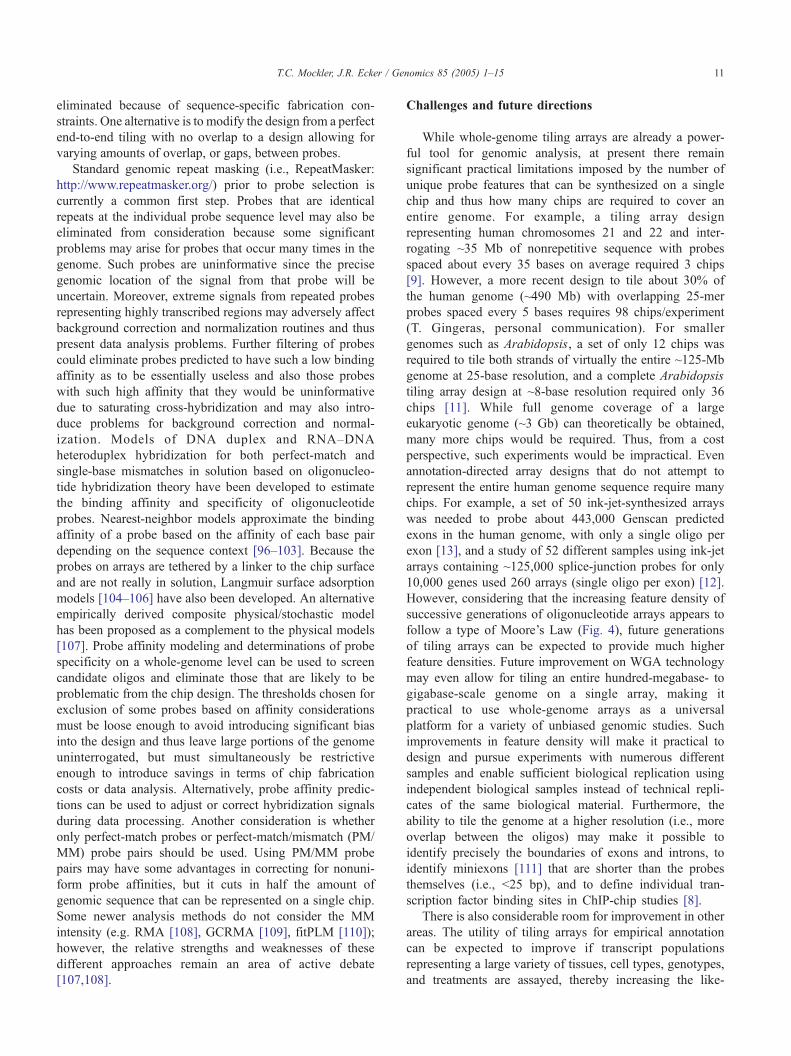
Fig. 4. A comparison of Moore’s Law for the number of transistors on a
silicon chip with the number of features on photolithography-fabricated
oligonucleotide arrays over time. Gordon Moore originally observed an
exponential growth in the number of transistors per silicon chip and
predicted that the trend would continue in his article bCramming More
Components onto Integrated CircuitsQ published in Electronics, April 19,
1965. The graph depicts the trends of increasing feature density on both
silicon chips and photolithography-fabricated oligonucleotide arrays over
time. The data for transistors, represented by solid circles, have been
adapted from information available at http://www.intel.com/, and the data
for oligonucleotide arrays, represented by solid triangles, have been adapted
from information available at http://www.affymetrix.com/ and information
provided by T. Gingeras (personal communication).
T.C. Mockler, J.R. Ecker / Genomics 85 (2005) 1–1510
morphisms is an important step in positional cloning and
candidate gene strategies for the identification of genes
associated with disease or interesting phenotypes. Array
hybridization techniques have been used successfully to
study SFPs, which are identified when specific 25-mer
oligonucleotide features exhibit significantly different
hybridization signals when different strains within a species
are compared [88,89]. This approach identifies SFPs at a
resolution of 25 bp, but does not provide the actual
sequence change of the polymorphism. In recent studies,
standard Affymetrix expression arrays have been used to
identify thousands of SFPs among different strains of
Arabidopsis [89] (Borevitz and Ecker, unpublished; http://
naturalvariation.org/sfp). It is obvious that this approach
would benefit tremendously from the use of whole-genome
tiling arrays in place of the limited number of probes
available on existing expression arrays. Not only would
WGAs enable the identification of many more SFPs, but a
WGA design using partially overlapping probes may yield
a potential SFP resolution of less than 25 bp.
The highest resolution and potentially most powerful
tiling WGA designs are intended for complete resequencing
of a genome relative to the reference sequence by hybridi-
zation [90]. Such array-based DNA sequencing is dependent
on the prior availability of a finished quality reference
sequence and is thus an alternative method for resequencing
the same genome. This application requires a specialized
ultra-high-resolution (1 bp) high-density array design
[91,92]. Resequencing arrays are designed using a set of
tiled, overlapping oligonucleotide probes. For each base
being interrogated there are four probes, one representing
the reference sequence and three that vary the central base
with one of the other three nucleotides. A mismatch (SNP)
at the middle base will reduce or prevent binding of the
labeled target and thus result in a reduced hybridization
signal (Fig. 2D). Interrogation of the sequence of both
strands of a chromosome of length N requires 8N
oligonucleotide probes. Using this approach an entire
genome can be resequenced in a single hybridization
experiment [93]. Currently one technical challenge for
resequencing arrays is the amplification and labeling of
the target, which typically involve long-range PCR. How-
ever, for organisms with a small genome direct labeling of
genomic DNA may be possible, bypassing the need for PCR
amplification prior to hybridization. Because resequencing
arrays can compare a new sequence only to the reference
sequence on which they are based they will not be as useful
for identifying novel sequences or sequence rearrangements
that may occur in the experimental sample. The large
number of probes required for complete resequencing of a
typical eukaryotic genome may make array-based rese-
quencing seem impractical. However, given the recent
increases in feature densities, it would require only ~300
chips to resequence the entire ~125-Mb Arabidopsis
genome using oligonucleotide arrays. Moreover, if current
trends in feature size continue to follow Moore’s Law, then
this technology may soon allow for routine resequencing of
much larger genomes (Fig. 4).
Tiling array design considerations
While tiling the entire genome with oligonucleotide
probes provides an unbiased view of the genome, there are
specific design and analysis problems that arise. For
expression arrays, probes are carefully selected and repre-
sent only a small subset of the possible probes within exons
[94,95]. Probes are chosen so that they all hybridize with
similar efficiencies at a given temperature and are designed
to be nonpalindromic to prevent self-hybridization. Expres-
sion chip probes are generally selected to minimize cross-
hybridization with other known parts of the transcriptome.
In addition, gene expression probe sets are selected to
provide a linear signal response with respect to target
concentration. When tiling the entire genome, these
parameters are impossible to maintain.
The simplest approach to designing a whole-genome tiling
array is to start at the beginning of each chromosome and
cover the entire sequence with 25-mer probes tiled end to end
and, for higher resolution, doing this multiple times with an
offset between tile phases [11]. However, many of the probes
chosen with this simple strategy may be problematic; some
would be duplicated, some would have weak hybridization
affinity, and some would hybridize so strongly that even
nonspecific background hybridization would generate a
saturated signal. Also, some probes may have to be
T.C. Mockler, J.R. Ecker / Genomics 85 (2005) 1–15 11
eliminated because of sequence-specific fabrication con-
straints. One alternative is to modify the design from a perfect
end-to-end tiling with no overlap to a design allowing for
varying amounts of overlap, or gaps, between probes.
Standard genomic repeat masking (i.e., RepeatMasker:
http://www.repeatmasker.org/) prior to probe selection is
currently a common first step. Probes that are identical
repeats at the individual probe sequence level may also be
eliminated from consideration because some significant
problems may arise for probes that occur many times in the
genome. Such probes are uninformative since the precise
genomic location of the signal from that probe will be
uncertain. Moreover, extreme signals from repeated probes
representing highly transcribed regions may adversely affect
background correction and normalization routines and thus
present data analysis problems. Further filtering of probes
could eliminate probes predicted to have such a low binding
affinity as to be essentially useless and also those probes
with such high affinity that they would be uninformative
due to saturating cross-hybridization and may also intro-
duce problems for background correction and normal-
ization. Models of DNA duplex and RNA–DNA
heteroduplex hybridization for both perfect-match and
single-base mismatches in solution based on oligonucleo-
tide hybridization theory have been developed to estimate
the binding affinity and specificity of oligonucleotide
probes. Nearest-neighbor models approximate the binding
affinity of a probe based on the affinity of each base pair
depending on the sequence context [96–103]. Because the
probes on arrays are tethered by a linker to the chip surface
and are not really in solution, Langmuir surface adsorption
models [104–106] have also been developed. An alternative
empirically derived composite physical/stochastic model
has been proposed as a complement to the physical models
[107]. Probe affinity modeling and determinations of probe
specificity on a whole-genome level can be used to screen
candidate oligos and eliminate those that are likely to be
problematic from the chip design. The thresholds chosen for
exclusion of some probes based on affinity considerations
must be loose enough to avoid introducing significant bias
into the design and thus leave large portions of the genome
uninterrogated, but must simultaneously be restrictive
enough to introduce savings in terms of chip fabrication
costs or data analysis. Alternatively, probe affinity predic-
tions can be used to adjust or correct hybridization signals
during data processing. Another consideration is whether
only perfect-match probes or perfect-match/mismatch (PM/
MM) probe pairs should be used. Using PM/MM probe
pairs may have some advantages in correcting for nonuni-
form probe affinities, but it cuts in half the amount of
genomic sequence that can be represented on a single chip.
Some newer analysis methods do not consider the MM
intensity (e.g. RMA [108], GCRMA [109], fitPLM [110]);
however, the relative strengths and weaknesses of these
different approaches remain an area of active debate
[107,108].
Challenges and future directions
While whole-genome tiling arrays are already a power-
ful tool for genomic analysis, at present there remain
significant practical limitations imposed by the number of
unique probe features that can be synthesized on a single
chip and thus how many chips are required to cover an
entire genome. For example, a tiling array design
representing human chromosomes 21 and 22 and inter-
rogating ~35 Mb of nonrepetitive sequence with probes
spaced about every 35 bases on average required 3 chips
[9]. However, a more recent design to tile about 30% of
the human genome (~490 Mb) with overlapping 25-mer
probes spaced every 5 bases requires 98 chips/experiment
(T. Gingeras, personal communication). For smaller
genomes such as Arabidopsis, a set of only 12 chips was
required to tile both strands of virtually the entire ~125-Mb
genome at 25-base resolution, and a complete Arabidopsis
tiling array design at ~8-base resolution required only 36
chips [11]. While full genome coverage of a large
eukaryotic genome (~3 Gb) can theoretically be obtained,
many more chips would be required. Thus, from a cost
perspective, such experiments would be impractical. Even
annotation-directed array designs that do not attempt to
represent the entire human genome sequence require many
chips. For example, a set of 50 ink-jet-synthesized arrays
was needed to probe about 443,000 Genscan predicted
exons in the human genome, with only a single oligo per
exon [13], and a study of 52 different samples using ink-jet
arrays containing ~125,000 splice-junction probes for only
10,000 genes used 260 arrays (single oligo per exon) [12].
However, considering that the increasing feature density of
successive generations of oligonucleotide arrays appears to
follow a type of Moore’s Law (Fig. 4), future generations
of tiling arrays can be expected to provide much higher
feature densities. Future improvement on WGA technology
may even allow for tiling an entire hundred-megabase- to
gigabase-scale genome on a single array, making it
practical to use whole-genome arrays as a universal
platform for a variety of unbiased genomic studies. Such
improvements in feature density will make it practical to
design and pursue experiments with numerous different
samples and enable sufficient biological replication using
independent biological samples instead of technical repli-
cates of the same biological material. Furthermore, the
ability to tile the genome at a higher resolution (i.e., more
overlap between the oligos) may make it possible to
identify precisely the boundaries of exons and introns, to
identify miniexons [111] that are shorter than the probes
themselves (i.e., b25 bp), and to define individual tran-
scription factor binding sites in ChIP-chip studies [8].
There is also considerable room for improvement in other
areas. The utility of tiling arrays for empirical annotation
can be expected to improve if transcript populations
representing a large variety of tissues, cell types, genotypes,
and treatments are assayed, thereby increasing the like-

T.C. Mockler, J.R. Ecker / Genomics 85 (2005) 1–1512
lihood of identifying low-abundance and/or rare transcripts.
The power of tiling arrays as a gene discovery tool will
improve with increased sensitivity that may be achieved
through experimental replication and will benefit from
improved analytical techniques that account for the affinity
characteristics of individual oligonucleotide probes.
Improved methods for capturing low-abundance messages
and generating labeled targets representing full-length tran-
scripts [40] will be needed. Since an intact transcript is not
required, subtractive hybridization of mRNA populations
may be useful. Methods for isolating and labeling atypical
RNAs will be necessary to characterize the full tran-
scriptome. A growing body of evidence increasingly points
to the existence of a bhidden transcriptome,Q which until
very recently was considered bbackgroundQ transcriptionalactivity. Recent studies, however, are revealing a widely
expanded role for noncoding RNAs that was previously
unimaginable [19,112,113]. Both genetic studies and the use
of tiling array technology may reveal that the transcriptional
bnoiseQ in the genome may actually turn out to be music that
the genome has been playing but we were unable to
appreciate fully.
Additional challenges will include cataloging and ana-
lyzing the enormous amount of data generated even from a
single whole-genome tiling array experiment. User-friendly
graphical interfaces such as ChipViewer (Fig. 3; H. Chen
and J. Ecker, unpublished) for the visualization and
integration of WGA data with other data and annotations
must be further developed. Moreover computational
approaches are need for integrating these data with other
genome annotations such as DNA methylation and protein
binding sites. New algorithms and statistical methods for
data analysis will be needed to extract meaningful results
from these massive datasets. For example, one of the goals
of empirical transcriptome mapping using tiling arrays is to
infer transcript structures for genes that may be incorrectly
predicted by gene prediction algorithms or missed alto-
gether. At present there are no standard methods or
analytical tools for scoring tiling array probe intensities to
infer transcriptional activity or predict transcript structures.
One approach, using a sliding window method to merge the
discontinuous hybridization signals of probes representing
discrete exons together to predict transcript structures, has
been developed for this purpose [10]. Alternatively,
Bayesian models of probe responses that are trained using
probe signals for known full-length transcripts may be used
to predict likely transcript structures for hypothetical genes
or novel transcripts in intergenic regions (Mockler and
Ecker, unpublished). However, problems such as nonuni-
form probe responses due to varying probe affinities are
likely to confound such ad hoc solutions.
Another key challenge involves the validation of possible
bparadigm-shiftingQ discoveries made through experiments
using tiling arrays. Comparison of results using different
model organisms (e.g., bacteria, yeast, flies, worms,
mammals, and plants) and data obtained using experimental
approaches (e.g., MPSS [114–117], SAGE [118,119]), chip
designs, and analytical methods will be needed. At present,
discoveries made using tiling array technology require
confirmation with more conventional methods such as
directed RT-PCR, cloning, and sequencing. However,
rapid-prototyping technologies for chip design and manu-
facture such as so-called bmasklessQ photolithography
technology [5–7] may make it possible to validate quickly
findings made using one chip design with a completely new
chip design.
Note added in proof
Since the final revision of this article was accepted,
transcriptome maps generated using tiling arrays manufac-
tured by maskless photolithography were published for
Drosophila melanogaster (Stolc, V., Gauhar, Z., Mason, C.,
Halasz, G., van Batenburg, M.F., Rifkin, S.A., Hua, S.,
Herreman, T., Tongprasit, W., Barbano, P.E., Bussemaker,
H.J., White, K.P., 2004. A gene expression map for the
euchromatic genome of Drosophila melanogaster. Science
306, 655–660) and for humans (Bertone, P., Stolc, V.,
Royce, T.E., Rozowsky, J.S., Urban, A.E., Zhu, X.,
Tongprasit, W., Samanta, M., Weissman, S., Gerstein, M.,
Snyder, M. 2004. Global identification of human transcribed
sequences with genome tiling arrays. Science Express
Reports, published online November 11, 2004; 10.1126/
science.1103388).
Acknowledgments
We thank Jennifer L. Nemhauser, Justin Borevitz, and
Todd P. Michael for critically reading the manuscript; Pam
Surko for helpful discussions and valuable insights; Joanne
Chory for advice and support; Huaming Chen for the data
and analysis shown in Fig. 3; T. Gingeras for sharing
unpublished data; and an anonymous reviewer for making
constructive comments. T.C.M. is an NIH Postdoctoral
Fellow (F32 GM69090). This work was supported by
grants from the National Science Foundation 2010
Program and the National Institutes of Health ENCODE
Program to J.R.E.
References
[1] S.P. Fodor, et al., Light-directed, spatially addressable parallel
chemical synthesis, Science 251 (1991) 767–773.
[2] A.C. Pease, et al., Light-generated oligonucleotide arrays for rapid
DNA sequence analysis, Proc. Natl. Acad. Sci. USA 91 (1994)
5022–5026.
[3] E.M. Southern, U. Maskos, J.K. Elder, Analyzing and comparing
nucleic acid sequences by hybridization to arrays of oligonucleo-
tides: evaluation using experimental models, Genomics 13 (1992)
1008–1017.
T.C. Mockler, J.R. Ecker / Genomics 85 (2005) 1–15 13
[4] T.R. Hughes, et al., Expression profiling using microarrays
fabricated by an ink-jet oligonucleotide synthesizer, Nat. Biotechnol.
19 (2001) 342–347.
[5] K.J. Luebke, R.P. Balog, D. Mittelman, H.R. Garner, Digital
optical chemistry: a novel system for the rapid fabrication of
custom oligonucleotide arrays, in: R. Kordal, A. Usmani, W.T.
Law (Eds.), Microfabricated Sensors, Application of Optical
Technology for DNA Analysis, Am. Chem. Soc. Washington,
DC, 2002.
[6] E.F. Nuwaysir, et al., Gene expression analysis using oligonucleotide
arrays produced by maskless photolithography, Genome Res. 12
(2002) 1749–1755.
[7] S. Singh-Gasson, et al., Maskless fabrication of light-directed
oligonucleotide microarrays using a digital micromirror array, Nat.
Biotechnol. 17 (1999) 974–978.
[8] S. Cawley, et al., Unbiased mapping of transcription factor binding
sites along human chromosomes 21 and 22 points to widespread
regulation of noncoding RNAs, Cell 116 (2004) 499–509.
[9] P. Kapranov, et al., Large-scale transcriptional activity in chromo-
somes 21 and 22, Science 296 (2002) 916–919.
[10] D. Kampa, et al., Novel RNAs identified from an in-depth analysis
of the transcriptome of human chromosomes 21 and 22, Genome
Res. 14 (2004) 331–342.
[11] K. Yamada, et al., Empirical analysis of transcriptional activity in the
Arabidopsis genome, Science 302 (2003) 842–846.
[12] J.M. Johnson, et al., Genome-wide survey of human alternative pre-
mRNA splicing with exon junction microarrays, Science 302 (2003)
2141–2144.
[13] D.D. Shoemaker, et al., Experimental annotation of the human
genome using microarray technology, Nature 409 (2001) 922–927.
[14] B.J. Haas, et al., Full-length messenger RNA sequences
greatly improve genome annotation, Genome Biol. 3 (2002)
research0029.1– research0029.12.
[15] Y. Okazaki, et al., Analysis of the mouse transcriptome based on
functional annotation of 60,770 full-length cDNAs, Nature 420
(2002) 563–573.
[16] T. Ota, et al., Complete sequencing and characterization of 21,243
full-length human cDNAs, Nat. Genet. 36 (2004) 40–45.
[17] M. Seki, et al., Functional annotation of a full-length Arabidopsis
cDNA collection, Science 296 (2002) 141–145.
[18] J.L. Rinn, et al., The transcriptional activity of human chromosome
22, Genes Dev. 17 (2003) 529–540.
[19] J.S. Mattick, RNA regulation: a new genetics? Nat. Rev. Genet. 5
(2004) 316–323.
[20] R. Knee, P.R. Murphy, Regulation of gene expression by natural
antisense RNA transcripts, Neurochem. Int. 31 (1997) 379–392.
[21] G. Lavorgna, et al., In search of antisense, Trends Biochem. Sci. 29
(2004) 88–94.
[22] C. Vanhee-Brossollet, C. Vaquero, Do natural antisense transcripts
make sense in eukaryotes? Gene 211 (1998) 1–9.
[23] N. Osato, et al., Antisense transcripts with rice full-length cDNAs,
Genome Biol. 5 (2003) R5.
[24] R. Yelin, et al., Widespread occurrence of antisense transcription in
the human genome, Nat. Biotechnol. 21 (2003) 379–386.
[25] J. Shendure, G.M. Church, Computational discovery of sense–
antisense transcription in the human and mouse genomes, Genome
Biol. 3 (2002) research0044.1–research0044.14.
[26] B. Lehner, et al., Antisense transcripts in the human genome, Trends
Genet. 18 (2002) 63–65.
[27] H. Kiyosawa, et al., Antisense transcripts with FANTOM2 clone set
and their implications for gene regulation, Genome Res. 13 (2003)
1324–1334.
[28] J. Chen, et al., Over 20% of human transcripts might form sense–
antisense pairs, Nucleic Acids Res. 32 (2004) 4812–4820.
[29] K.G. Le Roch, et al., Discovery of gene function by expression
profiling of the malaria parasite life cycle, Science 301 (2003)
1503–1508.
[30] D.L. Black, Mechanisms of alternative pre-messenger RNA splicing,
Annu. Rev. Biochem. 72 (2003) 291–336.
[31] B.R. Graveley, Alternative splicing: increasing diversity in the
proteomic world, Trends Genet. 17 (2001) 100–107.
[32] B.R. Graveley, Sex, AGility, and the regulation of alternative
splicing, Cell 109 (2002) 409–412.
[33] R. Sorek, M. Amitai, Piecing together the significance of splicing,
Nat. Biotechnol. 19 (2001) 196.
[34] A.N. Ladd, T.A. Cooper, Finding signals that regulate alternative
splicing in the post-genomic era, Genome Biol. 3 (2002)
reviews0008.1–reviews0008.16.
[35] M. Zavolan, et al., Impact of alternative initiation, splicing, and
termination on the diversity of the mRNA transcripts encoded by the
mouse transcriptome, Genome Res. 13 (2003) 1290–1300.
[36] B. Modrek, C. Lee, A genomic view of alternative splicing, Nat.
Genet. 30 (2002) 13–19.
[37] B.J. Haas, et al., Improving the Arabidopsis genome annotation
using maximal transcript alignment assemblies, Nucleic Acids Res.
31 (2003) 5654–5666.
[38] S. Gupta, et al., Genome wide identification and classification of
alternative splicing based on EST data, Bioinformatics 20 (2004)
2579–2585.
[39] T.A. Clark, C.W. Sugnet, M. Ares Jr., Genomewide analysis of
mRNA processing in yeast using splicing-specific microarrays,
Science 296 (2002) 907–910.
[40] J. Castle, et al., Optimization of oligonucleotide arrays and RNA
amplification protocols for analysis of transcript structure and
alternative splicing, Genome Biol. 4 (2003) R66.
[41] R. Sorek, R. Shamir, G. Ast, How prevalent is functional alternative
splicing in the human genome? Trends Genet. 20 (2004) 68–71.
[42] V. Anantharaman, E.V. Koonin, L. Aravind, Comparative genomics
and evolution of proteins involved in RNA metabolism, Nucleic
Acids Res. 30 (2002) 1427–1464.
[43] G. Dreyfuss, V.N. Kim, N. Kataoka, Messenger-RNA-binding
proteins and the messages they carry, Nat. Rev. Mol. Cell. Biol. 3
(2002) 195–205.
[44] V. Brown, et al., Microarray identification of FMRP-associated brain
mRNAs and altered mRNA translational profiles in fragile X
syndrome, Cell 107 (2001) 477–487.
[45] A.P. Gerber, D. Herschlag, P.O. Brown, Extensive association of
functionally and cytotopically related mRNAs with Puf family RNA-
binding proteins in yeast, PLoS Biol. 2 (2004) E79.
[46] H. Hieronymus, P.A. Silver, Genome-wide analysis of RNA–protein
interactions illustrates specificity of the mRNA export machinery,
Nat. Genet. 33 (2003) 155–161.
[47] A.M. Li, A. Watson, J.L. Fridovich-Keil, Scp160p associates with
specific mRNAs in yeast, Nucleic Acids Res. 31 (2003) 1830–1837.
[48] K.A. Shepard, et al., Widespread cytoplasmic mRNA transport in
yeast: identification of 22 bud-localized transcripts using DNA
microarray analysis, Proc. Natl. Acad. Sci. USA 100 (2003)
11429–11434.
[49] S.A. Tenenbaum, et al., Ribonomics: identifying mRNA subsets in
mRNP complexes using antibodies to RNA-binding proteins and
genomic arrays, Methods 26 (2002) 191–198.
[50] S.A. Waggoner, S.A. Liebhaber, Identification of mRNAs associated
with alphaCP2-containing RNP complexes, Mol. Cell. Biol. 23
(2003) 7055–7067.
[51] J. Ule, et al., CLIP identifies Nova-regulated RNA networks in the
brain, Science 302 (2003) 1212–1215.
[52] D.S. Bernstein, et al., Analyzing mRNA–protein complexes using a
yeast three-hybrid system, Methods 26 (2002) 123–141.
[53] J.A. Martens, L. Laprade, F. Winston, Intergenic transcription is
required to repress the Saccharomyces cerevisiae SER3 gene, Nature
429 (2004) 571–574.
[54] N.V. Taverner, J.C. Smith, F.C. Wardle, Identifying transcriptional
targets, Genome Biol. 5 (2004) 210.
[55] M.J. Buck, J.D. Lieb, ChIP-chip: considerations for the design,

T.C. Mockler, J.R. Ecker / Genomics 85 (2005) 1–1514
analysis, and application of genome-wide chromatin immunopreci-
pitation experiments, Genomics 83 (2004) 349–360.
[56] C.E. Horak, et al., Complex transcriptional circuitry at the G1/S
transition in Saccharomyces cerevisiae, Genes Dev. 16 (2002)
3017–3033.
[57] V.R. Iyer, et al., Genomic binding sites of the yeast cell-cycle
transcription factors SBF and MBF, Nature 409 (2001) 533–538.
[58] T.I. Lee, et al., Transcriptional regulatory networks in Saccharomy-
ces cerevisiae, Science 298 (2002) 799–804.
[59] H.H. Ng, et al., Genome-wide location and regulated recruitment of
the RSC nucleosome-remodeling complex, Genes Dev. 16 (2002)
806–819.
[60] B. Ren, et al., Genome-wide location and function of DNA binding
proteins, Science 290 (2000) 2306–2309.
[61] I. Simon, et al., Serial regulation of transcriptional regulators in the
yeast cell cycle, Cell 106 (2001) 697–708.
[62] J. Zeitlinger, et al., Program-specific distribution of a transcription
factor dependent on partner transcription factor and MAPK signal-
ing, Cell 113 (2003) 395–404.
[63] R. Martone, et al., Distribution of NF-kappaB-binding sites across
human chromosome 22, Proc. Natl. Acad. Sci. USA 100 (2003)
12247–12252.
[64] D.Y. Mao, et al., Analysis of Myc bound loci identified by CpG
island arrays shows that Max is essential for Myc-dependent
repression, Curr. Biol. 13 (2003) 882–886.
[65] B. Ren, et al., E2F integrates cell cycle progression with DNA
repair, replication, and G(2)/M checkpoints, Genes Dev. 16 (2002)
245–256.
[66] A.S. Weinmann, et al., Isolating human transcription factor targets by
coupling chromatin immunoprecipitation and CpG island microarray
analysis, Genes Dev. 16 (2002) 235–244.
[67] A. Morillon, et al., Regulation of elongating RNA polymerase II by
forkhead transcription factors in yeast, Science 300 (2003) 492–495.
[68] G. Euskirchen, et al., CREB binds to multiple loci on human
chromosome 22, Mol. Cell. Biol. 24 (2004) 3804–3814.
[69] S.I. Grewal, D. Moazed, Heterochromatin and epigenetic control of
gene expression, Science 301 (2003) 798–802.
[70] R.A. Martienssen, V. Colot, DNA methylation and epigenetic
inheritance in plants and filamentous fungi, Science 293 (2001)
1070–1074.
[71] J.A. Yoder, C.P. Walsh, T.H. Bestor, Cytosine methylation and the
ecology of intragenomic parasites, Trends Genet. 13 (1997) 335–340.
[72] R. Martienssen, Transposons, DNA methylation and gene control,
Trends Genet. 14 (1998) 263–264.
[73] P.A. Jones, D. Takai, The role of DNA methylation in mammalian
epigenetics, Science 293 (2001) 1068–1070.
[74] C. Beard, E. Li, R. Jaenisch, Loss of methylation activates Xist
in somatic but not in embryonic cells, Genes Dev. 9 (1995)
2325–2334.
[75] J.G. Herman, S.B. Baylin, Gene silencing in cancer in association with
promoter hypermethylation, N. Engl. J. Med. 349 (2003) 2042–2054.
[76] P.W. Laird, R. Jaenisch, The role of DNA methylation in cancer
genetic and epigenetics, Annu. Rev. Genet. 30 (1996) 441–464.
[77] N. Kunert, et al., A Dnmt2-like protein mediates DNA methylation
in Drosophila, Development 130 (2003) 5083–5090.
[78] M. Frommer, et al., A genomic sequencing protocol that yields a
positive display of 5-methylcytosine residues in individual DNA
strands, Proc. Natl. Acad. Sci. USA 89 (1992) 1827–1831.
[79] R. Tompa, et al., Genome-wide profiling of DNA methylation
reveals transposon targets of CHROMOMETHYLASE3, Curr. Biol.
12 (2002) 65–68.
[80] S. Luo, D. Preuss, Strand-biased DNA methylation associated with
centromeric regions in Arabidopsis, Proc. Natl. Acad. Sci. USA 100
(2003) 11133–11138.
[81] X. Nan, R.R. Meehan, A. Bird, Dissection of the methyl-CpG
binding domain from the chromosomal protein MeCP2, Nucleic
Acids Res. 21 (1993) 4886–4892.
[82] S.H. Cross, et al., Purification of CpG islands using a methylated
DNA binding column, Nat. Genet. 6 (1994) 236–244.
[83] E.U. Selker, et al., The methylated component of the Neurospora
crassa genome, Nature 422 (2003) 893–897.
[84] D. Pinkel, et al., High resolution analysis of DNA copy number
variation using comparative genomic hybridization to microarrays,
Nat. Genet. 20 (1998) 207–211.
[85] J.R. Pollack, et al., Genome-wide analysis of DNA copy-number
changes using cDNA microarrays, Nat. Genet. 23 (1999) 41–46.
[86] A.S. Ishkanian, et al., A tiling resolution DNA microarray with
complete coverage of the human genome, Nat. Genet. 36 (2004)
299–303.
[87] G.R. Bignell, et al., High-resolution analysis of DNA copy
number using oligonucleotide microarrays, Genome Res. 14
(2004) 287–295.
[88] E.A. Winzeler, et al., Genetic diversity in yeast assessed with whole-
genome oligonucleotide arrays, Genetics 163 (2003) 79–89.
[89] J.O. Borevitz, et al., Large-scale identification of single-feature
polymorphisms in complex genomes, Genome Res. 13 (2003)
513–523.
[90] J.G. Hacia, Resequencing and mutational analysis using oligonu-
cleotide microarrays, Nat. Genet. 21 (Suppl. 1) (1999) 42–47.
[91] K.A. Frazer, et al., Evolutionarily conserved sequences on human
chromosome 21, Genome Res. 11 (2001) 1651–1659.
[92] N. Patil, et al., Blocks of limited haplotype diversity revealed by
high-resolution scanning of human chromosome 21, Science 294
(2001) 1719–1723.
[93] C.W. Wong, et al., Tracking the evolution of the SARS coronavirus
using high-throughput, high-density resequencing arrays, Genome
Res. 14 (2004) 398–405.
[94] D.J. Lockhart, et al., Expression monitoring by hybridization to
high-density oligonucleotide arrays, Nat. Biotechnol. 14 (1996)
1675–1680.
[95] R. Mei, et al., Probe selection for high-density oligonucleotide
arrays, Proc. Natl. Acad. Sci. USA 100 (2003) 11237–11242.
[96] H.T. Allawi, J. SantaLucia Jr., Thermodynamics and NMR of
internal G.T mismatches in DNA, Biochemistry 36 (1997)
10581–10594.
[97] H.T. Allawi, J. SantaLucia Jr., Thermodynamics of internal C.T
mismatches in DNA, Nucleic Acids Res. 26 (1998) 2694–2701.
[98] H.T. Allawi, J. SantaLucia Jr., Nearest-neighbor thermodynamics of
internal A.C mismatches in DNA: sequence dependence and pH
effects, Biochemistry 37 (1998) 9435–9444.
[99] H.T. Allawi, J. SantaLucia Jr., Nearest neighbor thermodynamic
parameters for internal G.A mismatches in DNA, Biochemistry 37
(1998) 2170–2179.
[100] H.T. Allawi, J. SantaLucia Jr., NMR solution structure of a DNA
dodecamer containing single G.T mismatches, Nucleic Acids Res. 26
(1998) 4925–4934.
[101] S. Bommarito, N. Peyret, J. SantaLucia Jr., Thermodynamic
parameters for DNA sequences with dangling ends, Nucleic Acids
Res. 28 (2000) 1929–1934.
[102] N. Sugimoto, et al., Improved thermodynamic parameters and helix
initiation factor to predict stability of DNA duplexes, Nucleic Acids
Res. 24 (1996) 4501–4505.
[103] L. Zhang, M.F. Miles, K.D. Aldape, A model of molecular
interactions on short oligonucleotide microarrays, Nat. Biotechnol.
21 (2003) 818–821.
[104] D. Hekstra, et al., Absolute mRNA concentrations from sequence-
specific calibration of oligonucleotide arrays, Nucleic Acids Res. 31
(2003) 1962–1968.
[105] F. Naef, et al., Empirical characterization of the expression ratio
noise structure in high-density oligonucleotide arrays, Genome Biol.
3 (2002) research0018.1–research0018.11.
[106] F. Naef, et al., DNA hybridization to mismatched templates: a chip
study, Phys. Rev. E: Stat. Nonlinear Soft Matter Phys. 65 (4 Pt. 1)
(2002) 040902-1–04092-4.
T.C. Mockler, J.R. Ecker / Genomics 85 (2005) 1–15 15
[107] Z. Wu, R.A. Irizarry, Stochastic models inspired by hybridization
theory for short oligonucleotide arrays, RECOMB 2004, Associ-
ation for Computing Machinery, 2004.
[108] R.A. Irizarry, et al., Exploration, normalization, and summaries of
high density oligonucleotide array probe level data, Biostatistics 4
(2003) 249–264.
[109] Z. Wu, R.A. Irizarry, Preprocessing of oligonucleotide array data,
Nat. Biotechnol. 22 (2004) 656–658.
[110] B.M. Bolstad, Low level analysis of high-density oligonucleotide
array data: background, normalization and summarization, Biosta-
tistics, Univ. of California, Berkeley, 2004.
[111] N. Volfovsky, B.J. Haas, S.L. Salzberg, Computational discovery of
internal micro-exons, Genome Res. 13 (6A) (2003) 1216–1221.
[112] T. Kuwabara, et al., A small modulatory dsRNA specifies the fate of
adult neural stem cells, Cell 116 (2004) 779–793.
[113] J.S. Mattick, Challenging the dogma: the hidden layer of non-
protein-coding RNAs in complex organisms, Bioessays 25 (2003)
930–939.
[114] B.C. Meyers, et al., The use of MPSS for whole-genome transcrip-
tional analysis in Arabidopsis, Genome Res. 14 (2004) 1641–1653.
[115] B.C. Meyers, et al., Analysis of the transcriptional complexity of
Arabidopsis thaliana by massively parallel signature sequencing,
Nat. Biotechnol. 22 (2004) 1006–1011.
[116] S. Brenner, et al., Gene expression analysis by massively parallel
signature sequencing (MPSS) on microbead arrays, Nat. Biotechnol.
18 (2000) 630–634.
[117] B.C. Meyers, et al., Arabidopsis MPSS: an online resource for
quantitative expression analysis, Plant Physiol. 135 (2004) 801–813.
[118] K.R. Boheler, M.D. Stern, The new role of SAGE in gene discovery,
Trends Biotechnol. (2003) 55–57 (Discussion 57-58).
[119] V.E. Velculescu, B. Vogelstein, K.W. Kinzler, Analysing uncharted
transcriptomes with SAGE, Trends Genet. 16 (2000) 423–425.