applications of computer mapping to police operations
TRANSCRIPT

APPLICATIONS OF COMPUTER
MAPPING TO POLICE OPERATIONS
by
J. Thomas McEwenInstitute for Law and Justice
and
Faye S. TaxmanUniversity of Maryland, College Park
Abstract: Computer mapping is a rapidly developing technique that canassist police departments in a variety of ways. Computer mapping tech-niques can be classified into three general categories: descriptive, analyticaland interactive mapping. Descriptive mapping shows data in a pin map orshaded area format. Analytical mapping starts with analysis of data fol-lowed by automatically displaying the results on a map. such as theidentification and display of crime "hot spots" in a city. Interactive mappingallows a user to cycle through a series of steps starting with making queriesagainst a database, mapping the results, making a decision from the mapsand starting anew with another query. This chapter provides examples ofeach type, with emphasis on how computer mapping can assist policeoperations. The final sections discuss the steps necessary to establish acomputer mapping system, and what we can expect in the future.
Computerized mapping is a rapidly developing technology that assistspolice departments in strategic planning, operations and crime analysis.In this chapter, we explore the benefits of computerized mapping bydescribing a variety of applications for police departments. These applica-tions range from the production of simple pin maps to interactive mappingfor geographical analysis.
This chapter has four major sections. First, an overview of the evolutionof mapping technology in the law enforcement field is presented. Second,several mapping techniques used by law enforcement agencies are dis-
Address correspondence to: Thomas McEwen, Institute for Law and Justice, 1018Duke Street, Alexandria, VA 22314.
259

260 J. Thomas McEwen and Fays S. Taxman
cussed. Examples are provided from police department analysts, geogra-phers, researchers and others involved in analyzing police data. Third, theprocess for developing an automated mapping system is discussed. Thefinal section argues that the capabilities afforded by mapping technologieshave several implications for future strategies and tactics of police depart-ments.
AN OVERVIEW OF COMPUTER MAPPING IN LAWENFORCEMENT
Automated or computerized mapping has a history of only about 25years, although manual pin maps of crime, traffic accidents and otherpolice events have a longer history. Early applications of automated crimemapping (Pauly et al.. 1967; Carnaghi and McEwen. 1970) showed thepotential for automated visual representations of crime and traffic acci-dents. Later publications on crime analysis strongly advocated geographicanalysis of crime (Chang et al., 1979; Buck et al., 1973), and illustratedpractical applications of geographic analysis (Brantingham andBrantingham, 1981; Harries, 1974; Pyle, 1974; LeBeau, 1987).
More recent efforts expand mapping into new areas. Of particularrelevance is the work on "hot spots," which demonstrates the concentra-tion of activities in certain geographical areas (Spelman, 1988; Shermanet al., 1989; Sherman and Weisburd. 1989; Maltz et al., 1990; Green,1993; Block, 1993). Sherman et al. (1989) examined the concentration ofpolice calls and found that calls for predatory crime occur in a few hotspots. Spring and Block (1987) confirmed the importance of geographyand crime. As noted by Block (1993:34), mapping allows for the explora-tions of the "high vulnerability of some neighborhoods or demographicgroups" and crime events. It thus contributes to an increased understand-ing of how certain environments contribute to criminality.
Further advances in the use of mapping have involved the examinationof the clustering of specific forms of criminal behavior in different sites.Major advances are summarized by Weisburd et al. (1991) and by Block(1993). Computer mapping techniques allow for the examination of thespatial relationships among the specific addresses of criminal activity. Forexample, Weisburd and his colleagues (1991) analyzed one year of policecalls-for-service data in Minneapolis, MN in order to identify addresses ofcrime events. They found that 5,538 addresses (out of 115,000) accountedfor 20 or more "serious" crime calls in a year. Mapping and site observa-tions assisted in clustering the addresses into 365 hot spots of crime,

Applications of Computer Mapping to Police Operations 261
which accounted for 2.5% of the city's street segments or blocks, butnearly 25% of the annual crime.
The Illinois Criminal Justice Authority has developed statistical toolsand procedures for clustering "hot spots" into "hot areas" based on lawenforcement and community information. The advantage of these statis-tical tools is that they summarize and organize information in a usefulmanner. The statistical tools answer the question: "Where are the densestconcentrations of incidents or events on the map?" (Block, 1993:33).
The knowledge that crime is more likely to occur in certain hot spotsor hot areas has resulted in the consideration of places as importantfeatures in understanding crime. Place refers to a geographical areadescribed by certain salient features: location, boundaries, function,control and size. In his study of places, Eck (1994) illustrates how placecharacteristics might account for or contribute to criminal activity. Theconcept of place is an important factor in understanding hot spots. Forexample, in a special study of robberies in San Diego, CA, analystsdetermined that robberies clustered in two different areas. In the midst ofeach area was a convenience store; the robberies were clustered aroundthese places in the neighborhood. By analyzing places, it is possible tobegin to address the question of why events occur in certain areas. Forlaw enforcement agencies, the ability to map places and events can assistin understanding the relationships between crime and geographical fea-tures in an area.
Three trends have spurred the growth and interest in automatedmapping in recent years. One trend is related to the microcomputerrevolution over the last ten years, in which the capabilities of microcom-puters have improved while costs have simultaneously decreased.Desktop microcomputers now have the computing and storage power oflarge mainframe computers that once filled entire (air-conditioned) rooms.Coupled with these hardware improvements, the second trend has beenimproved software mapping packages, such as Maplnfo for Windows1 andArclnfo. These packages facilitate automated mapping by providing a setof menus for the various tasks involved in making a map. The combinationof faster microcomputers and mapping packages has provided policedepartments with new capabilities for compiling and analyzing data.
Improved computer resources are driving the final trend of improvedgeographic base files. An essential element of any automated mappingsystem is an accurate and complete geographic base file for convertingstreet addresses to two-dimensional coordinates (x/y coordinates). Manylocal governments have now devoted funds and personnel to developgeographic base files (commonly called geobase files) to support mapping,not only for police departments but for other agencies such as fire, human

262 J. Thomas McEwen and Faye S. Taxman
services and transportation. Accurate geobase files are a valuable resourceand have contributed to the growth in mapping. A second change centerson improved capabilities for transferring data from one system to another.It is now easier to merge databases into a single system so that maps ofdifferent types of data are possible. The result is a more complete pictureof relationships among events, especially their geographical relationships.
The effects of these changes can be seen in many police departments.For example, each precinct in the Los Angeles, CA Police Department hasa crime analysis unit that includes an analyst capable of using availablemicrocomputer hardware and software. Analysts can download data fromthe department's central record system and analyze the data locallythrough a graphical user interface package. The interface package in-cludes an inquiry capability to ask questions about crime in the precinct.Results of the inquiries can be shown as a pin map on the computer screenand can be printed. At the San Diego, CA Police Department, a centralizedunit of crime analysts draws on data maintained in a drug informationnetwork system. This network accesses several different databases suchas crime records, computer-aided dispatch data on drug complaints,citizen reports of drug dealing reported directly to the narcotics section,patrol intelligence data and other drug-related data. Analysts merge datafrom these systems into a geographical mapping package. The maps andsupporting information sources are available to patrol officers and mem-bers of the narcotics unit. A third example is from the Dallas, TX, PoliceDepartment, which has merged census data into its record managementsystem. Maps have been produced showing the relationships amongviolent crimes, drug trafficking areas and demographic characteristics ofthe city.
COMPUTER MAPPING TECHNIQUES
Computer mapping techniques can be divided into three broad catego-ries: descriptive, analytical and interactive mapping. Descriptive mapping,the most basic type of automated map, shows crimes, calls for service,traffic accidents, and other data in a pin map or shaded area format. Twoor more different types of events can be displayed to provide a completepicture of the problem. Analytical mapping starts with analysis of data,with the results displayed on the map. Identifying crime hot spots is aprimary example of analytical mapping. Other examples involve specialstudies to apply statistical analysis techniques to spatial data and displaythe results in an automated map. Finally, interactive mapping allows auser to cycle through a series of steps to make queries against a database,map the results, make a decision on the basis of the maps and start anew

Applications of Computer Mapping to Police Operations 263
through the cycle. Interactive mapping extends the capabilities of lawenforcement agency by moving into continuous assessment and evalua-tion of information.
Descriptive Mapping
Police departments deal with a variety of address-specific data such ascrimes, computer-aided dispatch records, arrests, traffic accidents, drugdealing locations, patrol observations, field interrogation records andothers. A basic function of any automated mapping system is to replicatethe pin maps that police departments have been using for many years.Automated maps are similar to pin maps in that data from variousinformation sources are plotted. Individual symbols (like different colorsof pinheads) are used for each type of event.
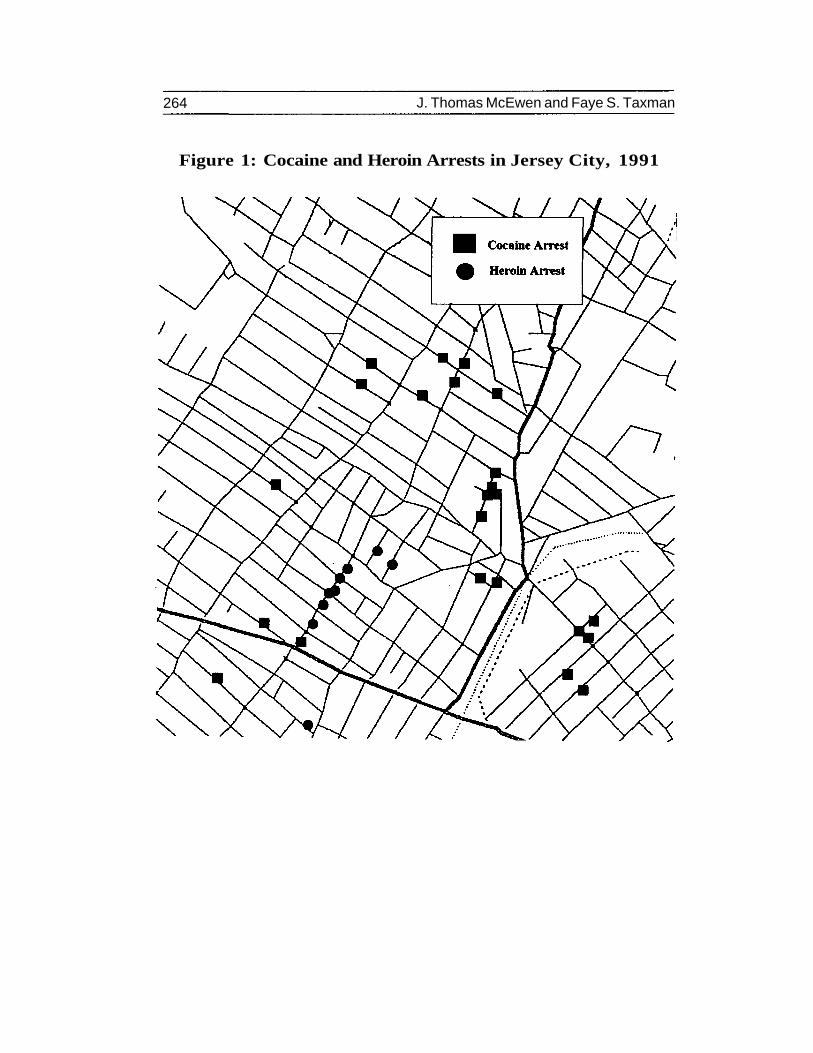
Figure 1 shows a map developed by the Jersey City, NJ Police Depart-ment for one area of the city. The map illustrates cocaine arrests (shownas boxes) and heroin arrests (circles) for 1991. It shows that cocaine andheroin are generally sold in different areas of the city. Cocaine is morepervasive since arrests occur in several locations, whereas heroin is morelikely to occur along major thoroughfares. The Jersey City Drug MarketAnalysis project, in fact, found that the major artery and intersectionswere the main distribution points. This has implications for different policestrategies designed to eradicate drug market activities. Since heroinpoints of sale are different from cocaine, the police can use this informa-tion to develop and implement different enforcement strategies (Weisburdand Green, 1993).
Figure 2 is a shaded, or choroplethic, map from the San Diego PoliceDepartment showing domestic violence calls for service per thousandpopulation. The more heavily striped areas indicate higher rates of domes-tic violence calls. The map clearly shows higher rates of domestic violencecalls in the southern part of the city. The department used the informationto develop a strategic plan for dealing with domestic violence in these highrate areas. The plan includes different police responses in high incidenceareas due to the concentration of events.
Finally, Figure 3 illustrates the use of places in descriptive mappingtechniques. The map shows the relationship between places (e.g., conve-nience stores) and store robberies in San Diego in a six-month period. Asshown in the map, the robberies tend to cluster around the conveniencestores. Few robberies occur outside of the surrounding areas. This maphighlights the importance of places in understanding crime events. By
264 J. Thomas McEwen and Faye S. Taxman
Figure 1: Cocaine and Heroin Arrests in Jersey City, 1991

Applications of Computer Mapping to Police Operations 265

266 J. Thomas McEwen and Faye S. Taxman
Figure 3: Convenience Store Robbery Clusters in San Diego

Applications of Computer Mapping to Police Operations 267
showing the location of the "key places" in the community, it is possibleto illustrate how crimes are spatially related to place features.
Police departments can use descriptive maps to examine displacementeffects resulting from a particular law enforcement strategy. For example,a "before" map will show the frequency of crime activities prior to anenforcement effort, and an "after" map of the same area will show theeffects of the enforcement. The map may then visually show decreases inthe area receiving the enforcement and movement of crime to surroundingareas.
The primary advantages of descriptive maps are that they are easy toproduce and easy to understand. Large amounts of data can be turnedinto useful informational maps that benefit personnel at all levels of thedepartment. For senior police administrators, the maps provide easilyunderstood graphical presentations for elected officials and citizen groups.They also assist in developing responses to crime problems. For patrolofficers, descriptive maps provide a much better format for seeing crimepatterns than reviewing written reports.
These examples also illustrate an important feature of descriptivemapping—the ability to control the size of the geographic area underscrutiny through the mapping software. Maps can cover an entire juris-diction or smaller areas. The user selects the geographic area desired byeither selecting a predefined area (such as a precinct, reporting area orcensus tract) from a menu or by "zooming in" on an area of the city. Thearea of interest can literally range from a single block to an entirejurisdiction. This is important because it provides flexibility in examiningthe events of interest.
With descriptive mapping, it is possible to display the locations ofdifferent types of events such as drug markets that specialize in certainproducts (e.g., heroin, cocaine, marijuana, etc.) or robberies of differenttypes of stores (e.g., gas stations, fast food chains, etc.). Descriptivemapping provides the ability to look at groupings of events in an easiermanner than manual pin maps. These groupings of types of events areuseful to detect trends or patterns. Further, the maps indicate thefrequency or counts of events occurring in a given area in more detail thanmanual pin maps. Police departments can include this information in theirinternal bulletins describing crime problems. The bulletins can includeboth a map indicating the locations of the offenses and a list of commoncharacteristics of the crimes. An officer needs to spend only a few minuteswith these bulletins to understand where and how the crimes are occur-ring.
While descriptive maps are useful, they suffer from three potentialproblems. One is that it may not be easy to discern a pattern of crimes by

268 J. Thomas McEwen and Faye S. Taxman
looking at a pin map. This is true regardless of whether the pin map hasbeen manually developed or is an automated map. Two viewers of the samepin map may identify different "patterns" of crimes.
A second problem centers on the difference between an address and alocation. An address, such as an apartment or mobile home complex,contains many locations. As an example, the Tempe, AZ Police Departmentfollows the same procedure as many other departments in producingmonthly tabulations on locations with repeat calls for service. During1993, one address had 496 calls for service including 40 family fights, 37loud noise calls, 29 suspicious vehicle/person calls, 24 missing personsand 16 juvenile disturbance calls. The address is, in fact, a mobile homepark with 370 units. A pin map will show this address as one large problemwhen it really consists of several small problems.
Finally, shaded maps sometimes are misleading from what is calledthe "boundary" problem. Shaded maps show distinct geographic areas,such as precincts, census tracts or reporting areas. An event on a borderstreet between two areas is placed in one or the other area based on whichside of the street it occurred. An event at an intersection of four areaspresents an even greater classification problem. The consequence of theboundary problem is that patterns are lost as the volumes of events aredistorted.
Analytical Mapping
Analytical mapping conveys data analysis results rather than merelymapping the individual data points. Analytical maps advance the ideasbehind descriptive maps by including information that is helpful inunderstanding the trends or patterns of events. They require analyzingthe data first, then mapping the results. Two examples will be discussedto illustrate analytical mapping and how it has been used by policedepartments:
• Results of an analysis of gang-related violent crimes using the STAC(Spatial and Temporal Analysis of Crime) package developed by theIllinois Criminal Justice Information Authority through grants from theU.S. Bureau of Justice Assistance and,
• A spousal abuse study conducted by the Baltimore County, MD PoliceDepartment, which used mapping to identify potential areas of under-reporting.

As described in the Illinois Criminal Justice Information Authority(1993):
• STAC contains both a Time Analyzer and the STAC/space modules,which is a toolbox for analyzing the distribution of events on a map.STAC/Space includes automatic searches for two kinds of Hot SpotAreas (Hot Spot Ellipse and Isocrime), and also Nearest NeighborAnalysis (a test of significance for clustering), Mean Center, and radialsearches for events occurring around an address or other loca-tion. . .STAC is not a mapping package, but a toolbox of spatial statisticsthat is used to interpret your mapped data and turn the data intoinformation for crime analysis and problem solving. After STAC calcu-lates statistical summaries of the data's spatial distribution, such asHot Spot Area Ellipses or Isocrimes, users can map these summariesusing a mapping package [pp. 1-2).
STAC contains analytical and visual procedures that are useful to detectpatterns. One such procedure is the Hot Spot Ellipse, which analyzes theactual geographical scatter of events and delineates areas with the densestclusters of actual events. The procedure writes the results to a file, whichcan be accessed by a mapping program to show the actual data and ellipsessurrounding the concentrations of events. Figure 4 is an example showingstreet-gang-related violent crime for one police area of the Chicago PoliceDepartment. Three hot spots are shown on the map, as identified by theHot Spot Ellipses procedure. These hot spots average about 40 incidentsper square mile and are the highest concentrations of incidents in themapped area.
With STAC, the Chicago Police Department, the Illinois CriminalJustice Information Authority and other agencies have developed an earlywarning system for violence. The system is designed to identify areas thatare "at high risk for a surge in serious street-gang violence and homicidein time to save lives" (Illinois Criminal Justice Information Authority,1993:5). Particular focus is on gang-related violent crime, as displayed inFigure 4, and other confrontation situations such as spousal arguments,fights between acquaintances, sexual assaults and robberies. With theknowledge of troubled areas, law enforcement departments can developappropriate responses.
One such response is the Gang Violence Reduction Project, whichprovides community mobilization and social opportunities to gang mem-bers. This project involves a five-member gang outreach team that offersmediation and crisis intervention services to rival gangs in the community.The outreach team also provides referrals to education, job and othersocial service opportunities. Additionally, the Cook County Adult Proba-

270 J. Thomas McEwen and Faye S. Taxman
Figure 4: Street-Gang Related Violent Crime IncidentsKnown to Police in and Around CPD Area Four,
through July 1992, in Chicago

Applications of Computer Mapping to Police Operations 271
tion Department provides intensive supervision services to 150 gangmembers sentenced to probation. In summary, the STAC/Early WarningSystem identifies areas of high gang concentrations, and the interventionproject begins its work with youths in the identified area.
A spouse abuse study by the Baltimore County Police Departmentprovides another example of analytical mapping (Canter, 1990). Thedepartment's study had two objectives:
• Identify locations and areas within the county that were experi-encing high volumes of spousal assault cases, and
• Develop a model that could be used to identify areas where casesmay be occurring but are not reported.
The Spousal Abuse Unit within the police department is responsiblefor conducting follow-up investigations of abuse cases, notifying precinctstations of household in their areas with spouse abuse problems, identi-fying repeat offenders of spouse abuse and coordinating victim assistancewith social agencies in the county. The unit provided data files for thestudy containing incident, victim and offender information on 3,874spouse abuse cases from 1989. The database allowed for the identificationof recurring events, victims and perpetrators. Descriptive mapping tech-niques were employed to satisfy the first objective of providing the unitwith the identification of locations and areas having high volumes ofspousal assault cases.
Our interest in the study, however, is in the second objective ofidentifying geographical areas where domestic violence may be occurring,but are underreported. The approach to this difficult objective was to firstdevelop a multiple regression model relating social and demographicvariables to spousal assaults. Data by census tracts provided the inde-pendent variables for the regression. After development of an adequatemodel, comparisons were made between the number of cases estimatedby the model and the number actually reported to the police for eachcensus tract. Census tracts where predictions were substantially greaterthan actual occurrences were candidates for areas with underreporting.A series of verification steps ensured that these areas did, in fact,experience underreporting. The following paragraphs provide more detailon this modeling approach as an example of analytical mapping.
The spouse assault records were first matched against a geobase fileto determine the census tract for each incident. The number of cases ineach of the 182 census tracts was calculated. Other police departmentand locally available census data were then merged into the aggregated

272 J. Thomas McEwen and Faye S. Taxman
census tract file. Statistical analysis techniques identified three keyvariables related to the number of spouse abuse cases in a census tract:
• Drug-alcohol charges per 100,000 population
• Number of renters in the census tract
• Unemployment rate
The multiple regression analysis revealed that each variable waspositively related to spousal assaults. That is, the number of spousalabuse cases tended to be higher in census tracts with high volumes ofdrug and alcohol arrests, high numbers of renters in the census tract, andhigh unemployment rates. Conversely, the number of cases tended to below in census tracts with low values for these three variables. Theregression model had an adjusted R value of .632, which indicates areasonably good model.
One area of concern, which was not reflected in the favorable R value,was whether the model had deficiencies due to the correlation in thespatial distribution of the cases, a phenomena referred to as spatialautocorrelation. That is, a geographic area with a high value tends to haveneighboring areas with high values, and vice versa. A test known asDacey's test (Norcliffe, 1977) specifically addresses whether spatial auto-correlation exists, and the results of the test, when applied to the regres-sion model, indicated no significant spatial autocorrelation. This result,coupled with the favorable R value, provides good support for saying thatthe regression is a reasonable representation of the levels of spouse abusecases in the census tracts.
To determine the areas of underreporting, the residuals from the modelwere calculated. Figure 5 shows a map of the census tracts with positiveresidual values greater than 30. That is, the model's estimates of spousalabuse events for these census tract were at least 30 cases higher than theactual number of reported cases. The residuals identify five potential areaswhere spousal abuse events are likely to occur more than the reportedevents.
The police analysts reached the important conclusion that these areaswere candidates for underreporting of spouse abuse cases—a conclusionbased on two aspects of the regression model. First, the model estimatedsignificantly higher numbers of cases for these areas as indicated by theresiduals. Second, Dacey's test showed no significant spatial autocorrela-tion. As a consequence, a plausible explanation for the overestimation bythe model is that cases were simply not reported by victims in these areas.This result was supported by interviews of patrol officers assigned to theseareas and follow-up activities by the Spousal Assault Unit. Patrol officers

Applications of Computer Mapping to Police Operations 273
Figure 5: Residuals from Regression Model in BaltimoreCounty: Areas with High Residual Values

274 J. Thomas McEwen and Faye S. Taxman
provided reasons that underreporting could be occurring in these areasbased on their perceptions of the community. The police reported thatmany families in these areas believe the police would not take any actionin their cases. In the large underreported area on the west side of thecounty, the Spousal Assault Unit distributed leaflets advising that spouseabuse was a convictable offense and that the unit was concentrating inthe area. The area subsequently showed an increase in reported cases tothe police.
The analysis assisted in pinpointing areas where spousal assault couldbe a problem. While the analysis may not be entirely conclusive becausethe true amount of underreporting can never be determined, the mapclearly indicates that these target areas are different and need attention.The maps helped the police department develop follow-up techniques thatwere proactive, instead of reactive.
Analytical mapping expands on what can be accomplished with spatialdata. It provides a means of developing models for exploring data trends,particularly geographic trends, and testing hypotheses about underlyingrelationships. Analytical mapping generally requires the development ofspecialized data bases or information sources that can be used to under-stand the trends. It provides the police department with tools to identifypatterns and predict events to guide proactive police strategies. Analyticalmapping therefore integrates the descriptive mapping with other informa-tion that is critical to improving police responses. Analytical mappingusually is preceded by a special study that requires the development ofthe necessary information sources. However, once the information sourcesare developed, the department can maintain them to provide ongoinganalysis and mapping of results. A linkage must always be establishedbetween the analysis and the automated mapping system.
Interactive Mapping
The final type of mapping is interactive mapping. This type of mappinginvolves both descriptive and analytical techniques in a forum that allowsthe user to ask "what if" questions and see the results automatically. Withinteractive mapping, a department is capable of performing ongoinganalysis of information without the need to conduct special studies. Weoffer two examples of interactive mapping. The first is a system calledHyperCube III, which assists police departments in forming patrol beats;

Applications of Computer Mapping to Police Operations 275
the second is an inquiry system developed by the Pittsburgh, PA PoliceDepartment to assist investigators in solving drug trafficking cases.
The HyperCube III program is based on a mathematical queuing modelthat uses the precinct s geography to predict several performance mea-sures for its patrol units:
• Average travel time and response time for the entire region andfor each reporting area.
• Workload and average travel time for each response unit.• Region-wide workload imbalance.• For each unit, the percentage of its assignments that require
the unit to travel to another precinct.To form patrol beats using the HyperCube III program, an analyst
provides data on the number of calls in small geographic areas. Usuallythese are the police reporting areas in a precinct. The user must providethe boundaries of these areas and the average travel time between pairsof reporting areas. More importantly, the user groups the reporting areasinto patrol beats as the analysis unit.
The HyperCube III program shows the results on a screen map of theprecinct with several pictorially appealing displays. Each patrol unit isshown as an icon, with its size proportional to its workload. Reportingareas are colored based on the average travel time, with red as high traveltime areas and green as low travel time areas. A bar under each unit showshow its average travel time compares to other units. Finally, a unit'sresponse pattern is displayed showing where the unit is dispatched mostoften.
Based on the screen map results, the user can change beat configura-tions by moving reporting areas from one beat to another. This is doneinteractively, and the model refreshes itself and visually displays theresults. With this approach, the analyst interactively creates beat config-urations and quickly sees the results of new beat designs. The results areshown relative to changes in average response time and workload. Thismeans that a police department can alter beat configurations based onefficiencies in workload and response times.
P:DMAP is an interactive mapping developed by the Pittsburgh PoliceDepartment under its Drug Market Analysis Program, a national demon-stration and evaluation project funded by the U.S. National Institute ofJustice. The P-DMAP project is housed within the department's Office ofOrganized Crime, Narcotics, and Intelligence. With support from the HeinzSchool of Public Policy and Management at Carnegie-Mellon University,the department has developed the P-DMAP automated information systemas a tool to support investigations of drug trafficking and other drug-re-

276 J. Thomas McEwen and Faye S. Taxman
lated cases. The system resides on a Sun SPARC work station and usesArclnfo for its automated mapping.
The P-DMAP system combines data from many different sources tocreate a composite of information on events, offenders, co-offenders,addresses and locations, and other critical information that could bebeneficial to investigations. The Computer Aided Dispatch (CAD) systemprovides data on calls for service, and the Public Safety ManagementSystem provides arrest data. The P-DMAP system also contains propertyownership data from a database maintained by the city's tax assessmentdepartment. Calls for service are downloaded to the P-DMAP system,usually on a bimonthly basis, and arrests are downloaded weekly. Prop-erty ownership information is downloaded about every six months.
The P-DMAP system is both an inquiry and a mapping system. It canbe queried, for example, by name, address, special locations (e.g., ThreeRivers Stadium), drug market area and school. Name inquiries canincludes arrestees, co-offenders and victims. Depending on the query, itis possible to locate appropriate records in the integrated databases. Forexample, an inquiry by arrestee name identifies records wherever thearrestee appears in the arrest database (as an arrestee or as a victim),calls-for-service database (as a caller) and the property-file database (asa landowner). This is a potentially powerful tool for examining patterns ofinteractions and possible locations where a person could be located. Thesearch capability is an extremely powerful tool for investigators and policeofficers because it reduces reliance on memory and allows for examinationof related information on offenders. The same is true for locations.Information about locations can be gathered by querying all the databasesto identify how often the location was a site for a call or arrest, what thedates were, what time of day the call or arrest was made and who ownsthe property.
When the system locates all the records satisfying the inquiry, theassociated locations can be displayed as a screen map. At this point, aninvestigator can select a location on the screen map and view all recordsassociated with the location. These records appear on the right side of thescreen. The results usually provide an investigator with additional infor-mation that leads to another inquiry and screen map. For example, arecord may show the names of other arrested persons and subsequentinquiries can be made about these persons. The map may also reveal ageographic pattern of calls or arrests for a person. Since all informationis in one automated computer system, it has become a valuable tool inpolice investigations.
Through this interactive process, an investigator develops leads for acase. Some leads may come directly from the inquiry results, while others

Applications of Computer Mapping to Police Operations 277
will be based on the geographic distribution of incidents as shown on thescreen map. In the latter instance, an area may be identified where theinvestigator should go to ask more questions. The point is that themapping system provides a mechanism for improved investigations. It alsoprovides the ability to examine patterns, disprove assumptions and obtainfactual information.
In summary, interactive mapping offers a means of performing analysisor solving problems in a real-time mode. It requires a supporting computersystem that is capable of obtaining inquiring parameters from a user andperforming an analysis based on the parameters. The results are displayedas a screen map that may, in turn, generate another cycle of inquiry.
DEVELOPING A COMPUTER MAPPING CAPABILITY
The previous section has been devoted to identifying the different usesof mapping within a law enforcement environment. The different capabil-ities—descriptive, analytical, and interactive mapping—have distinctcharacteristics. For police departments, these provide a potential to usetechnology to improve operations, with each making different contribu-tions to the enhancement of policy strategies. Underlying each capabilityis an automated mapping system. To some extent, the characteristics andnature of the automated system define the extent to which a policedepartment can use descriptive, analytical, and interactive mapping. Inthis section, we provide an overview of automated mapping capabilitiesand the extent to which the mapping system can be used within adepartment.
An automated mapping system consists of three primary components:
• Hardware and software for mapping
• Geobase file
• Data integration software
Microcomputers and minicomputers have become the hardware ofchoice for most police departments that develop automated mapping. Costoften influences the decision, but the increased power of hardware is alsoa contributor. Many police departments are becoming increasingly familiarwith microcomputers and are comfortable in using them. New technologyhas also provided easier ways of communicating with other computers.The communication systems have eased the sharing of data. Most systemsinclude either a laser printer or plotter for producing hard copies of maps.
The Maplnfo and Arclnfo software packages appear to be the mostpopular for manipulating data and producing maps. However, other

275 J. Thomas McEwen and Faye S. Taxman
geographic information systems have started to appear on the market. Thebasic functions of these systems are to (1) match addresses against ageobase file to obtain coordinates, (2) maintain boundary files for mappingprecinct boundaries, census tract boundaries, communities, or othergeographic breakdowns of the jurisdiction, and (3) provide the user withan easy way of selecting a geographic area and a set of data to be mapped.The results are displayed initially as a screen map, which can then be sentto a printer or plotter for hard copy output.
As previously indicated, a geobase file is a necessity in automatedmapping systems. The file contains the cartographic data necessary forproducing a screen map, as well as attributes of the geography representedby a map, such as address ranges of a street segment, intersections ofstreets and boundaries of geographic areas. The most common geobasefiles are the TIGER files developed by the Census Bureau for the 1990
Q
census. TIGER files contain topological data structures describing howpoints and lines relate to each other on a map to define geographic areas.Six types of records exist with TIGER files for describing shapes, streetnames and other information needed for mapping.
Data integration software provides the important function of combiningdata files from several sources into one location for mapping. These datafiles typically reside on other systems, usually mainframe systems. Therole of data integration is to access these files, extract the data needed,download the data and convert the data into a format accessible by themapping system.
We would be remiss, however, if we did not discuss some of theproblems associated with developing these systems. The two most signif-icant problems are in establishing a geobase file and setting up thesoftware system.
With regard to the geobase files, the TIGER files are notorious for theirerrors and omissions. In fact, the authors have yet to find a jurisdictionthat was pleased with what they received in their TIGER files. This is notto say that TIGER files should be avoided, but rather that a user must beprepared to devote considerable effort to correct the files. That is, it isnecessary to verify the coordinates so that they are as accurate as possible.In addition, new streets must be added to the files. In Jersey City, NJ, thepolice department spent nearly six months verifying streets, intersectionsand addresses. While they found the initial files to be 85% accurate,changes were needed to achieve the optimal results from their mappingsystem. In some jurisdictions, a more recent geobase file may be available

Applications of Computer Mapping to Police Operations 279
in another agency, and the police department should take advantage ofthese files.
The second major problem is in setting up the software system. Mostsystems require the user to develop menus for producing maps. This is aone-time effort, but it may require the assistance of a programmer. Arelated one-time effort is that the user must develop files reflecting theboundaries of areas, such as precincts or census tracts. The inputting ofgeographical references is critical in developing the data in a usablemanner.
There are other related problems that should be mentioned. One is theretention of key personnel supporting the mapping systems. Departmentanalysts usually have the responsibility for developing a system, and theirexpertise grows rapidly as applications are developed. Other governmentalagencies and private companies also use mapping systems, and personnelfor operating and maintaining these systems are in demand. It is essentialto recognize that maintenance is an important component of any auto-mated system, and resources must be devoted to sustain the system.Another problem is the need to train others in the department on how touse the system. The developer should not be the only person who knowshow to produce maps. Indeed, training others in the department willincrease system usage.
With these problems in mind, the advice to potential users of thesesystems falls along the following lines:
• Start small.
• Integrate the mapping application into existing systems.
• Plan early on integrating other data files for mapping.
Mapping crime data is a good starting point. Most departments initiallyacquire mapping software for crime analysis, and the automation ofmanual pin maps is certainly a major step forward. After getting experi-ence with mapping crime data, the department can expand the types ofdata for the system. The mapping applications should not, however, bestand-alone systems. Instead, they need to be included in thedepartment's overall records management or information system. Map-ping should be another tool in the arsenal, just as management informa-tion systems draw on a variety of data for reports. Finally, integrating otherdata files into the mapping system opens up many more opportunities fordeveloping more insightful maps. Calls for service, arrests, citizen hot line

280 J. Thomas McEwen and Faye S. Taxman
complaints and many other types of data can be integrated to show acomplete picture of police needs in an area.
WHAT THE FUTURE HOLDS
Automated mapping systems offer potential for having major impactson the strategies and tactics of police departments. Most importantly, themaps provide an approach to examine issues, information and problemswith existing information. Automated mapping provides the mechanismsto train staff in how to use information differently in police departments,especially the use of information to develop effective police responses. Inmost cases, these responses can be in the form of proactive policing ormobilizing the community to address crime related issues.
The mapping systems offer new ways for departments to approachproblems. Without a mapping system, department personnel tend toanalyze crime problems on the basis of incident characteristics such astime of day, day of week and method of entry, with insufficient attentionto the spatial aspects of crimes. These spatial aspects are importantbecause they focus on clustering of events in locations, the time of the dayof occurrence and the linkage among events.
We have already indicated the use of these systems for supportingcommunity policing by producing maps of incidents in a community. Whilethe maps are not the entire impetus, they assist in fostering positiverelationships between officers and citizens in developing joint effortsagainst community problems. The same phenomena can occur in a widerarena in which interagency cooperation increases between the policedepartment and other jurisdictional agencies. In Baltimore County, 16county agencies have acquired the Maplnfo software. Representativesfrom these agencies meet monthly to discuss technical issues associatedwith the package and their ongoing applications. An interesting by-prod-uct of these meetings is that the agencies have started to exchange dataso that more complete maps can be developed on particular problems. Thepotential result of these actions is that political boundaries will not beimposed on the definition of crime problems that can be critical in creatinginteragency responses to them.
Another important function of information systems, including mappingsystems, is that they serve as the institutional memory for police depart-ments (Maltz et al.. 1990). One of the difficulties faced by all policedepartments is constant turnover in personnel, either because of transfersto another unit or terminations from the department. Information systemsfill a need for new personnel assigned to an area by providing historicalinformation. Mapping systems fall into this same category. An officer

Applications of Computer Mapping to Police Operations 281
assigned to a new beat can become familiar with area problems throughautomated maps showing crime problems, calls for service, traffic acci-dents and much more. In Pittsburgh, new investigators rely on theP-DMAP system to obtain information about cases and offenders.
The integration of databases and mapping capabilities also serves tostrengthen a police department's responses to crime problems. With theadvances in mapping technologies, and the coordination of researchersand police officers working together to understand crime, police depart-ments are moving into a new horizon of problem solving. The three typesof mapping are premised on some analytical and statistical principles thatresearchers use. Technology has afforded the opportunity for these ana-lytical and statistical technologies to become available for police depart-ments to use in examining crime problems. For example, descriptivemapping is based on the techniques of frequency distributions or count-ing, which is usually the beginning of an analytical inquiry. Mapping offersone way of displaying the results of the frequency distribution in a mannerthat is easy to understand (instead of using a running list of numbers).Inferential statistical techniques can also be used, as suggested by theBaltimore County spousal abuse study. The maps provide the vehicles todisplay the results.
Finally, as police become more involved in community policing andproblem-solving initiatives, information is going to be key. Maps providepolice officers and communities with critical information that is easy tounderstand. The maps can be shared with the community to developcohesive and collaborative efforts. Within the police department, the useof information, and maps particularly, can be critical in empowering thepolice to work on crime problems. The police officer, armed with easy-to-understand maps describing and analyzing the crime issues, can thenbecome more responsible for developing proactive strategies.
Officers will have consistent, well-defined information to guide actions.Information will be integrated into maps to provide incentives to providenew and creative responses. At the patrol officer level, this is critical tothe achievement of a community policing philosophy, where the officerbecomes a partner with the community in addressing crime problems. Themaps provide the tools to focus on the critical issues. Mapping technology,therefore, has the potential for instituting change within police depart-ments by providing officers with critical information that can be used toguide police and community strategies. Mapping, like other forms of

282 J. Thomas McEwen and Faye S. Taxman
technology, will be critical in advancing police organizations to make themmore effective and efficient in the coming years.
NOTES1. Maplnfo for Windows is a mapping system for microcomputers developedby Maplnfo Corporation, based in Troy, NY.
2. Arclnfo is a mapping system that operates on several computer plat-forms. Arclnfo was developed by the Environmental Systems ResearchInstitute (ERSI), located in St. Paul, MN.
3. A more detailed example of analytical mapping can be found in anapplication developed by Rossmo, described in this volume.
4. Over 50 social and demographic variables were merged into the file. Somevariables came directly from prior Bureau of Census publications whileothers were developed by the Baltimore County Planning and ZoningCommission, the police department, and the Maryland Department ofEconomic and Employment Development.
5. The residual for a census tract is the numeric difference between theestimate from the regression equation and the actual number of cases inthe census tract.
6. The Hypercube model was developed by Dr. Richard C. Larson, aprofessor at the Massachusetts Institute of Technology and co-founder ofthe Queues Enforth Development Corporation. His work on the modelbegan in 1974 and the model has been used as a planning tool in numerousjurisdictions in the U.S. as well as by police departments in several othercountries.
7. Some police departments maintain separate computer systems thatallow for the inquires that have been integrated into this system. The keycharacteristic of the Pittsburgh system is the ability to conduct interactivesearches among different data bases and map the information. Otherdepartments have separate systems which allow for the transferring of datafor mapping. For example, the San Diego Police Department has separatedata bases for arrests, calls for service, hot lines, etc. which can beindividually inquired. The information from these searches can then betransferred to the mapping system. The disadvantage is that this is lessinteractive and requires more computer expertise.

Applications of Computer Mapping to Police Operations 283
8. The term TIGER is an acronym for Topologically Integrated GeographicEncoding and Referencing.
REFERENCESBlock, C.R. (1993). "STAC Hot Spot Areas: A Statistical Tool for Law
Enforcement Decisions." Workshop on Crime Analysis Through Com-puter Mapping Proceedings. Chicago, IL: Illinois Criminal JusticeInformation Authority and Loyola University Chicago.
Brantingham, P.J. and P.L. Brantingham (1981). Environmental Criminol-ogy. Beverly Hills, CA: Sage.
Buck, G.A., R. Austin, G. Cooper, D. Gagnon, J. Hodges, K. Martensen andM. O'Neal (1973). Police Crime Analysis Unit Handbook. Washington,DC: Law Enforcement Assistance Administration, U.S. Department ofJustice.
Canter, P. (1990). Baltimore County Police Department Spousal Abuse Study.Towson, MD: Baltimore County Police Department.
Carnaghi, J. andT. McEwen (1970). "Automatic Pinning." In: S.I. Conn andW.E. McMahon (eds.), Law Enforcement Science and Technology, Vol.III. Chicago, IL: Illinois Institute of Technology Research.
Chang, S.K., W.H. Simms, CM. Makres and A. Bodnar (1979). CrimeAnalysis System Support: Descriptive Report of Manual and AutomatedCrime Analysis Functions. Gaithersburg, MD: International Associa-tion of Chiefs of Police.
Eck, J.E. (1994). "Drug Markets and Drug Places: A Case-Control Study ofthe Spatial Structure of Illicit Drug Dealing." Doctoral dissertation,University of Maryland, College Park.
Green, L. (1993). "Drug Offender Movement Patterns: Implications forSpatial Displacement Analysis." Workshop on Crime Analysis ThroughComputer Mapping Proceedings. Chicago, IL: Illinois Criminal JusticeInformation Authority and Loyola University Chicago.
Harries, K.D. (1974). The Geography of Crime and Justice. New York, NY:McGraw-Hill.
Illinois Criminal Justice Information Authority (1993). "What is STAC?"STAC News. Chicago, IL: author. (Winter issue.)
LeBeau, J.L. (1987). "The Journey to Rape: Geographic Distance and theRapist's Method of Approaching the Victim." Journal of Police Scienceand Administration 15:129-136.
Maltz, M., A.C. Gordan and W. Friedman (1990). Mapping Crime in itsCommunity Setting: Event Geography Analysis. New York, NY:Springer - Verlag.

284 J. Thomas McEwen and Faye S. Taxman
Norcliffe, G.B. (1977). Inferential Statistics for Geographers. New York, NY:John Wiley and Sons.
Pauly, G.A., T. McEwen and S. Finch (1967). "Computer Mapping—A NewTechnique in Crime Analysis." In: S.A. Yefsky (ed.), Law EnforcementScience and Technology, Vol. I. New York, NY: Thompson.
Pyle, G.F. et. al. (1974), The Spatial Dynamics of Crime. Chicago, IL:Department of Geography, University of Chicago.
Sherman, L.W., P.R. Gartin and M.E. Buerger (1989). "Hot Spots ofPredatory Crime: Routine Activities and the Criminology of Place."Criminology 27:27-56.and Weisburd, D. (1989). Policing the Hotspots of Crime: A Redesign ofthe Kansas City Preventive Patrol Experiment. Washington, DC: CrimeControl Institute.
Spelman, W. (1988). Beyond Bean Counting: New Approaches for ManagingCrime Data. Washington, DC: Police Executive Research Forum.
Spring, J.V. and C.R. Block (1987). "Spatial and Temporal Analysis ofCrime." Paper presented at the annual meeting of the American Societyof Geographers.
Weisburd, D. and L. Green (1993). "Defining the Street-Level Drug Market."In: D.L. MacKenzie and C D . Uchida (eds.), Drugs and Crime: Evaluat-ing Public Policy Initiatives. Thousand Oaks, CA: Sage.L. Maher and L.W. Sherman (1993). "Contrasting Crime General andCrime Specific Theory: The Case of Hot Spots of Crime". In: F. Adlerand W.S. Laufer (eds.). Advances in Criminological Theory, Vol. 4. NewBrunswick, NJ: Transaction Books.