applications of computer graphics to aircraft …€¦ · applications of computer graphics to...
TRANSCRIPT

APPLICATIONS OF COMPUTER GRAPHICS TO AIRCRAFT SYNTHESIS
By Ralph L. Carmichael* and Richard Putnam**
NASA Ames Research Center
SUMMARY
The results of the aircraft design process are best given in graphical, pictorial, and tabular form.The computer-based aircraft synthesis programs currently being developed will generate this graph-ical output. The Advanced Vehicle Concepts Branch, NASA-Ames, has been implementing anaircraft synthesis program with computer graphics since 1971. This paper describes the history ofthe program development and compares a system based on time-sharing to two different conceptsbased on distributed computing.
INTRODUCTION
Increasing automation in the airplane design process is an important subject of research withinthe government and aviation industry (refs. 1-11). The implementation of such plans will call foreventual widespread use of computer-generated graphical output. The purpose of this paper is torelate the experience of the Advanced Vehicle Concepts Branch, NASA Ames Research Center, inimplementing computer-generated graphics in conjunction with the program for aircraft synthesis(ACSYNT).
AIRCRAFT SYNTHESIS
There is a substantial effort in the aeronautical research community to develop a computer-based procedure for the synthesis of aircraft configurations (refs. 1-8). The first task in this researcheffort is to identify and model all first-order effects on aircraft configuration definition. Thesemathematical models are coded into procedures in the various technical disciplines, such as aero-dynamics or propulsion, and coupled through a common data base. By appropriate control logic, anaircraft configuration is synthesized that satisfies the desired mission objectives. This computerized,preliminary design process can provide important information that can influence the direction andmagnitude of the overall airplane project at considerably less cost in time and money than atraditional preliminary design.
At the Ames Research Center, the Advanced Vehicle Concepts Branch uses such a synthesisprogram (ACSYNT) for conceptual design studies of proposed aircraft. The function of an aircraftdesign capability within NASA is to define quantitative measures of the performance of
* Research Scientist**National Research Council Post-doctoral Fellow
189
https://ntrs.nasa.gov/search.jsp?R=19760009734 2020-04-11T13:08:18+00:00Z

aeronautical concepts. This permits judgments to be made on the value of various research projectscompeting for the limited resources available and provides information for the direction and sup-port of NASA aeronautical research.
GRAPHICS IN AIRCRAFT SYNTHESIS
Since the results of a traditional design study are presented in the form of charts, graphs,drawings, etc., the computer-based study should yield these same results (figs. 1-12). The process ofgenerating this graphical data can be very demanding of engineering time. In view of the capabilitiesof modern computer graphics hardware, the most rapid and accurate way to produce such graphicaloutput is to include it in the computer synthesis program.
A fundamental guideline, established early in the development of ACSYNT, is that inter-mediate and final results should be displayed or plotted in graphical form. A second guideline is thatthe quality of figures be sufficiently high to allow their use in reports without retouching orredrawing. The selection of graphics hardware has been guided by the requirements that graphics beavailable quickly and that permanent copies be obtainable.
ACSYNT PROGRAM STRUCTURE
The program structure is illustrated in figure 13. Since one of the ACSYNT guidelines is toavoid machine dependence, the picture creation commands are not directly contained in thediscipline-oriented modules. Instead, each module produces an external file containing all the datanecessary to create the desired pictures. Upon convergence of the design algorithm, the various filesare merged into one combined file of results which is then cataloged and is available for presenta-tion to the user. This is a numerical file and not a graphics file at this point. The graphics post-processor routines are invoked to create and format the plot file of graphical information. This fileis written in a specially coded form that can be translated into pictures by any of several devices.
This structure has remained relatively constant over the past few years although the methodsfor implementing the actual transmission and display of the pictures to the user have undergoneseveral major modifications to adapt to the changing computing environment. The modularizationof the program has been very valuable in enabling the adaptation.
HISTORY OF SYSTEM DEVELOPMENT
The implementation of graphical display for ACSYNT was based on the following assump-tions:
1. The user wishes to see the results as quickly as possible after initiation of the job.2. The user wishes to maintain a certain amount of interactive control over what displays are
shown.-
190
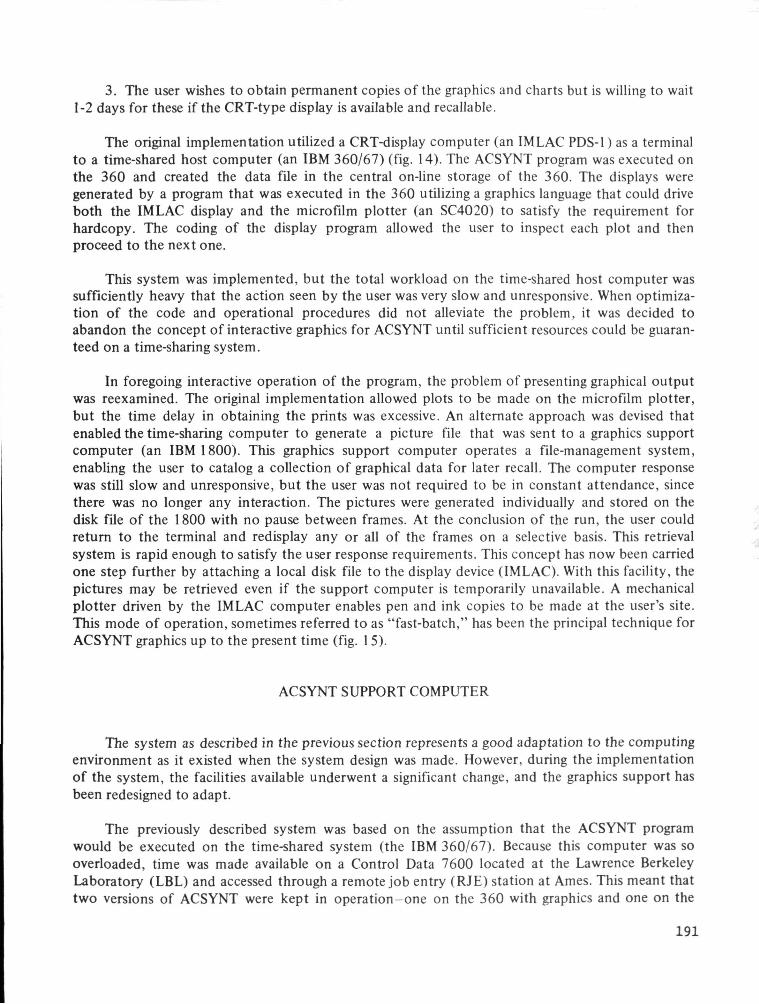
3. The user wishes to obtain permanent copies of the graphics and charts but is willing to wait1-2 days for these if the CRT-type display is available and recallable.
The original implementation utilized a CRT-display computer (an IMLAC PDS-1) as a terminalto a time-shared host computer (an IBM 360/67) (fig. 14). The ACSYNT program was executed onthe 360 and created the data file in the central on-line storage of the 360. The displays weregenerated by a program that was executed in the 360 utilizing a graphics language that could driveboth the IMLAC display and the microfilm plotter (an SC4020) to satisfy the requirement forhardcopy. The coding of the display program allowed the user to inspect each plot and thenproceed to the next one.
This system was implemented, but the total workload on the time-shared host computer wassufficiently heavy that the action seen by the user was very slow and unresponsive. When optimiza-tion of the code and operational procedures did not alleviate the problem, it was decided toabandon the concept of interactive graphics for ACSYNT until sufficient resources could be guaran-teed on a time-sharing system.
In foregoing interactive operation of the program, the problem of presenting graphical outputwas reexamined. The original implementation allowed plots to be made on the microfilm plotter,but the time delay in obtaining the prints was excessive. An alternate approach was devised thatenabled the time-sharing computer to generate a picture file that was sent to a graphics supportcomputer (an IBM 1800). This graphics support computer operates a file-management system,enabling the user to catalog a collection of graphical data for later recall. The computer responsewas still slow and unresponsive, but the user was not required to be in constant attendance, sincethere was no longer any interaction. The pictures were generated individually and stored on thedisk file of the 1800 with no pause between frames. At the conclusion of the run, the user couldreturn to the terminal and redisplay any or all of the frames on a selective basis. This retrievalsystem is rapid enough to satisfy the user response requirements. This concept has now been carriedone step further by attaching a local disk file to the display device (IMLAC). With this facility, thepictures may be retrieved even if the support computer is temporarily unavailable. A mechanicalplotter driven by the IMLAC computer enables pen and ink copies to be made at the user's site.This mode of operation, sometimes referred to as "fast-batch," has been the principal technique forACSYNT graphics up to the present time (fig. 1 5).
ACSYNT SUPPORT COMPUTER
The system as described in the previous section represents a good adaptation to the computingenvironment as it existed when the system design was made. However, during the implementationof the system, the facilities available underwent a significant change, and the graphics support hasbeen redesigned to adapt.
The previously described system was based on the assumption that the ACSYNT programwould be executed on the time-shared system (the IBM 360/67). Because this computer was sooverloaded, time was made available on a Control Data 7600 located at the Lawrence BerkeleyLaboratory (LBL) and accessed through a remote job entry (RJE) station at Ames. This meant thattwo versions of ACSYNT were kept in operation-one on the 360 with graphics and one on the
191

7600 without graphics. As seen by the user, the performance of the 7600 was so superior in termsof cost and turn-around time that all the jobs were run there. The advantage of having graphicaloutput could not overcome the disadvantages of long running time and slow turn-around.
Early in 1975, the LBL arrangement was replaced by the installation of a similar machine atAmes. Since it was apparent that this machine would be the site for execution of ACSYNT forseveral years to come, a design study was initiated to find a way to make the graphical outputavailable.
The Cyber 76 machine installed at Ames does not support interactive terminals in that waythat the 360 does, but it does support a network of RJE stations at various points about thelaboratory. The most direct approach to obtaining graphical output at the remote site is to have acombined graphics/RJE station. Such a station has been installed and is now being brought intooperation. The station is based on a minicomputer (PDP-1 1/40) and utilizes a high-quality, three-dimensional CRT display (Evans & Sutherland Picture System), local disk and tape storage, and anelectrostatic printer-plotter (fig. 16). An interface to the previously described 1MLAC PDS-1 is alsoavailable. The three-dimensional features of the Evans & Sutherland display enable the aircraft to beviewed from any angle, thereby relieving the host machine of the burden of computing a largenumber of views.
In the operational scenario for this station, the user prepares an input case for ACSYNT on thelocal minicomputer and enters this into the input job queue on the host machine (7600) (fig. 17).The job is executed by the host; the user observes this fact via the usual remote station inquiry/response protocol. The file of computed results is transmitted to the minicomputer disk. Thepictures are composed and displayed as many times as necessary for insight and understanding to beconveyed to the user while the host machine has proceeded to other computational tasks. Afterdetailed study of these results, the user may wish to change his input data and resubmit the casefrom the minicomputer station. The process is repeated over and over until the desired study resultis obtained. The number of complete turn-arounds accomplished each day depends on the job timeand priority. By splitting the workload—giving the host only those functions requiring a large-scalecomputer and giving the local minicomputer the remainder—the total study time can be minimized.
CONCLUSIONS
The results of the aircraft design process are best given in graphical, pictorial, and tabular form.It is an essential requirement that as many of the plots as possible be computer generated. Earlyattempts at the NASA Ames Research Center were based on interactive generation of the plots on atime-sharing system. This general approach has proven infeasible, and two alternative approachesbased on rapid retrieval of pictures from batch runs have been implemented. These systems, whichare based on distributed computing, are more practical than the former approach until adequateinteractive facilities can be made available.
192

REFERENCES
1. Gregory, Thomas J.: Computerized Preliminary Design at the Early Stages of Vehicle Defini-tion. AGARD Conference Proceedings 147, Florence, Italy, Oct. 1-4, 1973.
2. Boyles, Richard Q-: Aircraft Design Augmented by a Man-Computer Graphic System. J. Air-craft, vol. 5, no. 5, Oct. 1 968. pp. 486497.
3. Lee, Vernon A., Ball, H.Glenn, Wadsworth, E. A., Moran, W. J., and McLeod, J .D . : Com-puterized Aircraft Synthesis. J. Aircraft, vol. 4, no. 5, Oct. 1967. pp. 402-408.
4. Gregory, Thomas J., Petersen, Richard H., and Wyss, John A.: Performance Tradeoffs andResearch Problems for Hypersonic Transports. J. Aircraft, vol .2 , no. 4, Aug. 1965,pp. 266-271.
5. Williams, Louis J.: Transonic Transport Study - Summary. NASA TM X-62,156, May 1972.
6. Baals, Donald D., Robins, A. Warner, and Harris, Roy V., Jr.: Aerodynamic Design Integrationof Supersonic Aircraft. J. Aircraft, vol. 7, no. 5, Oct. 1970, pp. 385-394.
7. Hague, D. S.. and Glatt, C. R.: Optimal Design Integration of Military Flight Vehicles-ODIN/MFV. Technical Report AFFDL-TR 72-132, Aerophysics Research Corp., Dec.1972.
8. Schuberth, E. R., and Celniker, Leo: Synthesizing Aircraft Design. Space/Aeronautics, April1969, pp. 60-66.
9. Garrocq, Carlos A., and Hurley, Michael J.: "The IPAD System: A Future Management/Engineering/Design Environment. "Computer, April 1975, pp. 23-33.
10. Engl i sh , C. H.: Interactive Computer Aided Technology: Evolution of the Design/Manufacturing Process. MCAIR paper 75-009. Presented at AIAA 7th Aircraft Design, FlightTest and Operations Meeting, Los Angeles, Aug. 1975.
11. Feder, Aaron: Test Results of Computer Graphic Productivity for Aircraft Design and Fabrica-tion. AIAA Paper 75-967'. Presented at AIAA 7th Aircraft Design, Flight Test, and Opera-tions Meeting, Los Angeles, Aug. 1 975.
193

Figure 1.- Perspective view of F-5.
Figure 2.- Perspective view of B-727.
194

Figure 3.- Perspective view of AW ACS escort.
Figure 4.- Perspective view of ATLAS airplane.
195
35
CONTOURSPLOTTED-see-zee-lee
e
Q= see
20
15
ie
3 4 5 6 8 9MflCH
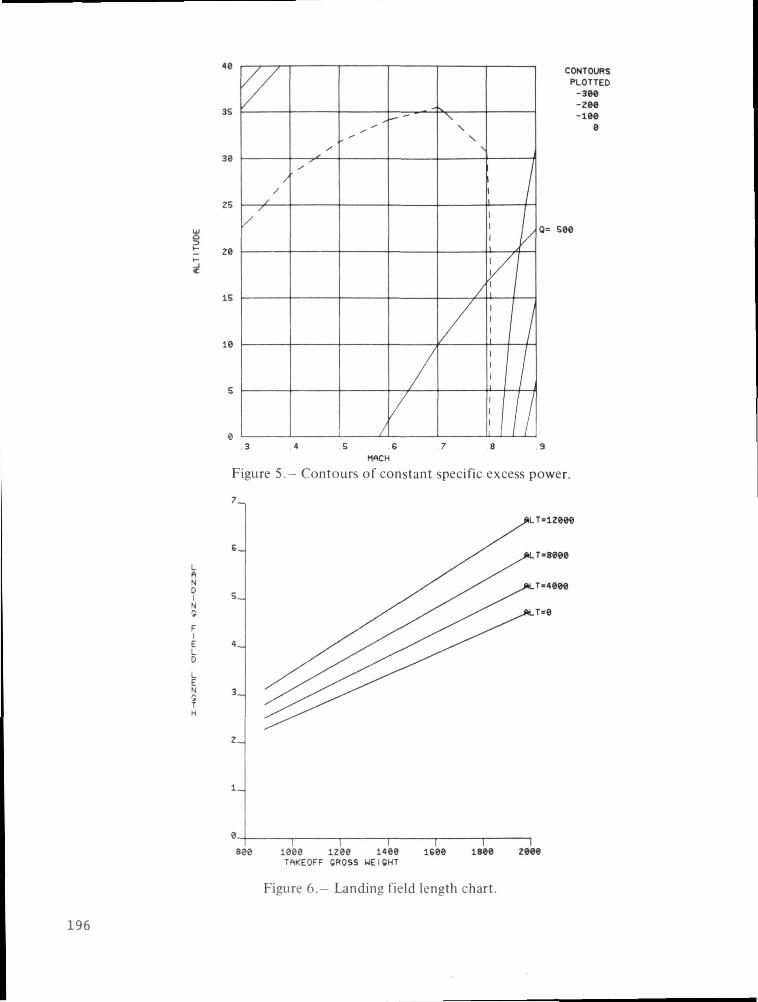
Figure 5.- Contours of constant specific excess power.
7_
6_
isee ieee izee 1400 isee isee zeee
TftKEOFF CROSS WE ISHT
Figure 6. Landing field length chart.
196

035_
030_
0Z5_
020_
015_
010_
005_
R I C T
I4 6
MfCH8 10 12
Figure 7.- Zero lift drag buildup.
2-,MnCH
s43
I1
1
2
3
4
5
3
5
71
8
8;
Figure 8.— Lift curves for various Mach numbers.
197

MACH
30
507 5
so
85
Figure 9.- Lift/drag curves for various Mach numbers.
0 02 0-4 06 08
MACH
30
50
75
30
85
Figure 10.- Drag polars for various Mach numbers.
198
3 f.
0.
10 20 30 40THRUST
MACH0 000400£00750800
ALT0
30000300003000030000
50
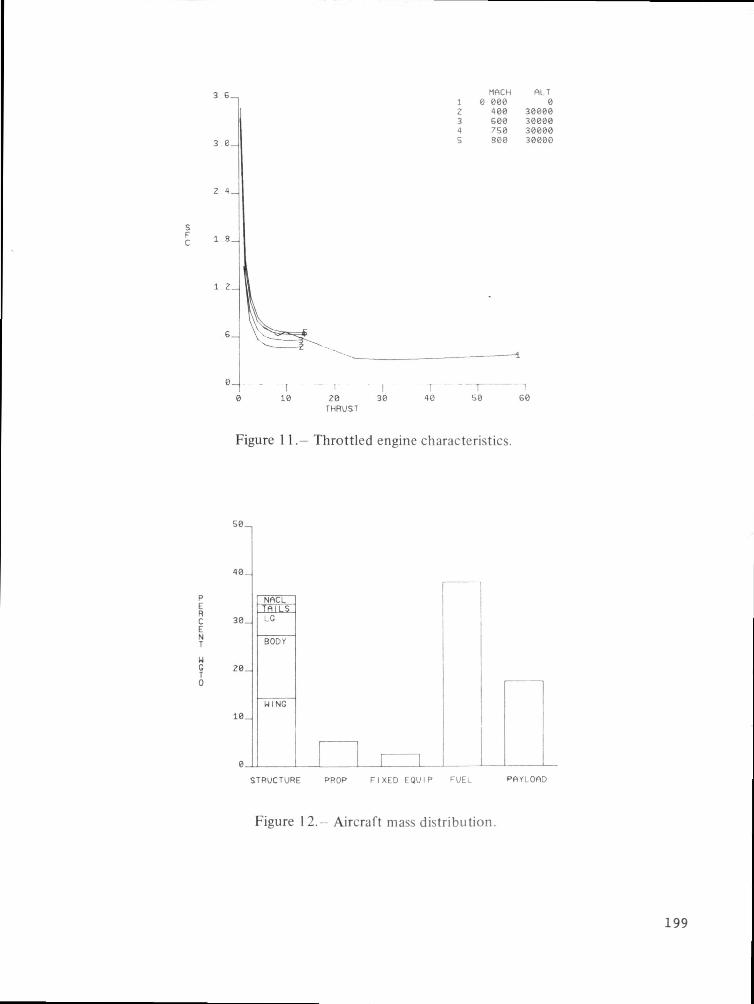
Figure 1 1 . — Throttled engine characteristics.
30_
20_
NACLTfllLS: G
BODY
MING
STRUCTURE PROP FIXED EQUIP FUEL PfiYLOAD
Figure 12.- Aircraft mass distribution.
199

Q_
COMBINEDRESULTS F ILE
Figure 13.- ACSYNT graphics file management.
TIME-SHARINGHOSTCOMPUTER
DISPLAY COMPUTER
IBM 360/67 IMLflC PDS-1
Figure 14.— Original concept of ACSYNT graphics.
DISPLAY COMPUTER
360/67 IBM 1800 IMLAC PDS-1
Figure 1 5.- "Fast-batch" graphics.
200

(BATCH )
CDC 7600 PDP-11/40 E&S PICTURE SYSTEM
Figure 16.- ACSYNT support processor.
USERPREPARESINPUT
TRANSMITSJOB TOHOST
RECEIVESRESULTS
VIEUSRESULTS
Figure 17.- Operational scenario.
201