applications of biomass stirling engines for ...735279/fulltext01.pdf · ii bachelor of science...
TRANSCRIPT

Bachelor of Science Thesis
KTH School of Industrial Engineering and Management
Energy Technology EGI-2014
SE-100 44 STOCKHOLM
Applications of biomass Stirling
engines for electrification.
A case study of rural areas in Bolivia.
Javier Arco Sola
Oscar Nelson

II
Bachelor of Science Thesis EGI-2014
Applications of biomass Stirling Engine for
electrification. A case study of rural areas in
Bolivia.
Javier Arco Sola
Oscar Nelson
Approved
Date
Examiner
Catharina Erlich
Supervisor
Catharina Erlich
Commissioner
Contact person
Abstract
This report provides a study and a simulation of a feasible system configuration for the
implementation of a Stirling engine for electrification of rural areas in Bolivia. The aim of the
review is to determine if a hybrid system combining a biomass-fired Stirling engine and
photovoltaic technology may respond to a basic electricity need.
An introductory literature study about the Stirling engine technology and the energy resources
and characteristics of Bolivia leads to a further proposal of the selected system for rural
electrification.
The chosen Stirling engine for this study is a 3 kW electric output engine combined with a PV
array of 0.9 kW and a battery bank with a capacity of 1200 Ah. The power demand that must be
satisfied is based on a rural village in the department of Beni with an amount of 24 households.
The simulation is performed in the software Homer Energy where an energy balance between the
generated power and the demand can be analysed in order to optimise the power generation
strategy. Two scenarios are simulated with monthly demands of 45 and 60 kWh per household.
Results from the study indicate that the decision on the size of the Stirling engine must be
attached to the demand that is going to satisfy in order to avoid insufficient or excessive power
production. In addition, although the PV technology allows an increase on the power demand
that the system can handle and makes it more flexible, its contribution is not of the same order of
the Stirling engine. The described system configuration is able to attend a demand up to 55
kWh/day and a peak power of 3.8 kW.
In conclusion, Stirling engines have the potential to become a good solution for rural
electrification, especially when making use of CHP strategies to increase the overall efficiency of
the energy generation and fulfil both the electric and thermal demands of rural populations.

III
Contents Abstract ......................................................................................................................................................... II
Nomenclature ............................................................................................................................................ IV
Problem Formulation and Objectives ...................................................................................................... V
1. Introduction .......................................................................................................................................... 1
1.1. Stirling Engine .............................................................................................................................. 1
1.1.1. Thermodynamic Principle .................................................................................................. 1
1.1.2. Mechanical Configurations ................................................................................................ 3
1.1.3. Regenerator .......................................................................................................................... 4
1.1.4. Cooling system ..................................................................................................................... 4
1.1.5. Technical Barriers ................................................................................................................ 5
1.1.6. Biomass as energy source ................................................................................................... 6
1.1.7. CHP systems ........................................................................................................................ 7
1.1.8. Case studies of Stirling engines running on biomass ..................................................... 9
1.1.9. Complements for power generation ............................................................................... 10
1.2. Bolivia .......................................................................................................................................... 12
1.2.1. Geographical characteristics ............................................................................................ 12
1.2.2. Social and political aspects ............................................................................................... 12
1.2.3. Energy scenario ................................................................................................................. 13
1.2.4. Resources ............................................................................................................................ 14
2. Method ................................................................................................................................................ 17
2.1. System framework ..................................................................................................................... 18
2.1.1. Geographical location ....................................................................................................... 18
2.1.2. Target population .............................................................................................................. 19
2.1.3. Available resources ............................................................................................................ 20
2.2. System requirements ................................................................................................................. 21
2.2.1. Use of energy ..................................................................................................................... 21
2.2.2. Energy demand .................................................................................................................. 22
2.2.3. Power curves ...................................................................................................................... 22
2.3. System configuration ................................................................................................................. 25
2.3.1. Energy model ..................................................................................................................... 25
2.3.2. Technological specifications and sizing of system components ................................ 29
2.3.3. Simulation ........................................................................................................................... 30
3. Results and discussion ....................................................................................................................... 32
3.1. Sensitivity analysis ...................................................................................................................... 38
4. Conclusions and future studies ........................................................................................................ 41
Table of Figures .......................................................................................................................................... 42
Table of Tables ........................................................................................................................................... 43
References ................................................................................................................................................... 44
Appendix ..................................................................................................................................................... 47

IV
Nomenclature
Parameter Name Units
p Pressure Pa
V Volume m3
k Adiabatic constant -
TH Temperature at hot space K
TC Temperature at cold space K
SOC Battery State of Charge %
SEG Stirling Engine Generator -
N Number of rural households -
𝑃𝑆𝐸 Generated power by Stirling engine W
𝐸𝑓𝑢𝑒𝑙 Fuel energy density J/kg
�̇� Fuel input flow kg/s
𝜂𝑆𝐸,𝑒𝑙 Electric efficiency of Stirling engine %
𝑃𝑃𝑉 Generated power by Photovoltaic array W
𝑌𝑃𝑉 Rated capacity of Photovoltaic arrays kW
𝑓𝑃𝑉 Photovoltaic derating factor %
𝐺𝑇̅̅̅̅ Solar radiation incident on Photovoltaic array kW/m2
𝐺𝑇,𝑆𝑇𝐶̅̅ ̅̅ ̅̅ ̅̅ Solar radiation incident at standard test condition kW/m2
𝑃𝐷𝑈,𝑃𝑉 Power for direct use from photovoltaic array W
𝑃𝑆,𝑃𝑉 Power stored in batteries using photovoltaic array W
𝑃𝐷𝑈,𝑆𝐸 Power for direct use from Stirling engine W
𝑃𝑆,𝑆𝐸 Power stored in batteries using Stirling engine W
𝜂𝑐𝑜𝑛𝑣 Efficiency of current converter %
𝜂𝑐ℎ𝑎𝑟𝑔𝑒 Efficiency of battery bank power input %
𝜂𝑑𝑖𝑠𝑐ℎ𝑎𝑟𝑔𝑒 Efficiency of battery bank power output %
𝐿𝑝𝑟𝑖𝑚,𝑎𝑣𝑒 Average value of the electric load kWh
𝑞𝑚𝑖𝑛 Minimum SOC allowed for the battery bank %
𝑄𝑛𝑜𝑚 Nominal capacity of an individual battery Ah
𝑉𝑛𝑜𝑚
Nominal voltage of a single battery V
𝑁𝑏𝑎𝑡𝑡 Number of batteries -
V
Problem Formulation and Objectives
After a brief overview and literature research on the topic, the Stirling engine seems to be a
promising tool for electrification of rural areas where the use of biomass is extended among the
population and also due to the possibility of using solar energy by means of photovoltaic
technology as an additional energy input to the system.
Some of the drawbacks associated to the Stirling engine must be analysed such as the impact of
high pressures, wide temperature differences and economic issues to determine the technical
barriers that the current technology has to overcome to become a solid alternative in the energy
market although, the economic study is out of the scope of this report.
In this study, the country of Bolivia will be the scenario chosen for testing the applicability of the
Stirling technology in rural areas. The country gathers the appropriate conditions to be
considered a suitable scenario for the implementation of the engine as will be described later.
Therefore, studying the geographical conditions in Bolivia is necessary to be able to map all the
different situations where the Stirling engine might be introduced. Parameters as the availability
of resources, climate conditions or energy demands will be essential to evaluate the future
possibilities of this technology.
In addition, determining the appropriate size of the installation is necessary based on the energy
demand of the area chosen for the implementation. The case where the Stirling engine is used to
satisfy the demand of a dedicated service is a best case scenario in terms of foreseeing the size of
the installation since the whole system might be adapted to a narrow range of operation.
A model of a suitable installation for electrification of a rural area in Bolivia must be developed
and assumptions and limitations have to be made in order to implement the model in suitable
software.
Therefore, the following statements represent the objectives of the project
Gain knowledge about Stirling engine technology.
Define the technical barriers of Stirling engines.
Analyse the possibilities and benefits of Combined Heat and Power (CHP).
Study whether the combination of Photovoltaic arrays and Biomass-fired Stirling engine is a feasible solution to fulfil the energy demand of rural areas.
Determine the electric energy need of rural households in Bolivia in order to size the required installation.
Analyse the energy demand evolution through time (power).
Define a region in Bolivia with suitable conditions for the implementation of Stirling engine technology.
1
1. Introduction
The first chapter presents the results of a literature study which objective is to obtain a general
overview on the topic and review the existing knowledge about Stirling engine and the
implementation for electrification of rural areas. In addition, the country of Bolivia is presented
to motivate its selection as scenario for the implementation of the project. Therefore, this
introduction provides relevant facts about Stirling technology and Bolivia.
1.1. Stirling Engine
The Stirling engine is a heat engine working with an external heat source. Since the heat source is
external to the engine, a broad spectrum of energy sources might be used. Therefore, the study of
renewable energy sources as solar or biomass is interesting due to the available resources, reduced
polluting emissions and cheap energy price (Kongtragool & Wongwises).
Since the Stirling engine is operated with an external heat source, the combustion of the fuel in a
biomass Stirling engine is made continuously in a burner (Farret & Godoy Simões, 2006). As an
alternative to biomass Stirling engine there is the solar Stirling engine using solar radiation as heat
source. The engine in this study though is chosen to be using biomass as power input. The
performance of Stirling engines is highly dependent on the heat transfer from the combusted
gases to the working fluid. In consequence, the temperature of the input gas and the flow rate are
important factors that affect the overall efficiency of the engine (Nishiyama, et al., 2007).
Theoretically, the Stirling engine can achieve the Carnot efficiency which is the maximum
efficiency of all ideal thermodynamic cycles. However, the presence of dead volumes, the
limitations from the construction materials or the mechanical losses when operating the system
will lower the efficiency of the engine (Kongtragool & Wongwises, 2006).
Additionally, the Stirling engine has been reported to be reliable and the production costs would
not be higher than a standard reciprocating engine in a scale production. Stirling engines operate
quietly and efficiently and are in addition simple and safe to operate. (X.Q. Kong, 2004)
1.1.1.Thermodynamic Principle
The Stirling engine operates following a thermodynamic cycle as described in Figure 1 (area 1-2-
3-4), or one of the modifications of the Stirling cycles. The engine makes use of a compressible
fluid as the working fluid. This working fluid must have low viscosity to avoid pumping losses
when the pistons are moving. Since the fluid must stay caged in a closed system leaking is
important to avoid. Therefore, the selection of the working fluid has to take in account the
characteristics of the sealing system available for the engine (Invernizzi, 2010).

2
Figure 1. Thermodynamic p-v and T-s diagrams of Carnot and Stirling cycles. (Bancha Kongtragool, 2003)
In Figure 1, a comparison between a Carnot cycle and a Stirling cycle is presented for the same
limits of pressure, volume and temperature. The Carnot cycle is defined by corners 1-2C-3-4C.
When the isentropic processes of the Carnot cycle 2C-3 and 4C-1 are substituted by isochoric
ones, the Stirling cycle is obtained. In Figure 1 is then observed that for the same limits of
pressure, volume and temperature, the Stirling cycle provides a higher available work (hatched
area). (Bancha Kongtragool, 2003)
The area inside corners 1-2-3-4 describes the Stirling cycle. The cycle begins with an isothermal
compression process from 1 – 2 shown in Figure 1. The fluid is in the cold space and has the
lowest temperature of the cycle. The power piston starts to compress the fluid when moving
from the bottom dead centre (BDC) to the top dead centre (TDC) using the work expressed in
the area under the line 1-2. That work is provided by flywheel momentum stored from the
previous cycle. Additionally in the process, heat from the fluid is extracted but not wasted since
the heat can be reused for powering a thermal load in a CHP system. After compressing the fluid,
a constant-volume heating process takes place from corners 2-3. The working fluid is transferred
from the cold space to the hot space due to the movement of the displacer (TDC to BDC) and is
heated when being in contact with the regenerator. This addition of heat increases the pressure in
the fluid and allows reducing the amount of heat to be provided by the external source in the
next process. From 3 to 4, the fluid experiences an isothermal expansion. The power piston is
displaced from TDC to BDC and heat is added from an external source. During the process, the
fluid stays in the hot space. Mechanical work is performed in the flywheel due to the expansion
of the fluid. When a generator is connected to the flywheel, electricity is directly produced. The
last process is an isochoric cooling process (4-1) where the fluid is transferred from the hot to the
cold space. Heat from the fluid is absorbed in the regenerator to be used in process 2-3. The
power piston remains in standstill in the BDC during the process. When the pressure and
temperature are reduced to the initial conditions, the cycle starts again. (Bancha Kongtragool,
2003)
The total work produced by the cycle is the difference between the work produced in process 3-4
and the consumed in process 1-2. For the cycle to be physically implemented there must be a gap
in the movement of displacement and power pistons of around 90◦ (Bancha Kongtragool, 2003).

3
1.1.2.Mechanical Configurations
The Stirling engine technology might be classified in three different categories named alpha, beta
and gamma. In all three configurations, the same thermodynamic cycle is performed giving a
constant volume process when transferring the fluid from the hot to the cold space and a
constant temperature process when adding or extracting heat from the fluid through the
compression and expansion inside the cylinders. The three configurations might be illustrated
shown as Figure 2.
Figure 2. Alpha, Beta and Gamma Configurations of Stirling engines (Kongtragool & Wongwises, 2003).
The Alpha configuration depicted in Figure 2 is usually designed with two independent cylinders.
The pistons are placed in a 90◦ angle between each other. This configuration does not require a
displacer. The Beta configuration places both piston and displacer in the same cylinder reducing
dead spaces. The main issues with this configuration is the high precision required for the
manufacture and the high costs involved. However, the Gamma configuration holds the same
principle as the Beta one, reducing the construction cost. In that case, piston and displacer are
located in different cylinders (Agüero Zamora, 2006).
The heater warms up the working fluid to an optimum temperature of the engine. This
temperature is often within a range of a couple of hundred degrees, typically among 500-600º C
according to Obernberger, et al., (2003). Cooling the engine may be done using air or water as
will be discussed later on. It is important to assure a proper refrigeration system, since an increase
in the cooling fluid temperature might cause important reductions on the engine efficiency
(Thombare & Verma, 2008). Furthermore when operating the engine, the working fluid is forced
through the heater and then back to the cooler. In order to reduce the required energy supply for
heating the hot end of the engine, it is interesting to store the dissipated heat from the working
fluid on each stroke of the piston. The mechanism for this purpose, known as regenerator in
Figure 2, absorbs heat while hot fluid is transferred from the heater to the cold end of the
cylinder. In return, the regenerator provides the fluid with a surplus of heat once the fluid is
forced back from the cooler. (Thombare & Verma, 2008)
These different configurations have different advantages and different disadvantages and are
therefore used in different scenarios. Before choosing which configuration is better for the rural
electrification discussed in this project, the limits of the engine are important facts to be studied.
When the limits are stated, defining the most critical components of the engine design is
important in order to define the main parameters that affect the performance of Stirling engines.

4
1.1.3. Regenerator
If a regenerator is used for constantly extracting and adding heat to the fluid in every stroke of
the piston, a reduced amount of heat from the external source is required and the thermal
efficiency of the engine is improved. In the case of an ideal regenerator, the Stirling and Carnot
efficiencies are equivalent (Bancha Kongtragool, 2003).
The heat exchanger is placed between the hot and cold spaces of the engine. The function is to
retrieve the heat from the hot fluid that otherwise would be delivered to the environment and
lost irreversibly outside the cycle and deliver the heat back to the working fluid while being
transferred to the hot space of the engine. In that way, the efficiency of the process is increased
by taking profit of recycled internal heat and therefore, the power output of the engine is higher
for the same temperatures of the hot and cold sides (Watanabe, et al., 2000).
The overall performance of the engine is importantly dependent on the performance of the
regenerator. However, measuring the efficiency of the regenerators is a challenging problem. The
measurement of temperature differences in the regenerator is limited since the flow velocity is
over the range of operation of the temperature sensor (Watanabe, et al., 1999).
The regenerator often consists of a matrix of metal felt. The design might be varied by changing
the diameter of the wire composing the metal felt or the fill factor of that one. Increasing the
heat transfer area will increase the efficiency of the regenerator at the expense of an increase of
the flow resistance and pressure losses. In (Andersen, et al., 2006), an optimised design is
presented that increases the efficiency of the engine from 32.9% to 33.2% with a 3% decrease in
power output by considering the oscillations in temperatures of the regenerator matrix.
1.1.4. Cooling system
The cooling devices installed in the engine take care of both refrigerating the cold end of the
cylinder and dissipating the heat generated from the combustion that is not transformed into
electricity (Agüero Zamora, 2006).
For the first purpose, the refrigeration might be performed trough natural or forced convection.
In the case of natural convection, fins are attached to the external surface of the cylinder to
increase the convection surface and be able to dissipate a higher amount of heat (Agüero
Zamora, 2006).
Forced convection is performed attaching a water jacket to the cylinder that circulates water at a
steady temperature improving the dissipation capacity of natural convection. For instance a 100
W output Stirling engine is equipped with a water jacket to maintain the cold end temperature at
35°C (Sripakagorn & Srikam, 2011).
On the other hand, the dissipation of the exhaust heat from the combustion that has not been
converted into electricity is mainly done through water-refrigerated systems. The refrigeration
system must be able to evacuate at least a 50% of the engine heat and it should be done at the
lowest possible temperature in order to increase the thermal efficiency of the engine. For
stationary engines, the ideal situation is to make use of an inexhaustible source of water at a
steady temperature as might be a river. In such case, the fluid is circulated in an open circuit
through the engine to dissipate the generated heat. In case the engine is not stationary or an
5
inexhaustible source is not available, then a closed water circuit is required. Additionally, a
radiator with a fan is required to cool down the water inside the circuit. The energy use of the fan
and the pump to recirculate the water will reduce the available output of the engine (Agüero
Zamora, 2006).
In some sources is suggested to make use of an inertia-driven water pump to avoid reducing the
electric output from the linear alternator (Lane & Beale, 1999).
1.1.5. Technical Barriers
The temperature difference in the cylinders is one of the main factors to determine the amount
of power output available from the engine. If the difference is large, then the materials must resist
high efforts and accordingly, the total cost is increased. On the other hand, a small temperature
difference implies a lower efficiency and a smaller specific power compared to the high
temperature difference engine. Therefore, an equilibrium must be achieved and those are factors
that have to be taken in account when deciding the specifications of the engine (Sripakagorn &
Srikam, 2011).
Moreover, the heat exchanger is a component of critical importance in the engine design. A
broad contact surface is necessary to transfer the heat from the working fluid to the coolant and
that might imply scaling issues and also an increment of weight that will add to the problem of
specific power generation (Biedermann, et al., 2003).
Therefore, the achievable power output of Stirling engine is much lower for the same weight
compared to the power output from a Diesel engine – and most thermal engines. For instance,
the Mod II Stirling engine developed by NASA for the automotive industry had a specific power
of 0.3 kW/kg (Nightingale, 1986) while a typical vehicle motor produces between 1.0 and 2.5
kW/kg of engine mass (Kawamura, et al., 2009).
In relation with biomass-fired Stirling engines, since a high temperature is necessary to achieve a
high overall efficiency, the air in the biomass combustor could be preheated and raised over 500
ºC. These high temperatures might produce ash slagging and fouling problems since solid bio
fuels produced a considerable amount of residues when burned (Kuosa, et al., 2007). In
consequence, it is not possible to adapt a Stirling engine design for natural gas to operation with
biomass fuels since the narrow passages of the heat exchanger are blocked after an hour of
operation and the dissipation of heat is reduced (Biedermann, et al., 2003).
Another issue related with the Stirling engine that might be crucial for some applications is the
slow start. As every thermal engine, the machine requires some time to warm up and reach both a
suitable power output and an interesting efficiency figure from cold start, but in the case of
Stirling this time is longer. Due to this slow dynamics, the engine is more suitable to operate at
constant speed (Bancha Kongtragool, 2003).
Lastly, the choice of working fluid has to be considered. A fluid with low heat capacity is required
to achieve a substantial increase of pressure with a change in temperature in the fluid. The most
appropriate fluid would be hydrogen but due to its low molecular weight it would easily leak
through the solid walls. Therefore, it is important to assure that the sealing inside the engine is
enough to avoid leaking and a loss of working fluid. Most suitable and commonly used fluids are
helium, nitrogen or simple air (Invernizzi, 2010).
6
1.1.6. Biomass as energy source
Biomass as an energy source may have several meanings since biomass is a group naming
different organic materials. Defining the energy density of biomass, known as the heating value, is
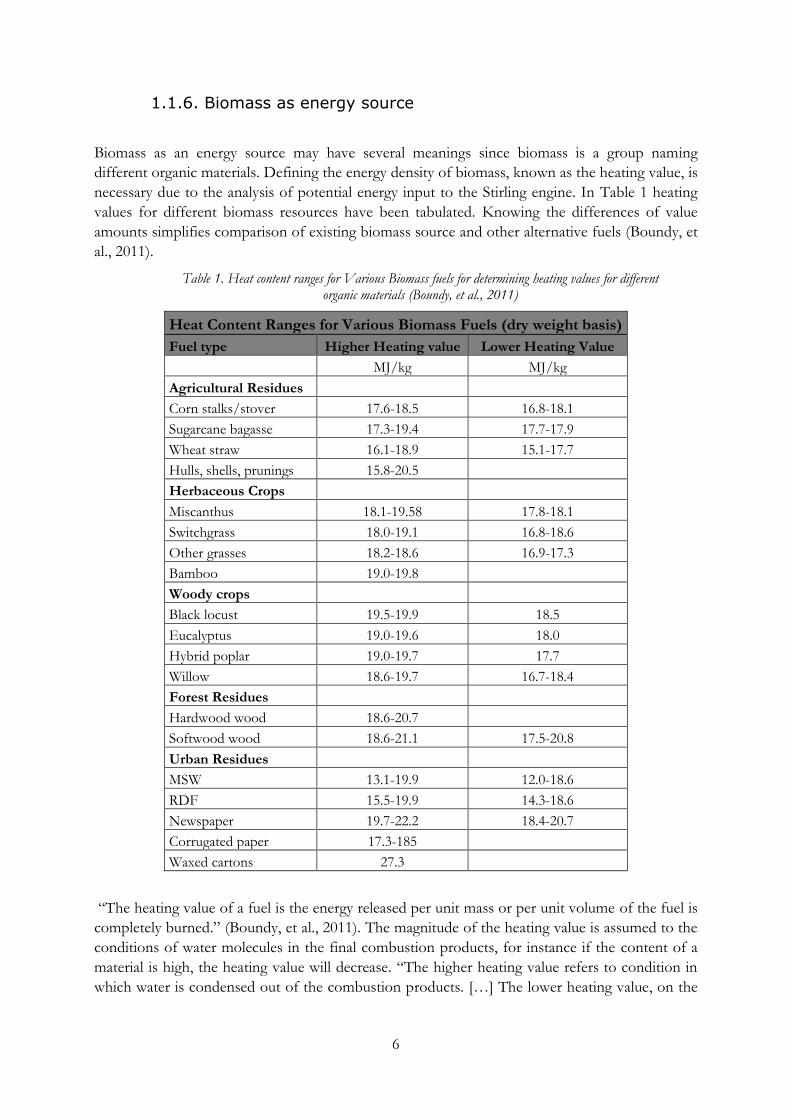
necessary due to the analysis of potential energy input to the Stirling engine. In Table 1 heating
values for different biomass resources have been tabulated. Knowing the differences of value
amounts simplifies comparison of existing biomass source and other alternative fuels (Boundy, et
al., 2011).
Table 1. Heat content ranges for Various Biomass fuels for determining heating values for different organic materials (Boundy, et al., 2011)
Heat Content Ranges for Various Biomass Fuels (dry weight basis)
Fuel type Higher Heating value Lower Heating Value
MJ/kg MJ/kg
Agricultural Residues
Corn stalks/stover 17.6-18.5 16.8-18.1
Sugarcane bagasse 17.3-19.4 17.7-17.9
Wheat straw 16.1-18.9 15.1-17.7
Hulls, shells, prunings 15.8-20.5
Herbaceous Crops
Miscanthus 18.1-19.58 17.8-18.1
Switchgrass 18.0-19.1 16.8-18.6
Other grasses 18.2-18.6 16.9-17.3
Bamboo 19.0-19.8
Woody crops
Black locust 19.5-19.9 18.5
Eucalyptus 19.0-19.6 18.0
Hybrid poplar 19.0-19.7 17.7
Willow 18.6-19.7 16.7-18.4
Forest Residues
Hardwood wood 18.6-20.7
Softwood wood 18.6-21.1 17.5-20.8
Urban Residues
MSW 13.1-19.9 12.0-18.6
RDF 15.5-19.9 14.3-18.6
Newspaper 19.7-22.2 18.4-20.7
Corrugated paper 17.3-185
Waxed cartons 27.3
“The heating value of a fuel is the energy released per unit mass or per unit volume of the fuel is
completely burned.” (Boundy, et al., 2011). The magnitude of the heating value is assumed to the
conditions of water molecules in the final combustion products, for instance if the content of a
material is high, the heating value will decrease. “The higher heating value refers to condition in
which water is condensed out of the combustion products. […] The lower heating value, on the

7
other hand refers to the condition in which water in final combustion products remains as
vapour or steam.” (Boundy, et al., 2011).
Compared to other fuels, one of the advantages using biomass is the CO2 recycling aspect where
the exhaust of biomass may be reabsorbed by the ecosystem. Furthermore, the use of biomass
reduces the dependence of scarce fossil fuels and provides the country with a higher degree of
energy independence when making use of the national resources. In addition, the employment of
biomass for energy services reduces the need of waste treatment and landfill space for storage,
reducing as well the need for waste transportation and the energy use related to this.
Depending on the biomass composition, biomass may also produce alternative emissions that are
harmful for the environment and in that case analysing the by customer employed biomass is
important due to the different available alternatives. Among other problems, burning biomass
may cause carbon monoxide and low chlorine traces which are contaminated into the atmosphere
(Lobert, et al., 1999). Therefore, controlling the emissions may be important since the values
might be above those from other conventional fuels. Additionally, having as high efficiency as
possible using biomass needs preheating of the combustion air with the hot-fluid once leaving
the heated part of the Stirling engine. This may cause ash slagging and fouling problems during
operation of the engine decreasing the efficiency. Furthermore, the combination of different fuels
using the same Stirling engine might be problematic. For instance, it is not possible to use natural
gas together with biomass in a Stirling engine since narrow passages are blocked after less than
one hour of operation due to the biomass (Obernberger, et al., 2003).
The combination of biomass and Stirling engine is a good match for implementing standalone
power generation in rural areas of Bolivia. This is a consequence of the extended use of biomass
in these areas by the population and the accessibility to this resource. Same for industries, since
the production in rural areas is generally dependent on biomass. The use of Stirling for small-
scale energy needs may be a good solution and also a complement to the power supply for bigger
industries. (Energy Sector Management Assistance Program, 2007)
1.1.7.CHP systems
Combined heat and power (CHP) stands for the production of both forms of energy services
simultaneously resulting in an increase in the overall efficiency of the process – compared to
individual generation of heat and power – making use of the exhaust heat coming from the
combustion of a fuel for thermal applications as for instance water heating for domestic use (De
Paepe, et al., 2006).
When producing heat and power individually, the combined efficiency is up to 45%. In small-
scale CHP systems, the combined production of heat and power may reach an 80% of efficiency
(Shipley, et al., 2008).

8
Figure 3. Comparison between CHP and traditional heat and power generation (Shipley, et al., 2008).
The Stirling engine is capable of regenerating a great amount of exhaust heat after producing
mechanical power and therefore it is a good option for implementing in CHP systems. The hot
flue gases act as energy source for the engine and keep a great amount of energy after passing
through it. This waste energy can be used for heating water inside a boiler for other purposes to
take better profit from the combusted biomass (Kong, et al., 2004).
Together with the Stirling engine, additional components are required to compose a CHP system
with the characteristics mentioned above.
Figure 4. CHP system consisting of a Stirling Engine for generation of electricity and thermal energy. (Obara, et al., 2008)
Figure 4 presents an example of a CHP system based on Stirling Engine for heat and power
generation. The selected fuel is combusted with air in the combustor to provide energy to the
Stirling Engine through hot gases. The mechanical energy generated in the Stirling engine is
supplied to an electric generator that will transform the mechanical input into electricity. The
thermal energy in the exhaust gases might be used in different ways as shown in the figure.
Depending on the fuel, preheating the air before entering the combustor might be interesting in
order to improve the efficiency of the process and therefore, the exhaust gases are recirculated to
a heat exchanger (Biedermann, et al., 2003). Simultaneously, the energy contained in the hot
exhaust gases can be stored and used when required, as for instance, to produce a hot water
supply (Kimming, et al., 2011).
9
1.1.8. Case studies of Stirling engines running on biomass
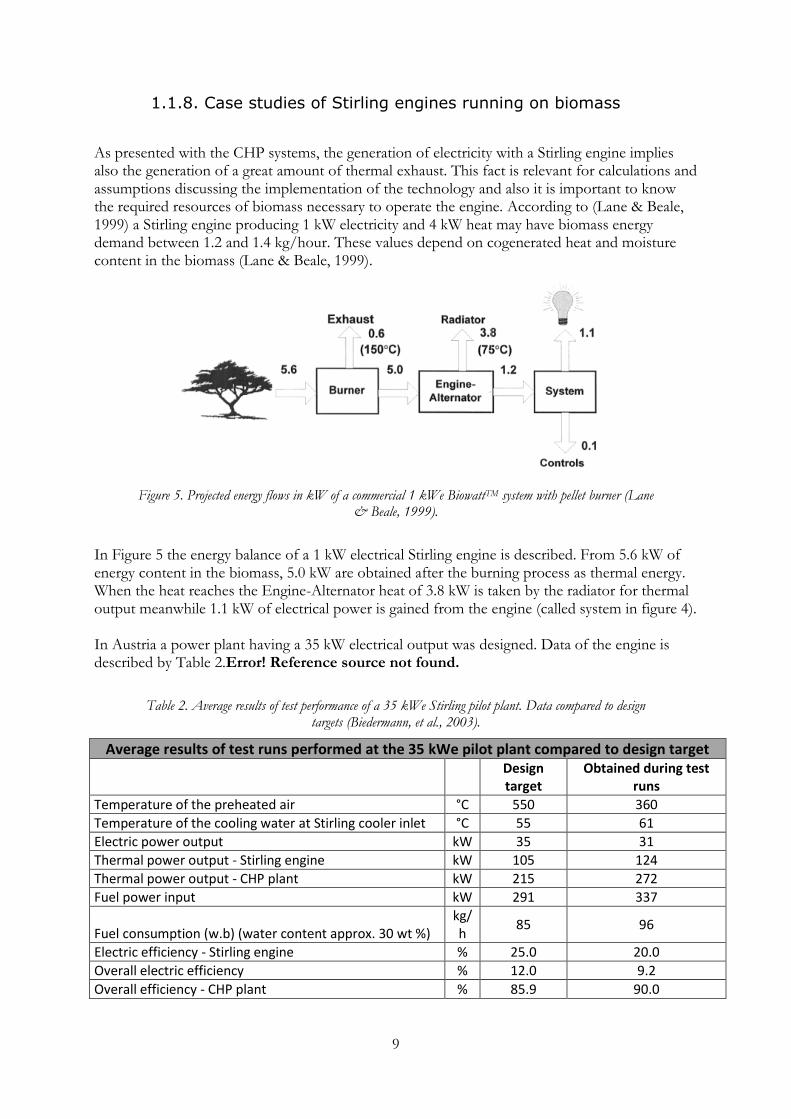
As presented with the CHP systems, the generation of electricity with a Stirling engine implies also the generation of a great amount of thermal exhaust. This fact is relevant for calculations and assumptions discussing the implementation of the technology and also it is important to know the required resources of biomass necessary to operate the engine. According to (Lane & Beale, 1999) a Stirling engine producing 1 kW electricity and 4 kW heat may have biomass energy demand between 1.2 and 1.4 kg/hour. These values depend on cogenerated heat and moisture content in the biomass (Lane & Beale, 1999).
Figure 5. Projected energy flows in kW of a commercial 1 kWe BiowattTM system with pellet burner (Lane & Beale, 1999).
In Figure 5 the energy balance of a 1 kW electrical Stirling engine is described. From 5.6 kW of energy content in the biomass, 5.0 kW are obtained after the burning process as thermal energy. When the heat reaches the Engine-Alternator heat of 3.8 kW is taken by the radiator for thermal output meanwhile 1.1 kW of electrical power is gained from the engine (called system in figure 4). In Austria a power plant having a 35 kW electrical output was designed. Data of the engine is described by Table 2.Error! Reference source not found.
Table 2. Average results of test performance of a 35 kWe Stirling pilot plant. Data compared to design targets (Biedermann, et al., 2003).
Average results of test runs performed at the 35 kWe pilot plant compared to design target
Design target
Obtained during test runs
Temperature of the preheated air °C 550 360
Temperature of the cooling water at Stirling cooler inlet °C 55 61
Electric power output kW 35 31
Thermal power output - Stirling engine kW 105 124
Thermal power output - CHP plant kW 215 272
Fuel power input kW 291 337
Fuel consumption (w.b) (water content approx. 30 wt %) kg/h
85 96
Electric efficiency - Stirling engine % 25.0 20.0
Overall electric efficiency % 12.0 9.2
Overall efficiency - CHP plant % 85.9 90.0

10
An existing 4-cylinder Stirling engine with data described in Table 2 consumes 96 kg/h of fuel power inputs. For calculating data from the obtained results are used for further investigations. This due to the wish of using worst-case scenario when implementing the technology to the simulation model later on in the study. If the model using worst-case is successful the possibility of success in real nature then will be higher. The input of 96 kg/h then provides a true electrical output of 31 kW and a thermal output of 124 kW (Biedermann, et al., 2003). Using the parameters for this study may create representative and reliable results to compare in the analysis.
1.1.9. Complements for power generation
In order to make the engine flexible and be able to adjust the power generation to the demand, different technologies can be considered together with the Stirling engine. Since Bolivia has a great amount of solar radiation available, especially in the south-west regions in the Andes, photovoltaic arrays (PV) can be a good complement for rural electrification, (see next section).
Table 3. Characteristic parameters of PV-module tabulated (Mondol, et al., 2006).
Characteristic parameters of PV-module
Parameter Value
Nominal rated capacity of PV module 110 Wp
Number of solar cells 72
Rated current 3.15 A
Rated voltage 35.0 V
Area 0.87 m2
Short circuit current 3.45 A
Open circuit voltage 43.5 V
Number of modules in series 17
Number of modules in parallel 7
According to Table 3 a characteristic PV module of 0.87 m2 may have a power-output of 110 Wp. This value is variable since the area of the PV might be changed in the simulation. Optimizing the size of the PV then is another object beside the optimization of the Stirling engine. (Mondol, et al., 2006) Since the Stirling engine in the simulation will be cleaned once a day, see method, daily electricity production using Stirling technology will be down for 1 hour. In this case, the PV’s main issue will be to store electrical power in battery banks in order to be able to respond to the electrical demand better when the Stirling engine is shut down. Therefore cleaning the engine at the middle of the day is reasonable due to the solar-irradiation sent from the sun bringing most energy at that time a sunny day. In other words the PV and battery banks will cover up the absence of Stirling technology for shorter periods. Deciding size of the battery bank is then next objective for the PV system (Mondol, et al., 2006). In (Díaz, et al., 2011) different houses in five regions with centralized PV generators and AC distribution microgrids were analysed tabulated in Table 4.
11
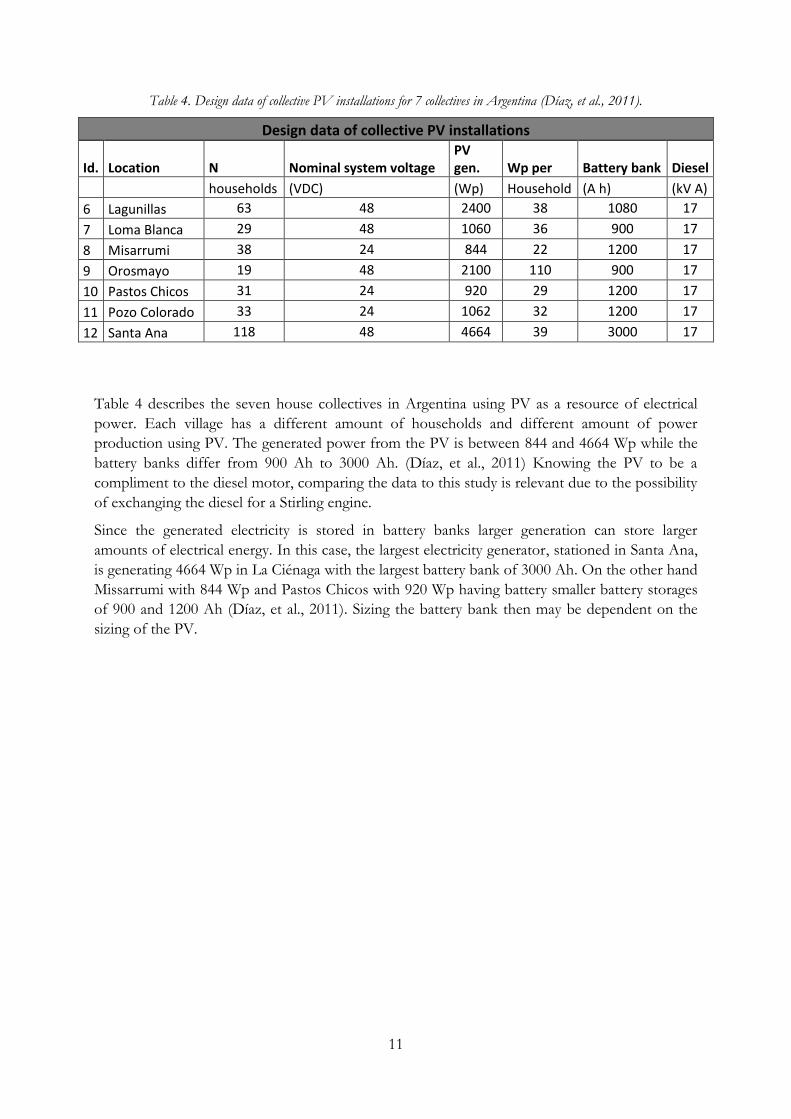
Table 4. Design data of collective PV installations for 7 collectives in Argentina (Díaz, et al., 2011).
Design data of collective PV installations
Id. Location N Nominal system voltage PV gen. Wp per Battery bank Diesel
households (VDC) (Wp) Household (A h) (kV A)
6 Lagunillas 63 48 2400 38 1080 17
7 Loma Blanca 29 48 1060 36 900 17
8 Misarrumi 38 24 844 22 1200 17
9 Orosmayo 19 48 2100 110 900 17
10 Pastos Chicos 31 24 920 29 1200 17
11 Pozo Colorado 33 24 1062 32 1200 17
12 Santa Ana 118 48 4664 39 3000 17
Table 4 describes the seven house collectives in Argentina using PV as a resource of electrical
power. Each village has a different amount of households and different amount of power
production using PV. The generated power from the PV is between 844 and 4664 Wp while the
battery banks differ from 900 Ah to 3000 Ah. (Díaz, et al., 2011) Knowing the PV to be a
compliment to the diesel motor, comparing the data to this study is relevant due to the possibility
of exchanging the diesel for a Stirling engine.
Since the generated electricity is stored in battery banks larger generation can store larger
amounts of electrical energy. In this case, the largest electricity generator, stationed in Santa Ana,
is generating 4664 Wp in La Ciénaga with the largest battery bank of 3000 Ah. On the other hand
Missarrumi with 844 Wp and Pastos Chicos with 920 Wp having battery smaller battery storages
of 900 and 1200 Ah (Díaz, et al., 2011). Sizing the battery bank then may be dependent on the
sizing of the PV.

12
1.2. Bolivia
The aim of this section is to motivate the selection of Bolivia as a feasible scenario for this
project. For this purpose, the economical, geographical and energetic aspects of the country are
briefly presented and discussed.
The country of Bolivia is ranked in the position 108 of the Human Development Index report
2013 published every year by the United Nations. This position in the rank implies a medium
human development that can be comparable to countries like China, Thailand, Paraguay or Egypt
(United Nations Development Programme, 2013).
1.2.1.Geographical characteristics
Bolivia is a country positioned in the middle of South America between the Tropic of Cancer and
the Tropic of Capricorn. The country is landlocked, meaning it has no access to the seas since it
is surrounded by other countries. The neighbouring countries are Brazil in the north and east,
Paraguay in the east, Argentina and Chile in the south and Peru in the west. The topographic
characteristics of the country vary widely along the geography. In the south the country possesses
the Andean mountains with altitudes over 2500 meters above sea level which complicates
communication in the area. Further on in the north territory the terrain is dominated by rain
forest and tropical climate while the eastern part of the country contains agricultural areas and
deserts (Morales, et al., 2004).
In terms of territory, 52.7 % of the land area is occupied with forests and 34.1 % of the land area
is considered agricultural land (United Nations Development Programme, 2013).
1.2.2. Social and political aspects
Bolivia, or as officially known Plurinational State of Bolivia, was formed in 1825 as stated on its
Constitution. The form of government is participatory democracy and the capital of Bolivia is the
city of Sucre, although the seat of the government is located in La Paz (Politic Constitution of
Bolivia, 2009).
Bolivia is the only country in America where the indigenous ethnics groups still represent the
majority of the population. The population is mainly concentrated in a small number of cities but
also is sparsely distributed in distant rural areas (Morales, et al., 2004). The population of the
country in 2012 was 10.2 million from which a 67.2 % was living in urban areas (United Nations
Development Programme, 2013).
Administratively, the country is divided in 9 departments- Pando, La Paz, Beni, Oruro,
Cochabamba, Santa Cruz, Potosi, Chuquisaca and Tarija. The departments are divided into 112
provinces and those ones in 339 municipalities (Politic Constitution of Bolivia, 2009).
13
1.2.3. Energy scenario
In the country of Bolivia, 22.5 % of the population does not have access to electricity which
means around 2.3 millions of people (United Nations Development Programme, 2013). The
electricity generation as well as the demand in Bolivia varies widely through the country.
The electric system in Bolivia is divided in two different sections, the National Interconnected
System (SIN), and the Isolated Systems. The production of electricity comes from hydroelectric
(40%) and thermoelectric stations (60%) (Viceministerio de Electricidad y Energías Alternativas,
2010). In 2009, 92% of the total electricity produced in the country was part of the SIN. The
electricity generation for the isolated systems is found in those places not covered by the SIN and
the highest demand is found in the departments of Tarija, Beni, Pando and Santa Cruz (Comité
Nacional de Despacho de Carga, 2014).
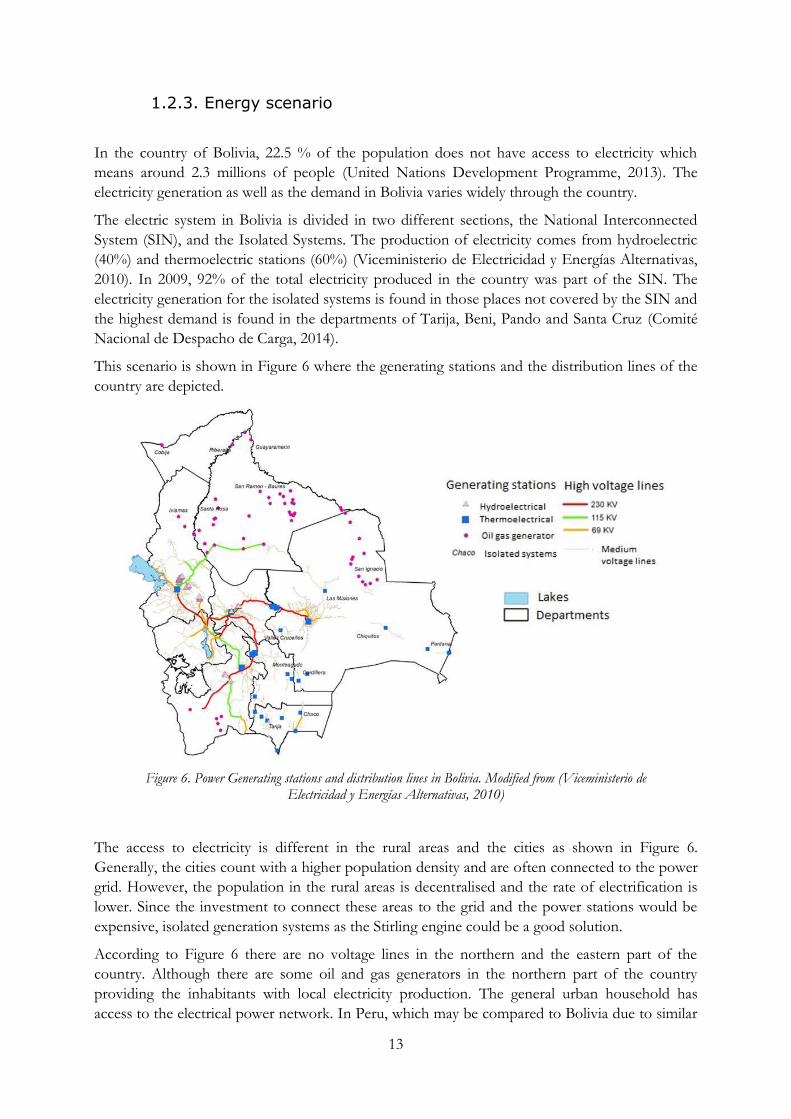
This scenario is shown in Figure 6 where the generating stations and the distribution lines of the
country are depicted.
Figure 6. Power Generating stations and distribution lines in Bolivia. Modified from (Viceministerio de Electricidad y Energías Alternativas, 2010)
The access to electricity is different in the rural areas and the cities as shown in Figure 6.
Generally, the cities count with a higher population density and are often connected to the power
grid. However, the population in the rural areas is decentralised and the rate of electrification is
lower. Since the investment to connect these areas to the grid and the power stations would be
expensive, isolated generation systems as the Stirling engine could be a good solution.
According to Figure 6 there are no voltage lines in the northern and the eastern part of the
country. Although there are some oil and gas generators in the northern part of the country
providing the inhabitants with local electricity production. The general urban household has
access to the electrical power network. In Peru, which may be compared to Bolivia due to similar

14
environment and financial situation, 70% of the households have electricity- usage less than 30
kWh a month (Energy Sector Management Assistance Program, 2010).
In the general rural households instead, and due to the lack of access to the energy network,
alternatives as batteries or the use of biomass are currently the common solutions. In a
governmental program about electricity and needs for a life with dignity, an amount of 20
kWh/month/user has been identified as the minimum required electricity for fulfilling the energy
demand of rural households (Viceministerio de Electricidad y Energías Alternativas, 2010).
The major energy use in households is heating up water for cooking. Up to 70% of rural areas in
Bolivia use biomass as the primary energy source. This source stands for about a third of the total
energy use with a yearly rate of 965.000 tons of firewood and 263.000 tons of dung a year.
(Energy Sector Management Assistance Program, 2007)
The firewood as an energy source is expensive in Bolivia. This is due to transportation costs
whenever the forest is not close to the user. Therefore households experience high costs from
their energy demand in order to keep their lives going (Energy Sector Management Assistance
Program, 2007). 20.9 % of the energy used in the country is supplied from renewable sources
(United Nations Development Programme, 2013).
Industries in rural countryside of Bolivia are estimated to an approximately amount of 4000.
Generally the industries use biomass as a primary source for heating. These industries produce
food and goods as shown in (Energy Sector Management Assistance Program, 2007) where the
energy use has different affects to the production costs for different industries. For instance, the
largest effects coming from energy consumption are in lime production where the energy use
stands for about 69% of the lime cost. The reason for these high energy use costs is the
transportation of firewood going far distances from forest to industry. (Energy Sector
Management Assistance Program, 2007)
The rural industries of Bolivia create about 20000 non-agricultural jobs. Developing these
industries and creating more job opportunities is important for further growth of the country and
the population (Energy Sector Management Assistance Program, 2007).
1.2.4. Resources
Bolivia has access to one of the richest reserves of fossil fuels in the world. The economy of the
country is sustained in farming and agriculture, hydrocarbons and mining. The decline of mining
trough the last 20 years has brought about a fast development of hydrocarbons industry due to
exports. The governmental policies to facilitate the extraction and treatment of hydrocarbons
have converted investments in the area into a much more beneficial option (Sachs, 1989).
One of the major issues of Bolivia is the weakly developed industry. The country is one of the
poorest in South America and many of the basic needs of Bolivia are covered by imports.
Additionally, difficulties exist in exploiting the natural potential of the country due to a weak
governmental structure and the already mentioned weak industry (Weisbrot, et al., 2009).
On the other hand, Bolivia counts with a high capability of producing energy from renewable
energy sources what might be the solution for the electrification of rural areas with a highly
dispersed population (Martinot & Reiche, 2000).

15
Figure 7. Potential for energy generation from renewable sources (Viceministerio de Electricidad y Energías Alternativas, 2010).
As shown in Figure 7 the major part of the country has some kind of biomass potential to be
used for energy purpose. Using the biomass for the Stirling engine seems to be reasonable in the
northern or eastern parts of the country. Meanwhile a potential Stirling engine using solar heating
could be installed in the south-west of Bolivia due to the solar potential depicted in Figure 7.
As mentioned before, Bolivia has a high potential for the production of electricity from
renewable energy sources. For instance, 2/3 of the country are located in an area with the highest
solar radiation of the world, being the Altiplano and Los Valles the areas with highest average of
solar radiation.
Basic needs as cooking, heating or even small scale industries as manufacturing of bricks are
fulfilled with the energy from the biomass. The areas with greatest potential for producing energy
from the Biomass are El Trópico and Los Valles. The biomass access per year may be depicted as
shown in Figure 8 below (Energy Sector Management Assistance Program, 2007).
Figure 8. Available resources of Biomass for energy production in Bolivia. (United Nations, 2012)
Annual Production of
Biomass in Bolivia

16
Figure 8 illustrates the annual production of biomass in Bolivia. The annual production is higher
in the northern and the eastern areas due to the access of rainforests. Biomass might then be seen
as a logical energy source for Stirling technology. In the southern mountainous part of the
country, biomass is slightly available.
17
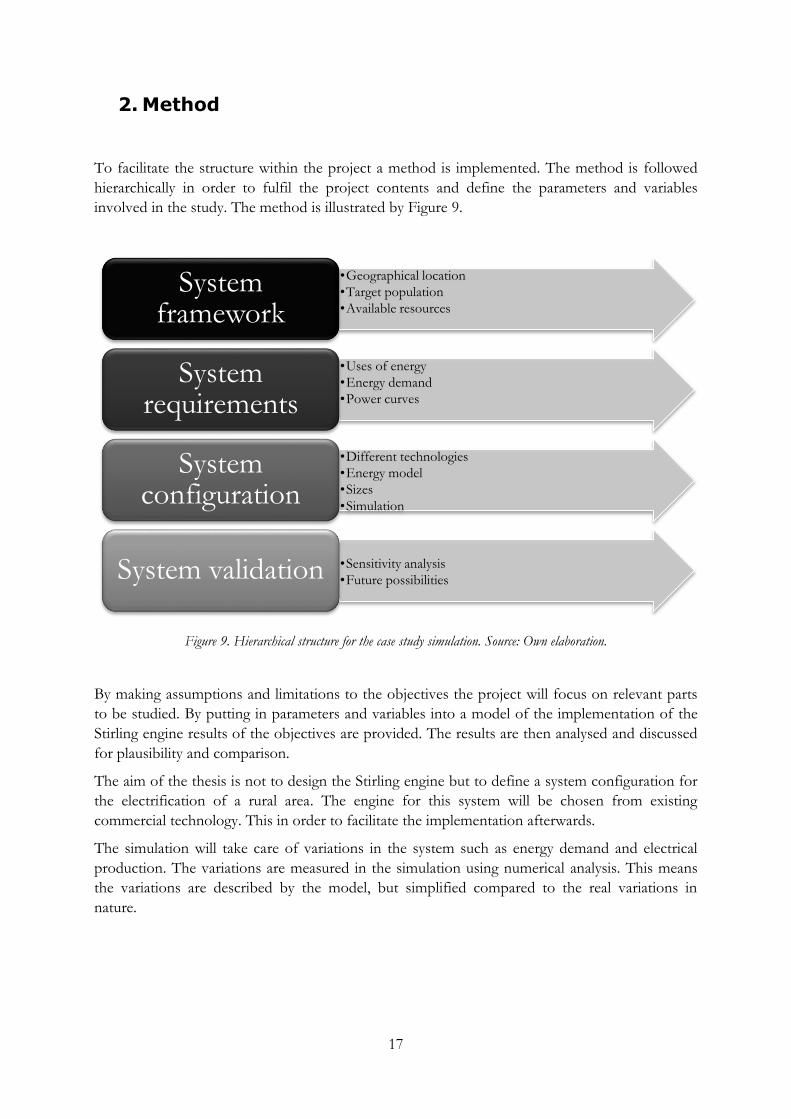
2. Method
To facilitate the structure within the project a method is implemented. The method is followed
hierarchically in order to fulfil the project contents and define the parameters and variables
involved in the study. The method is illustrated by Figure 9.
Figure 9. Hierarchical structure for the case study simulation. Source: Own elaboration.
By making assumptions and limitations to the objectives the project will focus on relevant parts
to be studied. By putting in parameters and variables into a model of the implementation of the
Stirling engine results of the objectives are provided. The results are then analysed and discussed
for plausibility and comparison.
The aim of the thesis is not to design the Stirling engine but to define a system configuration for
the electrification of a rural area. The engine for this system will be chosen from existing
commercial technology. This in order to facilitate the implementation afterwards.
The simulation will take care of variations in the system such as energy demand and electrical
production. The variations are measured in the simulation using numerical analysis. This means
the variations are described by the model, but simplified compared to the real variations in
nature.
•Geographical location
•Target population
•Available resources
System framework
•Uses of energy
•Energy demand
•Power curves
System requirements
•Different technologies
•Energy model
•Sizes
•Simulation
System configuration
•Sensitivity analysis
•Future possibilitiesSystem validation

18
2.1. System framework
In order to perform a proper analysis of the case study, it is necessary to define a framework that
limits the boundaries and establishes the parameters of the model. This framework brings data
such the geographical characteristics of the chosen location, the targeted population of the study
and the resources that are available for the inhabitants.
2.1.1. Geographical location
As presented before, the country of Bolivia is divided into departments. The first decision to
make is deciding the area of the country where the electrification should be implemented. This
decision will determine the available resources for power generation as the solar radiation or the
biomass.
Taking in account Figure 8, the departments with higher amount of biomass available are located
in the north of the country, for instance, Beni or Pando. This fact might serve as motivation for
the decision since the potential of the biomass Stirling engine in this area is higher.
Furthermore, the energy situation of the population and habitants living there can be compared
for different departments with data from the last survey on the housing and basic services carried
out by (Instituto Nacional de Estadística, 2014).
Table 5. Electricity access in rural areas divided by departments (Instituto Nacional de Estadística, 2014).
As can be seen in Table 5, the departments with the lower electrification rate in rural areas are
Beni, Pando and Chuquisaca. If considered in number of individuals without access to electric
energy, then La Paz is the most affected department due to the combination of a big rural
population and a high non-electrification ratio of 75.53%.
Table 6. Energy sources usage for cooking in rural areas divided by departments (Instituto Nacional de Estadística, 2014)
TOTAL CHUQUISACA LA PAZ COCHABAMBA ORURO POTOSÍ TARIJASANTA
CRUZBENI PANDO
Population (inhabitants) 766703 68401 231188 150966 45472 120949 29728 94195 19868 5936
Acces to electricity (%) 24,7 14,7 24,5 36,0 21,8 15,1 32,2 28,8 12,3 19,3
No access to electricity (%) 75,3 85,3 75,5 64,0 78,2 84,9 67,8 71,2 87,7 80,7
Population without electricty
(inhabitants)577174 58346 174616 96573 35555 102710 20153 67039 17416 4790
Access to electric energy in rural areas
TOTAL CHUQUISACA LA PAZ COCHABAMBA ORURO POTOSÍ TARIJASANTA
CRUZBENI PANDO
Population (inhabitants) 766703 68401 231188 150966 45472 120949 29728 94195 19868 5936
Timber (%) 75,1 91,9 60,5 77,7 72,1 84,2 84,4 76,3 95,0 84,4
Manure (%) 10,4 0,2 26,6 3,6 13,8 4,7 1,4 0,1 0,1 0,1
Kerosene (%) 0,4 0,1 1,0 0,1 0,3 0,1 0,1 0,1 0,4 0,3
Gas (%) 13,6 7,4 11,1 18,2 13,5 10,6 13,3 22,7 4,0 13,7
Electricity (%) 0,1 0,0 0,2 0,0 0,1 0,1 0,0 0,0 0,0 0,0
Others (%) 0,1 0,1 0,1 0,1 0,0 0,1 0,1 0,1 0,1 0,5
No use (%) 0,4 0,3 0,6 0,3 0,2 0,2 0,7 0,6 0,5 1,0
Distribution of energy sources for cooking in rural areas
19
In Table 6 the main energy sources for cooking in the households are presented as well as their
acceptance among the population. In general, wood and timber are the most used resources and
in departments as Beni, merely the only one in use. Sources such as gas or kerosene have a
limited use in rural areas due to the difficulties in the supplying process.
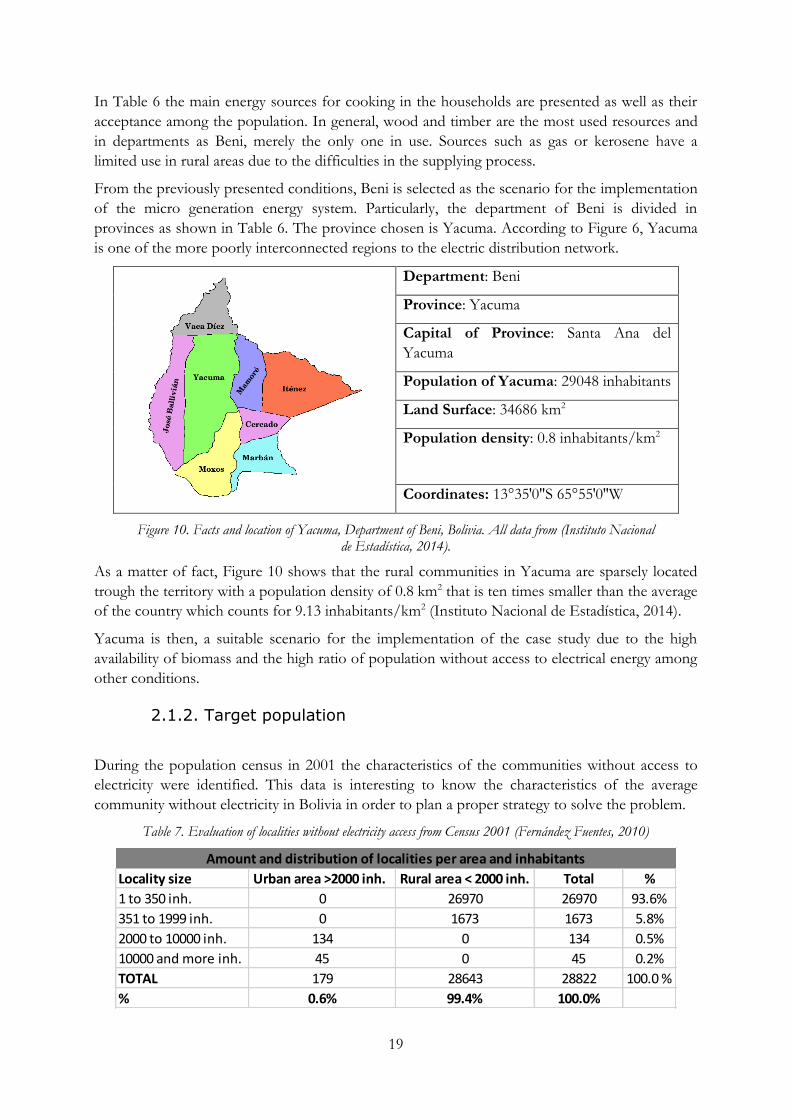
From the previously presented conditions, Beni is selected as the scenario for the implementation
of the micro generation energy system. Particularly, the department of Beni is divided in
provinces as shown in Table 6. The province chosen is Yacuma. According to Figure 6, Yacuma
is one of the more poorly interconnected regions to the electric distribution network.
Department: Beni
Province: Yacuma
Capital of Province: Santa Ana del
Yacuma
Population of Yacuma: 29048 inhabitants
Land Surface: 34686 km2
Population density: 0.8 inhabitants/km2
Coordinates: 13°35′0″S 65°55′0″W
Figure 10. Facts and location of Yacuma, Department of Beni, Bolivia. All data from (Instituto Nacional de Estadística, 2014).
As a matter of fact, Figure 10 shows that the rural communities in Yacuma are sparsely located
trough the territory with a population density of 0.8 km2 that is ten times smaller than the average
of the country which counts for 9.13 inhabitants/km2 (Instituto Nacional de Estadística, 2014).
Yacuma is then, a suitable scenario for the implementation of the case study due to the high
availability of biomass and the high ratio of population without access to electrical energy among
other conditions.
2.1.2. Target population
During the population census in 2001 the characteristics of the communities without access to
electricity were identified. This data is interesting to know the characteristics of the average
community without electricity in Bolivia in order to plan a proper strategy to solve the problem.
Table 7. Evaluation of localities without electricity access from Census 2001 (Fernández Fuentes, 2010)
Locality size Urban area >2000 inh. Rural area < 2000 inh. Total %
1 to 350 inh. 0 26970 26970 93.6%
351 to 1999 inh. 0 1673 1673 5.8%
2000 to 10000 inh. 134 0 134 0.5%
10000 and more inh. 45 0 45 0.2%
TOTAL 179 28643 28822 100.0 %
% 0.6% 99.4% 100.0%
Amount and distribution of localities per area and inhabitants
20
As seen in Table 7, 93.6 % of the localities without access to electricity are located in rural areas
and count with an amount of inhabitants between 1 and 350. The maximum number of
households in this localities is 24 and the minimum 13, with an average value of 16 (Fernández
Fuentes, 2010).
The consider number of households for the present case study is chosen to be 24 in relation to
the statement above. The motivation of this decision is to design a feasible solution that might fit
the totality of scenarios in the 93.6% of the municipalities and therefore, 24 households is the
worst case scenario, meaning the maximum required size of the installation.
2.1.3. Available resources
The resources that have an impact in the performance and feasibility of the proposed energy
generation system are mainly three - biomass, solar irradiation and money. In order to proceed
with the simulation, the values for those resources must be defined for the region of Yacuma.
However, since the focus and objective of the project is to study a specific technical solution for
the problem of electrification, the economic aspect is disregarded in this study.
A important parameter to be defined is the amount of biomass resource available to run the
engine. Taking in account the population density of 0.8 inhabitants per km2 listed in Figure 10,
and considering an amount of 350 inhabitants in the locality (Fernández Fuentes, 2010), the
available area to obtain resources for the community would be 437.5 km2. The biomass resource
in Yacuma according to Figure 8 is 1400 m3 per km2 and year. Therefore, the total available
amount of biomass per year for the defined region is 612500 m3. Considering the density of
wood pellets being around 650 kg/m3 (see Appendix E), the yearly amount of biomass for the
defined village in Yacuma is approximately 400 tons a year.
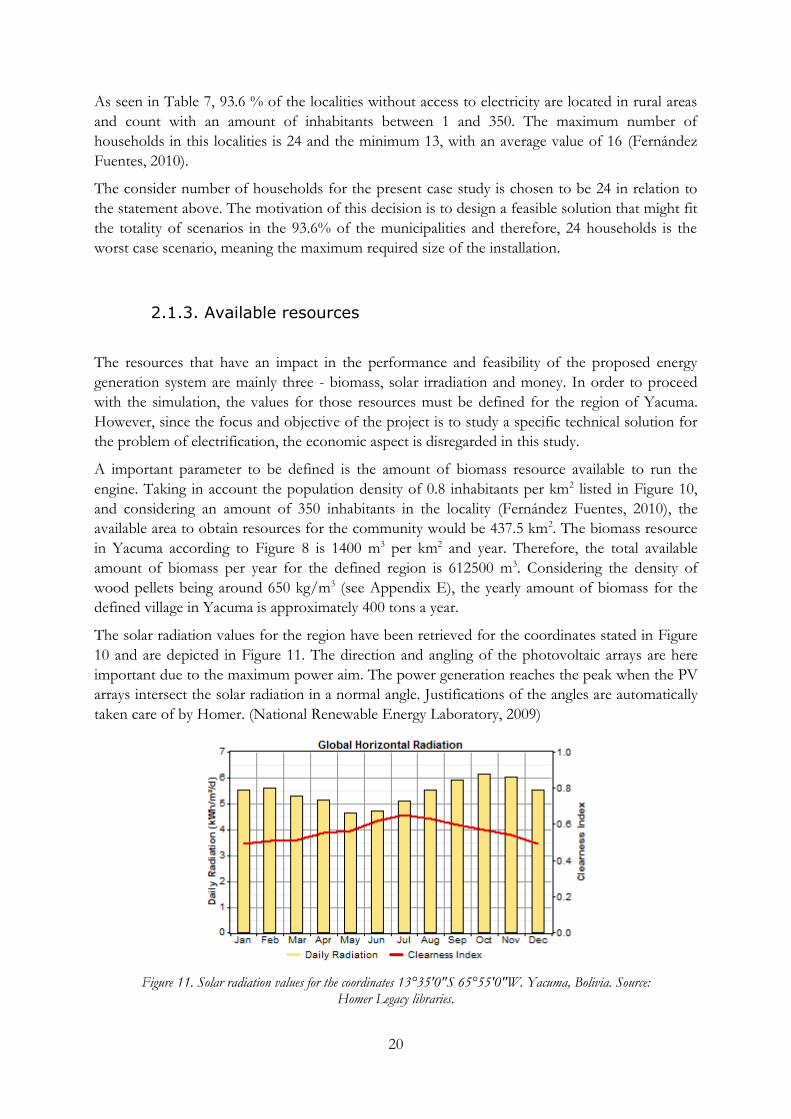
The solar radiation values for the region have been retrieved for the coordinates stated in Figure
10 and are depicted in Figure 11. The direction and angling of the photovoltaic arrays are here
important due to the maximum power aim. The power generation reaches the peak when the PV
arrays intersect the solar radiation in a normal angle. Justifications of the angles are automatically
taken care of by Homer. (National Renewable Energy Laboratory, 2009)
Figure 11. Solar radiation values for the coordinates 13°35′0″S 65°55′0″W. Yacuma, Bolivia. Source: Homer Legacy libraries.
21
An annual average of 5.43 kWh per m2 and day is appreciated in Figure 11. Additionally, it might
also be seen that the seasonal variation is narrow, and therefore the operating conditions of the
power generation system will be steady which allows to follow the same strategy to attend the
demand during all the year.
.
2.2. System requirements
When the framework is completed, defining the scenario needs is further on done with the
requirements. In order to understand and exploit the possibilities of the Stirling engine in rural
Bolivia determining the power output-need is important for the system.
2.2.1. Use of energy
The electric consumption in rural areas in Bolivia is limited to basic needs. These needs are
basically categorised as lighting, communication (radio, television), charging of devices (phones)
and in some occasions small household appliances as refrigerators. On the other hand, the
thermal demands are reduced to water heating and cooking. Therefore, the introduction of CHP
systems is suitable for providing both forms of energy with a high efficiency (United Nations,
2012).
Moreover, the so-called social power demands include street lighting, water pumping or the
energy used in services such schools or radio transmissions (Fernández Fuentes, 2010).
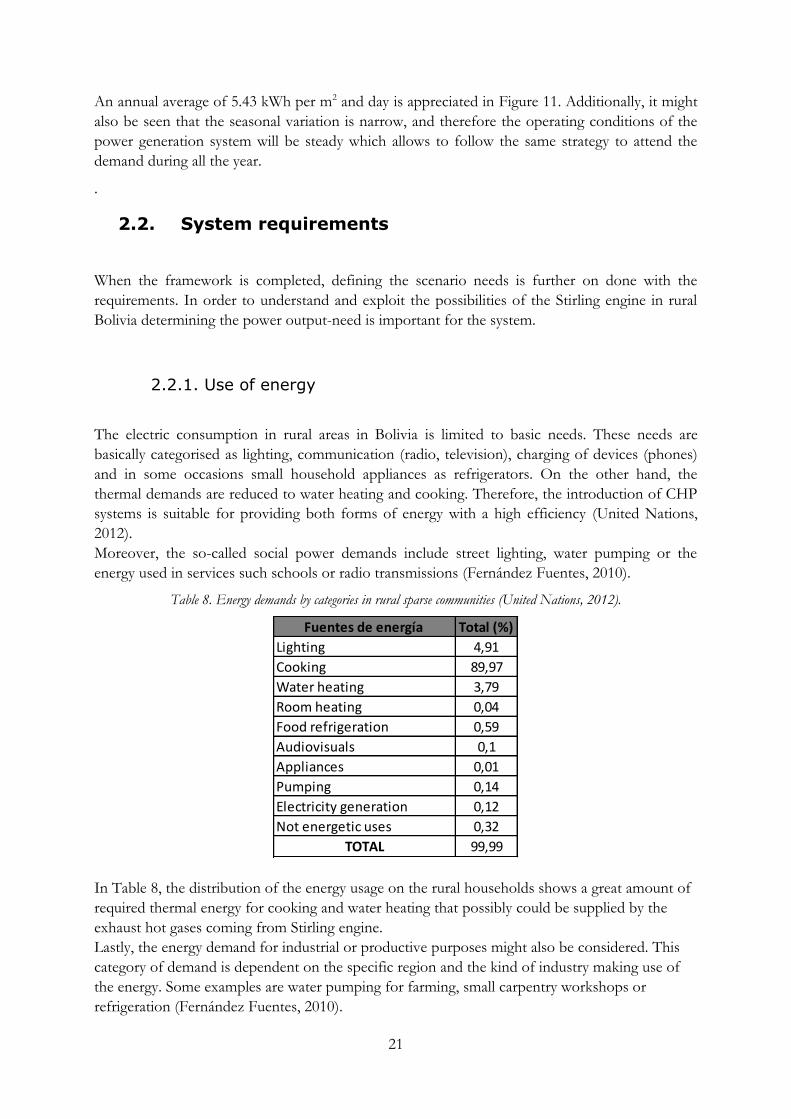
Table 8. Energy demands by categories in rural sparse communities (United Nations, 2012).
In Table 8, the distribution of the energy usage on the rural households shows a great amount of
required thermal energy for cooking and water heating that possibly could be supplied by the
exhaust hot gases coming from Stirling engine.
Lastly, the energy demand for industrial or productive purposes might also be considered. This
category of demand is dependent on the specific region and the kind of industry making use of
the energy. Some examples are water pumping for farming, small carpentry workshops or
refrigeration (Fernández Fuentes, 2010).
Fuentes de energía Total (%)
Lighting 4,91
Cooking 89,97
Water heating 3,79
Room heating 0,04
Food refrigeration 0,59
Audiovisuals 0,1
Appliances 0,01
Pumping 0,14
Electricity generation 0,12
Not energetic uses 0,32
TOTAL 99,99

22
2.2.2. Energy demand
The power demand of the village can be classified in terms of energy form – electric and thermal
as stated above. The waste heat out of the Stirling engine might be directly used for cooking or
heating water increasing the overall efficiency of the energy generation in a CHP system.
However, the study focus is the electrification of the rural area and consequently the thermal
appliances are not considered, although some simulation results are shown to remind that CHP
systems are an important solution and future works might be focused on this aspect.
As presented in (Fernández Fuentes, 2013), the electric demands in rural areas of Cochabamba
are mainly domestic since there is not an industrial development in these areas. In such case, only
considering domestic demands, an amount of 45 kWh per month and household is a common
value. Considering the previously defined locality of 24 households, the daily demand to the
energy network is 36 kWh/day. Although this prediction is based on Cochabamba area, it is
assumed that the figures for the region of Beni are equivalent and valid for the simulation.
In addition, a second situation of energy demand is studied including in that case energy demand
for social purposes. In that case, an extra of 20 kWh per month and household is introduced
leading to a total demand to the system of 52 kWh per day (Fernández Fuentes, 2010).
2.2.3. Power curves
Once the total energy demand of the area has been decided, defining the electrical energy
consumed over time is necessary i.e. using power demand curves. From data available in (Comité
Nacional de Despacho de Carga, 2014) for the district of Cochabamba, hourly values of energy
demand for the day 15th of each month of the year 2013 have been taken. Once again, due to the
lack of available data for the municipality of Yacuma, the power demand trends are assumed to
be the same as the district of Cochabamba.
Therefore, a set of 288 hourly values have been collected. In order to extend the data in a realistic
way to the 8760 hours of a year, a random variability has been introduced and new values have
been computed. A variability of 0.05% has been introduced to create the values from one time
step to the next. Additionally, a variation of a 5% has been selected from one day to another
(Sanjínes Tudela, 2011).
With this approach, the seasonal dependence in the trends is maintained since the values for each
month are computed from a real set of values of the same month.
23
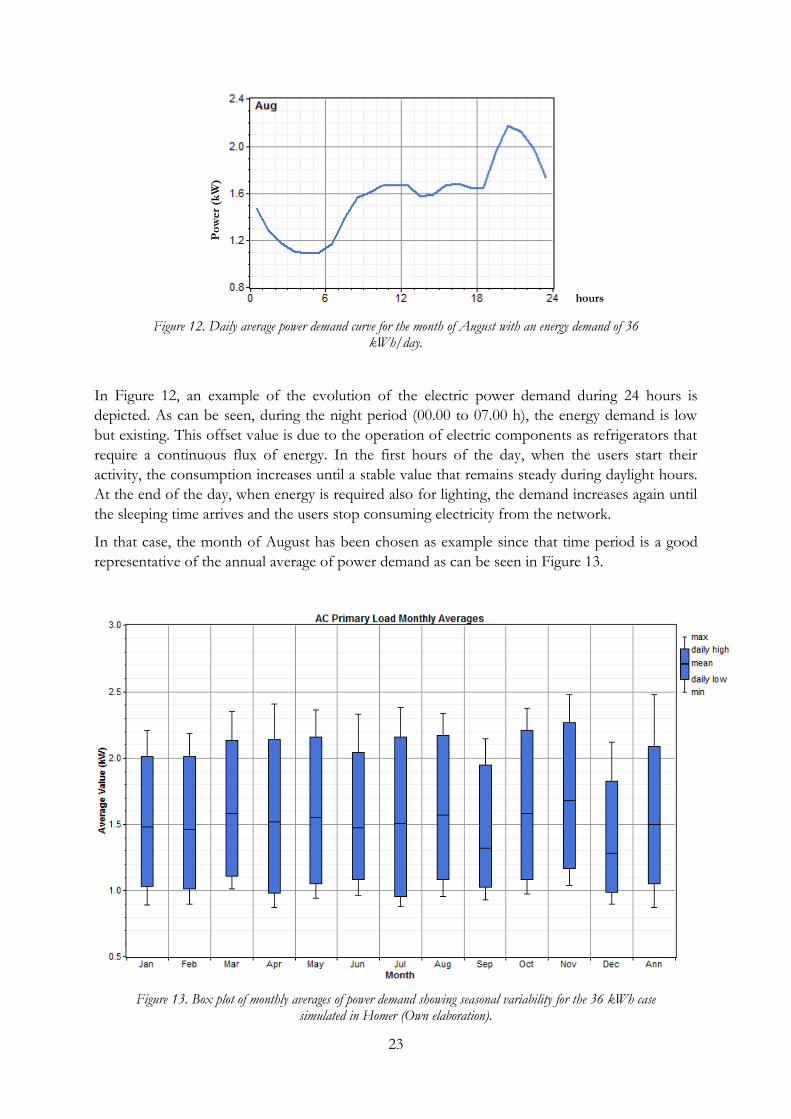
Figure 12. Daily average power demand curve for the month of August with an energy demand of 36 kWh/day.
In Figure 12, an example of the evolution of the electric power demand during 24 hours is
depicted. As can be seen, during the night period (00.00 to 07.00 h), the energy demand is low
but existing. This offset value is due to the operation of electric components as refrigerators that
require a continuous flux of energy. In the first hours of the day, when the users start their
activity, the consumption increases until a stable value that remains steady during daylight hours.
At the end of the day, when energy is required also for lighting, the demand increases again until
the sleeping time arrives and the users stop consuming electricity from the network.
In that case, the month of August has been chosen as example since that time period is a good
representative of the annual average of power demand as can be seen in Figure 13.
Figure 13. Box plot of monthly averages of power demand showing seasonal variability for the 36 kWh case simulated in Homer (Own elaboration).
hours
Po
wer
(kW
)

24
The box plot presented in Figure 13 depicts the seasonal variations of power demand during the
year. The month of August is a good representative of the year average with an approximate
value of 1.6 kW power demand. It might also be seen that the differences between months are
narrow. This factor avoids the problem of oversizing the system to fulfil punctual fluctuations
over the normal margins and therefore, the sizing of the installation can be done in an optimal
way. The power peak during the year is found in the month of November with a value of around
2.5 kW.
In the case of 52 kWh per day, the monthly averages are around 2.2 kW with a peak power
demand of 3.6 kW.

25
2.3. System configuration
The main power generator for the current system is a Stirling engine. As a complement to the
power supply and in order to provide an increased flexibility for the generation strategies,
photovoltaic technology and a battery bank are employed together with the engine in a hybrid
system. Additionally, a power converter to adapt the electric energy from generated DC to
demanded AC is required.
2.3.1.Energy model
In order to do a simulation of the system, an energy model is required to start the analysis. The
conceptual model of the system is divided in two main categories, power demand and power
generation. The electric power demand must be fulfilled from the inputs to the system coming
from both the Stirling engine and the photovoltaic array. At that point, both the resources and
the needs that system must satisfy have been defined and the strategy for the operation of the
system is decided.
The energy flow from the input resources to the final user model is depicted in Figure 14.
Figure 14. Conceptual model of Stirling engine and Photovoltaic being implemented to an electrical power demand
The biomass is burned in the combustor, as described in Figure 14, providing the Stirling engine
with the heat necessary to operate. The engine transforms the heat into mechanical work that is
used in a DC alternator to generate the electrical power output. This electricity can be either used
as it is produced to satisfy the demand or stored in the battery bank. For the present system, the
engine is assumed to operate on nominal power output when connected, therefore the output
level from the engine is steady.
The energy flow depends on the electrical demand from the users of the network. If the electrical
power demand is high then the Stirling engine will provide electricity without storing it in the
battery bank and vice versa. Consequently, the electricity flow is stated in Figure 15.
Biomass
resource
Solar
radiation
Combustor
PV array
Stirling
Engine
Battery
bank
Converter Electric
demand
26
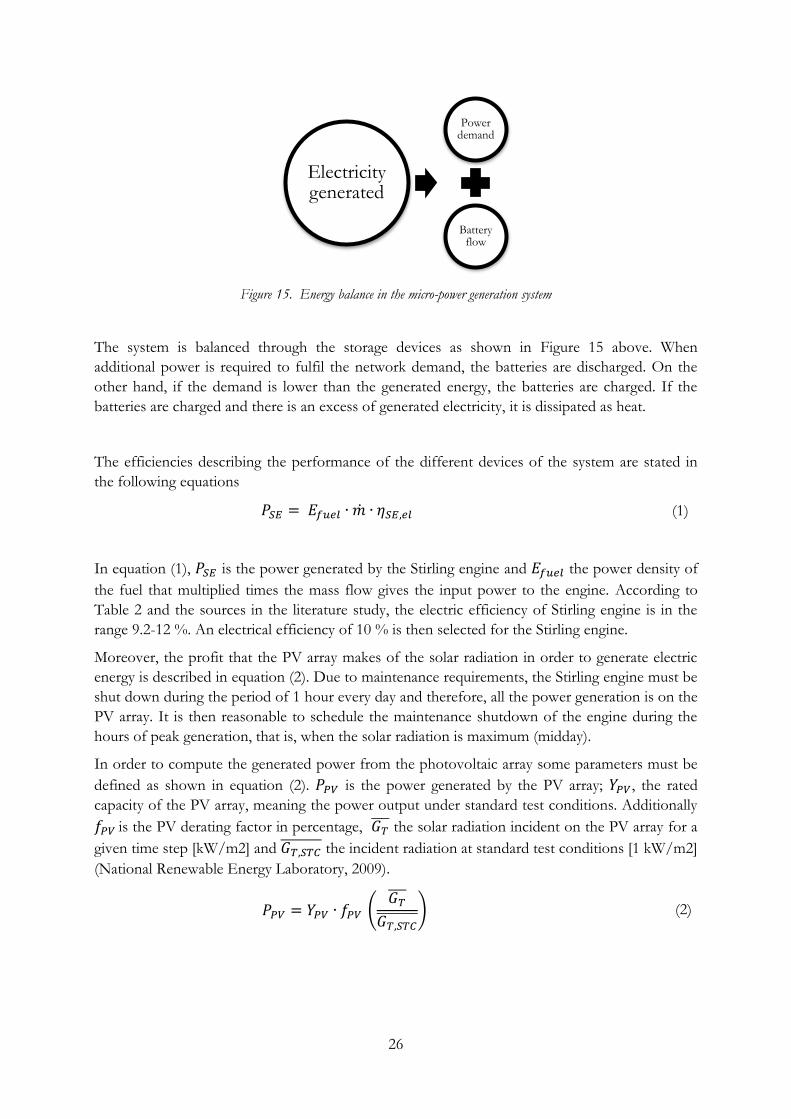
Figure 15. Energy balance in the micro-power generation system
The system is balanced through the storage devices as shown in Figure 15 above. When
additional power is required to fulfil the network demand, the batteries are discharged. On the
other hand, if the demand is lower than the generated energy, the batteries are charged. If the
batteries are charged and there is an excess of generated electricity, it is dissipated as heat.
The efficiencies describing the performance of the different devices of the system are stated in
the following equations
𝑃𝑆𝐸 = 𝐸𝑓𝑢𝑒𝑙 ∙ �̇� ∙ 𝜂𝑆𝐸,𝑒𝑙 (1)
In equation (1), 𝑃𝑆𝐸 is the power generated by the Stirling engine and 𝐸𝑓𝑢𝑒𝑙 the power density of
the fuel that multiplied times the mass flow gives the input power to the engine. According to
Table 2 and the sources in the literature study, the electric efficiency of Stirling engine is in the
range 9.2-12 %. An electrical efficiency of 10 % is then selected for the Stirling engine.
Moreover, the profit that the PV array makes of the solar radiation in order to generate electric
energy is described in equation (2). Due to maintenance requirements, the Stirling engine must be
shut down during the period of 1 hour every day and therefore, all the power generation is on the
PV array. It is then reasonable to schedule the maintenance shutdown of the engine during the
hours of peak generation, that is, when the solar radiation is maximum (midday).
In order to compute the generated power from the photovoltaic array some parameters must be
defined as shown in equation (2). 𝑃𝑃𝑉 is the power generated by the PV array; 𝑌𝑃𝑉, the rated
capacity of the PV array, meaning the power output under standard test conditions. Additionally
𝑓𝑃𝑉 is the PV derating factor in percentage, 𝐺𝑇̅̅̅̅ the solar radiation incident on the PV array for a
given time step [kW/m2] and 𝐺𝑇,𝑆𝑇𝐶̅̅ ̅̅ ̅̅ ̅̅ the incident radiation at standard test conditions [1 kW/m2]
(National Renewable Energy Laboratory, 2009).
𝑃𝑃𝑉 = 𝑌𝑃𝑉 ∙ 𝑓𝑃𝑉 (𝐺𝑇̅̅̅̅
𝐺𝑇,𝑆𝑇𝐶̅̅ ̅̅ ̅̅ ̅̅
) (2)
Power demand
Battery flow
Electricity generated

27
Once the electric energy is generated, the power might be directly used to fulfil the demand or be
stored in the battery bank as described in Figure 15. Therefore, the energy provided from both
the PV array and the Stirling engine might be divided in two categories.
𝑃𝑃𝑉 = 𝑃𝐷𝑈,𝑃𝑉 + 𝑃𝑆,𝑃𝑉 (3)
𝑃𝑆𝐸 = 𝑃𝐷𝑈,𝑆𝐸 + 𝑃𝑆,𝑆𝐸 (4)
𝑃𝐷𝑈,𝑃𝑉 and 𝑃𝐷𝑈,𝑆𝐸 are the power components provided by the PV array and the Stirling engine
respectively, that are directly used after being generated to fulfil the demand without going
through the batteries first. On the other hand, 𝑃𝑆,𝑃𝑉 and 𝑃𝑆,𝑆𝐸 represent the power provided by
the PV array and the Stirling engine that is stored in the battery bank.
The motivation for the division of each term in direct use or stored energy is the efficiency
related to each energy path. If the energy is stored in the battery bank, the losses associated to the
charge and discharge of the battery must be considered to compute the total generated power of
the system.
𝑃𝐺𝐸𝑁 in (5) stands for the total electric energy available in the system.
The efficiencies stated in (5) represent the losses that are related to the flow of energy through
the different devices. 𝜂𝑐𝑜𝑛𝑣 is the efficiency of the converter, 𝜂𝑐ℎ𝑎𝑟𝑔𝑒 the battery charge
efficiency and 𝜂𝑑𝑖𝑠𝑐ℎ𝑎𝑟𝑔𝑒 the battery discharge efficiency. Conventional values for these
parameters are found in the literature. In the case of the power converter, which in this case is an
inverter transforming the DC input to AC output, a value in the range of 90-95 % efficiency is
common. Regarding the battery, both charge and discharge efficiencies are assumed constant and
of the same value within the scope of this project. A common value in the literature is in the
range 85-90% (National Renewable Energy Laboratory, 2009). The efficiencies are therefore for
the study chosen to be 90% for both charging and discharging battery bank.
𝑃𝐺𝐸𝑁 is responding to the total demand of electrical power which means that all power generated
by Stirling engine may be sized to fit the demand. In addition the generated power using the
photovoltaic array will be changing but as high as possible due to the extra free solar input
whenever the weather is clear. Efficiencies are all in these calculations constant for easier
investigations.
The thermal power model is compared to the electrical with the Stirling engine as the only input
to the system. Due to the difficulties of calculating the demand of heat, the model is basically
studied to answer how much thermal energy the system can provide to the users on its normal
operation for electricity production. A conceptual model of the thermal energy flow is given
below in Figure 16.

28
Figure 16. Thermal energy flow, conceptual model with heat storage
The exhaust gases from the combustion of the biomass for heating the Stirling engine and the
heat rejected from the cooling system may be used for thermal energy demands. Since the
thermal demands vary depending on where the Stirling is placed, as mentioned before, the
thermal production of the system is considered only as a by-product and its production and
applications are not optimised within this project. As well as the battery bank for the electrical
model, heat from the Stirling engine may be stored in a heat storage tank. This tank may then
afterwards either be used for household use or for preheating the engine once again with lower
thermal energy loss as a consequence.
Heat
storage
Biomass
input
Burner Stirling
Engine
Thermal
demand

29
2.3.2. Technological specifications and sizing of system components
The Stirling engine to be used is model GENOA03 from Genoastirling SRL (GenoaStirling,
2014). The engine is of alpha-configuration and the electrical power generation for the engine is 3
kW. The heat sink is integrated in the engine and is water-cooled. The main structural material
used is aluminium. The components that must resist greater thermal forces and stresses are built
in stainless steel AISI 310 and 316, and the pistons are made of reinforced aluminium. The swept
volume of each cylinder is 522 cubic centimetres and the working fluid is air, which is appropriate
to avoid maintenance issues in the rural countryside where other fluids might not be available in
case of leaking. The working temperature at the end hot end is 750ºC but the engine starts
producing power output when 520ºC is reached. The speed is 600 revolutions per minute under
load and it does not require lubrication, which once again, is appropriate for usage in the rural
countryside for a reduced need of maintenance. The manufacturer states that the engine must be
inspected every 1000 hours of work. The total weight of the engine is 150 kg. For more technical
data about the selected engine, see appendixes B and C. In appendix A, an analogous model with
1 kWe output is also presented.
The combustion chamber must be wide enough to place the heat exchangers of the engine as
depicted in Figure 17. It must be suitable for burning the wood pellets and providing an even
distribution of heat in both exchangers. Different possibilities for burning strategies are presented
in appendix D.
Figure 17. Right: The red area identifies the heat exchangers of the engine that must be fit inside the combustion chamber. Left: The appropriate size of the combustion chamber to fit the engine exchangers
(GenoaStirling, 2014).
The photovoltaic array is selected according to the characteristics of the PV module described in
Table 3. The size of the PV is decided using Table 4 where PV arrays are used as a complement
to a diesel engine in a hybrid system similar to the one studied here with the Stirling engine for
electric power generation. As tabulated, 844 W are used for 38 households and 920 W for 31
households. Therefore, sizing the installed capacity of the PV modules to 900 W is at first sight, a

30
reasonable decision. However, further considerations regarding the size of the installed PV
capacity are to be discussed in the results.
As well as the PV capacity, the size of the battery bank has been decided according to the case
study presented in Table 4 to a value of 1200 Ah. The overall efficiency for charging and
discharging is assumed to be 80% and the voltage level 24 V.
Other strategies to size the capacity of battery banks suggest to assure an autonomy of 24-48
hours, which means that the batteries should be able to provide energy for the all the users
without any energy input to the system. In order to calculate this parameter, the nominal capacity
of a single battery, the voltage, the minimum state of charge allowed (SOC) and the average value
of the electric load must be defined as stated in equation (6) (National Renewable Energy
Laboratory, 2009).
𝐴𝑏𝑎𝑡𝑡 =𝑁𝑏𝑎𝑡𝑡∙𝑉𝑛𝑜𝑚∙𝑄𝑛𝑜𝑚∙(1−
𝑞𝑚𝑖𝑛100
)∙(24∙ℎ/𝑑)
𝐿𝑝𝑟𝑖𝑚,𝑎𝑣𝑒∙(1000∙𝑊ℎ/𝑘𝑊ℎ) (6)
Additionally the power converter is sized to fit the power demand. According to that, the inverter
is dimensioned responding to the maximum peak power demand expected so that all the energy
can be handle when required.
2.3.3. Simulation
Homer Legacy is a software using numerical calculation for simulating energy models. The
program is able to simulate multiple scenarios of power generation connecting different
technologies to fulfil a demand. Financial and energetic analysis can be performed to design
power systems and study the variables that take part in the simulations. Additionally it also allows
the user to perform sensitivity analysis in order to give better answer to the designing questions
(National Renewable Energy Laboratory, 2009)
In Figure 18 the different devices to consider for the system configuration already defined are
represented as boxes symbolizing energy input or energy output. The two black lines in Figure 18
indicate that the system gets alternating current (AC) or direct current (DC) from different energy
inputs. The energy inputs to consider are Stirling engine and Photovoltaic equipment (PV). Other
devices as the Batteries and the Converter are also depicted. The primary load box represents the
village power demand.
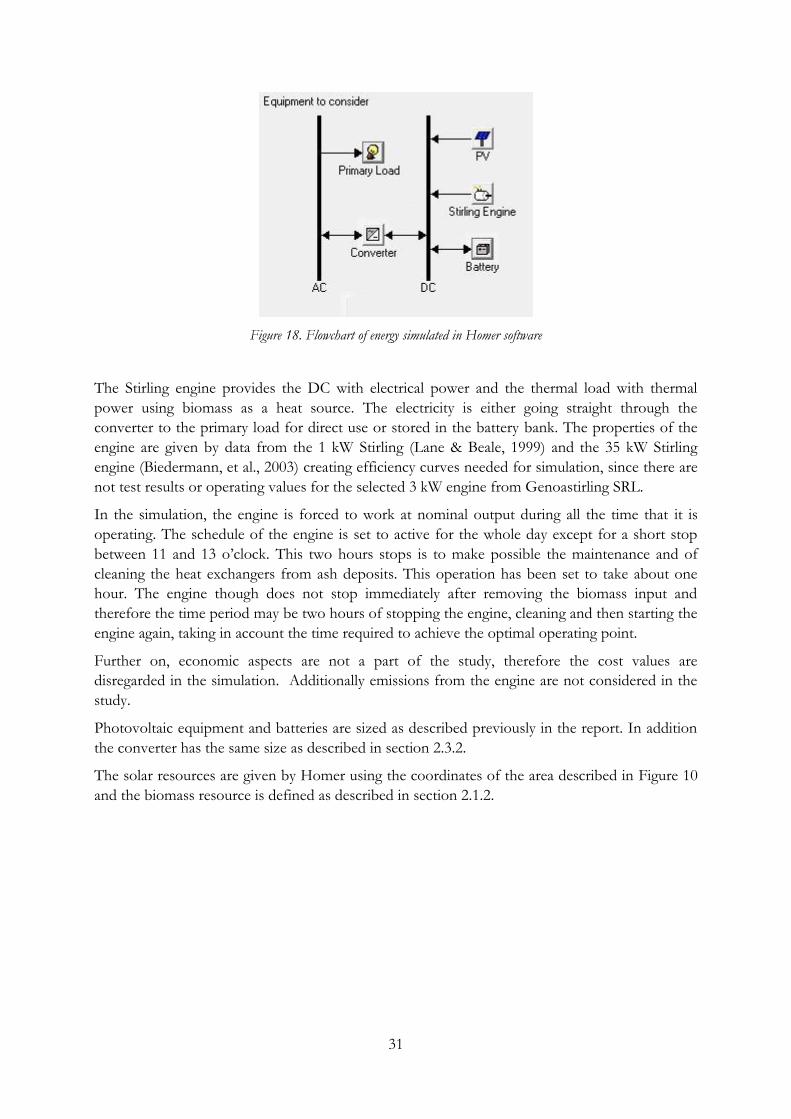
31
Figure 18. Flowchart of energy simulated in Homer software
The Stirling engine provides the DC with electrical power and the thermal load with thermal
power using biomass as a heat source. The electricity is either going straight through the
converter to the primary load for direct use or stored in the battery bank. The properties of the
engine are given by data from the 1 kW Stirling (Lane & Beale, 1999) and the 35 kW Stirling
engine (Biedermann, et al., 2003) creating efficiency curves needed for simulation, since there are
not test results or operating values for the selected 3 kW engine from Genoastirling SRL.
In the simulation, the engine is forced to work at nominal output during all the time that it is
operating. The schedule of the engine is set to active for the whole day except for a short stop
between 11 and 13 o’clock. This two hours stops is to make possible the maintenance and of
cleaning the heat exchangers from ash deposits. This operation has been set to take about one
hour. The engine though does not stop immediately after removing the biomass input and
therefore the time period may be two hours of stopping the engine, cleaning and then starting the
engine again, taking in account the time required to achieve the optimal operating point.
Further on, economic aspects are not a part of the study, therefore the cost values are
disregarded in the simulation. Additionally emissions from the engine are not considered in the
study.
Photovoltaic equipment and batteries are sized as described previously in the report. In addition
the converter has the same size as described in section 2.3.2.
The solar resources are given by Homer using the coordinates of the area described in Figure 10
and the biomass resource is defined as described in section 2.1.2.

32
3. Results and discussion
The results are in this chapter presented using plots from the simulation using Homer. The plots
will be showing charts of 2nd of January. This is done to easily compare the daily demand and
power generation of the system for the different scenarios. The results are presented in two cases,
the first case using the electrical demand of 24 households resulting in 36 kWh a day. Meanwhile,
the second simulation takes care of the previously described social power demand of the locality
with a daily amount of 52 kWh of electrical consumption. The total electric demand in case 1 is
depicted in Figure 19 as shown below.
Figure 19. Electric power demand through a day resulting in 36 kWh a day
In Figure 19 the night and morning electrical power demand is in the range of 1-1.3 kW and then
increasing during the day. At the middle of the day the demand is increasing further to 1.5 kW
until reaching the peak around 10 PM at 1.9 kW. The value of this peak is useful to size the
converter, since it must be capable of delivering the highest amount of power required during the
day from the system.
The power demand depicted in Figure 19 is quite similar each day during the year although the
yearly power peak for this scenario is 2.5 kW, which is below the nominal power output of the
engine. The power production from the Stirling engine is steady and repeated every day since no
disturbing factors are considered in the simulation. As mentioned earlier, the power generation
using PV though is dependent on the weather conditions and therefore presents a great
variability. The power generated is shown in following Figure 20.
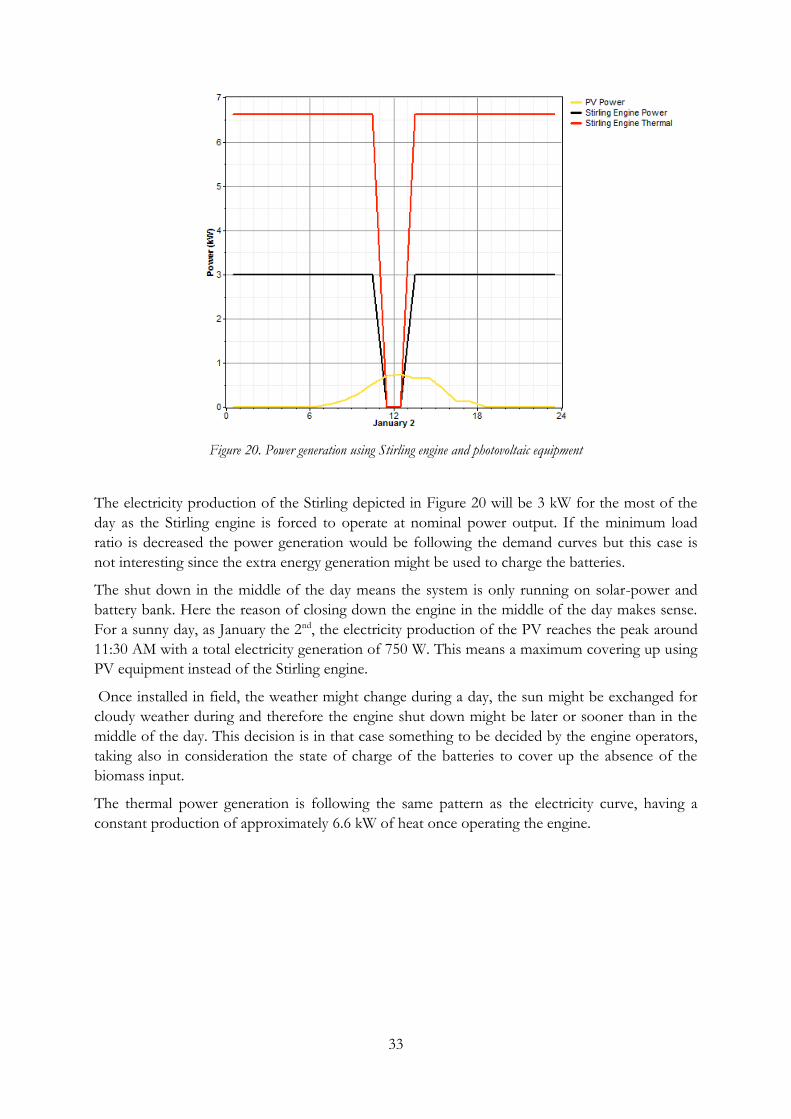
33
Figure 20. Power generation using Stirling engine and photovoltaic equipment
The electricity production of the Stirling depicted in Figure 20 will be 3 kW for the most of the
day as the Stirling engine is forced to operate at nominal power output. If the minimum load
ratio is decreased the power generation would be following the demand curves but this case is
not interesting since the extra energy generation might be used to charge the batteries.
The shut down in the middle of the day means the system is only running on solar-power and
battery bank. Here the reason of closing down the engine in the middle of the day makes sense.
For a sunny day, as January the 2nd, the electricity production of the PV reaches the peak around
11:30 AM with a total electricity generation of 750 W. This means a maximum covering up using
PV equipment instead of the Stirling engine.
Once installed in field, the weather might change during a day, the sun might be exchanged for
cloudy weather during and therefore the engine shut down might be later or sooner than in the
middle of the day. This decision is in that case something to be decided by the engine operators,
taking also in consideration the state of charge of the batteries to cover up the absence of the
biomass input.
The thermal power generation is following the same pattern as the electricity curve, having a
constant production of approximately 6.6 kW of heat once operating the engine.

34
When generating electricity the battery bank is storing electrical power. The battery bank scenario
of January the 2nd is depicted in Figure 21.
Figure 21. Battery state of charge compared to daily demand for the 36 kWh scenaro
As shown in Figure 21 the battery state of charge is 100% before Stirling engine shut down.
Once the engine is shut down the state of charge decreases to an amount of 83% and increases
again during the rest of the day having the Stirling engine ongoing.
The autonomy of the battery bank installed for this 36 kWh scenario is 4.8 hours computed with
equation (6). The energy balance is shown combining the previous charts in Figure 22.
Figure 22. Energy balance using the Stirling, photovoltaic and battery for the demand of 36 kWh/day

35
In Figure 22 the different components of the system balance the amount of electricity needed for
electric power demand. During the shutdown period of the Stirling engine, the power provided
by the photovoltaic array is not enough to fulfil the demand and the flow of power of the battery
is negative. This means that some energy is flowing out the battery to help achieve the power
demanded by the users. When the Stirling engine starts to produce again its nominal power, the
excess of electricity produced flows back again inside the battery increasing the state of charge.
It is worth noticing in this first demand scenario (36 kWh/day) that the system in theory can rely
on Stirling engine and battery bank only without taking the PV equipment in account, which
obviously shows that the engine is oversized for the load considered in this scenario. It is hence
arguable to consider that the support of the PV array is unnecessary but it might be used as an
emergency back-up tool if the engine breaks down for a determined period.
For the second scenario, the daily electricity demand is increased to 52 kWh/day. This daily
demand of 52 kWh results in an overall peak power value of 3.58 kW. In this scenario, the PV as
a compliment is unavoidable due to the high demand which is over the capacity of the main
generator, the 3kW Stirling engine. The power generation of the system is the same as in the first
scenario since the generation strategy has not been modified. The power demand for that case is
shown is Figure 23.
Figure 23. Energy demand during a day for a daily use of 52 kWh
In the figure above, the demand follows the same pattern as Figure 19 but with larger values.
Having 52 kWh/day is an increase of 44% meaning that the household’s monthly demand is
increased from 45 kWh to 65 kWh. In this case, the system is more vulnerable for variations of
power generation. For instance if the PV breaks down during a day the system might not be able
to provide the necessary power amount. Therefore, this second scenario can be seen in two ways.
Firstly, it might be interpreted as the already mention social demand. In such case, the size of the
system is very limited since a variation of a 10 % of the power peak could not be handled. On the
other hand, it might be interpreted as the opportunity to project an increase of the consumption
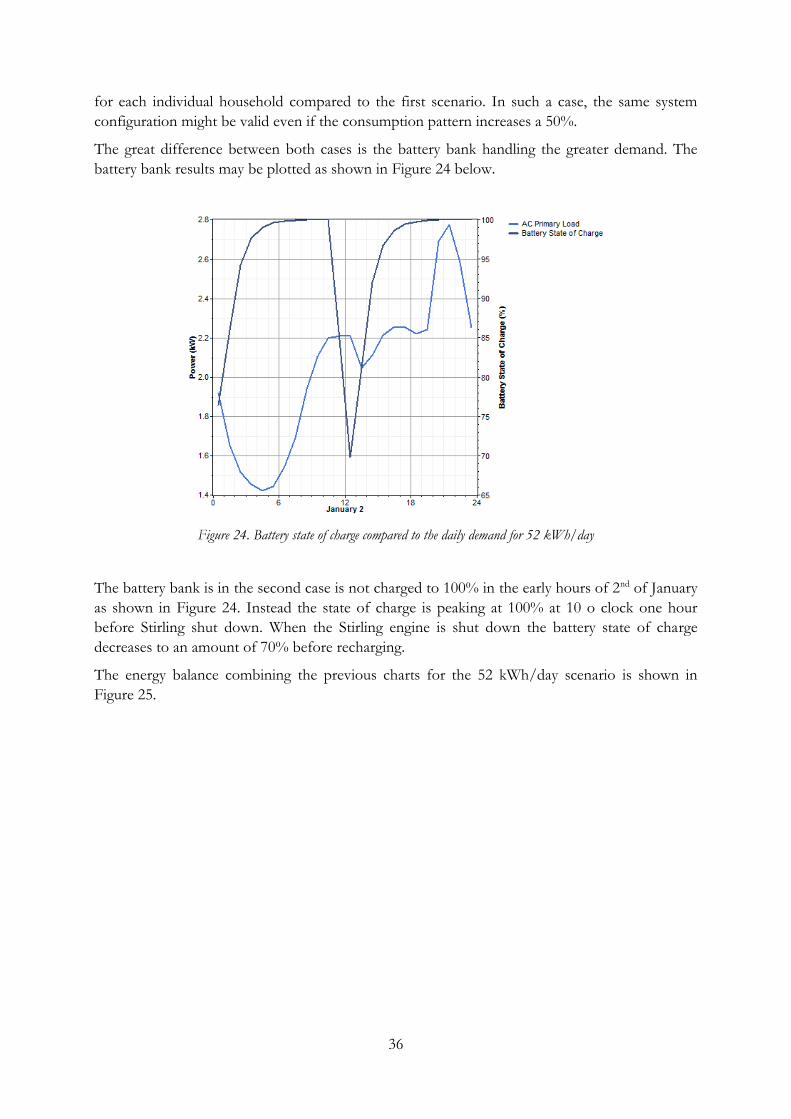
36
for each individual household compared to the first scenario. In such a case, the same system
configuration might be valid even if the consumption pattern increases a 50%.
The great difference between both cases is the battery bank handling the greater demand. The
battery bank results may be plotted as shown in Figure 24 below.
Figure 24. Battery state of charge compared to the daily demand for 52 kWh/day
The battery bank is in the second case is not charged to 100% in the early hours of 2nd of January
as shown in Figure 24. Instead the state of charge is peaking at 100% at 10 o clock one hour
before Stirling shut down. When the Stirling engine is shut down the battery state of charge
decreases to an amount of 70% before recharging.
The energy balance combining the previous charts for the 52 kWh/day scenario is shown in
Figure 25.

37
Figure 25. Energy balance using Stirling engine, photovoltaic and battery bank in order to fit the power demand for the case 52 kWh/day
Compared to the first scenario, the battery bank must provide a power input of 1,6 kW instead of
0,9 kW to fulfil the users demand when the maintenance of the Stirling engine is carried out.
Additionally, the autonomy of the battery bank is reduced to 3.32 hours.
The biomass input to the Stirling engine is, in the simulation, dependent on the electric efficiency
of the Stirling engine. With both cases using the same Stirling engine operating hours during the
year, the engine power generation is the same for both cases. Therefore, the biomass input is in
the simulation the same for both, the 36 kWh power demand and the 52 kWh power demand.
The biomass input using an electric efficiency of 10% is then determined using Homer to 51381
kg a year. Further on, a sensitivity analysis of efficiency and biomass input is described later on in
next section.
Once the results to both studied scenarios are presented, it is interesting to ask questions
regarding the evolution and limits of the system configuration in order to optimise it and study
the system response to different variations. That is realized in the sensitivity analysis.

38
3.1. Sensitivity analysis
The first question that arises from the simulation results is to determine the daily power demand
that makes the 0.9 kW PV array indispensable. The value is 53 kWh/day, which is almost the
situation analysed in the previous results. Therefore, a total demand of 53 kWh/day could not be
satisfied only with the Stirling generator and the battery bank and a system breakdown occurs in
the simulation. One explanation to this breakdown may be the battery properties preventing the
battery storage from falling beneath a specific limit not being particularly analysed in this study or
the year maximum peak power not being fulfilled. Additionally, the PV array allows an increase
of the demand up to 55 kWh/day.
Moreover, it is interesting to analyse the influence of the PV array and its influence when it
concerns to the adaptability of the system to attend the demand. The minimum size required to
increase the demand in 1 kWh/day has been analysed and presented in Figure 26.
Figure 26. Sensitivity analysis for the required PV capacity to increase a unit the daily power demand.
As mentioned before, for a daily demand of 52 kWh, the Stirling engine is capable of handling
the energy and power demand with a peak of 3.58 kW with the support of the battery bank.
However, for a demand of 53 kWh/day, an installed capacity of 0.1 kW of photovoltaic arrays is
required to meet the yearly demand.
In Figure 26, the evolution of the required PV capacity is shown. On early stages, an increase of
approximately 0.4 kW on the installed PV capacity is enough to increase a unit of the daily
demand but, the slope gets steeper as the daily demand increases. At the final stages of the figure,
approximately 0.8 kW of PV capacity are necessary to increase a unit of the daily demand. The
0 0,10,4
0,8
1,2
1,6
2,1
2,7
3,4
4,2
5,1
0
1
2
3
4
5
6
52 53 54 55 56 57 58 59 60 61 62
Inst
all
ed
PV
cap
acit
y [
kW
]
Power demand [kWh/day]
Required PV installation
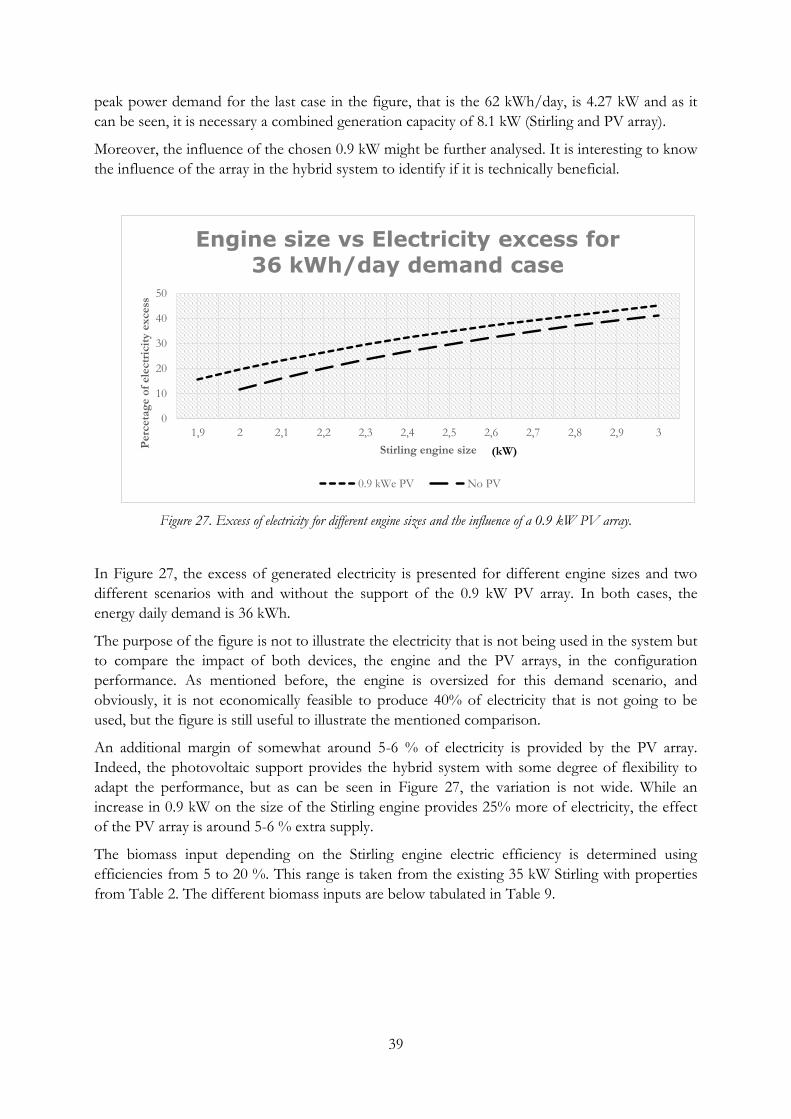
39
peak power demand for the last case in the figure, that is the 62 kWh/day, is 4.27 kW and as it
can be seen, it is necessary a combined generation capacity of 8.1 kW (Stirling and PV array).
Moreover, the influence of the chosen 0.9 kW might be further analysed. It is interesting to know
the influence of the array in the hybrid system to identify if it is technically beneficial.
Figure 27. Excess of electricity for different engine sizes and the influence of a 0.9 kW PV array.
In Figure 27, the excess of generated electricity is presented for different engine sizes and two
different scenarios with and without the support of the 0.9 kW PV array. In both cases, the
energy daily demand is 36 kWh.
The purpose of the figure is not to illustrate the electricity that is not being used in the system but
to compare the impact of both devices, the engine and the PV arrays, in the configuration
performance. As mentioned before, the engine is oversized for this demand scenario, and
obviously, it is not economically feasible to produce 40% of electricity that is not going to be
used, but the figure is still useful to illustrate the mentioned comparison.
An additional margin of somewhat around 5-6 % of electricity is provided by the PV array.
Indeed, the photovoltaic support provides the hybrid system with some degree of flexibility to
adapt the performance, but as can be seen in Figure 27, the variation is not wide. While an
increase in 0.9 kW on the size of the Stirling engine provides 25% more of electricity, the effect
of the PV array is around 5-6 % extra supply.
The biomass input depending on the Stirling engine electric efficiency is determined using
efficiencies from 5 to 20 %. This range is taken from the existing 35 kW Stirling with properties
from Table 2. The different biomass inputs are below tabulated in Table 9.
0
10
20
30
40
50
1,9 2 2,1 2,2 2,3 2,4 2,5 2,6 2,7 2,8 2,9 3
Perc
eta
ge o
f ele
ctr
icit
y e
xcess
Stirling engine size
Engine size vs Electricity excess for
36 kWh/day demand case
0.9 kWe PV No PV
(kW)
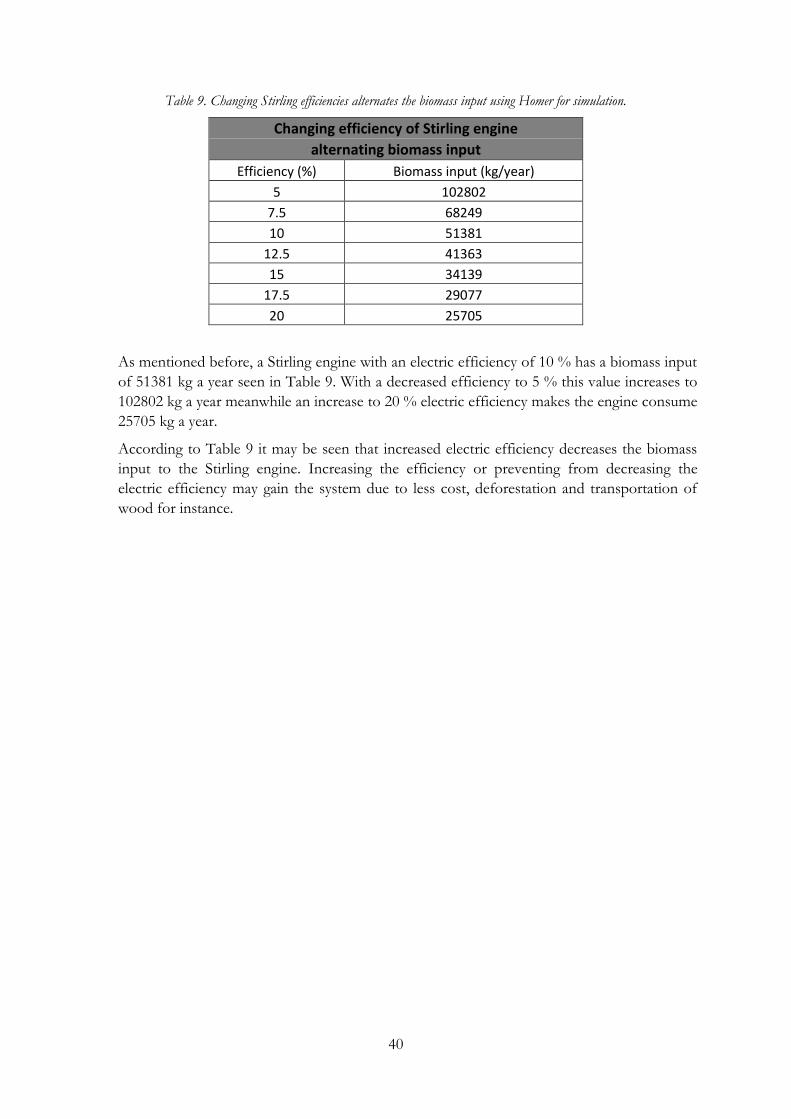
40
Table 9. Changing Stirling efficiencies alternates the biomass input using Homer for simulation.
Changing efficiency of Stirling engine
alternating biomass input
Efficiency (%) Biomass input (kg/year)
5 102802
7.5 68249
10 51381
12.5 41363
15 34139
17.5 29077
20 25705
As mentioned before, a Stirling engine with an electric efficiency of 10 % has a biomass input
of 51381 kg a year seen in Table 9. With a decreased efficiency to 5 % this value increases to
102802 kg a year meanwhile an increase to 20 % electric efficiency makes the engine consume
25705 kg a year.
According to Table 9 it may be seen that increased electric efficiency decreases the biomass
input to the Stirling engine. Increasing the efficiency or preventing from decreasing the
electric efficiency may gain the system due to less cost, deforestation and transportation of
wood for instance.
41
4. Conclusions and future studies
The Stirling engine theoretically proves to be an engine for use in rural parts of Bolivia. Due to
the high amount of biomass production compared to the biomass demand from the engine,
Stirling might bring opportunities to the inhabitants.
Considering the electric power demand, the demand through time is quite similar in the region.
This simplifies analyses of the systems since power generation may be set as constant the year
around. In other words, the system can be assumed to maintain in the same way day by day all
the year around.
For the system of 24 households the 3 kW Stirling and the battery bank combined with PV is
enough of taking care of basic electric power demand. The PV though does not seem to be in
proper size supporting the system. Increasing the PV size for supporting the system might be an
improvement but its influence is not excessive.
Regions to be considered in Bolivia should be departments with high access to biomass per
inhabitant for fulfilling the basic needs of electric power. For regions with higher population
density the engine must be bigger or the PV and the batteries resized fitting the new energy
demand.
As a continuation of this study, future works may be to investigate the thermal energy needs and
outputs with the CHP further on. Since thermal energy is the main output of the engine
determining the possibilities and uses seems reasonable.
Furthermore, field studies of the rural Bolivia might be done. In order to do future studies from
this review gathering information about the rural villages directly may be a good continuation for
information input. In addition the system for simulation may be specialized for existing villages
with specific demands and needs. Field studies may as well result in ideas of new possibilities for
the inhabitants, for instance combining the system in a specific way for the village may gain
neighbourhoods in a way that in advance was not predictable in power generation.
42
Table of Figures
Figure 1. Thermodynamic p-v and T-s diagrams of Carnot and Stirling cycles. (Bancha Kongtragool, 2003) .......................................................................................................................................................................................... 2 Figure 2. Alpha, Beta and Gamma Configurations of Stirling engines (Kongtragool & Wongwises, 2003). 3 Figure 3. Comparison between CHP and traditional heat and power generation (Shipley, et al., 2008). ....... 8 Figure 4. CHP system consisting of a Stirling Engine for generation of electricity and thermal energy. (Obara, et al., 2008) ....................................................................................................................................................... 8 Figure 5. Projected energy flows in kW of a commercial 1 kWe BiowattTM system with pellet burner (Lane & Beale, 1999). ............................................................................................................................................................... 9 Figure 6. Power Generating stations and distribution lines in Bolivia. Modified from (Viceministerio de Electricidad y Energías Alternativas, 2010) .............................................................................................................13 Figure 7. Potential for energy generation from renewable sources (Viceministerio de Electricidad y Energías Alternativas, 2010). .....................................................................................................................................15 Figure 8. Available resources of Biomass for energy production in Bolivia. (United Nations, 2012) ...........15 Figure 9. Hierarchical structure for the case study simulation. Source: Own elaboration. .............................17 Figure 10. Facts and location of Yacuma, Department of Beni, Bolivia. All data from (Instituto Nacional de Estadística, 2014)....................................................................................................................................................19 Figure 11. Solar radiation values for the coordinates 13°35′0″S 65°55′0″W. Yacuma, Bolivia. Source: Homer Legacy libraries. ..............................................................................................................................................20 Figure 12. Daily average power demand curve for the month of August with an energy demand of 36 kWh/day. ......................................................................................................................................................................23 Figure 13. Box plot of monthly averages of power demand showing seasonal variability for the 36 kWh case simulated in Homer (Own elaboration). .........................................................................................................23 Figure 14. Conceptual model of Stirling engine and Photovoltaic being implemented to an electrical power demand ..........................................................................................................................................................................25 Figure 15. Energy balance in the micro-power generation system ....................................................................26 Figure 16. Thermal energy flow, conceptual model with heat storage ...............................................................28 Figure 17. Right: The red area identifies the heat exchangers of the engine that must be fit inside the combustion chamber. Left: The appropriate size of the combustion chamber to fit the engine exchangers (GenoaStirling, 2014). .................................................................................................................................................29 Figure 18. Flowchart of energy simulated in Homer software ............................................................................31 Figure 19. Electric power demand through a day resulting in 36 kWh a day ....................................................32 Figure 20. Power generation using Stirling engine and photovoltaic equipment ..............................................33 Figure 21. Battery state of charge compared to daily demand for the 36 kWh scenaro ..................................34 Figure 22. Energy balance using the Stirling, photovoltaic and battery for the demand of 36 kWh/day ....34 Figure 23. Energy demand during a day for a daily use of 52 kWh ....................................................................35 Figure 24. Battery state of charge compared to the daily demand for 52 kWh/day ........................................36 Figure 25. Energy balance using Stirling engine, photovoltaic and battery bank in order to fit the power demand for the case 52 kWh/day .............................................................................................................................37 Figure 26. Sensitivity analysis for the required PV capacity to increase a unit the daily power demand. .....38 Figure 27. Excess of electricity for different engine sizes and the influence of a 0.9 kW PV array. .............39

43
Table of Tables
Table 1. Heat content ranges for Various Biomass fuels for determining heating values for different organic materials (Boundy, et al., 2011) ..................................................................................................................... 6 Table 2. Average results of test performance of a 35 kWe Stirling pilot plant. Data compared to design targets (Biedermann, et al., 2003). ............................................................................................................................... 9 Table 3. Characteristic parameters of PV-module tabulated (Mondol, et al., 2006). ........................................10 Table 4. Design data of collective PV installations for 7 collectives in Argentina (Díaz, et al., 2011). .........11 Table 5. Electricity access in rural areas divided by departments (Instituto Nacional de Estadística, 2014). ........................................................................................................................................................................................18 Table 6. Energy sources usage for cooking in rural areas divided by departments (Instituto Nacional de Estadística, 2014) .........................................................................................................................................................18 Table 7. Evaluation of localities without electricity access from Census 2001 (Fernández Fuentes, 2010) .19 Table 8. Energy demands by categories in rural sparse communities (United Nations, 2012). ......................21 Table 9. Changing Stirling efficiencies alternates the biomass input using Homer for simulation. ...............40

44
References
Agüero Zamora, V. R., 2006. Diseño y construcción de un motor Stirling para la generación de energía
eléctrica, Lima: Universidad Nacional de Ingeniería.
Andersen, S., Carlsen, H. & Thomsen, P., 2006. Numerical study on optimal Stirling engine regenerator
matrix designs taking into account the effects of matrix temperature oscillations, s.l.: Energy Conversion and
Management.
Bancha Kongtragool, S. W., 2003. A review of solar-powered Stirling engines and low
temperature differential Stirling engines. Renewable and Sustainable Energy Reviews, Issue 7, pp. 131-
154.
Biedermann, F., Carlsen, H., Obernberger, I. & Schöch, M., 2003. Operating experiences with a small-
scale CHP pilot plant based on a 35 KWel hermetic four cylinder Stirling engine for biomass fuels, s.l.: Bios
Bioenergiesysteme.
Boundy, B., Diegel, S. W., Wright, L. & Davis, S. C., 2011. Biomass energy data book, Oak Ridge,
Tennesee: U.S. Department of Energy.
Comité Nacional de Despacho de Carga, 2014. CNDC. [Online]
Available at: http://www.cndc.bo/home/index.php
[Accessed 15 March 2014].
De Paepe, M., D'Herdt, P. & Mertens, D., 2006. Micro-CHP systems for residential applications.
Energy Conversion and Management, Issue 47, p. 3435–3446.
Díaz, P. et al., 2011. Field analysis of Solar PV-based collective systems for rural electrification.
Energy, Issue 36, pp. 2509-2516.
Energy Sector Management Assistance Program, 2007. Bolivia: National Biomass Program, s.l.: The
International Bank for Reconstruction.
Energy Sector Management Assistance Program, 2010. Peru: National Survey of Rural Household
Energy Use, s.l.: s.n.
Farret, F. A. & Godoy Simões, M., 2006. The Stirling engine. En: Integration of alternative sources of
energy. s.l.:John Willey & Sons, Inc., pp. 438-446.
Fernández Fuentes, M., 2010. Rol e impacto socieconómico de las energías renovables en el área rural de
Bolivia, s.l.: Centro de estudios para el desarrollo laboral y agrario.
Fernández Fuentes, M., 2013. Energías renovables para el acceso unviersal a la electricidad, de la población
rural dispersa de Cochabamba, Cochabamba: Energética.
GenoaStirling, 2014. Genoastirling s.r.l.. [Online]
Available at: http://www.genoastirling.com/
[Accessed 26 May 2014].
Instituto Nacional de Estadística, 2014. Instituto Nacional de Estadística de Bolivia. [Online]
Available at: http://www.ine.gob.bo/
[Accessed 15 04 2014].
Invernizzi, C. M., 2010. Stirling engines using workingfluids with strong real gas effects. Issue 30,
pp. 1703-1710.

45
Kawamura, T., Atarashi, H. & Miyoshi, T., 2009. Development of F1 KERS motor, s.l.: Automobile R
& D Center, Honda R & D Co., Ltd..
Kimming, M. et al., 2011. Biomass from agriculture in small-scale combined heat and power
plants - A comparative life cycle assessment. Biomass and Bioenergy, Issue 35, pp. 1572-1581.
Kongtragool, B. & Wongwises, S., 2003. A review of solar-powered Stirling engines and low
temperature differential Stirling engines. Renewable & Sustainable Energy Reviews, Volume 7, pp.
131-154.
Kongtragool, B. & Wongwises, S., 2006. Thermodynamic analysis of a Stirling engine including
dead volumes of hot space, cold space and regenerator. Renewable Energy, Issue 31, pp. 345-359.
Kong, X., Wang, R. & Huang, X., 2004. Energy efficiency and economic feasibility of CCHP
driven by stirling engine. Energy Conversion and Management, Issue 45, p. 1433–1442.
Kuosa, M., Kaikko, J. & Koskelainen, L., 2007. The impact of heat exchanger fouling on the
optimum operation and manteinance of the Stirling engine. Applied Thermal Engineering, Issue 27,
pp. 1671-1676.
Lane, N. & Beale, W., 1999. A Biomass-Fired 1 kWe Stirling engine generator and its applications in South
Africa.. South Africa, 9th International Stirling Engine Conference.
Lobert, J., Keene, W., Logan, J. & Yevich, R., 1999. Global chlorine emissions from biomass
burning: Relative Chlorine Emissions Inventory. 104(8373-8389).
Martinot, E. & Reiche, K., 2000. Regulatory approaches to rural electrification and renewable energy: Case
studies from six developing countries, Washington, DC: World Bank.
Mondol, J. D., Yohanis, Y. G. & B., N., 2006. Optimal sizing of array and inverter for grid-
connected photovoltaic systems. Solar energy, Issue 80, p. 1517–1539.
Morales, R., Aguilar, A. & Calzadilla, A., 2004. Geography and culture matter for malnutrition in
Bolivia. Economics and Human Biology, Issue 2, p. ) 373–389.
National Renewable Energy Laboratory, 2009. Homer Legacy software, s.l.: s.n.
Nightingale, N., 1986. Automotive Stirling engine. Mod II Design Report, New York: NASA.
Nishiyama, A. et al., 2007. Fuel and emissions properties of Stirling engine operated with wood
powder. Issue 86, p. 2333–2342.
Obara, S. et al., 2008. Exergy analysis of the woody biomass Stirling engine and PEM-FC
combined system with exhaust heat reforming. Issue 33, pp. 2289-2299.
Obernberger, I., Carlsen, H. & Biedermann, F., 2003. State-of-the-art and future developments regarding
biomass CHP systems with a special focus on ORC and stirling engine technologies. s.l., International Nordic
Bioenergy conference.
Politic Constitution of Bolivia, 2009. Article 269. s.l.:s.n.
Sachs, J. M. J., 1989. Developing country debt and economic performance, Chicago: A national bureau of
economy research.
Sanjínes Tudela, G. N., 2011. Power electric demand in Bolivia. Analysis and projection: A neuronal network
application, La Paz: LAJED.
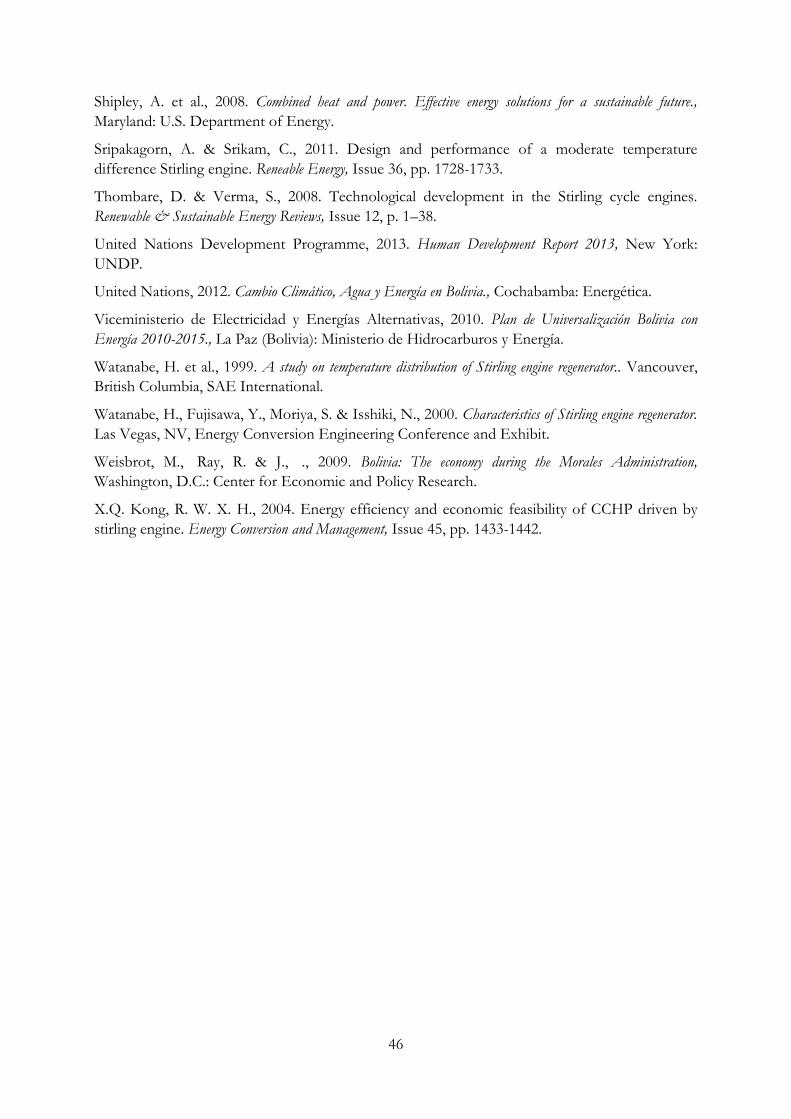
46
Shipley, A. et al., 2008. Combined heat and power. Effective energy solutions for a sustainable future.,
Maryland: U.S. Department of Energy.
Sripakagorn, A. & Srikam, C., 2011. Design and performance of a moderate temperature
difference Stirling engine. Reneable Energy, Issue 36, pp. 1728-1733.
Thombare, D. & Verma, S., 2008. Technological development in the Stirling cycle engines.
Renewable & Sustainable Energy Reviews, Issue 12, p. 1–38.
United Nations Development Programme, 2013. Human Development Report 2013, New York:
UNDP.
United Nations, 2012. Cambio Climático, Agua y Energía en Bolivia., Cochabamba: Energética.
Viceministerio de Electricidad y Energías Alternativas, 2010. Plan de Universalización Bolivia con
Energía 2010-2015., La Paz (Bolivia): Ministerio de Hidrocarburos y Energía.
Watanabe, H. et al., 1999. A study on temperature distribution of Stirling engine regenerator.. Vancouver,
British Columbia, SAE International.
Watanabe, H., Fujisawa, Y., Moriya, S. & Isshiki, N., 2000. Characteristics of Stirling engine regenerator.
Las Vegas, NV, Energy Conversion Engineering Conference and Exhibit.
Weisbrot, M., Ray, R. & J., ., 2009. Bolivia: The economy during the Morales Administration,
Washington, D.C.: Center for Economic and Policy Research.
X.Q. Kong, R. W. X. H., 2004. Energy efficiency and economic feasibility of CCHP driven by
stirling engine. Energy Conversion and Management, Issue 45, pp. 1433-1442.
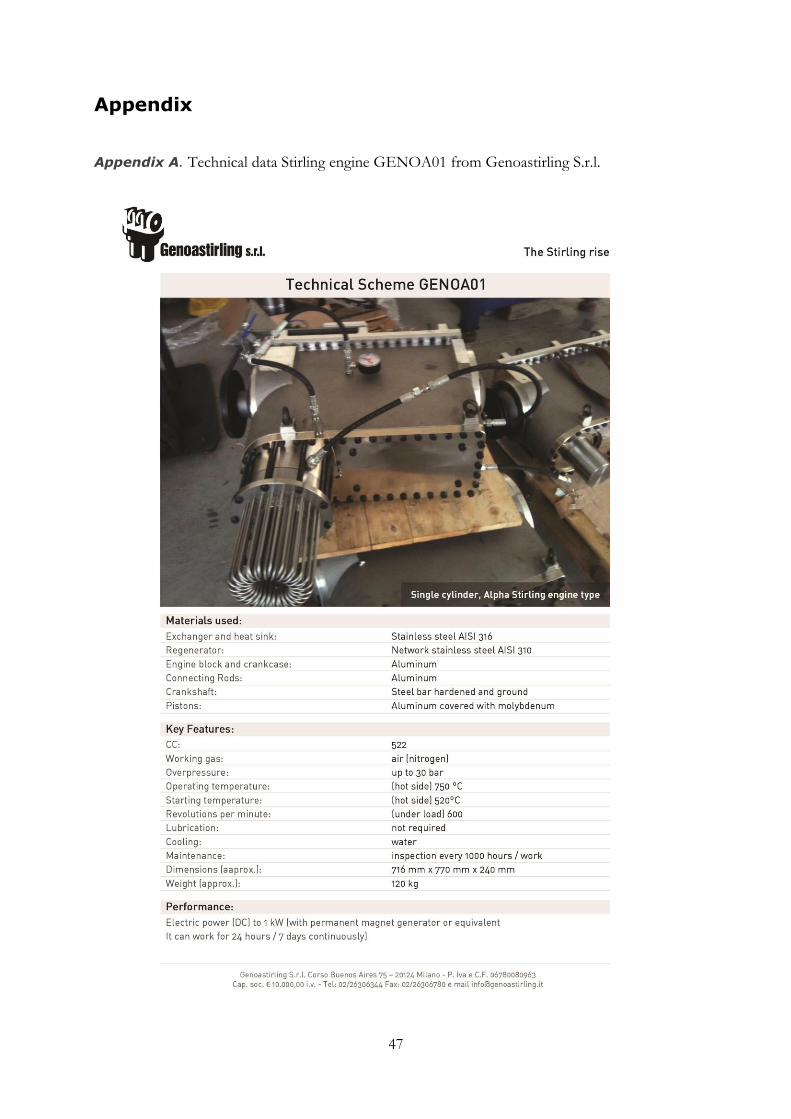
47
Appendix
Appendix A. Technical data Stirling engine GENOA01 from Genoastirling S.r.l.

48
Appendix B. Technical data Stirling engine GENOA03 from Genoastirling S.r.l.

49
Appendix C. Stirling engine GENOA03 from Genoastirling S.r.l.
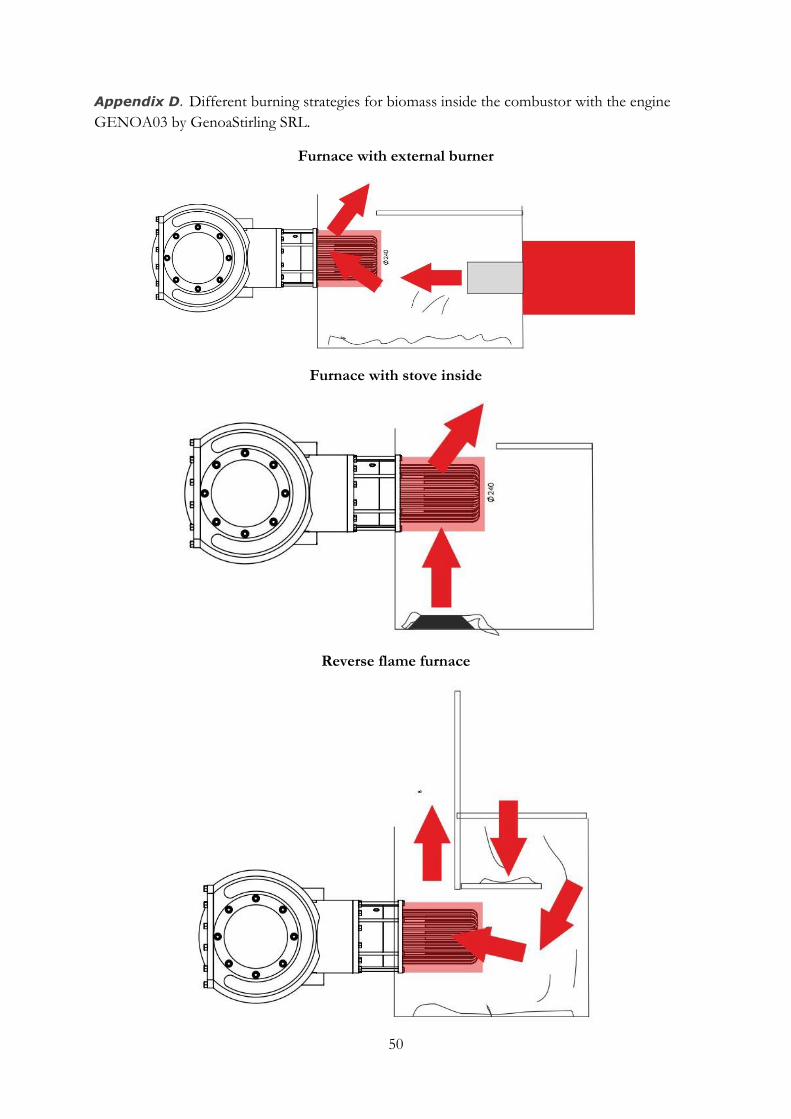
50
Appendix D. Different burning strategies for biomass inside the combustor with the engine
GENOA03 by GenoaStirling SRL.
Furnace with external burner
Furnace with stove inside
Reverse flame furnace
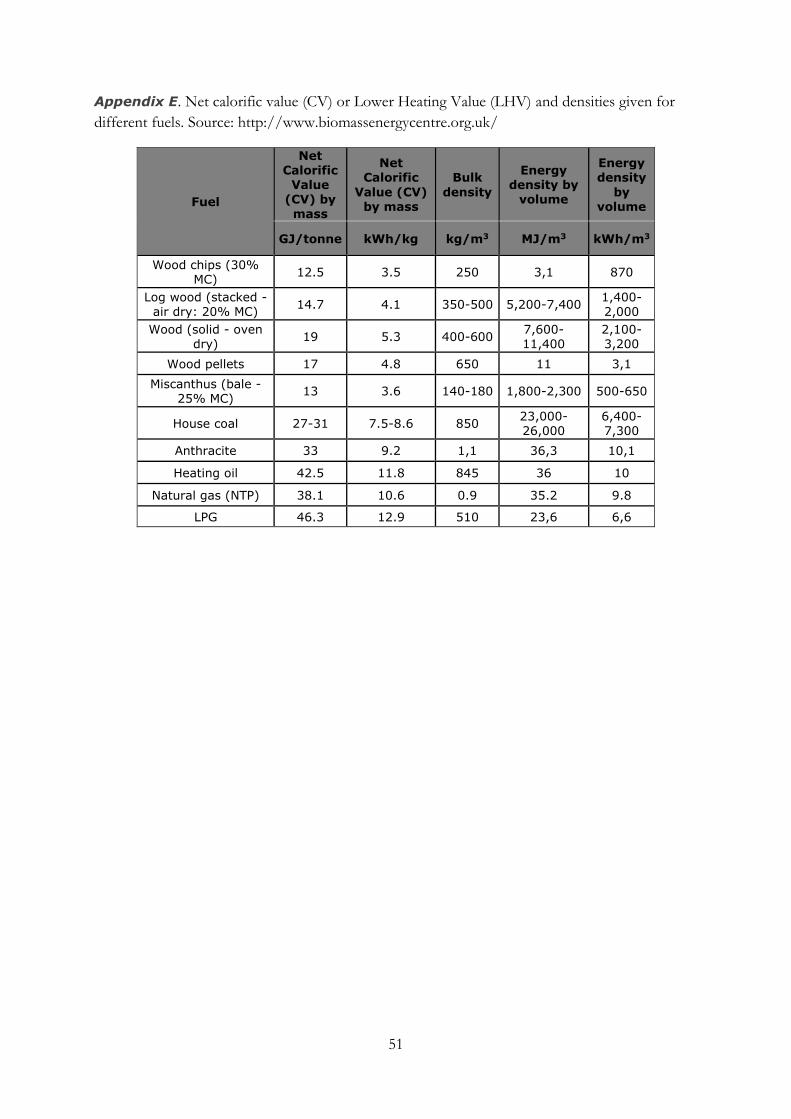
51
Appendix E. Net calorific value (CV) or Lower Heating Value (LHV) and densities given for
different fuels. Source: http://www.biomassenergycentre.org.uk/
Fuel
Net Calorific
Value (CV) by mass
Net Calorific
Value (CV) by mass
Bulk
density
Energy density by
volume
Energy density
by volume
GJ/tonne kWh/kg kg/m3 MJ/m3 kWh/m3
Wood chips (30% MC)
12.5 3.5 250 3,1 870
Log wood (stacked - air dry: 20% MC)
14.7 4.1 350-500 5,200-7,400 1,400-2,000
Wood (solid - oven dry)
19 5.3 400-600 7,600-11,400
2,100-3,200
Wood pellets 17 4.8 650 11 3,1
Miscanthus (bale - 25% MC)
13 3.6 140-180 1,800-2,300 500-650
House coal 27-31 7.5-8.6 850 23,000-26,000
6,400-7,300
Anthracite 33 9.2 1,1 36,3 10,1
Heating oil 42.5 11.8 845 36 10
Natural gas (NTP) 38.1 10.6 0.9 35.2 9.8
LPG 46.3 12.9 510 23,6 6,6