applications of advanced mathematics (c4) - meimei.org.uk/files/papers/c406ju_83nd.pdf · paper a...
TRANSCRIPT

This question paper consists of 5 printed pages and 3 blank pages.
OXFORD CAMBRIDGE AND RSA EXAMINATIONS
Advanced Subsidiary General Certificate of EducationAdvanced General Certificate of Education
MEI STRUCTURED MATHEMATICS 4754(A)Applications of Advanced Mathematics (C4) Paper A
Monday 12 JUNE 2006 Afternoon 1 hour 30 minutes
Additional materials:8 page answer bookletGraph paperMEI Examination Formulae and Tables (MF2)
TIME 1 hour 30 minutes
INSTRUCTIONS TO CANDIDATES
• Write your name, centre number and candidate number in the spaces provided on the answerbooklet.
• Answer all the questions.
• You are permitted to use a graphical calculator in this paper.
• Final answers should be given to a degree of accuracy appropriate to the context.
INFORMATION FOR CANDIDATES
• The number of marks is given in brackets [ ] at the end of each question or part question.
• You are advised that an answer may receive no marks unless you show sufficient detail of theworking to indicate that a correct method is being used.
• The total number of marks for this paper is 72.
NOTE
• This paper will be followed by Paper B: Comprehension.
HN/3© OCR 2006 [T/102/2653] Registered Charity 1066969 [Turn over

2
Section A (36 marks)
1 Fig. 1 shows part of the graph of
Fig. 1
Express in the form where and
Hence write down the exact coordinates of the turning point P. [6]
2 (i) Given that
where A, B and C are constants, find B and C, and show that [4]
(ii) Given that x is sufficiently small, find the first three terms of the binomial expansions ofand
Hence find the first three terms of the expansion of [4]
3 Given that show that
Hence solve the equation for [7]0° � q � 360°.sin (q � 40°) � 2sin q ,
tan q �sin a
2�cos a.sin (q � a) � 2sin q ,
3 � 2x 2
(1 � x) 2(1 � 4x) .
(1 � 4x) �1.(1 � x) �2
A � 0.
3 � 2x 2
(1 � x)2(1 � 4x) �A
1 � x�
B(1 � x)2 �
C
1 � 4x,
0 � a � 12 p .R � 0R sin (x � a),sin cosx x- 3
y
x
P
y x x= -sin cos .3
4754(A) June 2006

4754(A) June 2006 [Turn over
3
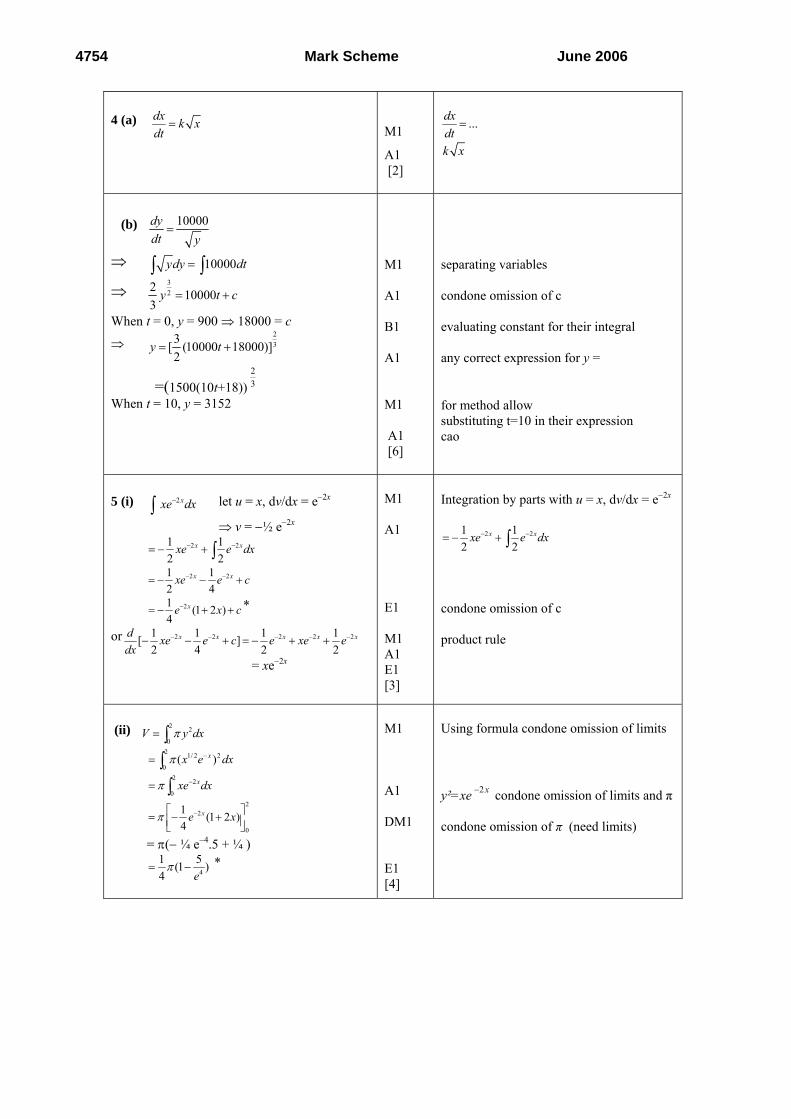
4 (a) The number of bacteria in a colony is increasing at a rate that is proportional to the square rootof the number of bacteria present. Form a differential equation relating x, the number ofbacteria, to the time t. [2]
(b) In another colony, the number of bacteria, y, after time t minutes is modelled by the differentialequation
Find y in terms of t, given that when Hence find the number of bacteria after10 minutes. [6]
5 (i) Show that [3]
A vase is made in the shape of the volume of revolution of the curve about the x-axisbetween and (see Fig. 5).
Fig. 5
(ii) Show that this volume of revolution is [4]14 4
15
p -ÊË
ˆ¯e
.
2O
y
x
x � 2x � 0y = x 1
2 e- x
�xe�2x dx � � 14 e�2x (1 � 2x) � c.
t � 0.y � 900
ddy
t y=
10000.

4
Section B (36 marks)
6 Fig. 6 shows the arch ABCD of a bridge.
Fig. 6
The section from B to C is part of the curve OBCE with parametric equations
for
where a is a constant.
(i) Find, in terms of a,
(A) the length of the straight line OE,
(B) the maximum height of the arch. [4]
(ii) Find in terms of [3]
The straight line sections AB and CD are inclined at 30° to the horizontal, and are tangents to thecurve at B and C respectively. BC is parallel to the x-axis. BF is parallel to the y-axis.
(iii) Show that at the point B the parameter satisfies the equation
Verify that is a solution of this equation.
Hence show that and find OF in terms of a, giving your answer exactly. [6]
(iv) Find BC and AF in terms of a.
Given that the straight line distance AD is 20 metres, calculate the value of a. [5]
BF � 32 a,
q � 23 p
sin ( cos ).q q= -1
31
q
q .dy
dx
0 � q � 2p ,x � a(q � sin q), y � a(1 � cos q)
30∞30∞
y
xOA F E D
B C
4754(A) June 2006
7
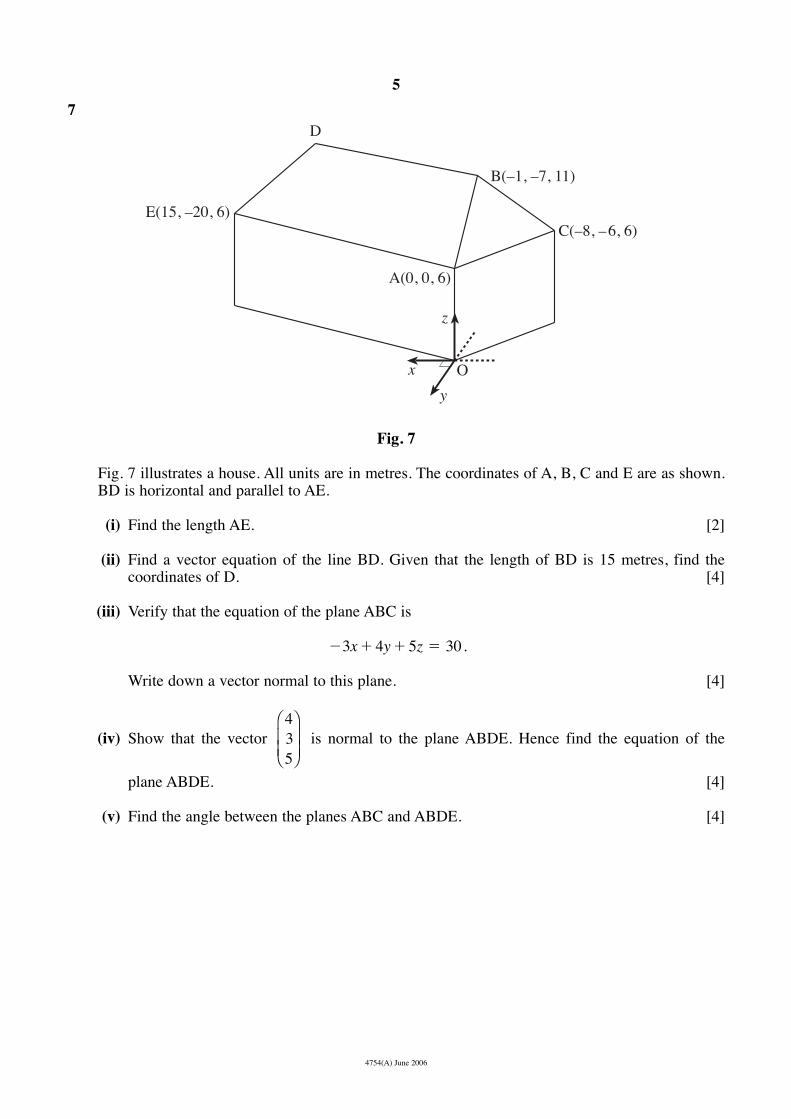
Fig. 7
Fig. 7 illustrates a house. All units are in metres. The coordinates of A, B, C and E are as shown.BD is horizontal and parallel to AE.
(i) Find the length AE. [2]
(ii) Find a vector equation of the line BD. Given that the length of BD is 15 metres, find thecoordinates of D. [4]
(iii) Verify that the equation of the plane ABC is
Write down a vector normal to this plane. [4]
(iv) Show that the vector is normal to the plane ABDE. Hence find the equation of the
plane ABDE. [4]
(v) Find the angle between the planes ABC and ABDE. [4]
435
Ê
ËÁÁ
ˆ
¯˜˜
�3x � 4y � 5z � 30.
D
B(–1, –7, 11)
C(–8, –6, 6)
O
y
x
z
A(0, 0, 6)
E(15, –20, 6)
5
4754(A) June 2006

OXFORD CAMBRIDGE AND RSA EXAMINATIONS
Advanced Subsidiary General Certificate of EducationAdvanced General Certificate of Education
MEI STRUCTURED MATHEMATICS 4754(B)Applications of Advanced Mathematics (C4)Paper B: Comprehension
Monday 12 JUNE 2006 Afternoon Up to 1 hour
Additional materials:Rough paperMEI Examination Formulae and Tables (MF2)
HN/2© OCR 2006 [T/102/2653] Registered Charity 1066969 [Turn over
This question paper consists of 4 printed pages and an insert.
CandidateCandidate Name Centre Number Number
TIME Up to 1 hour
INSTRUCTIONS TO CANDIDATES
• Write your name, centre number and candidate number in the spaces at the top of this page.
• Answer all the questions.
• Write your answers in the spaces provided on the question paper.
• You are permitted to use a graphical calculator in this paper.
INFORMATION FOR CANDIDATES
• The number of marks is given in brackets [ ] at the end of each question or part question.
• The insert contains the text for use with the questions.
• You may find it helpful to make notes and do some calculations as you read the passage.
• You are not required to hand in these notes with your question paper.
• You are advised that an answer may receive no marks unless you show sufficient detail of theworking to indicate that a correct method is being used.
• The total number of marks for this paper is 18.
For Examiner’s Use
Qu. Mark
1
2
3
4
5
6
Total

1 The marathon is 26 miles and 385 yards long (1 mile is 1760 yards). There are now severalmen who can run 2 miles in 8 minutes. Imagine that an athlete maintains this average speedfor a whole marathon. How long does the athlete take? [2]
……………………………………………………………………………………...................
……………………………………………………………………………………...................
……………………………………………………………………………………...................
2 According to the linear model, in which calendar year would the record for the men’s milefirst become negative? [3]
……………………………………………………………………………………...................
……………………………………………………………………………………...................
…………………………………………………………………………………...................…
……………………………………………………………………………...................………
…………………………………………………………………………...................…………
3 Explain the statement in line 93 “According to this model the 2-hour marathon will never berun.” [1]
………………………………………...................……………………………………………
………………………………………...................……………………………………………
……………………………………...................………………………………………………
2
4754(B) June 2006
ForExaminer’s
Use
4 Explain how the equation in line 49,
is consistent with Fig. 2
(i) initially, [3]
(ii) for large values of t. [2]
(i) …………………........…………………………………………………………………....
……....……………………………………………………………………………………
……....……………………………………………………………………………………
(ii) ……………………………………………………………………………………………
……………....……………………………………………………………………………
……………....……………………………………………………………………………
[Questions 5 and 6 are printed overleaf.]
R � L � (U � L)e�kt,
3 ForExaminer’s
Use
4754(B) June 2006
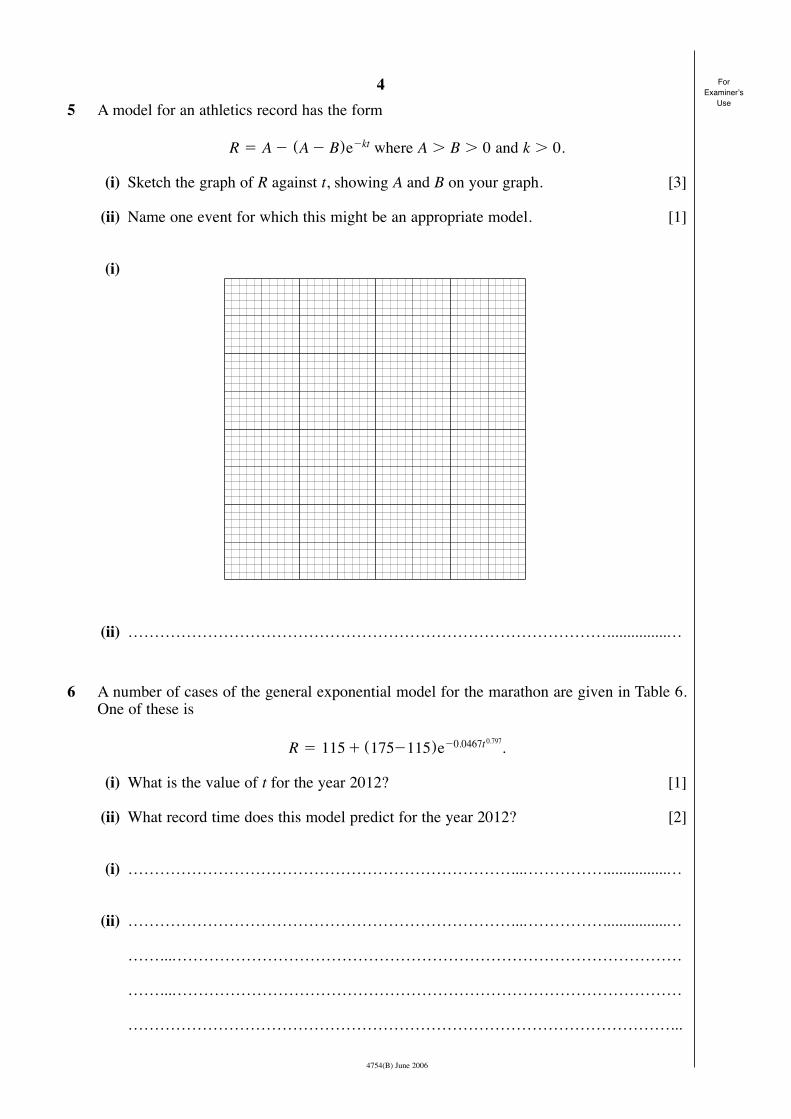
5 A model for an athletics record has the form
where and
(i) Sketch the graph of R against t, showing A and B on your graph. [3]
(ii) Name one event for which this might be an appropriate model. [1]
(i)
(ii) ………………………………………………………………………………...............…
6 A number of cases of the general exponential model for the marathon are given in Table 6.One of these is
.
(i) What is the value of t for the year 2012? [1]
(ii) What record time does this model predict for the year 2012? [2]
(i) ………………………………………………………………...……………................…
(ii) ………………………………………………………………...……………................…
……...……………………………………………………………………………………
……...……………………………………………………………………………………
…………………………………………………………………………………………...
R � 115 � (175�115)e�0.0467t 0.797
k � 0.A � B � 0R � A � (A � B)e�kt
4
4754(B) June 2006
ForExaminer’s
Use

INSTRUCTIONS TO CANDIDATES
• This insert contains the text for use with the questions.
This insert consists of 11 printed pages and 1 blank page.HN/4© OCR 2006 [T/102/2653] Registered Charity 1066969 [Turn over
OXFORD CAMBRIDGE AND RSA EXAMINATIONS
Advanced Subsidiary General Certificate of EducationAdvanced General Certificate of Education
MEI STRUCTURED MATHEMATICS 4754(B)Applications of Advanced Mathematics (C4)Paper B: ComprehensionINSERT
Monday 12 JUNE 2006 Afternoon Up to 1 hour

Modelling athletics records
Introduction
In the 1900 Olympic Games, shortly before world records were first kept, the record time forthe marathon was almost exactly 3 hours. One hundred years later, in 2000, the world recordstood at 2 hours 5 minutes and 42 seconds; it had been set during the previous year by KhalidKannouchi of Morocco. At the time of writing this article, the world marathon record for menis 2 hours 4 minutes and 55 seconds, set by Paul Tergat of Kenya.
When will the marathon record fall below 2 hours?
It is clearly not possible to predict exactly when any world record will be broken, or when aparticular time, distance or height will be achieved. It depends, among other things, on whichathletes are on form at any time. However, it is possible to look at overall trends and so to makejudgements about when new records are likely to be set.
Prediction inevitably involves extrapolating beyond existing data, and so into the unknown. Ifthis is to be more than guesswork, it must be based on a suitable mathematical model.
It is reasonable to hope that a general model can be found, one that can be adapted to manyathletics events. Such a model will take the form of a formula involving several parameters;these will take different values for different events. The parameter values will take account ofthe obvious distinction that, whereas records for track events (like the marathon and the mile)decrease with time, those for field events (like the long jump and the javelin) increase.
This article looks at possible formulae for such a model.
The linear model
The simplest type of model is linear and this is well illustrated by the men’s mile. The graphin Fig. 1 shows the world record for the mile plotted against the year from 1915 to 2005.Details of these records are given in Appendix A.
Fig. 1
1915 1925 1935 1945 1955 1965 1975 1985 1995 2005
220
225
230
235
240
245
250
255
Year, T
R (seconds)
2
4754(B) Insert June 2006
5
10
15
20

4754(B) Insert June 2006 [Turn over
A line of best fit has been drawn on Fig. 1. Its equation is
where
• R is the record time in seconds
• T is the calendar year.
(This equation was calculated using a standard statistical technique.)
The straight line clearly provides quite a good model for the record time between the years1915 and 2005. However, it will not continue to do so for ever. For a sufficiently large valueof T, the value of R will become negative, which is clearly impossible.
While the record time becoming negative shows that the linear model needs to be refined orreplaced, there are also positive times that are quite unrealistic. Over the years, trainingmethods have improved, as have running techniques and conditions, and no doubt this processwill continue. However, there is a level of performance that will never be achieved by ahuman; for example, it seems highly unlikely that any human will ever run a mile in a time of2 minutes. So, somewhere between the present record and 2 minutes, there is a certain timethat will never quite be achieved, a lower bound for the record time. A good model needs toincorporate this idea.
The simple exponential model
In Fig. 2, such a lower bound is represented by the horizontal asymptote, . You wouldexpect the record time to approach the asymptote as a curve and this is also illustrated in Fig. 2.
Fig. 2
t
R
U
L
R � L
R � 259.6 � 0.391(T � 1900)
3
25
30
35
40

4
4754(B) Insert June 2006
The data for the mile (illustrated in Fig. 1) could correspond to a part of such a graph beforeit had flattened out. However, if you look again at Fig. 1, you may think that a gentle curve ismore appropriate than the straight line, particularly for the more recent records.
A possible equation for such a model for the record time has the form
where
• U (Upper) is the initial record
• L (Lower) is the value at the asymptote, as illustrated in Fig. 2
• t is the time that has elapsed since records began
• k is a positive constant.
Notice the distinction in this article between t and T. The symbol T has already been used inline 26.
• T denotes the calendar year (so for the present year ).
In this model the record time obeys a simple exponential law and so in this article it is referredto as the simple exponential model.
Applying the simple exponential model to the men’s marathon
The graph in Fig. 3 shows the record times for the men’s marathon from 1908, when worldrecords began, to 2005. In this case the record time, R, is measured in minutes. (Details of theperformances are given in Appendix B.) A “curve of best fit”, in this case drawn by eye, hasbeen superimposed.
Fig. 3
1908 1920 1930 1940 1950 1960 1970 1980 1990 2000
120
130
140
150
160
170
180
Year, T
R (minutes)
2010
T � 2006
R � L � (U � L)e�kt
45
50
55
60

There are 3 parameters in the equation for the simple exponential model, L, U and k. They willtake different values for different athletics events. The values of the 3 parameters can bedetermined from the coordinates of 3 points on the curve, each point giving rise to oneequation. It is easiest to solve the equations if the 3 points chosen correspond to the initial time(i.e. ) and two equally spaced subsequent values of t.
For 1908, 1955 and 2002, the curve goes through the points corresponding to
The first equation is
, (Equation 1)
and this can be simplified to give
The other two equations are as follows.
(Equation 2)
(Equation 3)
Equation 2 can be rewritten as
and Equation 3 as
.
Since , it follows that
This equation can be solved to give (correct to 1 decimal place).
Substituting for L, in either Equation 2 or 3, gives an equation in k. The solution is and so this model for the marathon record is
and this can alternatively be written as
where T is the calendar year.
According to this model the 2-hour marathon will never be run.
R � 120.5 � 54.5e�0.0254(T�1908)
R � 120.5 � 54.5e�0.0254t
k � 0.0254
L � 120.5
125 5175
137175
2..
--
=--
ÊË
ˆ¯
L
L
L
L
e�94k � (e�47k)2
e�94k �125.5 � L175 � L
e�47k �137 � L175 � L
125.5 � L � (175 � L)e�94k
137 � L � (175 � L)e�47k
U � 175.
175 � L � (U � L) e0
t Rt Rt R
= == == =
0 17547 13794 125 5. .
t � 0
5
4754(B) Insert June 2006 [Turn over
65
70
75
80
85
90
When Roger Bannister ran the first 4-minute mile in 1954, there was speculation that thisrepresented just about the limit of the capability of the human frame. Now 3 minutes 40 seconds would seem a possibility. So the prediction of the simple exponential model thatthe 2-hour marathon will never be run feels distinctly unrealistic. This raises questions aboutthe suitability of the model being used.
The general exponential model
A more sophisticated exponential model is given by the equation
In this model, the time t is raised to the power a , where . So this model has 4 parameters,L, U, k and a . In this article it is referred to as the general exponential model. The previoussimple exponential model was the special case when .
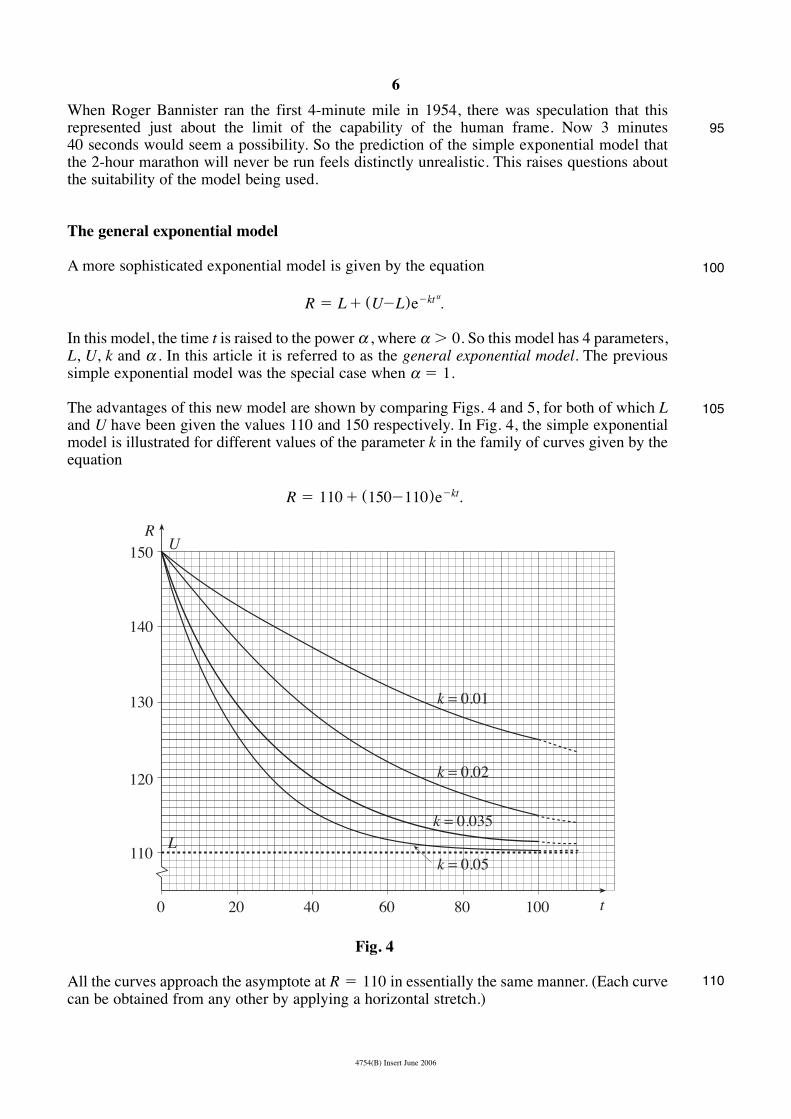
The advantages of this new model are shown by comparing Figs. 4 and 5, for both of which Land U have been given the values 110 and 150 respectively. In Fig. 4, the simple exponentialmodel is illustrated for different values of the parameter k in the family of curves given by theequation
Fig. 4
All the curves approach the asymptote at in essentially the same manner. (Each curvecan be obtained from any other by applying a horizontal stretch.)
R � 110
20 40 60 80 100
120
130
140
150
0
110
RU
L
k = 0.01
k = 0.02
k = 0.035
k = 0.05
t
R � 110 � (150�110)e�kt.
a � 1
a � 0
R � L � (U�L)e�kt a.
6
4754(B) Insert June 2006
95
100
105
110

It is easy to see that, in Fig. 4, the value of k determines both the initial gradient and thesubsequent path of the curve.
For this particular family
When
so that
Thus the simple exponential model is completely defined by the starting value, U, the lowerbound, L, and the initial gradient.
By contrast the general exponential model allows variation in the shape of the curves. In Fig. 5, there are two curves. Curve A is an example of the simple exponential model and curve B of the general exponential model. Their equations are given by
A:
B: .
Both of these curves pass through the same initial point (0, 150) and have the same horizontalasymptote . The horizontal asymptote is not shown in Fig. 5; instead the graph hasbeen restricted to smaller values of t to show the differences between the two models moreclearly.
Fig. 5
With the given values for the parameters, according to the general exponential model (curve B)the record times initially fall more quickly than in the simple exponential model (curve A). Atabout the two models give the same record time but after that the general exponentialmodel is always further away from the asymptote.
The two curves in Fig. 5 are only examples. The values of the parameters were chosen toillustrate the different characteristics of the two models, and have no significance beyond that.
t � 20,
5 10 15 20 25 300
130
140
150
125
135
145
t
R
B
A
R � 110
R � 110 � (150 � 110)e�0.134 t 0.5
R � 110 � (150 � 110)e�0.03t
k � � 140
� the initial gradient.
dR
dt� �40k,t � 0
dR
dt� �40ke�kt.
7
115
120
125
130
4754(B) Insert June 2006 [Turn over

Experience shows that when a new event is introduced, for example the women’s marathon inthe early 1970s, records tend to decrease very rapidly for the first few years (or, of course, toincrease for new field events). It is possible to allow for this in the general exponential modelwithout getting close to the bound unrealistically soon. This is not the case with the simpleexponential model.
So the general exponential model, with its 4 parameters, has the flexibility to provide areasonable model for records.
With this model, it is also possible to address the concern expressed in lines 96 to 97 about theprediction for the men’s marathon obtained from the simple exponential model.
For example, the general exponential curve through , and withand
• has its asymptote at 115 minutes rather than 120.5 minutes
• gives when ; this corresponds to the 2-hour marathon in the year2054 rather than never.
In Table 6 a number of possible applications of the general exponential model to the men’smarathon are listed. They all pass through the same 3 points as before, but have differentvalues for the lower bound, L.
Table 6
These results show a relationship between the lower bound, L, and the predicted date for the2-hour marathon. The smaller the lower bound, the sooner we can expect a 2-hour marathon.This finding coincides with common sense.
All the predictions in Table 6 for the 2-hour marathon seem rather cautious. If it happens muchsooner, that may well be evidence that an even more sophisticated model is needed. It couldeven have happened between the time of writing this article and today, when you are reading it.
Lower bound, L,for marathon record Model Calendar year, T,
for 2-hour marathon
115
110
105
100
95
R = 110 + (175 - 110)e- 0.0579t 0.706
2054
2045
2041
2039
2037
R = 115 + (175 - 115)e- 0.0467t 0.797
R = 105 + (175 - 105)e- 0.0641t 0.650
R = 100 + (175 - 100)e- 0.0673t 0.611
R = 95 + (175 - 95)e- 0.0686t 0.582
t � 146R � 120
a � 0.797k � 0.0467(94, 125.5)(47, 137)(0, 175)
8
4754(B) Insert June 2006
135
140
145
150
155

Finding the parameter values
Table 6 illustrates the versatility of the general exponential model. However, it does notaddress the question of how you determine the values of the various parameters.
One possible method would be to take a 4th point on the curve, giving 4 equations in the 4 unknowns, U, L, k and a . Apart from the fact that the resulting equations would be verydifficult to solve, there is another point to be considered.
The curve in Fig. 3 was drawn by eye and so is not a curve of best fit in a mathematical sense.That would require a statistical technique like that used for the straight line in Fig. 1. Thistechnique is built into curve-fitting software that will find the parameters in the equations ofmany curves of best fit. Such standard software would work for the simple exponential modelbut cannot handle the more complicated equation for the general exponential model. So specialprogramming would be needed.
However, the success of such a statistical method depends on the quality of the data. While allthe points in Fig. 3 correspond to the records given in Appendix B, and so are correct, theynonetheless all represent unusual occurrences; that is the nature of world records. Someexperts believe that, for any athletics event, a better picture is obtained by taking, say, the bestfive performances each year and constructing a model based on them, rather than relyingsolely on rare and exceptional occurrences.
Attempts have been made to use such an approach to link sudden large improvements inathletics records to the possible use of performance-enhancing drugs, but so far this work hasbeen inconclusive.
4754(B) Insert June 2006 [Turn over
9
160
165
170
175

Appendix A Mile records from 1915 (men)
Year Athlete Nationality Time
1915 Taber USA 4 m 12.6 s
1923 Nurmi Finland 4 m 10.4 s
1931 Ladoumegue France 4 m 9.2 s
1933 Lovelock New Zealand 4 m 7.6 s
1934 Cunningham USA 4 m 6.8 s
1937 Wooderson UK 4 m 6.4 s
1942 Hagg Sweden 4 m 6.2 s
1942 Hagg Sweden 4 m 4.6 s
1943 Andersson Sweden 4 m 2.6 s
1944 Andersson Sweden 4 m 1.6 s
1945 Hagg Sweden 4 m 1.4 s
1954 Bannister UK 3 m 59.4 s
1954 Landy Australia 3 m 58.0 s
1957 Ibbotson UK 3 m 57.2 s
1958 Elliot Australia 3 m 54.5 s
1962 Snell New Zealand 3 m 54.4 s
1964 Snell New Zealand 3 m 54.1 s
1965 Jazy France 3 m 53.6 s
1966 Ryun USA 3 m 51.3 s
1967 Ryun USA 3 m 51.1 s
1975 Bayi Tanzania 3 m 51.0 s
1975 Walker New Zealand 3 m 49.4 s
1979 Coe UK 3 m 49.0 s
1980 Ovett UK 3 m 48.8 s
1981 Coe UK 3 m 48.53 s
1981 Ovett UK 3 m 48.40 s
1981 Coe UK 3 m 47.33 s
1985 Cram UK 3 m 46.32 s
1993 Morceli Algeria 3 m 44.39 s
1999 El Guerrouj Morocco 3 m 43.13 s
10
4754(B) Insert June 2006

Year Athlete Nationality Time
1908 Hayes USA 2 h 55 m 18 s
1909 Fowler USA 2 h 52 m 45 s
1909 Clark USA 2 h 46 m 52 s
1909 Raines USA 2 h 46 m 04 s
1909 Barrett UK 2 h 42 m 31 s
1909 Johansson Sweden 2 h 40 m 34 s
1913 Green UK 2 h 38 m 16 s
1913 Ahlgren Sweden 2 h 36 m 06 s
1922 Kolehmainen Finland 2 h 32 m 35 s
1925 Michelsen USA 2 h 29 m 01 s
1935 Suzuki Japan 2 h 27 m 49 s
1935 Ikenana Japan 2 h 26 m 44 s
1935 Son Korea 2 h 26 m 42 s
1947 Suh Korea 2 h 25 m 39 s
1952 Peters UK 2 h 20 m 42 s
1953 Peters UK 2 h 18 m 40 s
1953 Peters UK 2 h 18 m 34 s
1954 Peters UK 2 h 17 m 39 s
1958 Popov USSR 2 h 15 m 17 s
1960 Bikila Ethiopia 2 h 15 m 16 s
1963 Teresawa Japan 2 h 15 m 15 s
1963 Edelen USA 2 h 14 m 28 s
1964 Heatley UK 2 h 13 m 55 s
1964 Bikila Ethiopia 2 h 12 m 11 s
1965 Shigematsu Japan 2 h 12 m 00 s
1967 Clayton Australia 2 h 09 m 36 s
1969 Clayton Australia 2 h 08 m 33 s
1981 de Castella Australia 2 h 08 m 18 s
1984 Jones UK 2 h 08 m 05 s
1985 Lopes Portugal 2 h 07 m 12 s
1988 Dinsamo Ethiopia 2 h 06 m 50 s
1998 de Costa Brazil 2 h 06 m 05 s
1999 Khannouchi Morocco 2 h 05 m 42 s
2002 Khannouchi USA 2 h 05 m 38 s
2003 Tergat Kenya 2 h 04 m 55 s
Appendix B Marathon records (men)
11
4754(B) Insert June 2006

4754 Mark Scheme June 2006
Mark Scheme 4754June 2006

4754 Mark Scheme June 2006
1 sin x − √3 cos x = R sin(x − α) = R(sin x cos α − cos x sin α) ⇒ R cos α = 1, R sin α = √3 ⇒ R2 = 12 + (√3)2 = 4, R = 2 tan α = √3/1 = √3 ⇒ α = π/3 ⇒ sin x − √3 cos x = 2 sin(x − π/3) x coordinate of P is when x − π/3 = π/2 ⇒ x = 5π/6 y = 2 So coordinates are (5π/6, 2)
B1 M1 A1
M1 A1ft B1ft [6]
R = 2 tan α = √3 or sinα=√3/their R or cosα=1/their R α = π/3, 60° or 1.05 (or better) radians www Using x-their α=π/2or 90° α≠0 exact radians only (not π/2) their R (exact only)
2(i)
2
2 2
3 2(1 ) (1 4 ) 1 (1 ) 1 4
x A B Cx x x x x+
= + ++ − + + −
⇒ 2 23 2 (1 )(1 4 ) (1 4 ) (1 )x A x x B x C x+ = + − + − + + x = −1 ⇒ 5 = 5B ⇒ B = 1 x = ¼ ⇒ 1 253
8 16C= ⇒ C = 2
coefft of x2: 2 = −4A + C ⇒ A = 0 .
M1 B1 B1 E1 [4]
Clearing fractions (or any 2 correct equations) B = 1 www C = 2 www A = 0 needs justification
(ii) (1 + x)−2 = 1 + (−2)x + (−2)(−3)x2/2! + … = 1 − 2x + 3x2+ … (1 − 4x)−1 = 1 + (−1)(−4x)+(−1)(−2)(−4x)2/2!+… = 1 + 4x + 16x2 + …
22 1
2
3 2 (1 ) 2(1 4 )(1 ) (1 4 )
x x xx x
− −+= + + −
+ −
≈ 1 − 2x + 3x2 + 2(1 + 4x + 16x2) = 3 + 6x + 35x2
M1 A1 A1 A1ft [4]
Binomial series (coefficients unsimplified - for either) or (3+2x²)(1+x) 2− (1-4x) 1− expanded theirA,B,C and their expansions
3 sin(θ + α) = 2sin θ ⇒ sin θ cos α + cos θ sin α = 2 sin θ ⇒ tan θ cos α + sin α = 2 tan θ ⇒ sin α = 2 tan θ − tan θ cos α = tan θ (2 − cos α) ⇒ tan θ = sin
2 cosα
α− *
sin(θ + 40°) = 2 sin θ ⇒ tan θ = sin 40
2 cos 40− = 0.5209
⇒ θ = 27.5°, 207.5°
M1 M1 M1 E1 M1 A1 A1 [7]
Using correct Compound angle formula in a valid equation dividing by cos θ collecting terms in tan θ or sin θ or dividing by tan θ oe www (can be all achieved for the method in reverse) tan θ = sin 40
2 cos 40−
-1 if given in radians -1 extra solutions in the range
4754 Mark Scheme June 2006
4 (a) dx k x
dt=
M1
A1 [2]
...dxdt
=
k x
(b) 10000dy
dt y=
⇒ 10000ydy dt=∫ ∫
⇒ 322 10000
3y t c= +
When t = 0, y = 900 ⇒ 18000 = c
⇒ 233[ (10000 18000)]
2y t= +
=(1500(10t+18))23
When t = 10, y = 3152
M1 A1 B1 A1 M1 A1 [6]
separating variables condone omission of c evaluating constant for their integral any correct expression for y = for method allow substituting t=10 in their expression cao
5 (i) 2xxe dx−∫ let u = x, dv/dx = e−2x
⇒ v = −½ e−2x 2 21 1
2 2x xxe e dx− −= − + ∫
2 21 12 4
x xxe e c− −= − − +
21 (1 2 )4
xe x c−= − + + *
or 2 2 2 2 21 1 1 1[ ]2 4 2 2
x x x x xd xe e c e xe edx
− − − − −− − + = − + +
= xe−2x
M1 A1 E1 M1 A1 E1 [3]
Integration by parts with u = x, dv/dx = e−2x
2 21 12 2
x xxe e dx− −= − + ∫
condone omission of c product rule
(ii) 2 2
0V y dxπ= ∫
2 1/ 2 2
0( )xx e dxπ −= ∫
2 2
0
xxe dxπ −= ∫
2
2
0
1 (1 2 )4
xe xπ −⎡ ⎤= − +⎢ ⎥⎣ ⎦
= π(− ¼ e−4.5 + ¼ )
4
1 5(1 )4 e
π= − *
M1 A1 DM1 E1 [4]
Using formula condone omission of limits y²=xe 2x− condone omission of limits and π condone omission of π (need limits)

4754 Mark Scheme June 2006
Section B
6 (i) At E, θ = 2π ⇒ x = a(2π − sin 2π) = 2aπ So OE = 2aπ. Max height is when θ = π ⇒ y = a( 1 − cos π) = 2a
M1 A1 M1 A1 [4]
θ=π, 180°,cosθ=-1
(ii) /
/dy dy dθdx dx dθ
=
sin(1 cos )a
aθ
θ=
−
sin(1 cos )
θθ
=−
M1 M1 A1 [3]
//
dy dy dθdx dx dθ
= for theirs
(sin ) cos , (cos ) sind dθ θ θ θdθ dθ
= = − both
or equivalent www condone uncancelled a
(iii) tan 30° = 1/√3 ⇒ sin 1
(1 cos ) 3=
−θ
θ
⇒ 1sin (1 cos )3
= −θ θ *
When θ = 2π/3, sin θ = √3/2
(1 − cos θ)/√3 = (1 + ½)/√3 = 3 322 3
=
BF = a(1 + ½) = 3a/2* OF = a( 2π/3 − √3/2)
M1 E1 M1 E1 E1 B1 [6]
Or gradient=1/√3 sin θ = √3/2, cos θ = −½ or equiv.
(iv) BC = 2aπ − 2a(2π/3 − √3/2) = a(2π/3 + √3) AF = √3 × 3a/2 = 3√3a/2 AD = BC + 2AF = a( 2π/3 + √3 + 3√3) = a(2π/3 + 4√3) = 20 ⇒ a = 2.22 m
B1ft M1 A1 M1 A1 [5]
their OE -2their OF

4754 Mark Scheme June 2006
7 (i) AE = √(152 + 202 + 02) = 25
M1 A1 [2]
(ii) 15 3AE 20 5 4
0 0
⎛ ⎞ ⎛ ⎞⎜ ⎟ ⎜ ⎟= − = −⎜ ⎟ ⎜ ⎟⎜ ⎟ ⎜ ⎟⎝ ⎠ ⎝ ⎠
uuur
Equation of BD is 1 37 4
11 0λ
−⎛ ⎞ ⎛ ⎞⎜ ⎟ ⎜ ⎟= − + −⎜ ⎟ ⎜ ⎟⎜ ⎟ ⎜ ⎟⎝ ⎠ ⎝ ⎠
r
BD = 15 ⇒ λ = 3 ⇒ D is (8, −19, 11)
M1 A1 M1 A1cao [4]
Any correct form
or 1 157 20
11 0λ
−⎛ ⎞ ⎛ ⎞⎜ ⎟ ⎜ ⎟= − + −⎜ ⎟ ⎜ ⎟⎜ ⎟ ⎜ ⎟⎝ ⎠ ⎝ ⎠
r
λ = 3 or 3/5 as appropriate
(iii) At A: −3 × 0 + 4 × 0 + 5 × 6 = 30 At B: −3 × (−1) + 4 × (−7) + 5 × 11 = 30 At C: −3 × (−8) + 4 × (−6) + 5 × 6 = 30
Normal is 345
−⎛ ⎞⎜ ⎟⎜ ⎟⎜ ⎟⎝ ⎠
M1 A2,1,0 B1 [4]
One verification (OR B1 Normal, M1 scalar product with 1 vector in the plane, A1two correct, A1 verification with a point OR M1 vector form of equation of plane eg r=0i+0j+6k+μ(i+7j-5k)+ν(8i+6j+0k) M1 elimination of both parameters A1 equation of plane B1 Normal * )
(iv) 06060
020
15.
534
.534
=−=⎟⎟⎟
⎠
⎞
⎜⎜⎜
⎝
⎛−
⎟⎟⎟
⎠
⎞
⎜⎜⎜
⎝
⎛=
⎟⎟⎟
⎠
⎞
⎜⎜⎜
⎝
⎛AE
025214
571
.534
.534
=+−−=⎟⎟⎟
⎠
⎞
⎜⎜⎜
⎝
⎛−−
⎟⎟⎟
⎠
⎞
⎜⎜⎜
⎝
⎛=
⎟⎟⎟
⎠
⎞
⎜⎜⎜
⎝
⎛AB
⇒ 435
⎛ ⎞⎜ ⎟⎜ ⎟⎜ ⎟⎝ ⎠
is normal to plane
Equation is 4x + 3y + 5z = 30.
M1 E1 M1 A1 [4]
scalar product with one vector in plane = 0 scalar product with another vector in plane = 0 4x + 3y + 5z = … 30 OR as * above OR M1 for subst 1 point in 4x+3y+5z= ,A1 for subst 2 further points =30 A1 correct equation , B1 Normal
(v) Angle between planes is angle between
normals 435
⎛ ⎞⎜ ⎟⎜ ⎟⎜ ⎟⎝ ⎠
and 3
45
−⎛ ⎞⎜ ⎟⎜ ⎟⎜ ⎟⎝ ⎠
4 ( 3) 3 4 5 5 1cos250 50
θ × − + × + ×= =
×
⇒ θ = 60°
M1 M1 A1 A1 [4]
Correct method for any 2 vectors their normals only ( rearranged) or 120° cao

4754 Mark Scheme June 2006
Comprehension Paper 2 Qu Answer Mark Comment 1. 38526 4
1760⎛ ⎞+ ×⎜ ⎟⎝ ⎠
minutes
1 hour 44 minutes 52.5 seconds
M1
A1
Accept all equivalent forms, with units. Allow ….52 and 53 seconds.
2. ( )259.6 0.391 1900R T= − −
( ) 259.6 0.391 1900 0T∴ − − = 2563.9T⇒ =
R will become negative in 2563
M1 A1 A1
R=0 and attempting to solve. T=2563,2564,2563.9…any correct cao
3. The value of L is 120.5 and this is over 2 hours or (120 minutes)
E1 or R>120.5minutes or showing there is no solution for 120=120.5+54.5e ...−
4.(i) Substituting 0t = in ( )e ktR L U L −= + −
gives ( ) 1R L U L= + − × U=
M1 A1 E1
0e 1=
4.(ii) As , e 0ktt −→ ∞ → and so R L→
M1 E1
5.(i)
M1 A1 A1
Increasing curve
Asymptote
A and B marked correctly
5.(ii) Any field event: long jump, high jump, triple jump, pole vault, javelin, shot, discus, hammer, etc.
B1
6.(i) 104t = B1 6.(ii) ( ) 0.7970.0467115 175 115 e tR −= + −
0.7970.0467 104115 60 eR − ×= + × 1.892115 60 eR −= + ×
124.047...R = 2 hours 4 minutes 3 seconds
M1 A1
Substituting their t 124, 124.05, etc.

Report on the Units taken in June 2006
4754 - Applications of Advanced Mathematics (C4) General Comments This was the third time this paper had been set and the second time in the Summer session. This proved to be the most difficult paper yet and high total scores were rare. In particular, question 6 proved to be very low scoring, even for good students, and many candidates made no attempt at this question. Question 7 had some confused solutions which might partially have been through lack of time caused by the problems in question 6. Section A proved to be quite well answered. The Comprehension was generally successful with a good range of marks. Candidates would be advised to use methods suggested by ‘hence’ in questions. These methods are usually the easiest. Candidates also need to read questions carefully. For instance, the need for exact answers was often overlooked. In the longer questions, few candidates gave sufficient explanations to support their working. In this way, they risked losing method marks. Comments on Individual Questions Paper A Section A 1) The first part –using the ‘R’ method- was well answered. Most errors arose from
attempts to quote results rather than working from first principles. Too many used degrees rather than the required radians. In the second part several candidates tried to find the turning point by differentiation (of both the original expression and that found in the first part) which is more difficult and longer than using knowledge of when trigonometric curves have maxima. The need for exact co-ordinates was often missed.
2) (i) This was well answered by many. Some started badly and lost marks by assuming that A=0 and using that to find B and C. Other errors arose from incorrect clearing of the fractions such as including an extra factor of (1+x) on the right hand side only or writing (1+x)² as (1+x²) .There were also some time- consuming approaches.
(ii) The first three marks were usually obtained. Few realised that they could use their partial fractions in part (ii) and proceeded to expand (3+2x) ²(1+x) 2− (1-4x) 1− . Many made this more difficult by retaining higher powers of x than was necessary in their calculations.
3) Most candidates correctly used the correct Compound angle formula as the first stage. Good candidates completed the rest with ease but others abandoned the question at that point. Few realised that the final marks were accessible without the proof.
4) (a) Although there were many completely correct solutions here, there were also many candidates who did not appear to realise that an equals sign was required in an equation. Some included a t on the right hand side, …=t√x being common.
12

Report on the Units taken in June 2006
(b) There were some good solutions here. Most attempted to separate the variables
but too many had 1/√y in their integral instead of √y. Those who separated the variables correctly usually integrated correctly. If an arbitrary constant was included in the integration and found immediately, it too, was often correct. Those that rearranged their equation first made errors such as y 3/ =15000t+c 2
⇒ y=(15000t) +c 2/ 3 2 / 3
Very many candidates overlooked the explicit requirement to ‘find y in terms of t’ but the majority substituted t=10 correctly.
5 (i) The integration by parts was usually successful. Only a few made the incorrect choices for u and dv. There were some sign errors.
(ii) Those who could square x 1/ e2 x− correctly were usually successful here. There were some candidates who did not spot the connection with part (i) and some failed to substitute the lower limit but this question was usually well answered.
Section B
6) This question was not well answered. (i) Very few realised that at E, y=0 1-cosθ =0 θ =0 or 2π. Many started by
attempts to eliminate θ from the parametric equations or to substitute x into y or to assume the arch was part of an ellipse or of a circle. Candidates often resorted to calculus to find the maximum height instead of realising that
⇒ ⇒
1-cosθ is a maximum when cosθ = -1. Some continued to use degrees here instead or radians. For instance, lengths being given as 360a instead of 2πa.
(ii) This part was the most successful in this question although usually only the first two marks were scored. a was often treated as a variable and θ as a constant. The process of division was usually correct.
(iii) Very few connected the gradient of the line AB with the gradient of the curve at B. The gradient of the tangent at B =tan 30°=1/√3 was not appreciated. This was usually missed out. Those few trying to verify that 2π/3 was a solution of the given equation usually used a calculator rather than an exact form. 0.866=0.866 was a common response here. Only a small number of candidates proceeded beyond this point.
(iv) For those that did attempt this part, AF was sometimes found correctly. A very small minority achieved the final result.
7) (i) Well answered and generally correct. (ii) Most candidates correctly found the vector equation of the line (although often
disappointingly missing the r =…). Very few candidates, even the most able, realised how to find the co-ordinates of D.
(iii)&(iv) Solutions of parts (iii) and (iv) were very confused. In many cases mixtures of the same methods were used for both parts. These included
• starting from the vector equations of the planes and eliminating parameters to get the equations and hence the normals
• the use of scalar products (too often without working shown) between the normal vector and (usually only one) vector in the plane
• verification with points • using the vector cross product to find the normal vector and hence the
equation In some cases long methods were used and these were often presented badly. It may be that some candidates were running out of time at this stage.
13

Report on the Units taken in June 2006
(v) This was usually correct when attempted. There were occasional uses of the wrong vectors or the incorrect formula.
Paper B Comprehension Most candidates achieved respectable marks on this section and there was a
good range of marks.
1) Usually correct but sometimes over-rounded. A few could not deal with the 385 yards.
2) Most substituted R=0 (although some incorrectly substituted a negative value, say -1). Many candidates found the year was 2563.9 but then said 2564 would be the year, failing to see that the answer lay in 2563.
3) Many suggested there was an asymptote at R=120 failing to see the significance of the 120.5 in the equation. There were some pleasing proofs by contradiction, showing that a time of 120 required the logarithm of a negative number.
4) Too many candidates approached this from the graph rather than substituting into the equation. Of those that did consider the equation at t=0 and as t tended to infinity there were some good solutions. This question discriminated well between the candidates.
5) Usually done well but some did not realise this was an increasing curve.
6)
t=104 was not common but the correct method was usually used for the final stage.
14