applications of a mechanistic physiology based
TRANSCRIPT

Applications of a Mechanistic Physiology Applications of a Mechanistic Physiology Based Pharmacokinetic Model for Imaging Based Pharmacokinetic Model for Imaging Agent DevelopmentAgent Development
Mary SpilkerJohn GrafBrion Sarachan
2008 American Conference on PharmacometricsTucson, AZ

2 /GE /
Molecular Imaging
1913
MedicalX-Ray Tube
1976
ComputedTomography
1983 2005+2000
DigitalImaging
MagneticResonance
Imaging
GE has a long history in medical imaging

3 /GE /
Molecular and contrast-enhanced imaging
Visualize Anatomy
CT contrast agent for imaging vasculature1
Visualize Molecular Processes
SPECT agent that binds to dopamine transporters3
Normal Parkinson’s Disease
1) Leonard, Medical Imaging Magazine, 2005 (http://www.medicalimagingmag.com/issues/articles/2005-06_02.asp)
2) Roberts et al, AJNR 20003) http://www.epda.eu.com/medInfo/medInfo-MedicalDevices.shtm
• Imaging agents provide contrast and report on anatomy, function and molecular processes.
MRI contrast agent assessing vascular permeability in brain tumours2
Visualize Functional Processes
Pre Contrast Post Contrast

4 /GE /
Development process for imaging agents
Interested in the pharmacokinetics of an agent– Distribution (Delivery), Retention (Binding), Biotransformations, Clearance
Want specific localization to the target with low uptake and fast clearance from non-target tissues
Dosing – typically intravenous dose– dose is normally at tracer levels for molecular imaging applications
– Larger doses for anatomic and functional imaging
Feas
ibili
ty
Proo
f of
Conc
ept
Proo
f of
Mec
hani
sm
Lead
Se
lect
ion
Tran
sfer
to
Dev
elop
men
t
IDEAS
Feas
ibili
ty
Proo
f of
Conc
ept
Proo
f of
Mec
hani
sm
Lead
Se
lect
ion
Tran
sfer
to
Dev
elop
men
t
IDEAS
Feas
ibili
ty
Proo
f of
Conc
ept
Proo
f of
Mec
hani
sm
Lead
Se
lect
ion
Tran
sfer
to
Dev
elop
men
t
Feas
ibili
ty
Proo
f of
Conc
ept
Proo
f of
Mec
hani
sm
Lead
Se
lect
ion
Tran
sfer
to
Dev
elop
men
t
IDEAS
Clinical TrialsFe
asib
ility
Proo
f of
Conc
ept
Proo
f of
Mec
hani
sm
Lead
Se
lect
ion
Tran
sfer
to
Dev
elop
men
t
IDEAS
Feas
ibili
ty
Proo
f of
Conc
ept
Proo
f of
Mec
hani
sm
Lead
Se
lect
ion
Tran
sfer
to
Dev
elop
men
t
IDEAS
Feas
ibili
ty
Proo
f of
Conc
ept
Proo
f of
Mec
hani
sm
Lead
Se
lect
ion
Tran
sfer
to
Dev
elop
men
t
Feas
ibili
ty
Proo
f of
Conc
ept
Proo
f of
Mec
hani
sm
Lead
Se
lect
ion
Tran
sfer
to
Dev
elop
men
t
IDEAS
Clinical Trials
5 /GE /
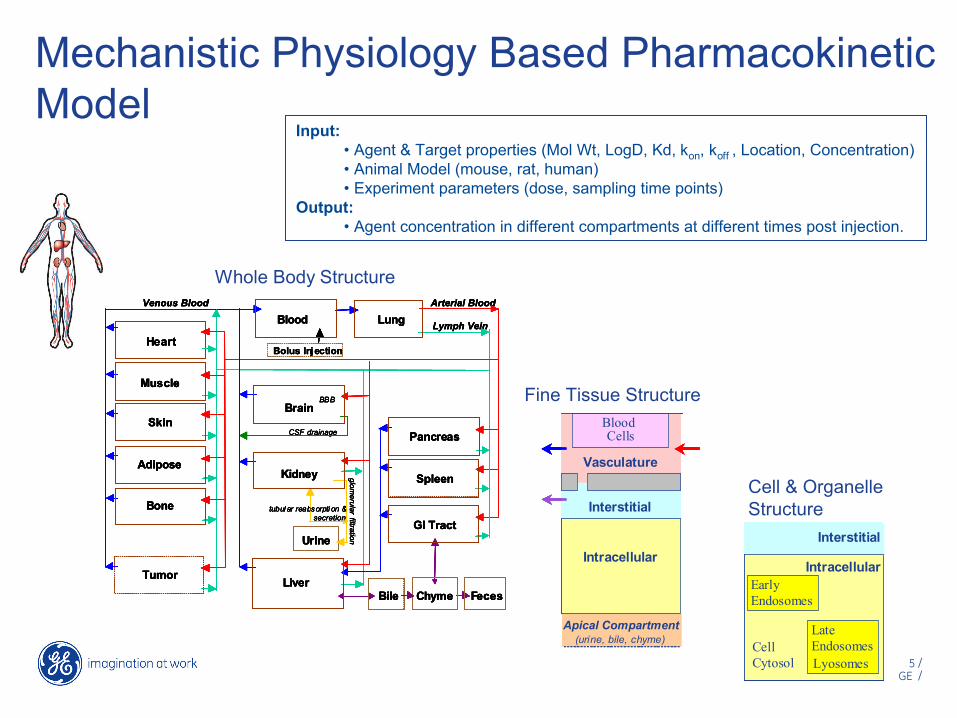
Mechanistic Physiology Based Pharmacokinetic Model
Whole Body Structure
Fine Tissue Structure
Cell & Organelle Structure
Input: • Agent & Target properties (Mol Wt, LogD, Kd, kon, koff , Location, Concentration)• Animal Model (mouse, rat, human)• Experiment parameters (dose, sampling time points)
Output: • Agent concentration in different compartments at different times post injection.
Arterial Blood
Lymph Vein
Muscle
Heart
glomerular
filtration
Bolus Injection
Urine
Venous Blood
Bile
CSF drainage
tubul ar reabsorpti on & secretion
Chyme
Skin
Adipose
Bone
Tumor
Spleen
GI Tract
Liver
Kidney
Brain
LungBlood
Feces
BBB
Pancreas
Arterial Blood
Lymph Vein
Muscle
Heart
glomerular
filtration
Bolus Injection
Urine
Venous Blood
Bile
CSF drainage
tubul ar reabsorpti on & secretion
Chyme
Skin
Adipose
Bone
Tumor
Spleen
GI Tract
Liver
Kidney
Brain
LungBlood
Feces
BBB
Pancreas
Arterial Blood
Lymph Vein
Muscle
Heart
glomerular
filtration
Bolus Injection
Urine
Venous Blood
Bile
CSF drainage
tubul ar reabsorpti on & secretion
Chyme
Skin
Adipose
Bone
Tumor
Spleen
GI Tract
Liver
Kidney
Brain
LungBlood
Feces
BBB
Pancreas
Arterial Blood
Lymph Vein
Muscle
Heart
glomerular
filtration
Bolus Injection
Urine
Venous Blood
Bile
CSF drainage
tubul ar reabsorpti on & secretion
Chyme
Skin
Adipose
Bone
Tumor
Spleen
GI Tract
Liver
Kidney
Brain
LungBlood
Feces
BBB
PancreasBlood Cells
Plasma
Interstitial
Intracellular
Vasculature
Endothelial Cells
Apical Compartment(urine, bile, chyme)
Tissue Cells
Blood Cells
Interstitial
Intracellular
Vasculature
Apical Compartment(urine, bile, chyme)
Blood Cells
Plasma
Interstitial
Intracellular
Vasculature
Endothelial Cells
Apical Compartment(urine, bile, chyme)
Tissue Cells
Blood Cells
Interstitial
Intracellular
Vasculature
Apical Compartment(urine, bile, chyme) Cell Cytosol,
Nucleus, Mitochondria, Peroxisome
Early Endosomes
Late Endosomes, Lyosomes,Golgi, Endoplasmic Reticulum (ER)
Interstitial
Intracellular
Cell Cytosol
Early Endosomes
Late Endosomes Lyosomes
Interstitial
Intracellular
Cell Cytosol, Nucleus, Mitochondria, Peroxisome
Early Endosomes
Late Endosomes, Lyosomes,Golgi, Endoplasmic Reticulum (ER)
Interstitial
Intracellular
Cell Cytosol
Early Endosomes
Late Endosomes Lyosomes
Interstitial
Intracellular

6 /GE /
Measured DataModel Prediction
Experiment:Bolus injection of 99mTc-DTPA in control miceTissues measured using a gamma counter%ID/g = percent of injected dose per gram tissue
Model Validation
NN
N
O
O
O
O
O
O O
O
O O
99mTc
0
1
2
3
4
5
0 30 60 90 1200
4
8
12
16
20
0 30 60 90 120
Blood Kidney
0
10
20
30
40
50
0 30 60 90 120
Muscle
Liver%
ID/g
Time (minutes) Time (minutes) Time (minutes)
0
2
4
6
8
10
0 30 60 90 1200
2
4
6
8
10
0 30 60 90 1200
20
40
60
80
100
%ID
0 30 60 90 120
UrineLung
%ID
/g%
ID/g
%ID
/g
%ID
/g
0
1
2
3
4
5
0 30 60 90 1200
1
2
3
4
5
0 30 60 90 1200 30 60 90 1200
4
8
12
16
20
0 30 60 90 1200
4
8
12
16
20
0 30 60 90 1200 30 60 90 120
Blood Kidney
0
10
20
30
40
50
0 30 60 90 1200
10
20
30
40
50
0 30 60 90 1200 30 60 90 120
Muscle
Liver%
ID/g
Time (minutes) Time (minutes) Time (minutes)
0
2
4
6
8
10
0 30 60 90 1200 30 60 90 1200
2
4
6
8
10
0 30 60 90 1200 30 60 90 1200
20
40
60
80
100
%ID
0 30 60 90 1200 30 60 90 120
UrineLung
%ID
/g%
ID/g
%ID
/g
%ID
/g

7 /GE /
Uses of the Model
• Predict agent distribution
• Consolidate data
• Explore Mechanism of Action
• Quantitatively evaluate feasibility of new ideas
• Address ‘what if’ questions

Understanding Mechanism of Action

9 /GE /
Oncology Application
• Mouse model with tumor.
• Intracellular target located in the cell cytosol.
• Target upregulated in tumors following a specific therapy.
• Agent: – high affinity peptide (Ki < 1 nM)– negative LogP – multiple charges

10 /GE /
Initial experimental results suggest localized uptake in target tissue
0
2
4
6
8
10
12
0 30 60 90 120
%ID
/ g
Time Post Injection (Minutes)
BloodTumorMuscle
%ID/g = percent of injected dose per gram tissue

11 /GE /
0
1
2
3
4
5
6
0 30 60 90 120
Initial model predictions unable to replicate dataMinimal amount of agent predicted to enter cell through passive processes.
Tum
or %
ID /
g
Time Post Injection (Minutes)
%ID/g = percent of injected dose per gram tissue
Measured Tumor Conc
Total Predicted Tumor Conc
Vascular Contribution
Interstital Contribution
Intracellular Contribution

12 /GE /
An alternative mechanism is proposedProposed Mechanism: endocytosis This mechanism could explain the tumour uptake, but would isolate the agent from the target present in the cytosol.
Knowledge used to develop/support this mechanismVesicle volumes, intracellular volume fraction Measured fluid influx (Besterman,1981), (Steinman 1983)Influence of molecular charge upon the endocytosis (Davies 1981)Increased pinocytosis in tumor cells (Allison 1974)
Measured Tumor Conc
Total Predicted Tumor Conc
Vascular Contribution
Interstital Contribution
Cell Cytosol Contribution
Early Endosome Contribution
Late Endosome Contribution0
1
2
3
4
5
6
0 30 60 90 120
Tum
or %
ID /
g
Time Post Injection (Minutes)
%ID/g = percent of injected dose per gram tissue

13 /GE /
Additional experiments show no difference between targeted agent and negative control
0
2
4
6
8
10
12
0 30 60 90 1200
2
4
6
8
10
12
0 30 60 90 120
BloodTumorMuscle
%ID
/ g
Time Post Injection (Minutes)
Negative Control: Scrambled peptide vectorKi >1uM
Target AgentKi < 1 nM
%ID/g = percent of injected dose per gram tissue

14 /GE /
When the model output and data don’t agree
Discrepancies can lead to – re-evaluation of hypotheses– additional experiments focused on mechanism of
action– further evaluation of the model

Simulation of Clinical Images

L R
Anterior
Posterior
SimulatedImages
Physics-Based Image SimulatorsWhole Body
3D Anatomical Maps*
Clinical Image Simulation
Mechanistic PBPK Model
Image Analysis Results
Relevant anatomy & physiology
Biomarker and Agent Properties
TissueConcentrationData
Imaging Feasibility
#1
#2
#3 #4 #5
#6
#7
lesion
*Zubal Phantom (http://noodle.med.yale.edu/phant.html#Zubal) Zubal, et al. (1994). Med Phys 21(2).

17 /GE /
Future Directions
• Continue to improve the model based on increased understanding of physiology
• Further validate the model
• Incorporate in vitro information (metabolism)
• Apply the model to agents beyond small molecules
• Incorporate parameter variability

18 /GE /
Acknowledgements
John Graf ([email protected])
Brion Sarachan ([email protected])
Colin Archer
Paul Bennett
Christoph Hergersberg
Michael Idelchik
Nadeem Ishaque
Marivi Mendizabal
Michael Montalto
Matthew Morrison
Sally-Ann Ricketts
Ian Wilson