application of wavelet denoising to improve compression ...decrease of microscope image (bernas et...
TRANSCRIPT

Journal of Microscopy, Vol. 231, Pt 1 2008, pp. 81–96
Received 10 May 2007; accepted 14 January 2008
Application of wavelet denoising to improve compression efficiencywhile preserving integrity of digital micrographs
T . B E R N A S ∗†, E . K . A S E M‡, J . P . R O B I N S O N† & B . R A J W A†∗Department of Plant Anatomy and Cytology, Faculty of Biology and Protection of Environment,University of Silesia, Jagiellonska 28, 40-032 Katowice, Poland
†Purdue University Cytometry Laboratories, 1203 S. West State Street, West Lafayette, Indiana,U.S.A.
‡Purdue University, School of Veterinary Medicine, 625 Harrison Street, West Lafayette, Indiana,U.S.A.
Key words. Data integrity, denoising, image compression, JPEG2000,microscopy, wavelets.
Summary
Modern microscopy methods require efficient imagecompression techniques owing to collection of up to thousandsof images per experiment. Current irreversible techniquessuch as JPEG and JPEG2000 are not optimized to preservethe integrity of the scientific data as required by 21 CFRpart 11. Therefore, to construct an irreversible, yet integrity-preserving compression mechanism, we establish a model ofnoise as a function of signal in our imaging system. Thenoise is then removed with a wavelet shrinkage algorithmwhose parameters are adapted to local image structure. Weascertain the integrity of the denoised images by measuringchanges in spatial and intensity distributions of registeredlight in the biological images and estimating changes of theeffective microscope MTF. We demonstrate that the proposeddenoising procedure leads to a decrease in image file sizewhen a reversible JPEG2000 coding is used and providesbetter fidelity than irreversible JPEG and JPEG2000 at thesame compression ratio. We also demonstrate that denoisingreduces image artefacts when used as a pre-filtering step priorto irreversible image coding.
Introduction
Digital imaging based on light microscopy has become anestablished technique in basic and applied biological sciences.Modern applications like high-content screening (HCS), 4Dimaging, and multi-spectral imaging may involve collectionof thousands of images in one experiment. Hence, suchdata have to be stored using efficient image-compressiontechniques. Several compression routines developed for digital
Correspondence to: Tytus Bernas. Tel: +48 32 2009 484; fax: +48 32 2555 873;
e-mail: [email protected].
photography and film may be used to address this issue.Reversible compression algorithms (LZW, RLE, Huffmanencoding) neither introduce distortion to images (Bernaset al., 2005b) nor remove any information from images andtherefore preserve the data integrity, as defined by 21 CFRpart 11 (CFR, 2004). However, these reversible (‘lossless’)techniques can provide only a moderate compression ratio,which typically does not exceed 3:1 for biological images. Moreefficient compression can be obtained with irreversible (‘lossy’)techniques, which use fractal coding (Chen, 1998; Wohlberg& de Jager, 1999), vector quantization (Cosman et al., 1994;Chen, 1998), discrete cosine transform (ISO/IEC, 1999) orwavelet transform (ISO/IEC, 2002). The last two compressionschemes, described by JPEG (ISO/IEC, 1999) and JPEG2000(ISO/IEC, 2002) standards, are the usual choice in biologicalmicroscopy owing to their widespread implementation.However, these forms of irreversible compression removesome information from images and introduce artefacts. Thedistortions are considered acceptable as long as the essentialperceptual image quality is not decreased (Grgic et al., 2003;Ebrahimi et al., 2004). In other words, models of human visionare used to establish which image features are significantand consequently should be preserved (Ebrahimi et al., 2004).This approach is not particularly suitable for compression ofmicroscope images, if the data integrity is to be preserved.Therefore, to meet the requirements of 21 CFR part 11, oneneeds to prove that irreversible compression does not alter theoutcome of analysis procedures that use images as the inputdata. Several validation schemes have been developed for JPEGand JPEG2000. A common approach is to establish whetherthe compression ratio modifies ROCs (receiver operatingcurves) for diagnosis based on medical images (Cosman et al.,1994; Wong et al., 1995; Sung et al., 2002). However,the process of interpretation of the images by a clinician
C© 2008 The AuthorsJournal compilation C© 2008 The Royal Microscopical Society

8 2 T . B E R N A S E T A L .
is difficult to model and standardize (Cosman et al., 1994).Therefore, this technique is expensive, time-consuming andprone to ambiguity (Cosman et al., 1994; Wong et al.,1995). Validation of compression algorithms is easier whenautomated image analysis procedures are used, owing totheir reproducibility, low cost and speed. Nonetheless, theacceptable compression level is task-dependent (Wong et al.,1995), regardless of whether images are analyzed by a humanexpert or an automated system. Furthermore, the compressionlevel may depend on image quality (Sung et al., 2002). Thisparameter, in turn, depends on the image-registration systemand the properties of the imaged specimen. Consequently, itmay be necessary to re-validate an irreversible compressionscheme if any of the three components (imaging system,interpretation/analysis procedure or task) is changed. Theseproblems may be obviated if an algorithm for compression ofmicroscope images is constructed without reference to humanvision models and validated in a way that is independent ofthe image-analysis task.
Instead of studying the result of interpretation/analysis ofcompressed images, one may focus on the information contentof the input data. The information content of a micrographis limited by the presence of instrumental noise, whichconstitutes part of image data. Removal of this redundant noisecomponent is an obvious methods to decrease size of imagedata (perform image compression). Numerous and efficientschemes of removal signal-independent (Gaussian) noise withwavelet shrinkage (thresholding) have been developed andtested using several types of images (Donoho & Johnstone,1994; Donoho, 1995; Simoncelli, 1999; Chang et al., 2000).These have been also used to remove signal-independent(Poisson) noise from images subjected to variance-stabilizingtransformation with a normal approximation (Donoho, 1993;Fryzlewicz & Nason, 2001). Alternatively, one may adaptwavelet shrinkage with original Poisson counts (Kolaczyk,1997; Kolaczyk, 1999b; Nowak & Baraniuk, 1999) oruse Bayesian inference (Kolaczyk, 1999a; Timmermann &Nowak, 1999) to remove this type of signal-independentnoise. Nonetheless, application of denoising for compressionof biological light micrographs has not been extensivelyevaluated up to the author’s knowledge. One may note that,in contrast to natural scene images, there are no establisheduniversal measures of image quality.
Therefore, to establish an irreversible, yet data-preservingcompression mechanism, we use previously developed modelof noise, which is a function of signal in our imagingsystem (Bernas et al., 2005a). Then, we implement anunbiased Poisson noise estimator in wavelet domain (Nowak& Baraniuk, 1999) and combine it with an adaptivewavelet shrinkage scheme (Sendur & Selesnick, 2002). Wedemonstrated previously that proposed denoising procedurecombined with reversible JPEG2000 coding results in adecrease of microscope image (Bernas et al., 2006). Inthis paper, we evaluate the effects of application of this
compression method on possible distortion of microscopemodulation transfer function (MTF) and actual biologicalfluorescence micrographs. We compare fidelity of proposeddenoising/coding scheme to fidelity provided by irreversibleJPEG2000 and JPEG in the same conditions. We also studyfidelity of proposed denoising combined irreversible JPEG2000coding.
Materials and methods
Computer software and hardware
Image processing and analysis procedures were executedusing an AMD Athlon XP 2800+ (1950 MHz) machineequipped with 1 GB DDR RAM (333 MHz) and a RAID 0 matrixcomprising two ATA 133 hard drives. The calculations wereperformed with Matlab R13 (MathWorks) running under MSWindows 2000 (SP4).
Registration of microscope images and constructionof model images
Cell culture and confocal microscopy. Transformed humanfibroblasts MSU 1.1 were cultured, stained with propidiumiodide (PI) and imaged using a Bio-Rad MRC 1024 confocalmicroscope as described previously (Bernas et al., 2004). PIfluorescence was detected using photomultipliers in photon-counting mode. The array test pattern on a microscopetest slide (Richardson Technologies Inc., Bolton, Canada)was imaged using the same confocal system. The imageswere registered at the focal plane of maximum intensityusing reflected light (488 nm) as described in Bernas et al.(2006). Light intensity was registered with 8-bit precision.The images were sampled close to Nyquist spatial frequency(approximately seven image pixels corresponded to one Airydisc diameter). Hence, according to Rayleigh criterion, onecould resolve two point objects if they were at least 3.5 pixelsapart.
Generation of model images of sinusoidal test patters. To test theinfluence of irreversible compression schemes on the effectivemodulation transfer of an optical microscope, sequencesof synthetic images (512 × 512 pixels, 8 bit) containingvertical sinusoidal test patterns were generated (Fig. 1). Asequence comprised the patterns characterized by the periodfrom 2 (T min) to 128 (T max) pixels. The minimum intensity(amplitude) was set to 0, whereas the maximum intensity wascalculated for each pattern using the approximate formula formicroscope MTF (Stokseth, 1969):
Imax = Nmax × (1 − 0.69 f + 0.0076 f 2 + 0.04 f 3)2,
where
f = 2 ∗(
1T
− 1Tmax
) (1
Tmin− 1
Tmax
)−1
, (1)
C© 2008 The AuthorsJournal compilation C© 2008 The Royal Microscopical Society, Journal of Microscopy, 231, 81–96

I M P R O V I N G C O M P R E S S I O N E F F I C I E N C Y W I T H W A V E L E T D E N O I S I N G 8 3
Fig. 1. Influence of compression on the effective MFT in an imaging system where a high maximal number of photons (200) was registered. The MTFwas represented by a series of images of sinusoidal test patterns without noise (white bars), with Poisson noise (grey bars) or with Gaussian noise (blackbars). A negative contrast value indicates a decrease in the energy of a spatial frequency, whereas a positive contrast value indicates an increase of theenergy. The images were compressed using irreversible JPEG2000 (A and C) and JPEG (B and D), with a compression ratio of 6× (A and B) or 18×(C and D).
where f is the normalized spatial frequency, T the spatialperiod of the sinusoidal pattern, T min, T max the minimum (2)and maximum (128) values of T, Nmax the maximum photonnumber (50 or 200) and Imax the maximum intensity.
The calculations were performed using 64-bit numbers(IEEE floating point), and the results (Imax) were roundedto 8-bit integers. The maximum intensity (Imax) decreaseswith increasing spatial frequency (decreasing spatial period).Therefore, the image sequence represents the MTF of aconfocal microscope. Two such sequences were generatedwith Nmax set to 50 or 200 to simulate images registered withlow and high photon numbers, respectively.
SNR estimation and image compression in wavelet domain
It has been demonstrated that the image-compression ratiocan be improved through a suitable denoising procedure(Chang et al., 2000). The greatest part of the noise present
in microscope images is caused by inherent variation in thearrival rate of photons owing to the quantum nature of light.We demonstrated previously that the noise present in thebiological micrographs registered with our imaging systemis signal-dependent and may be adequately described usingPoisson model (Amer et al., 2002; Bernas et al., 2005a). Thus,an unbiased Poisson noise estimator [described in Nowak &Baraniuk (1999)] is combined with the bivariate wavelet-shrinkage algorithm (Sendur & Selesnick, 2002) to performimage denoising. Briefly, two forward wavelet transforms(three decomposition levels) of images are calculated usinga bi-orthogonal 3.3 wavelet:
SI =∑
k,l
wI (k, l)λ(k, l), (2)
where SI is the ith wavelet coefficient (signal), wI (k, l)bi-orthogonal wavelet, λ(k, l) the image intensity, l and kthe image spatial coordinates.and squared bi-orthogonal 3.3
C© 2008 The AuthorsJournal compilation C© 2008 The Royal Microscopical Society, Journal of Microscopy, 231, 81–96

8 4 T . B E R N A S E T A L .
wavelet:
σ 2I =
∑k,l
w2I (k, l)λ(k, l), (3)
where σ 2I is the noise variance associated with the ith wavelet
coefficient, w2I (l, k) is the squared bi-orthogonal wavelet
as described in Nowak & Baraniuk (1999). This procedureprovides an unbiased estimate of noise calculated separatelyfor each wavelet coefficient. The original wavelet shrinkagescheme described in Nowak & Baraniuk (1999) did not takeadvantage of the fact that wavelet coefficients at differentresolution scales (but corresponding to the same image region)are correlated. Hence, to exploit correlation between respectivedetail coefficients at finer (child) and coarser (parent) scales,wavelet shrinkage algorithm described in Sendur & Selesnick(2002) was applied instead. Briefly, large child coefficients,which do not correspond to large parent coefficients, arelikely to represent only noise and therefore are decreased. Theshrinkage procedure is constructed using the following set ofequations:
SI c = RI c
(1 +
√3σ 2
I c
δ2c r
)= RI c Fc
SI p = RI p
(1 +
√3σ 2
I p
δ2pr
)= RI c Fp ,
where
r =
√√√√(RI c
δc
)2
+(
RI p
δp
)2
and
δ2c = 1
N2c
∑n∈C
S2I n
δ2p = 1
N2p
∑n∈P
S2I n,
(4)
where SIc and SIp are the initial child and parent waveletcoefficients, RIc and RIp, the resulting (shrunk) child and parentwavelet coefficients, σ 2
I c and σ 2I p, the child and parent noise
variances, δ2c and δ2
p , the variances of distributions of waveletcoefficients belonging to child (c) and parent (p) sub-bands andNp and Nc the number of child and parent coefficients.
These equations cannot be solved in an analytical way togive the wavelet shrinkage functions. Thus, the shrinkage isexecuted in an iterative manner using an algorithm based on(Sendur & Selesnick, 2002):1. Initialize parameters:; k = 1, RIc
k = SIc, RIpk = SIp
2. Calculate r, Fp and Fc using RIck, RIp
k
3. Find RIck+1, RIp
k+1 using RIck+1 = RIc
k/Fc and RIpk+1 =
RIpk/Fp
4. Calculate the absolute differences; εc = |RIck+1 − RIc
k|,εp = |RIp
k+1 − RIpk|
5. If εc < =1 and εp < =1, then set RIc = RIck and terminate;
otherwise set k = k+1, RIck = RIc
k−1, RIpk = RIp
k−1 and goto step 2
This procedure is executed with the wavelet coefficients atfirst and second decomposition levels constituting the parentand the child sub-bands, respectively. Following shrinkage, areverse wavelet transform is executed on SI:
λd = w−1 Sd (5)
where Sd is the denoised wavelet image representation, w−1
the inverse wavelet transform and λd the denoised image.One should note that in original wavelet shrinkage
procedure described in Sendur & Selesnick (2002) wasconstructed to remove only signal-independent (Gaussian)noise. Therefore, to validate the proposed method, the signalintensity was calculated as an average from the resulting(denoised) images over the regions where the pixel valuewas greater than 30. The absolute difference between thedenoised and initial images in these regions was used as anestimate of the noise level and compared to a noise estimateobtained with independent technique, as described in ourearlier papers (Bernas et al., 2005a; Bernas et al., 2006). Wedemonstrated that change of pixel intensity introduced by theproposed algorithm follows expected Poisson characteristicswith respect to dependence on remaining signal and the noisemagnitude (Bernas et al., 2005a; Bernas et al., 2006).
Wavelet compression and coding. Execution of the wavelet-shrinkage algorithm results in zeroing of some waveletcoefficients in the denoised image, as described earlier. Thezeroed coefficients represented noise modelled by Poissondistribution. This information-preserving noise removalconstitutes the irreversible (‘lossy’) step of the compressionalgorithm. This procedure is followed by reversible (‘lossless’)image coding using a wavelet representation (format),which is part of the JPEG2000 specification (ISO/IEC,2002). Where indicated, irreversible JPEG2000 compressionwas used. Both procedures were executed using JasPer(http://www.ece.uvic.ca/∼mdadams/jasper/).
Estimation of image distortion in compression
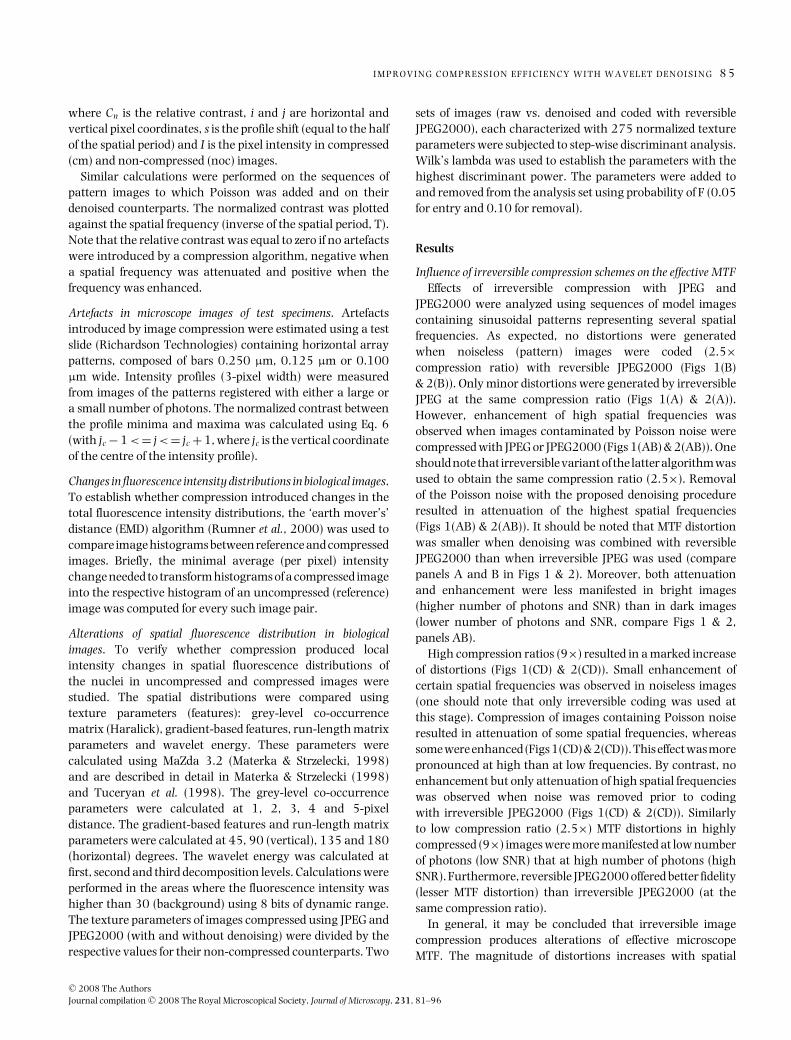
Alteration of effective microscope MTF. The sequences of thepattern images were compressed using JPEG or coded withreversible or irreversible JPEG2000. The contrast between theminima and maxima of these test patterns was calculatedas total difference between the image and its copy shiftedhorizontally by the distance equal to the pattern period. Thecontrast was then normalized to the value obtained for thenon-compressed counterparts of these pattern images usingthe formula:
C n =
∑i , j
|Icm(i , j ) − Icm(i + s, j )|∑i , j
|Inoc (i , j ) − Inoc (i + s, j )| − 1 (6)
C© 2008 The AuthorsJournal compilation C© 2008 The Royal Microscopical Society, Journal of Microscopy, 231, 81–96
I M P R O V I N G C O M P R E S S I O N E F F I C I E N C Y W I T H W A V E L E T D E N O I S I N G 8 5
where Cn is the relative contrast, i and j are horizontal andvertical pixel coordinates, s is the profile shift (equal to the halfof the spatial period) and I is the pixel intensity in compressed(cm) and non-compressed (noc) images.
Similar calculations were performed on the sequences ofpattern images to which Poisson was added and on theirdenoised counterparts. The normalized contrast was plottedagainst the spatial frequency (inverse of the spatial period, T).Note that the relative contrast was equal to zero if no artefactswere introduced by a compression algorithm, negative whena spatial frequency was attenuated and positive when thefrequency was enhanced.
Artefacts in microscope images of test specimens. Artefactsintroduced by image compression were estimated using a testslide (Richardson Technologies) containing horizontal arraypatterns, composed of bars 0.250 μm, 0.125 μm or 0.100μm wide. Intensity profiles (3-pixel width) were measuredfrom images of the patterns registered with either a large ora small number of photons. The normalized contrast betweenthe profile minima and maxima was calculated using Eq. 6(with jc − 1 <= j <= jc + 1, where jc is the vertical coordinateof the centre of the intensity profile).
Changes in fluorescence intensity distributions in biological images.To establish whether compression introduced changes in thetotal fluorescence intensity distributions, the ‘earth mover’s’distance (EMD) algorithm (Rumner et al., 2000) was used tocompare image histograms between reference and compressedimages. Briefly, the minimal average (per pixel) intensitychange needed to transform histograms of a compressed imageinto the respective histogram of an uncompressed (reference)image was computed for every such image pair.
Alterations of spatial fluorescence distribution in biologicalimages. To verify whether compression produced localintensity changes in spatial fluorescence distributions ofthe nuclei in uncompressed and compressed images werestudied. The spatial distributions were compared usingtexture parameters (features): grey-level co-occurrencematrix (Haralick), gradient-based features, run-length matrixparameters and wavelet energy. These parameters werecalculated using MaZda 3.2 (Materka & Strzelecki, 1998)and are described in detail in Materka & Strzelecki (1998)and Tuceryan et al. (1998). The grey-level co-occurrenceparameters were calculated at 1, 2, 3, 4 and 5-pixeldistance. The gradient-based features and run-length matrixparameters were calculated at 45, 90 (vertical), 135 and 180(horizontal) degrees. The wavelet energy was calculated atfirst, second and third decomposition levels. Calculations wereperformed in the areas where the fluorescence intensity washigher than 30 (background) using 8 bits of dynamic range.The texture parameters of images compressed using JPEG andJPEG2000 (with and without denoising) were divided by therespective values for their non-compressed counterparts. Two
sets of images (raw vs. denoised and coded with reversibleJPEG2000), each characterized with 275 normalized textureparameters were subjected to step-wise discriminant analysis.Wilk’s lambda was used to establish the parameters with thehighest discriminant power. The parameters were added toand removed from the analysis set using probability of F (0.05for entry and 0.10 for removal).
Results
Influence of irreversible compression schemes on the effective MTFEffects of irreversible compression with JPEG and
JPEG2000 were analyzed using sequences of model imagescontaining sinusoidal patterns representing several spatialfrequencies. As expected, no distortions were generatedwhen noiseless (pattern) images were coded (2.5×compression ratio) with reversible JPEG2000 (Figs 1(B)& 2(B)). Only minor distortions were generated by irreversibleJPEG at the same compression ratio (Figs 1(A) & 2(A)).However, enhancement of high spatial frequencies wasobserved when images contaminated by Poisson noise werecompressed with JPEG or JPEG2000 (Figs 1(AB) & 2(AB)). Oneshould note that irreversible variant of the latter algorithm wasused to obtain the same compression ratio (2.5×). Removalof the Poisson noise with the proposed denoising procedureresulted in attenuation of the highest spatial frequencies(Figs 1(AB) & 2(AB)). It should be noted that MTF distortionwas smaller when denoising was combined with reversibleJPEG2000 than when irreversible JPEG was used (comparepanels A and B in Figs 1 & 2). Moreover, both attenuationand enhancement were less manifested in bright images(higher number of photons and SNR) than in dark images(lower number of photons and SNR, compare Figs 1 & 2,panels AB).
High compression ratios (9×) resulted in a marked increaseof distortions (Figs 1(CD) & 2(CD)). Small enhancement ofcertain spatial frequencies was observed in noiseless images(one should note that only irreversible coding was used atthis stage). Compression of images containing Poisson noiseresulted in attenuation of some spatial frequencies, whereassome were enhanced (Figs 1(CD) & 2(CD)). This effect was morepronounced at high than at low frequencies. By contrast, noenhancement but only attenuation of high spatial frequencieswas observed when noise was removed prior to codingwith irreversible JPEG2000 (Figs 1(CD) & 2(CD)). Similarlyto low compression ratio (2.5×) MTF distortions in highlycompressed (9×) images were more manifested at low numberof photons (low SNR) that at high number of photons (highSNR). Furthermore, reversible JPEG2000 offered better fidelity(lesser MTF distortion) than irreversible JPEG2000 (at thesame compression ratio).
In general, it may be concluded that irreversible imagecompression produces alterations of effective microscopeMTF. The magnitude of distortions increases with spatial
C© 2008 The AuthorsJournal compilation C© 2008 The Royal Microscopical Society, Journal of Microscopy, 231, 81–96

8 6 T . B E R N A S E T A L .
Fig. 2. Influence of compression on the effective MFT in an imaging system where a low maximal number of photons (50) was registered. The MTF wasrepresented by a series of images of sinusoidal test patterns without noise (white bars), with Poisson noise (grey bars) or with Gaussian noise (black bars).A negative contrast value indicates a decrease in the energy of a spatial frequency, whereas a positive contrast value indicates an increase of the energy.The images were compressed using irreversible JPEG2000 (A and C) and JPEG (B and D), with a compression ratio of 6× (A and B) or 18×(C and D).
frequency. The presence of Poisson noise aggravates theproblem, which becomes more severe as SNR decreases.Removal of the noise with the proposed algorithm resultedin a decrease in magnitude of distortions at the expense ofattenuation of the highest spatial frequencies. However, noenhancement of spatial frequencies was observed in denoisedimages. This notion suggests that the application denoisingresults in removal of small image details (corresponding tofrequencies close to MTF cut-off) and prevents introductionof image artefacts of similar size. Furthermore, one mayexpect application of denoising would produce a decrease inimage file size. Therefore, denoising followed by JPEG2000coding (either reversible or irreversible) seems optimal strategyfor compression of light micrographs. This strategy wasimplemented and tested in practice of biological fluorescencemicroscopy, as described in the next paragraphs.
Performance of wavelet-shrinkage followed by reversible (lossless)JPEG2000 coding
Biological images. A set of fluorescence images of PI-stainednuclei was denoised using the proposed algorithm (seeMaterials and Methods) and compressed using the reversibleJPEG2000 encoding, as illustrated in an example in Fig. 3.No gross artefacts were generated and efficient compressionwas achieved. Presence of artefacts at compression ratios werestudied in detail using a set of 470 images containing varyingnumbers of nuclei and characterized by different intensitylevels.
The compression ratios increased with decreasingfluorescence intensity (data not shown). As expected, thereversible JPEG2000 coding preceded by denoising exhibitedhigher compression efficiency than the reversible JPEG2000coding (the most efficient lossless compression method) alone
C© 2008 The AuthorsJournal compilation C© 2008 The Royal Microscopical Society, Journal of Microscopy, 231, 81–96

I M P R O V I N G C O M P R E S S I O N E F F I C I E N C Y W I T H W A V E L E T D E N O I S I N G 8 7
Fig. 3. Effects of wavelet-based denoising (shrinkage) on a representativeimage of a cell nucleus stained using propidium iodide (PI). File sizes ofthe raw (A, saved as TIFF) and denoised (B, encoded using the reversibleJPEG200) images are shown in kilobytes (kb). Bar – 5 μm. The image isreproduced from the Figure 4 presented in Bernas et al. (2006).
(Fig. 4). Detailed information on application this and similartechniques for compression of biological micrographs werepublished in previous papers (Bernas et al., 2005a; Bernaset al., 2006).
The compressed images were compared quantitatively totheir uncompressed counterparts with respect to the intensity
Fig. 4. Overall compression efficiency of the reversible JPEG2000 with(grey) and without (white) wavelet shrinkage. Data range indicated withbars, 10th and 90th percentiles with boxes and median compression ratioswith vertical lines. The data are extracted from Figure 6 in Bernas et al.(2006).
distribution (histogram). Average EMD (see Materials andMethods) was equal to 1.18 ± 0.14 (see also Table 1), whichindicated that the denoising did not introduce gross changesto histograms.
Possible changes in spatial fluorescence distribution withincell nuclei were analyzed using the Haralick textureparameters (entropy, sum of squares and difference variance)and wavelet energy (first and second decomposition levels).These features were chosen so as to provide the highestdiscriminative power between sets of image compressed usingdifferent algorithms (as discussed further, see also Materialsand Methods). The wavelet denoising resulted in only a slightdecrease of entropy (a measure of information, Fig. 5(A)).The decrease was more pronounced at a 2- than at a 5-pixeldistance, which indicates that the finer (smaller than Rayleighresolution distance, see Materials and Methods) details wereaffected more than the coarser (larger but close to Rayleighresolution distance) details. The sum of squares (a measureof intensity distribution width) was slightly decreased by thedenoising at both distances (Fig. 5(B)). A larger decrease wasobserved in the case of the difference variance (a measure ofcontrast, Fig. 5(C)). One should note that the finer (2-pixeldistance) details were more affected than the coarser (5-pixeldistance). Effects of the denoising on the texture of cell nucleiwere studied using the wavelet energy coefficients at the first(Fig. 6(A)) and second (Fig. 8(B)) decomposition levels. Aslight decrease in energy vertical (HL) and horizontal (LH)spatial frequencies was observed at the second decomposition
C© 2008 The AuthorsJournal compilation C© 2008 The Royal Microscopical Society, Journal of Microscopy, 231, 81–96

8 8 T . B E R N A S E T A L .
Table 1. Alterations of fluorescence intensity distributions (histograms) in irreversible compression, as measured usingEMD. Data are expressed as the average ± standard deviation.
Compression method Compression ratio: relative to reversible JPEG2000with denoising and absolute median (in parentheses)
1 (2.5×) 3 (7.5×) 9 (22.5×)
JPEG2000 with denoising 1.18 ± 0.14 1.17 ± 0.16 1.19 ± 0.17JPEG2000 without denoising 0.09 ± 0.02 0.15 ± 0.04 0.20 ± 0.10JPEG 0.04 ± 0.01 0.17 ± 0.04 0.78 ± 0.13
level (Fig. 6(B)). This fact indicates that the 4-pixel detailswere not affected in any significant degree. Greater decreasewas noted in the case of spatial frequencies between 2 and4 pixels (Fig. 6(B), HH), at 2 pixels (Figs 6(A), HL and LH)and higher (Figs 6(A), HH)). This notion indicates that detailssmaller than Rayleigh resolution distance were removed bythe wavelet denoising procedure. The opposite effect occurredwhen irreversible algorithms (JPEG2000 and JPEG) were used(as discussed in the next section). One may conclude that thewavelet shrinkage resulted in removal of noise, but did notsignificantly affect the details of objects that could be resolvedusing our imaging system. To validate this notion, we used amicroscope test slide containing an array pattern.
Microscope test patterns. Denoised images of an array gridpattern were compared with their raw counterparts toestimate the influence of wavelet shrinkage (wavelet-baseddenoising) followed by reversible JPEG2000 encoding on thereproduction fidelity of details of known size. The result wasquantified on the basis of contrast between the reflectiveand transparent regions of the microscope test patterns(see Materials and Methods), as shown in Fig. 7. Waveletshrinkage introduced a slight decrease of the contrast in theimages of the finest (0.100 μm, Fig. 7(A)) and a coarser(0.125 μm, Fig. 7(B)) array grating. Compression with JPEGand irreversible JPEG2000 (without denoising) resulted in anincrease of the contrast of the finest and coarser patterns.The increase was prominent when images were registeredusing a small number of photons (Fig. 7, grey bars) andcompressed using JPEG2000. Similar changes in contrast weremanifested at both short (one-bar length) and long patternshift (three-bar lengths, data not shown). The increase incontrast indicates that the artefacts were introduced into thewhole pattern at regular intervals (i.e. they were periodic).Both JPEG2000 variants (reversible and irreversible) exhibitedbetter reproduction fidelity of the coarser (0.125 μm) arraythan of the finest (0.100 μm) grating. As expected, the bestfidelity for the two test patterns was achieved when waveletshrinkage was followed by JPEG2000. The coarsest pattern(0.250 μm) was reproduced accurately by all the algorithms(Fig. 7(C)), regardless of whether denoising was applied or not.Similar data regarding application of this and other algorithms
for compression of test pattern images were also presented inBernas et al. (2006).
Performance of wavelet-shrinkage followed by irreversible (lossy)JPEG2000 coding
The results presented in the previous section led us tohypothesize that the wavelet denoising, implemented as a pre-filtering step, may reduce artefacts generated by irreversiblecompression schemes like JPEG2000. Hence, in order to verifythis notion, the set of fluorescence images of PI-stained nucleiwas denoised and subsequently encoded using the irreversibleJPEG2000. The effects of this procedure were compared withcompression using JPEG and JPEG2000 alone.
Biological images. Small values of the average EMD(Table 1, see Materials and Methods) indicate that irreversiblecompression with the ratios used did not introduce majoralterations in the image histograms. Interestingly, the largestnominal changes were observed when wavelet denoisingwas used. However, the average EMD was not affectedby the final compression ratio if the denoising step wasimplemented. Hence, one may conclude that changes in thehistogram resulted from the noise removal, not the subsequentirreversible coding. By contrast, average EMD increasedsteadily with compression ratio when JPEG or irreversibleJPEG2000 was used without denoising (the increase is higherfor JPEG than JPEG2000). These facts indicate that in thepresence of noise, histogram distortions are introduced byirreversible compression, and the magnitude of the distortionsdepends on the compression ratio.
Changes in spatial fluorescence distribution in cell nucleiwere analyzed using the Haralick texture parameters, asbefore. At the lowest (2.5×) compression level, waveletdenoising resulted in a decrease in average relative valuesof the sum of squares (Fig. 8(A), a measure of intensitydistribution width), the entropy (Fig. 8(D), a measure ofinformation) and the difference variance (Fig. 8(G), a measureof contrast). The change of entropy was the smallest, whereasthat of sum of squares the largest of the three. One should notethat the decrease in the sum of squares and difference variancewas more pronounced at a 2-pixel distance than at a 5-pixel
C© 2008 The AuthorsJournal compilation C© 2008 The Royal Microscopical Society, Journal of Microscopy, 231, 81–96

I M P R O V I N G C O M P R E S S I O N E F F I C I E N C Y W I T H W A V E L E T D E N O I S I N G 8 9
Fig. 5. Influence of wavelet denoising on textures in the images of PI-stained nuclei, determined using Haralick parameters: entropy (A), sumof squares (B) and difference variance (C). The parameters were calculatedat distances of 2 (black triangles) and 5 (grey triangles) pixels. Forclarity, only 10% of points (randomly chosen) are shown. The diagonals(indicating unchanged parameters) are depicted with dark grey lines.
distance. Application of irreversible compression schemes(JPEG and JPEG2000) without wavelet denoising resultedin a small increase of the three texture parameters. Thiseffect was most pronounced for the difference variance (Fig.
8(G)). Furthermore, the increase of the difference variance wasgreater at a 2-pixel distance than at a 5-pixel distance. Thisobservation indicates that small details (below the resolutionlimit of the imaging system) may be enhanced in the imagescompressed with JPEG and irreversible JPEG2000. At themedium (7.5×) compression level, a greater increase in thevalues of the texture parameters occurred when JPEG2000without denoising was used (Fig. 8(BEH)). By contrast, whenJPEG was used, a decrease was observed. The highest (22.5×)compression resulted in a marked decrease in the sum ofsquares, the entropy and the difference variance regardlessof the algorithm used (Fig. 8(CFI)). One should note thatwhen wavelet denoising was used, the compression leveldid not affect the magnitude of the decrease. By contrast,when JPEG and irreversible JPEG2000 (without denoising)were used, transitions from positive to negative values ofthe texture parameters were observed. A similar pattern wasrevealed when wavelet energy was used to analyze textureof the nuclei. At the low compression level, the standardmethods (without denoising) caused a slight increase in thewavelet energy corresponding to small (not resolvable) details(Fig. 9(AB)). Greater enhancement was observed at mediumcompression (Fig. 9(CD)). This effect was most prominentfor spatial frequencies between 2 and 4 pixels (Fig. 9(D),HH), 2 pixels (Fig. 9(C), HL & LH) and higher than 2 pixels(Fig. 9(C), HH). Use of the irreversible algorithms with thehighest compression rations resulted in a decrease in waveletenergy of all but the lowest spatial frequencies (Fig. 9(F), HL &LH bands). One should note that in the denoised images, thetextures of the nuclei were, in general, not influenced by thecompression level (Compare Fig. 9(AB)–(EF)). A change couldbe detected only in the highest spatial frequencies in the imagescompressed with the highest ratios (Fig. 9(E)). Thus, one mayconclude that JPEG and irreversible JPEG2000 compressionschemes introduced artefacts into images containing Poissonnoise. Furthermore, irreversible compression not precededby denoising might remove some image content, which isnot identified as noise. The resultant image distortion is anet product of these two effects as illustrated in the Figs10(C) and (D). The obtained results strongly suggest that theproposed method of wavelet-based denoising helps preservedata integrity in microscope images that are subsequentlycompressed with irreversible JPEG2000. To validate thisnotion, we again used the microscope test slide with an arraygrid pattern.
Images of microscope test patterns compressed with irreversibleJPEG2000 coding. The procedure described for reversibleJPEG2000 coding (Fig. 7) was repeated using irreversibleJPEG2000 (with or without denoising) and JPEG. Compressedimages were compared with their raw counterparts to estimatethe fidelity of reproduction of details of known sizes. Thefidelity of reconstruction was quantified on the basis ofthe contrast between reflective and transparent regions of
C© 2008 The AuthorsJournal compilation C© 2008 The Royal Microscopical Society, Journal of Microscopy, 231, 81–96

9 0 T . B E R N A S E T A L .
Fig. 6. Influence of wavelet denoising on textures in the images of PI-stained nuclei, determined using wavelet (Haar) decomposition. The relative waveletenergy was measured at first (A) and second (B) decomposition levels, following application of high-pass (H) and low-pass (L) filters in sequence.
the patterns (see Materials and Methods). Only slight changesin the relative contrast of the finest (0.100 μm, Fig. 11(A))pattern were observed at moderate compression ratio (7.5×).However, an increase in the contrast of the coarser (0.125 μm,Fig. 11(C)) pattern was observed in the images compressedwith JPEG2000 without denoising. JPEG2000 used witha high compression ratio (approximately 22.5×) resultedin a marked decrease in contrast of the fine and coarserpatterns registered with a small number of photons(Figs 11(B) and (D), respectively). However, an increase inthe contrast was observer when JPEG was used. It was alsoobserved that high spatial frequencies (represented by thefine and the coarser patterns) were significantly attenuatedat the highest compression level of JPEG (Figs 11(B) and (D),respectively). This effect was emphasized when the number ofphotons was low. Comparing results of compression at low(Fig. 7), moderate (Fig. 11(ACE)) and high (Fig. 11(BDF))ratios, it was observed that if JPEG or JPEG2000 is used(both without the denoising step), high spatial frequenciesthat were initially enhanced became attenuated as the ratioincreased. This observation indicates that periodic artefactswere introduced at low compression levels. By contrast, ifwavelet denoising was applied before JPEG2000 encoding,only continuous attenuation or no change was detected.As expected, the distortions introduced by the irreversibleencoding were smaller in the case of denoised images thanin the case of original images.
Discussion
Current irreversible (‘lossy’) compression schemes areoptimized to preserve perceptual image quality. Consequentlyan ‘information-preserving’ algorithm, as understood byACR/NEMA standard (National Electrical Manufacturers,2004), retains all the significant information when itis ‘visually lossless’. Efforts to meet this requirementresulted in development of JPEG2000 to supersede the
older JPEG. Nonetheless, the latter is still the acceptedindustry standard for irreversible compression of imagesregistered with light microscopy owing to its implementationin numerous microscopy-related packages used by cellbiologists, pathologists, and microbiologists. Even thoughperceptual image quality is not decreased (Grgic et al.,2003; Ebrahimi et al., 2004), application of both JPEGand irreversible JPEG2000 may cause detectable alterationsin image characteristics. We used synthetic images and amicroscope specimen comprising a periodic test pattern todemonstrate that such distortions are reflected in the effectiveMTF. Therefore, use of irreversible compression will affectevery kind of image data generated by biological microscopy.The magnitude and type distortions were dependent oncompression ratio, spatial frequency and SNR. Although ata low compression ratio, enhancement of the highest spatialfrequencies (transferred by a microscope) was observed, bothattenuation and enhancement of the frequencies in this rangewere detectable when the ratio was high. Closer examinationof real microscope data revealed that in some image regions,small image details were introduced, whereas in others detailsof the same scale were removed. One may note that the formereffect corresponded to enhancement of high spatial frequencies(high-pass filtering), whereas the latter to their attenuation(low-pass filtering). It is not surprising that the distortions weremost pronounced when the number of registered photons (andSNR) was low.
We demonstrated that the MTF distortions could bemitigated if the noise was removed. Moreover, denoisingreduces the amount of memory required to encode an imageby discarding a part which can be proved not to carryinformation on the imaged object. Therefore, this proceduremay assist the operation of standard compression algorithmswhile preserving integrity of image data. We ascertainedthat the proposed denoising method did not introduce anyartefacts to the images of periodic grating arrays. Theresponse of an imaging system to such patterns is an
C© 2008 The AuthorsJournal compilation C© 2008 The Royal Microscopical Society, Journal of Microscopy, 231, 81–96

I M P R O V I N G C O M P R E S S I O N E F F I C I E N C Y W I T H W A V E L E T D E N O I S I N G 9 1
Fig. 7. Influence of irreversible compression on images of the array testpattern registered with large (average of 72.8 per pixel, white bars) andsmall (an average of 4.1 per pixel, dark bars) number of photons. Thefidelity of reproduction of the test pattern was estimated using relativecontrast between the bright and dark bars (see Materials and Methods).The contrast was calculated shifting the pattern with respect to itself byone bar width. The respective widths were 0.100 μm (A), 0.125 μm(B) and 0.250 μm (C). The wavelet denoising followed by the reversibleJPEG2000 is shown with a slash pattern. Effects of compression (withthe same ratio as obtained using the denoising) using JPEG (backslashpattern) and JPEG2000 (grid pattern) are shown for comparison. Thesedata were also presented in (Bernas et al., 2006) in Figs 8 and 9 (oneshould note that data in this work are shown with offset of −1).
estimate of the MTF. The finest of the patterns (bar thickness0.100 μm) was characterized by a spatial frequency of5.0 μm−1, which was close to the microscope cut-offfrequency (5.7 μm−1). Therefore, it was concluded thatwavelet denoising does not impair the resolution of microscopeimaging. We validated this approach for biological imagesusing objective and human-independent measures of fidelity.We demonstrated that wavelet shrinkage followed by losslessJPEG2000 coding did not introduce significant changes tothe intensity distributions, as indicated by a small EMD(comparable with the intensity resolution). Furthermore,changes in texture of cell nuclei were consistent with removalof sub-resolution details (which, by definition, representedonly noise).
Increase of compression ratio could be achieved by usingthe wavelet denoising with irreversible JPEG2000. Such aprocedure did not prevent removal of fine details (representedby high spatial frequencies). Nonetheless, when JPEG andirreversible JPEG2000 (without denoising) were used to obtaina similar compression ratio, both removal of image details andintroduction of artefacts were observed. The artefacts weremanifested by an increase in details close to resolution limit(detectable with wavelet energy and Haralick parameters).This effect became more prominent as the compression ratioincreased. By contrast, the increase of artefact formationwith the ratio was smaller when wavelet denoising wasused. This notion is confirmed by the fact that removalof Poisson noise from synthetic MTF data and images ofperiodic grating arrays prior to irreversible compressionresulted only in attenuation of the highest spatial frequenciesbut prevented their enhancement. Therefore, the proposeddenoising technique may be applied not only to increasethe compression ratio of reversible coding methods but alsoto pre-process images before compression by irreversiblealgorithms. To our knowledge no similar analysis of influenceof irreversible compression of microscope data has beenpresented by other workers.
It may be noted that images used in this work containedcell nuclei characterized by relatively simple morphology(in comparison to cytoskeleton or endoplasmatic reticulum).In other words, the micrographs contained small numberof objects (features) close to resolution limit (accordingto Rayleigh criterion). Therefore, one may postulate thatcompression-induced loss of biological information present inthe micrographs could be greater if images comprised moreobjects close to resolution limit (complex morphology). Oneshould note that the proposed denoising algorithm itself didnot generate artefacts of this size and prevented their formationwhen irreversible coding was used. Instead, the denoisingresulted in attenuation of the highest spatial frequencies (actedas a low-pass filter). However, two point sources positionedat the distance equal to the lowest of the attenuated spatialfrequencies could not be resolved according to Rayleighcriterion. Furthermore, it is likely that such spatial frequencies
C© 2008 The AuthorsJournal compilation C© 2008 The Royal Microscopical Society, Journal of Microscopy, 231, 81–96

9 2 T . B E R N A S E T A L .
Fig. 8. Alteration of textures of PI-stained nuclei in images compressed with JPEG2000 (with and without denoising) and JPEG. The algorithms wereset to provide the following absolute compression ratios: low (2.5×, ADG), moderate (7.5×, BEH) or high (22.5×, CFI). The nuclei were analyzed usingrelative (see Materials and Methods) texture (Haralick) parameters: sum of squares (ABC), entropy (DEF) and difference variance (GHI). The parameterswere calculated at a distance of 2 (white bars) and 5 (grey bars) pixels. The standard deviation is represented with error bars.
might not be retrieved from a biological micrograph (whichdoes not usually contain sinusoidal patterns) owing to thepresence of noise. Therefore, it is probable that the proposeddenoising routine should perform at least equally well in caseof biological micrographs containing objects of more complexmorphology than cell nuclei. This notion is supported byour latest results, which are being prepared for a separatepublication.
The approach proposed in this manuscript focusses oncharacteristics of input images, instead of analyzing theoutput of image interpretation/analysis procedures. Tovalidate irreversible compression algorithm for microscopyapplications, one may demonstrate that irreversiblecompression did not affect results of specified measurements
that used the images as input data (Cosman et al., 1994;Tengowski, 2004). However, modern imaging techniquesfrequently involve automated schemes of image analysis.Therefore, logically such validation procedures should berepeated whenever biological sample, imaging system,image-registration conditions or image-analysis procedure ischanged. Consequently, even though compliance of JPEG andirreversible JPEG2000 with 21 CFR part 11 can be ascertainedusing this approach (Cosman et al., 1994; Tengowski, 2004), itmay not easily be extended or generalized, and may be limitedto standard, repeatable assays.
The denoising scheme proposed in this paper is similarto algorithms published previously, which comprise noiseestimator and wavelet shrinkage (thresholding) scheme where
C© 2008 The AuthorsJournal compilation C© 2008 The Royal Microscopical Society, Journal of Microscopy, 231, 81–96

I M P R O V I N G C O M P R E S S I O N E F F I C I E N C Y W I T H W A V E L E T D E N O I S I N G 9 3
Fig. 9. Influence of irreversible compression on textures in images of PI-stained nuclei, determined using wavelet (Haar) decomposition. The images werecompressed using denoising followed by JPEG2000, irreversible JPEG2000 (without denoising) and JPEG with low (2.5×, AB), moderate (7.5×, CD) andhigh (22.5×, EF) absolute compression ratios. The relative wavelet energy was measured at first (ACD) and second (BEF) decomposition levels, followingapplication of high-pass (H) and low-pass (L) filters in sequence. The standard deviation is represented with error bars.
amount of shrinkage depends on SNR (Kolaczyk, 1997;Kolaczyk, 1999b; Nowak & Baraniuk, 1999). The proposedalgorithm includes an unbiased Poisson noise estimator(described in (Nowak & Baraniuk, 1999) but instead of single-step wavelet thresholding method presented in this paperan iterative bivariate wavelet technique (Sendur & Selesnick,2002) was applied to perform image denoising. Consequently,one may not claim that the proposed denoising method isoptimal in limiting case (i.e. when the number of waveletcoefficients is infinite) (Nowak, 1997; Nowak & Baraniuk,
1999). However, in a non-limiting case (finite number ofcoefficients corresponding to a micrograph) performance ofthe proposed method was similar or better compared withthe former algorithm (Nowak & Baraniuk, 1999) (data notshown). Furthermore, one may expect that performance thisPoisson noise estimator (Nowak & Baraniuk, 1999) combinedwith wavelet shrinkage should be superior to alternativemethods of removal of this form of noise (Besbeas et al.,2004) when signal components are broad and their edgesare smooth. One should note that a band-limited microscope
C© 2008 The AuthorsJournal compilation C© 2008 The Royal Microscopical Society, Journal of Microscopy, 231, 81–96

9 4 T . B E R N A S E T A L .
Fig. 10. Distortion in images of cell nuclei stained with PI in the course of irreversible compression. The fragment indicated with a white square (A, rawimage) was magnified to show effects of compression (ratio 22.5×) with irreversible JPEG2000 with denoising (B) and without denoising (C) and JPEG(D). Bar – 2.5 μm.
image is sampled at Nyquist frequency is likely to represent thistype of data. Another important advantage of this approachto image denoising is its flexibility. In our imaging system,photonic noise was predominant and therefore might becharacterized using simple Poisson model. However, theproposed approach presented here may easily be extendedto incorporate other noise sources modelled as composite(additive, power or multiplicative) functions of the signal.Examples of such extension include removal of Rician noisefrom NMR images (Nowak, 1999). This type of noise is signal-dependent and tends to approach Rayleigh distribution at lowSNR, whereas at high SNR, its distribution is approximatelyGaussian (Nowak, 1999). Composite type of noise is presentalso in fluorescence micrographs registered with a CCD camera(Bernas et al., 2007). At low signal level, the noise is signal-independent with Gaussian distribution, whereas at high level,the noise is signal-independent and follows Poisson statistics(Bernas et al., 2007). Hence, if a function of dependencebetween noise and signal is for a given detector, one may embedit into denoising procedure which, consequently, may beconstructed so as preserve signal registered using the imagingsystem (microscope) equipped with this detector.
Our data do not permit us to make general statementsregarding the computational complexity of the proposedmethod. However, the denoising procedure implementedon an entry-level desktop PC typically required 15s–18s.Therefore, we think that although the complexity is on thehigh side, it is not prohibitive.
The denoised images were coded using a simple scalarquantization implemented in JPEG2000 (ISO/IEC, 2002).However, our preliminary results indicate that use of moresophisticated coding techniques like SFQ (Xiong et al., 1997)results in a further decrease in size of the denoised imagefiles without information loss. Thus, one may optimize acoding/quantization procedure to take best advantage of aparticular image denoising procedure.
Acknowledgement
This work was partially supported by the Foundation for PolishScience (TB) and Purdue University Cytometry Laboratories.We would like to thank Gretchen Lawler for assistance inediting the manuscript.
C© 2008 The AuthorsJournal compilation C© 2008 The Royal Microscopical Society, Journal of Microscopy, 231, 81–96

I M P R O V I N G C O M P R E S S I O N E F F I C I E N C Y W I T H W A V E L E T D E N O I S I N G 9 5
Fig. 11. Influence of irreversible compression on images of the array test pattern registered with large (average of 72.8 per pixel, white bars) and small (anaverage of 4.1 per pixel, dark bars) number of photons. The images were compressed with moderate (7.5×, ACE) and high (22.5×, BDF) absolute ratios.The fidelity of reproduction of the test pattern was estimated using relative contrast between the bright and the dark bars (see Materials and Methods).The contrast was calculated shifting the pattern with respect to itself by one bar width. The respective widths were 0.100 μm (AB), 0.125 μm (CD) and0.250 μm (EF). The wavelet denoising followed by irreversible JPEG2000 (moderate and high ratio) is shown with slash pattern. Effects of compression(with the same ratio as obtained using the denoising) using JPEG (backslash pattern) and irreversible JPEG2000 without denoising (grid pattern) areshown for comparison.
References
Amer, A., Dubois, E. & Mitiche, A. (2002) Reliable and fast structure-oriented video noise estimation. Proc. IEEE Int. Conf. Image Process. 1,840–843.
Bernas, T., Barnes, D., Asem, E.K., Robinson, J.P. & Rajwa, B.(2007) Precision of light intensity measurement in biological opticalmicroscopy. J. Microsc. 226, 163–174.
Bernas, T., Rajwa, B., Asem, E.K. & Robinson, J.P. (2005a) The lossof image quality in photobleaching during microscopic imaging offluorescent probes bound to chromatin. J. Biomed. Opt. 10, 64015–64020.
Bernas, T., Rajwa, B., Asem, E.K. & Robinson, J.P. (2006) Compressionof fluorescence microscopy images based on the signal-to-noiseestimation. Microsc. Res. Tech. 69, 1–9.
C© 2008 The AuthorsJournal compilation C© 2008 The Royal Microscopical Society, Journal of Microscopy, 231, 81–96
9 6 T . B E R N A S E T A L .
Bernas, T., Robinson, J.P., Darzynkiewicz, Z., Hyun, W., Orfao, A. &Rabinovitch, P. (2005b) Basics of digital microscopy. Current Protocolsin Cytometry (ed. by J.P. Robinson), pp. 1–14. Wiley-Liss, New York.
Bernas, T., Zarebski, M., Cook, P.R. & Dobrucki, J.W. (2004) Minimizingphotobleaching during confocal microscopy of fluorescent probesbound to chromatin: role of anoxia and photon flux. J. Microsc. 215,281–296.
Besbeas, P., Feis, I. & Sapatinas, T. (2004) A comparative simulation studyof wavelet shrinkage estimators for poisson counts. Int. Stat. Rev. 72,209–237.
CFR (2004) 21 Code of Fedaral Regulations part 11.Chang, G., Yu, B. & Vatterli, M. (2000) Adaptive wavelet thresholding
for image denoising and compression. IEEE Trans. Image Process. 9,1532–1546.
Chen, C.C. (1998) On the Selection of Image Compression Algorithms.Cosman, C., Gray, R.M. & Olshen, R.A. (1994) Evaluating quality of
compressed medical images: SNR, subjective rating, and diagnosticaccuracy. Proc. IEEE. 82, 919–932.
Donoho, D.L. (1993) Non-linear wavelet methods for recovery of signals,densities and spectra from indirect and noisy data. Symposium in AppliedMathematics: Different Perspectives on Wavelets (ed. by I. Daubechies).American Mathematical Society, San Antonio.
Donoho, D.L. (1995) De-noising by soft thresholding. IEEE Trans. Inf.Theor. 41, 613–627.
Donoho, D.M. & Johnstone, J.L. (1994) Ideal denoising in an orthonormalbasis chosen from a library of bases. Comput. Rend. Acad. Sci. Paris Ser.319, 1317–1322.
Ebrahimi, F., Chamik, M. & Winkler, S. (2004) JPEG vs. JPEG2000: anobjective comparison of image encoding quality. Proc. SPIE Appl. DigitalImage Process. 5558, 300–3008.
Fryzlewicz, P. & Nason, G.P. (2001) Poisson intensity estimation usingwavelets and the Fisz transformation. Department of Mathematics,University of Bristol, Bristol, United Kingdom.
Grgic, S., Mrak, M., Grgic, M. & Zovko-Cihlar, B. (2003) Comparative studyof JPEG and JPEG2000 image coders. Proceedings of the 17th Conferenceon Applied Electromagnetics and Communications, 109–112.
ISO/IEC (1994) ISO/IEC, ITU-T, Information technology–Digital comp-ression and coding of continuous-tone still images: Requirementsand guidelines, ISO/IEC International Standard 10918-1 and ITU-TRecommendation T.81.
ISO/IEC (2002) ISO/IEC, ITU-T, Information technology – JPEG 2000image coding system: Extensions, ISO/IEC International Standard15444-2 and ITU-T Recommendation T.801
Kolaczyk, A.D. (1999a) Bayesian multiscale models for Poisson processes.J. Am. Statist. Assoc. 94, 920–933.
Kolaczyk, A.D. (1999b) Wavelet shrinkage estimation of certain Poissonintensity signals using corrected thresholds. Statist. Sinica. 9, 119–135.
Kolaczyk, E.D. (1997) Non-parametric estimation of Gamma-Ray burstintensities using Haar wavelets. Astrophys. J. 483, 340–349.
Materka, A. & Strzelecki, M. (1998) Texture analysis methods – a review.COST B11 report 1–33.
National Electrical Manufacturers, A.N. (2004) Digital imaging andcommunications in medicine (DICOM) ROsslyn.
Nowak, R. & Baraniuk, R.G. (1999) Wavelet domain filter for photonimaging systems. IEEE Trans. Image Process. 8, 1–24.
Nowak, R.D. (1997) Optimal signal estimation using cross validation.IEEE Sig. Proc. Lett. 4, 23–25.
Nowak, R.D. (1999) Wavelet-based Rician noise removal for magneticresonance imaging. IEEE Trans. Image Process. 8, 1408–1419.
Rumner, Y., Tomassi, C. & Leonidas, J.G. (2000) Earth mover’sdistance as a metric for image retrieval. Int. J. Comput. Vis. 40, 99–121.
Sendur, L. & Selesnick, I.W. (2002) Bivariate image shrinkage with localvariance estimation. IEEE Trans. Sig. Process. 50, 2744–2756.
Simoncelli, E.P. (1999) Bayesian Inference in Wavelet Based Models.Lecture Notes in Statistics (ed. by P. Muller & B. Vidakovic), pp. 291–308. Springer-Verlag, New York.
Stokseth, P. (1969) Properties of a defocused optical systems. J. Opt. Soc.Am. 59, 1314–1421.
Sung, M.M., Kim, H.J., Yoo, S.K., et al. (2002) Clinical evaluation ofcompression ratios using JPEG2000 on computed radiography chestimages. J. Digit. Imaging 15, 78–83.
Tengowski, M.W. (2004) Image compression in morphometry studiesrequiring 21 CFR Part 11 compliance: procedure is key with TIFFsand various JPEG compression strengths. Toxicol. Pathol. 32, 258–263.
Timmermann, K.E. & Nowak, R.D. (1999) Multiscale modeling andestimation of Poisson processes with applications to photon-limitedimaging. IEEE Trans. Inf. Theor. 45.
Tuceryan, M., Jain, A.K., Chen, C.H. & Pau, L.F.W.P.S.P. (1998) Textureanalysis. Handbook of Pattern Recognition and Computer Vision, 2nd edn(ed. by C.H. Chen & P.S.P. Wang), pp. 207–248. World ScientificPublishing Co, New York.
Wohlberg, B. & de Jager, G. (1999) A review of the fractal image codingliterature. IEEE Trans. Image Process. 8, 1716–1729.
Wong, S., Zaremba, L., Gooden, D. & Huang, H.K. (1995) Radiologic imagecompression-a review. Proc. IEEE 83, 194–219.
Xiong, Z., Ramchandran, K. & Orchard, M.T. (1997) Space-frequencyquantization for wavelet image coding. IEEE Trans. Image Proc. 6, 677–693.
C© 2008 The AuthorsJournal compilation C© 2008 The Royal Microscopical Society, Journal of Microscopy, 231, 81–96