application of the fast fourier transform to impedance
TRANSCRIPT

Louisiana State UniversityLSU Digital Commons
LSU Historical Dissertations and Theses Graduate School
1988
Application of the Fast Fourier Transform toImpedance Analysis of Nitrogen - Titanium-Dioxide and Lanthanum-Trifluoride Electrodes.Kenneth Robert CarneyLouisiana State University and Agricultural & Mechanical College
Follow this and additional works at: https://digitalcommons.lsu.edu/gradschool_disstheses
This Dissertation is brought to you for free and open access by the Graduate School at LSU Digital Commons. It has been accepted for inclusion inLSU Historical Dissertations and Theses by an authorized administrator of LSU Digital Commons. For more information, please [email protected].
Recommended CitationCarney, Kenneth Robert, "Application of the Fast Fourier Transform to Impedance Analysis of Nitrogen - Titanium-Dioxide andLanthanum-Trifluoride Electrodes." (1988). LSU Historical Dissertations and Theses. 4622.https://digitalcommons.lsu.edu/gradschool_disstheses/4622

INFORMATION TO USERS
The m ost advanced technology has been used to photograph and reproduce th is m anuscript from the microfilm master. UM I film s th e tex t d irectly from th e orig in al or copy subm itted. Thus, som e thesis and dissertation copies are in typewriter face, w hile others may be from any type of computer printer.
The q uality of th is reproduction is dependent upon the quality of the copy subm itted. Broken or indistinct print, colored or poor q u a lity illu stra tion s and photographs, print bleedthrough, substandard m argins, and improper alignm ent can adversely affect reproduction.
In the unlikely event that the author did not send UMI a complete m anuscript and there are m issing pages, these w ill be noted. A lso, if unauthorized copyright m ateria l had to be removed, a note w ill indicate the deletion.
Oversize m aterials (e.g., maps, drawings, charts) are reproduced by section in g th e orig inal, b eg in n in g at th e upper left-hand corner and continuing from left to right in equal sections w ith sm all overlaps. Each original is also photographed in one exposure and is included in reduced form at the back of the book. These are also available as one exposure on a standard 35mm slide or as a 17" x 23" black and w h ite photograp hic p rin t for an ad d ition a l charge.
Photographs included in th e orig in al m anuscript have been reproduced xerographically in th is copy. H igher quality 6" x 9" black and w h ite photographic prin ts are available for any photographs or illustrations appearing in th is copy for an additional charge. Contact UMI directly to order.
U n ive rs ity M ic ro film s In te rn a tio n a A B e ll & H ow ell In fo rm a tion C o m p a n y
30 0 N o rth Z e e b RoaO A nn A rbo r M l 48 10 6 1346 USA 313 761 4 700 8 0 0 6 2 1 0 6 00

O rd er N u m b e r 8 9 1 7 0 0 1
A p p lic a tio n o f th e fa s t F o u r ie r tr a n s fo rm to im p e d a n c e a n a ly s is o f N -T lO j a n d LaF3 e le c tro d e s
Carney, Kenneth Robert, P h .D .
The Louisiana State University and Agricultural and Mechanical Col., 1988
U M I300 N. Zecb Rd.Ann Arbor, M I 48106

APPLICATION OF THE FAST FOURIER TRANSFORM TO IMPEDANCE ANALYSIS OF N-TIOa AND LAF3
ELECTRODES
A Dissertation
Submitted to the Graduate Faculty of thi Louisiana State University and
Agricultural and Mechanical College in partial fulfillm ent of the
requirements far the degree of Doctor of Philosophy
in
The Department of Chemistry
byKenneth Robert Carney
B.S., Louisiana State University in Shreveport, 19B1December 1980

TO TAMMY AND CONNOR
i i

ACKNOWLEDGEMENT
I would like to thank Dr. Robert J. Gale for his
role as my research advisor. His challenge and
guidance has been a major contribution to my
education. He has also been a friend who has given
freely of his experience and insight both scientific
and otherwise. I would also like to thank Mr. Roberto
L. Wong for his companionship during these years. I t
has been a true pleasure sharing a lab and office with
him. I t has been my good fortune to be able to spend
time bouncing ideas off of him, often with some useful
inspiration as the result. I also want to thank Betty
Armstrong for her invaluable assistance in completing
this work.
Finally and most importantly, I want to thank my
wife Tammy for her great patience during the past
several years and my son Connor Seamus for his
contribution to my l i fe over the past not so several
years. Tammy is to be credited with a substantial
contribution to this work through her encouragement and
support, not to mention her typing and editing. Connor
showed amazing patience and understanding for a three
year old. He w ill undoubtedly be happy to know that
his parents w ill again be sleeping rather than typing
through the night.

TABLE OF CONTENTS
Chapter Page
List of Tables .................................. v
Abstract ........................................................................ v li
I . Introduction ................................................................. 1
I I . Theory .................................................................................. 9A. Fourier Transfor*B. Admittance Measurements of
Electrochemical Cells
I I I . Ewperimental Techniques ............................... 50A. Instrumental ApproachesB. SoftMareC. Considerations in Selection
of Perturbation WaveformsZ>. Expertmental Procedures
IV. Results ............................................................................... 85A. Mott-Schottky Analysis of n-Ti03B. Model CircuitsC. Nonpotentiometric Use of Fluoride
Electrode
V. Summary ................................................. 1B2
References ..................................................................... 187
Appendices.................................... 195
i v

TABLES
Table
I Comparative Precision of Several Waveformson the Basis of Faradaic Admittance Data
I I Properties of Fourier and Discrete FourierTransform
I I I Mott-Schottky Results via A.C. and Pulse-FTTechni ques
IV Linear Regression of V«te on Solution pH
V Pulse-FT results for Known ResistancesUsing lOO Harmonics
VI Pulse—FT Results for Known ResistancesUsing 20 Harmonics
V II Effect of Harmonic Number on MeasuredResistance for Different Relative Pulse Lengths
V III Number of Data Paints More Than 4rFrom the Median of First 100 Harmonics
IX Experimentally Determined Values forKnown Capacitance
X Linear Regression Estimates for CorrelationBetween F.T. and a.c. Techniques
XI Linear Regression Estimates of I-V Slopesfor Negative-Going Pulses
XII Linear Regression Estimates of I-V Slopesfor Positive-Going Pulses
X III Least Squares Lines for Variationof I-V Slope with logCF_3
XIV Variation of Current with LDGCF- DUsing Single Bipolar Pulse
XV Sample One Way ANQVA Table for ComparingMeasured Current at Different Fluoride Levels
XVI Equivalent Circuit Elements for FluorideElectrode
v

Table
XVII Regression Results for Btd. Addition Method
XVIII
XIX
XX
Regression Results for Immersion Method
Analysis of Variance Results for the Standard Addition Procedure
Standard Deviation for Three Methods
v i
ABSTRACT
A study is prsssntsd of the u t i l i ty of puls*
derived waveforms for use in impedance analysis of
electrochemical systains. Factors to ba considerad in
optimization of pulsa duration and also in the propar
implamantation of tha FFT ara discussad. Impadanca
rasults ara prasantad for modal circuits and for two
nonfaradaic alactrochamical systams - n-Ti Oa alactrode
in aqueous NtaSO and LaF3 alactroda in aqueous
fluoride solution.
Tha techniques developed ware applied to model
circuits composed of aperiodic elements in order to
quantify the decrease in precision with increasing
frequency associated with pulse type waveforms. Using
8 b it digital sampling resolution and 512 point double
precision Fourier transformation, modal c ircuit rasults
showed a relative standard deviation of approximately
0.5X for tha f irs t 20 harmonics and lass than 2.5% for
all harmonics up to the 50th. Modification of the
waveform by analog high-pass filte rin g extended the
useful range to almost 2 decades. Impedance
measurements by pulse-Fourier transformation agreed
with steady state a.c. results to within 1% at
frequencies up to 100 kHz.
vi i

The technique was utid to study the
n-TiO*/electrolyte interface vis Mott-Schottky
analysis. Reliable estimates wire obtained for donor
dsnsitiss in n—TiO* crystals. Investigation of the
shift in flatband potentials with pH showed nernstian
behavior although the data showed a high degree of
scatter.
Impedance studies were made of the fluoride
selective LaF* membrane electrode in order to
investigate reported concentration dependent
conductance. Conductance was measured over frequencies
between 300 Hz and 30 kHz. Studies were made using a
standard addition method and an electrode immersion
method. For the standard addition method, an apparent
concentration dependence was seen in the frequency
regime corresponding to a hydrated surface film on the
membrane. Such concentration dependence was not seen
for the immersion method. Relative standard deviations
obtained for conductance values were on the order of
0.5X for frequencies up to 25 kHz.
v I 1 1

INTRODUCTION
The uw of mathematical transform* a* a msan* of
data analysis is far from new. For example, the us* of
logarithms dates back to Napisr 111 (1614); LaPlace
transform analysis (also callad Operational Calculus)
was applied to electrical engineering in 1892 by Oliver
Heaviside C21; and the closely related Fourier transform
was f irs t applied to a physical problem by Joseph
Fourier in 1822 C33. The long history of LaPlace
transform in electrical engineering, coupled with the
natural connection between electrical engineering and
*1ectrochemistry, makes the applications of transform
analysis seem obvious; nevertheless, the first-mentioned
application of the LaPlace transform to electrochemical
data analysis was not until Winjen C4D in 1961.
Prior to 1965, the uses of transform analyses were
restricted to formal analyses of mathematical functions;
data were approximated by known functions which were
solved analytical1y. Numerical solutions were too
costly in terms of computer time. In 1965, however, the
barrier of long computational time was largely overcome
with the publication of “An Algorithm for the Machine
Calculation of Complex Fourier Series” C53. This was
the Fast Fourier transform (FFT> algorithm, which
1

2
allowed the increased use of direct numerical Fourier
techniques rather than indirect approximation
techniques. Furthermore, advances in very large scale
integration (VLSI) computer technology dramatically
reduced the cost o-f computer time. Sy the early 1970’ s
there was a -flurry o-f numerical Fourier transform
techniques in electrochemistry 16-173, as relatively
inexpensive minicomputers became available in the
1aboratory.
Many of these early applications were to multiplexed
a.c. polarography or measurement of "faradaic
admittance" 18-153. With this burst of electrochemical
FFT applications, O. E. Smith and coworkers published a
landmark comparison of periodic and nonperiodic
waveforms that could be used for faradaic admittance
(a.c. voltammetry) measurements 1103. The results of
this comparison are summarized in Table I. Included in
this comparison were pseudorandom white noise and,
important to this work, rectangular pulse trains.
Pseudorandom white noise (PRWN) is a computer generated
waveform produced by using inverse Fourier
transformation of a spectrum with constant magnitude vs.
frequency and randomized phase vs. frequency. The
randomized phase results in a waveform with a low crest
factor (ratio of peak level to mean level). Of the

waveform* compared, this was shown to produce the
highest quality data in terms of precision and accuracy
of measured rate constants for an electrochemical
reaction. A particular form of PRWN that was found
applicable for faradaic measurements was "odd-harmonic"
PRUNf which contains only odd harmonics of a fundamental
frequency. Because nonlinear effects principally appear
in second order terms of a Taylor series C1B1,
nonlinearity is manifested most strongly in the even
harmonics of the response. Thus i f only odd harmonics
are applied to the system, the absence of any
significant even harmonic response indicates essentially
linear behavior.
□n the other hand, the rectangular pulse was
stated to be the poorest choice of waveform for faradaic
admittance measurement. Its noted disadvantages
included poor precision, errors due to leakage, and
induction of nonlinear responses in electrochemical
cells [102. Consequently, the use of pulse for FT
impedance analysis virtually disappeared.
The pulse does have some advantages in comparison
with more complex waveforms, primarily the ease of
producing pulse type waveforms, compared to the relative
expense and d ifficu lty of producing arbitrary waveforms
such as PRWN. In addition, the precise triggering of

4
waveform sampling devices is easier, and the time domain
response is somewhat interpretable, while random and
pseudo-random perturbations are not.
Finally, faradaic processes are a major
contributor to nonlinear response, and, as Creason
et a l. warned, the comparison of the various
perturbation waveforms specifically applies to faradaic
Impedance measurement. Therefore, caution should be
used regarding the general applicability of the
conclusions made by Smith and cowarkers CIO].
Furthermore, the comparison of Creason ct a l.
undervalues the quality of the pulse response data
versus "fla t magnitude spectrum" waveforms, including
PRVJN. While the PRWN waveforms were generated using
f la t magnitude spectra of 2 mV per frequency component,
the pulse used was only 2 mV for 2 milliseconds of a 100
millisecond observation period. Using the discrete
Fourier transform result for a pulse train E19], the
magnitude spectrum is
< 1 > fiT sin (irnT/T..)T„ (irnT/To)
where A is the pulse amplitude, T is the pulse duration,
To is the observation time and n is the harmonic number.
Thus, the magnitude decreases from 0.04 mV at f*10 Hz
(the fundamental harmonic of the measurement) to less
than 0.01 mV at 400 Hz and so forth, according to the

s
(sin X)/X -function in aquation ( i ) . Thus the weighted
power is far lass than that of tha othar waveforms of
similar amplitude.
Admittedly, for its application to faradaic
admittance measurements, the large crest factor of the
pulse required the use of small pulse heights and
durations, but under conditions where faradaic processes
are not significant (e.g. "slow" electron transfer
kinetics), or where large bulk impedances are
responsible for most of the potential drop across the
ce ll, much larger pulse heights may be used C171. In
fact, pulses can actually give results superior to f la t
spectrum waveforms for the f irs t several harmonics [201.
There is a recognized need for a low cost FT
impedance method [21-231. One example is in impedance
measurements in moderately high to high frequency
ranges. The Princeton Applied Research Model 273
potentiostat/galvanostat is a state of the art general
purpose electrochemical instrument with arbitrary
waveform capability, yet i t is only capable of handling
signals up to about 2 kHz, even with a high speed A/D
option. Me were in the surely not uncommon position of
having no convenient means of doing multi frequency
measurement above about 2 kHz. Thus, a simple FT
technique was a third alternative to tedious single

-frequency measurement or the purchase of expensive
frequency sweep equipment. Furthermore, illustrating
the value of pulse transform techniques for impedance
measurements could lead to other potential uses where
more complex arbitrary waveforms are not feasible^ for
example, light pulses in studying kinetics associated
with photoelectrochemical or photoemission processes,
and responses of chemical systems to changes in
component concentrations (activity changes in ion-
selective electrode systems).
In this work, methods have been developed using the
FFT in conjunction with pulse trains and related
waveforms (e.g. square wave and high pass filtered
square wave) for impedance measurements on
electrochemical systems. Three major concerns weret
(a) Could such measurements be reliably made with pulse
heights substantially below SO mV, thereby reducing
nonlinear response? (b) What was the optimum ratio
between pulse on and pulse off states? and (c) How
seriously did the 1/f nature of pulse waveforms degrade
impedance results in the higher harmonics?
The Pulse-FT impedance technique was used to study
the n-Ti0*/electrolyte interface in comparison with
steady state a.c. methods. Dummy cells were used to
compare the Pulse-FT technique with the conventional

7
steady state a.c. technique, and to determine if
systematic errors observed in the n-TiO* study were
caused by the use of pulse type waveforms or were purely
instrumental artifacts. Finally, an impedance study was
made of the Orion 94-09 fluoride (LaF3 membrane)
ion-selective electrode in an attempt to evaluate its
u t i l ity for ion—selective conductometric monitoring of
fluoride ion.

TABLE I
COMPARATIVE PRECISION OF SEVERAL WAVEFORMS PM THE-BASIS S3F FftRflPftXC
A p p liad a .c . p o te n t ia l M agnitude R a la t lv a a lo p a R e la t iv e in ta r c a p twaveform ty p a 8 . D . t ( r . ) S .D . i (r* .)
BLWN* 1 mV/f=» 3 .0 0 (2 .7 0 ) 0 .8 2 (0 .7 9 )
Combad BLMN 1 m V/f 1 .9 6 (1 .4 9 ) 0 .9 1 (0 .4 8 )
F i l t a r a d r a c t . p u la a +p u lae2 mV k 2 ma
2 3 .4 (1 6 .9 ) 1 1 .9 (4 .5 9 )
F i l t a r a d r a c t . p u la a -p u la a 2 «V x 2 ma
2 4 .9 (1 7 .6 ) 1 4 .6 (6 .3 3 )
PAWN* 0 .9 mV/f 2 .1 2 (1 .9 2 ) 0 .6 0 (0 .9 6 )
Odd-harm onic PRMN 1 .9 m V/f 2 .2 7 (1 .9 9 ) 0 .7 3 (0 .6 2 )
P h a a a -v a ry i ng, 2m V/f 0 .6 4 (0 .3 1 ) 0 .1 9 (0 .0 8 )15-component odd-harm onic a r ra y
*From r e f e ren ce 10. R a a u lta o b ta in a d from l in a a r le q a t aquaraa - f i t o f COT0 v s . w * ' * d a ta . Valuao in paranthaoao a ra a f t a r r a ja c t in g d a ta va lu a o > 2 .9 r from o r ig in a l la a o t oquarao l i n a .
*BLWN ■ b a n d w id th -lim ita d w h ita n o ia a^O b servatio n P e r io d , T „ , « 100 meec, 100 harm onica uoad 4PRMN * poaudo-random w h ita n o ia a
00

THEORY
Two broad areas o-f theory apply to this worki
Fourier transformation, and measurement of a.c.
admittance/impedance of electrochemical systems.
In order to apply Fourier trans-formation to a
variety of problems, including, but not limited to,
admittance (impedance) calculations, a good, Morking
understanding of Fourier transformation in general, and
discrete Fourier transformation in particular, is
necessary. This chapter addresses FT theory to the
extent necessary for understanding its power for general
data analyses and the most common problems with its use.
More detail on a ll aspects of FT theory and applications
are given in Brigham ClI, Braeewe11 C21, Champeney C33
and, for a very pragmatic approach, Ramirez C41.
The admittance theory of electrochemical systems
also is briefly presented below. The specifics of
admittance of semiconductor-electrolyte interfaces with
regard to surface states and space charge capacitances
are covered, as these were phenomena that were used as a
test comparison between the fast FT admittance technique
and the more conventional a.c. technique. In connection
with this, some discussion is necessary of potentiostat
stab ility under the load imposed by electrochemical
cells. Finally, in order to discuss the results of ion-
selective electrode conductance measurements, some
9

io
background has baan presented concerning tha currant
transport mechanisms of ion-selective electrodes.
FOURIER TRANSFORM
The basis for the use of Fourier transformation in
data analyses derives from Joseph Fourier's (1822)
assertion that any periodic signal can be represented by
a trigonometric series.
(2) y(t) * *o/2 ♦ E Can * cos (2irf 0t ) + bn • si n (2irnf 0t > In*l
when
(3) <2/To>
(4) bn ■ (2/T0>
IT /2y (t).
-T /2
I T /2y(t)>«in
-T /2
cos(2wnfo)dt
(2irnf0)dt n * l,2 ,3 ,.. .
To * waveform period, and frequency f “ 1/T0.
Equations (2) - (4> can be rewritten in terms of complex
coefficients, otn, to yield the complex Fourier
series (3) and the Fourier integral (6) Cl I.
(5) y(t> * E Coin* exp (J2«nf ot) 3 n*-e
<6> Or, In Jbn • (1/To)*r t / 2
y(t) exp(-j2nf0t> dt
-T /2
Furthermore, i t can be shown Cl,S3 that in the lim it of
T«> -> m ( i.e . fo -> O) f aquations (5) and (6) approach
the integral defi nit ions of tha invarsa Fouriar
transform (7) and forward Fouriar transform <8),
raspacti valy.
(7) y {t ) y < f ) b k p ( + j 2 w f t ) d f In' FT
(8) Y (f ) y ( t ) exp (-J2irf t > dt Forward FT
It may ba notad that tha dasignation of aquation <7) as
tha invarsa and aquation (8) as tha forward transform is
purely conventional. Bracawall C23 uses the terms
"minus-i" and "plus-i" rather than "forward" and
"invarsa" in order to emphasizft this point. Because of
tha history in tha electrical engineering literature,
tha Fouriar transform equations (7) and (8) are often
written in terms of angular frequency <w « 2wf) rather
than in Hertz (f>. These alternative definitions
require the inclusion of the a factor, l/2w, in the
inverse transform equation, or, for the sake of
symmetry, (l/2w )*/,a in both the forward and inverse
transform equations. It is important to note that

12
exp d f , which art reciprocal
variables, obviate the need -for the l/2ir -factor.
G en era l P r o p e r t ie s o-f th e F o u r ie r . T ra n s fo rm
In order to use Fourier transformation as a general
method far data analyses, i t is helpful to have
understand!ng of the various useful properties of the
Fourier transform. Of prime importance is the property
of existence, because theoretically there exist
functions which do not have Fourier transforms.
Causality is a sufficient condition for the existence of
the Fourier transform and is also a necessary condition
for physical rea lizab ility [33. Thus, physical
possibility is a sufficient condition far the existence
of the Fourier transform of a signal. In other words,
a ll real waveforms have a spectrum and all spectra will
produce a waveform.
If the FT is to be used for more abstract uses, such
as derived functions, the function must satisfy
Dirichlet’ s conditions i
(b) f(t> must be piecewise continuous with a fin ite number of f in ite discontinuities.
(a> (t) dt < •
where condition (a) is a sufficient condition and (b) is
a necessary condition C61. Thus, the function t -1-"3
does not have a Fourier transform because i t has an
1 3
in fin ite discontinuity at t - -> O. On the other hand,
the response of an electrochemical system under
diffusion control w ill have a Fourier transform because
characteristic t~ *' a dependence always fa ils at some
time greater than zero, because of fin ite electron
transfer kinetics and/or instrumental limitations.
The work presented here uses the properties of the
Fourier transform for analyses of the responses by
several electrochemical systems to external
perturbations. Therefore, a brief introduction to the
pertinent properties is given. More detail on these
properties is given elsewhere Cl,2,63. The three most
relevant properties are linearity, the convolution
theorem, and scaling. Two other properties that are
useful in interpreting Fourier transforms are the
shifting theorems and symmetry. The properties of the
Fourier transform are summarized in Table I I .
Linearity of the transform means that the transform
of a sum is the sum of transforms;
(9) F<g <t > + h (t > > - FCg(t )> + FCh(t>>
Besides allowing a relatively simple intuitive
connection between the time and frequency domain
representations of linear systems, linearity means that
for repetitive signals, ensemble averaging of time

1 A
domain arrays is equivalent to ensemble averaging of
frequency domain arrays. This assumes that the system
is invariant with time. As a result, signal/noise
(S/N)improvement in the frequency spectrum can be
achieved by Fourier transformation of the averaged time
domain signal, and much processing time can be saved
over the alternative method of averaging several
frequency domain spectra. On the other hand, i f the
signal is not repetitive, e.g. random noise, averaging
must be done in the frequency domain to similarly
improve frequency domain precisian.
As important as any property of the Fourier
transform is the convolution theorem. According to this
theorem, time domain convolution is equivalent to
frequency domain multiplication, and, conversely, time
domain multiplication is equivalent to frequency domain
convolution. I t is this property of converting integral
and differential operations into algebraic operations
that makes Fourier transformation such a widely
applicable computational aid. Digital filte rin g in the
time domain involves convolution with a smoothing
function, such as those presented by Savitsky and Golay
C73 and others [8,9,101. Smith used the convolution
theorem in digital filte rin g of electrochemical signals
and implemented the filte rin g function by frequency
domain multiplication [111. Fourier transform smoothing

15
of data has been parformad without tha FFT, by
incorporating FFT logic flow diractly into a digital
smoothing routina C121.
flora important however, is tha fact that
daconvolution is aquivalant to division in tha Fouriar
domain. This is particularly important givan the
d ifficu lty of "direct" digital daconvolution, which
requires iterative approximation algorithms C131.
Fouriar transform deconvolution has bean used to remove
instrumental distortion from chromatograms C14,151, to
increase resolution in IR spectra C16,171, and to remove
instrumental distortion from voltammetric data 118,191.
Whether or not they are presented as such, the
admittance calculations presented in this and previous
work are the Fourier domain deconvolution of the input
signal, e (t) , from the current response, i(t> .
Closely related to convolution is the integration
and differentiation of waveforms. Again, Fourier
transformation allows these operations to be performed
by algebraic operations in the Fourier domain.
Integration is analogous to multiplication of the
spectrum by — j/w where j=*»-l and w « angular frequency,
and differentiation is analogous to multiplication by
Jm. These properties are important considerations in
conditioning the input pulse waveform by analog filte rs .
They also provide insight into the well known fact that

1 6
integration diminishes the effect of noise while
differentiation enhances the effect of noise. Because
differentiation corresponds to weighting the high
frequency spectral components more heavily, random
noise, which generally predominates at higher
frequencies, is enhanced.
A third property of the Fourier transform is called
the sim ilarity property, or the scaling theorems. Time
scaling and frequency scaling dictate that as a function
becomes narrower in one domain, its Fourier domain
representation becomes broader. Thus, the Fourier
transform of the delta function is a constant,
F<f(t)J=l. The scaling theorems formalize the in tuitive
notion that signal changes on a short time scale imply
the presence of higher frequencies, while changes on a
longer time scale are indicative of lower frequencies.
This is an important factor in choosing the excitation
waveform since the narrower pulse implies, by the time
scaling theorem, a broader frequency spectrum. The
expansion or contraction of the signal (in time) or the
spectrum (in frequency) is thought of as a change in
scale, such that f t is constant. This is called the
uncertainty relation C23. I t provides the mathematical
basis of Heisenberg's famous uncertainty principle.
The shift theorems are the time shift theorem and
the frequency shift theorem, often called the modulation

J 7
theorem from its use in the electrical engineering
literature. The symmetry of the two theorems can be
seen in Table I I . Shifting a signal in time causes a
phase change in the spectrum that is proportional to
both the size of the shift and the frequency. This
means that the phase of the spectrum is dependent on the
beginning point of waveform sampling. It is for this
reason that, although the magnitude spectrum is
unaffected, an accurate reference is necessary if
accurate phase data are desired. Shifting a spectrum in
frequency is well known in chemical instrumentation, as
i t corresponds to modulation of the signal. A common
example is modulation of the d.c. output of a detector,
i.e . shifting its frequency, which allows the use of
frequency selective electronics to isolate the detector
signal from background and flicker (l/f> noise. Both
time and frequency shifting cause oscillations in the
Fourier (reciprocal) domain. This sim ilarity is
obscured because i t is more natural to think of
modulating a signal than of "modulating" a spectrum (by
delaying the signal). Nevertheless, i t is important to
avoid errors in trigger timing (commonly termed "trigger
j it te r" ) since a delay can "modulate" the frequency
spectrum. If the spectrum of a waveform is
H (f ) exp (— J2irf t , ) and a reference waveform is given by
R ( f ) exp (—J2irf t 3) , where f is frequency and r , and are

le
the delays of the trigger past some arbitrary fixed
point, then the normalized spectrum ist
t i <*> g x p t - J - H< f ) ex p C -J 2 ir f (Ti - r , n R( f > e x p [ - J 2 n f r a 3 R t f ) .
I f there is not trigger error in the sampled waveforms
then T!»t2 and the exponential term is unity.
Conversely, i f t ,Tt* , then the normalized spectrum w ill
contain oscillations due to the difference in triggering
paints.
The above properties of the Fourier transform have
been discussed in terms of the continuous Fourier
transform. I t should be noted that these properties are
entirely applicable to the discrete Fourier transform
(DFT) as well (Table I I ) .
An interesting property of the DFT, related to the
multiplex advantage, might be called the "digitization
advantage". As pointed out by Horlick and Malmstadt
C201, the effective resolution of an analog to digital
converter <A/D> can be increased by digitizing a signal
containing more than ±1 b it of random noise and then
averaging in a processor with a longer word. For
example, the resolution of our 6 b it A/D can be
increased by ensemble averaging separate arrays in the
IBM System 9000 microcomputer using a 16 to 32 bit word.

19
Sine* the Fourier transform is essentially a comp1an
weighted average i t should, in like manner, increase
the effective digital resolution of the measurement
system beyond the expected 8 bits. In this context,
i t is not necessarily desirable to use ensemble
averaging to reduce noise in the time domain signal to
less than + 1/2 b it.
The FFT is of course an implementation of the
discrete Fourier transform. The DFT and its inverse are
represented by equations <10) and (11) i
-G (nf«) ■nEl Cg(kAt> exp <-J2irkn/N) 1 k-0
(11) g <kAt) « - . N£1S(nfo) »xP(+j2irnk>N n-O
Note that the discrete transform is a function only of
array indices and size. The value of ^t does not enter
into the calculation at a ll . The actual time scale is
not part of the DFT and only has a role in the
interpretation of the results.
Since the DFT is a digital approximation of the
Fourier transform, certain restrictions on the nature of
the input data are imposed. Obviously any array of
<10) n
NAt
2 0
numbers can be put into an FFT program, but this does
not mean valid results w ill be produced.
There are two errors of particular concern when
applying the FFT to experimental data. They are
"leakage" and aliasing. As w ill be shown later, both
are general errors associated with d ig ita lly sampling an
analog waveform for only a portion of its duration.
According to the Nyquist sampling theorem, a waveform
must be sampled twice per period of the highest
frequency present in the signal. The Nyquist frequency
fiM is thus one half of the sampling frequency. A
waveform is undersampled if the waveform contains
frequencies above the Nyquist frequency, which w ill then
be "aliased" as lower frequencies and will appear as if
the actual spectrum were folded at f N. (Figure 1A) If
the aliased frequency is higher than 2fw, then i t w ill
be aliased as i f the true spectrum were folded at f =0
and f * f N, like Z-fold computer paper. I t is important to
note that the Nyquist lim it is a theoretical one that
holds only in the lim it of in fin ite signal to noise
ratio . In real (noisy) systems the waveform must be
sampled more often, the practical lower lim it being 4 to
8 times per period of the highest frequency C213.
Leakage arises from the use of a limited observation
time to estimate the spectrum of a waveform that may
have a much longer duration. Theoretical1y, i t arises

21
when the Navvforn spectrum is convoluted with the
Fourier transform of a sampling window.
Phenomenologically, i t occurs when frequencies of the
true spectrum are not sampled for an integral number of
periods. In this case, the DFT estimated spectrum
cannot give a value for these frequencies, because the
only results calculated are for harmonics of fc. 1 /T0,
where To is the observation time. The power of these
"off harmonic" frequencies then appears to have leaked
into the adjacent harmonics (Figure lb); hence the term
"leakage".
To use the FFT for general data processing, an
understanding of the above restrictions can be achieved
by considering the DFT as a special case of the Fourier
transform. Brigham t i l very effectively illustrates
this graphically. The graphical derivation of the DFT
pair, which corresponds to a continuous Fourier
transform pair, is shown in Figure 2. Sampling of the
time domain function h(t) (Figure 2a) is represented by
multiplication of h(t> by an in fin ite series of impulse
function* Ao(t) (Figure 2b). The result is an
exponentially decaying sequence of delta functions in
the time domain, an in fin ite ly long discrete array
(Figure 2c>. The corresponding frequency domain
operation is the convolution of H(f> with A o ( f ) . I t is
significant here that the Fourier transform of a

22
sequence of impultti in tint* with * spacing of ^t is a
ftqunnci of fr*qu*ncy domain impulses with a spacing of
1 / 2 At. Thus, convolution of H(f) with A o ( f > givts a
function that is periodical in th* frequency domain with
a period of l/2At. The effect of aliasing can be seen
in figure 2c, where the dotted lines show aliased
frequencies. Because the sampling was less than the
Nyquist lim it, information is lost and frequency
components above f*sl/2£t are "folded" back into the
interval <-l/2tft, +l/2At> In accordance with the time
scaling theorem, i f at is reduced in the time domain,
then the frequency domain impulse sequence is more
widely spaced, and i f i t is made small enough,
encompasses the entire bandwidth of H (f), thereby
broadening h (t), until a ll components outside the
interval <-l/2at, + l/2At> are negligible. This is
equivalent to saying that the discrete sequence in
Figure 2c does not accurately represent h (t). For this
reason, the practice of inserting a low pass "anti
aliasing" f i l t e r into the sampling system is almost
universally followed. The next step in the conceptual
digitizing process is truncation of the discrete array
in Figure 2c by multiplying i t with a windowing function
(Figure 2d). Normally this window is rectangular, as in
the figure, but triangular or trapezoidal "apodization"
functions are often used as well, a ll of whose time
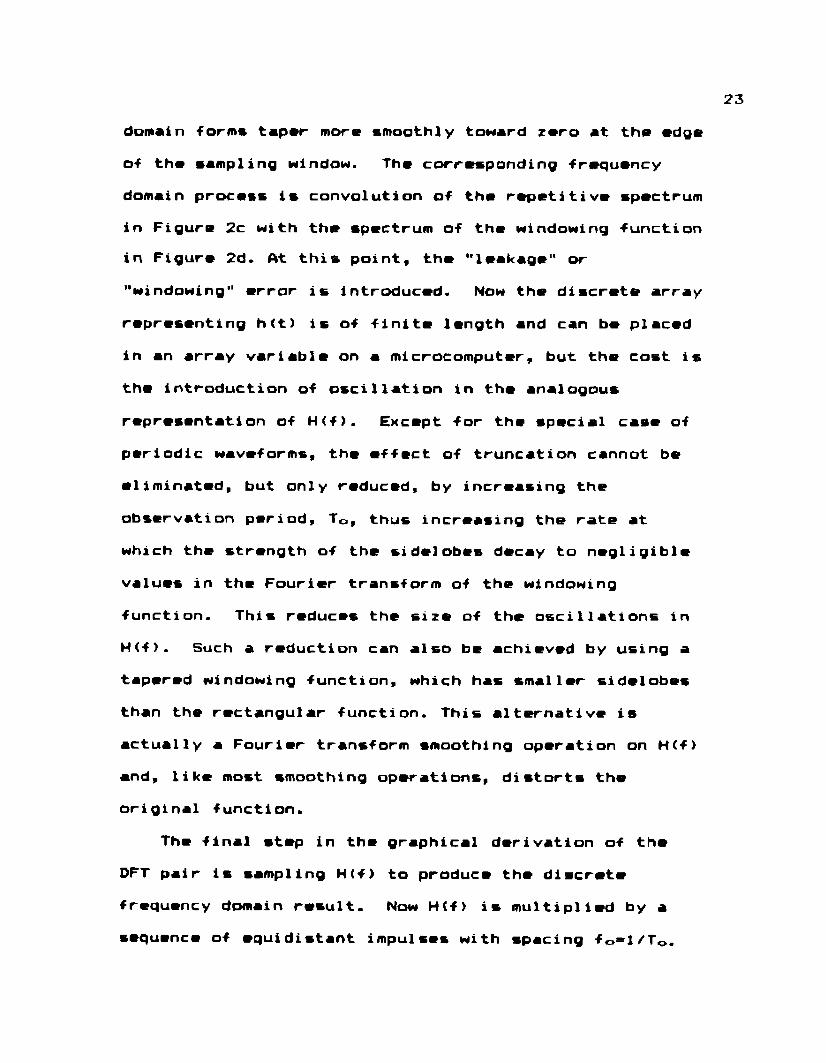
23
domain forms taper more smoothly toward zero at the edge
of the sampling window. The corresponding frequency
domain process is convolution of the repetitive spectrum
in Figure 2c with the spectrum of the windowing function
in Figure 2d. At this point, the "leakage" or
"windowing" error is introduced. Now the discrete array
representing h it) is of f in ite length and can be placed
in an array variable on a microcomputer, but the cost is
the introduction of oscillation in the analogous
representation of H (f). Except for the special case of
periodic waveforms, the effect of truncation cannot be
eliminated, but only reduced, by increasing the
observation period, T0, thus increasing the rate at
which the strength of the si delobes decay to negligible
values in the Fourier transform of the windowing
function. This reduces the size of the oscillations in
H (f). Such a reduction can also be achieved by using a
tapered windowing function, which has smaller si delobes
than the rectangular function. This alternative is
actually a Fourier transform smoothing operation on H(f>
and, like most smoothing operations, distorts the
original function.
The final step in the graphical derivation of the
DFT pair is sampling H(f) to produce the discrete
frequency domain result. Now H(f> is multiplied by a
sequence of equidistant impulses with spacing fo *l/T Q.

2 4
The result is s discrete *rr*y corresponding to ths DFT
of h ( t ). This digitizsd process is, by ths convolution
theorem, equivelent to convolution of h<n t> with the
Fourier transform of the frequency domain sampling
function. The result, as when the time domain signal
mas sampled, is a periodic function of time with period
To. Thus, i t is sometimes said that the FFT "assumes"
that the waveform is periodic. The elimination of
leakage when T0 is equal to the periodic waveform
is due to the coincidence of the sampling point in the
frequency domain with the points in H(f}, where the
oscillating deviations from H(f) are zero.
Accuracy of the DFT as an Estimator of the Integral FT
Periodic waveforms are most compatible with the DFT
because, as illustrated in Figure 2g, the members of the
DFT pair are themselves periodic. Thus, except for a
scaling constant related to the observation time, T0,
the DFT values for a periodic waveform are exactly the
same as those for the integral Fourier transform of that
waveform, provided that the Nyquist sampling restriction
has been obeyed and the waveform has been observed for
an integral number of periods.
Another important class of waveforms is the fin ite
duration waveform. Theoretically, time limitation and
bandwidth limitation are mutually exclusive. In reality
however, waveforms are always bandwidth limited and

25
appear to be time limited am the signal becomes
undetectable (e.g. the commonly sampled exponential
decay). An analogous situation is the digitized form of
a signal with a very high S/N ratios the digitized
version may appear completely noise free even though
there is , of course, noise in the signal. In the
practical sense, then, time limited means "effectively
time limited". For this signal, when sampled under
Nyquist conditions over the exact duration of the
waveform, the DFT again exactly represents the integral
FT (except for the scaling factor).
These two cases represent two slightly different
electrochemical experiments. The former is a steady
state situation where the condition of the system is not
necessarily the equilibrium condition. The latter is a
true transient response experiment where a system,
assumed to be at equilibrium, is perturbed by an impulse
or by a single pulse cycle. In practice, there may be
no difference between the two i f the pulse repetition
rate is sufficiently low. This advantageous situation
allows for ensemble averaging of repetitive cycles to
improve S/N and the use of a precessing trigger to
increase effective sampling rate.
A third type of waveform is the arbitrary waveform,
which is neither periodic nor of f in ite duration, but
is, in a ll practicable systems, bandwidth limited.

2 6
These functions tend to suffer from arror due to
truncation of tha time domain signal. Sinca tha time
domain signal is likely to have a considerably different
value for tha f irs t and last points of tha digital
array, tha time domain member of tha DFT pair w ill have
a discontinuity between successive periods.
Consequently, the frequency domain function w ill have a
ripple in i t . This is very closely related to the
leakage error discussed previously. The use of
apodization functions is an effective and well developed
way of reducing leakage errors.
One example of the arbitrary waveform is the step
function, which has been used in this work in the form
of step concentration changes to study the response of
an ion selective electrode. Technically, i t should be
called a bandwidth limited step function i f i t is a
response of a physical system. The step function, by
definition, has a different value at the beginning and
the end of the observation period. Thus, the biggest
d ifficu lty with analysis of step functions is leakage.
Gabrielli has published a detailed discussion of DFT
estimation of step response spectra and has shown that
digital differentiation of the data before Fourier
transformation provides a marked improvement in the
quality of the results.

27
Another arbitrary waveform is random noise. This is
mentioned because of a recent report on the fascinating
concept that information can be gleaned by observing the
random fluctuations in the system and analyzing them in
the frequency domain [223. As a result of these
developments, Fourier analysis of these waveforms is
likely to be of increasing importance.
ADMITTANCE MEASUREMENTS OF ELECTROCHEMICAL CELLS
General Theory
A large part of this work involves a novel method
for measuring admittance spectra of electrochemical
cells. Therefore, a brief discussion of admittance
analysis as applied to such cells is in order. Detailed
treatments have been given by Sluyters and Sluyters
Rehbach [23,243, Smith C233 and MacDonald [263.
Admittance is the reciprocal of impedance and is one of
a group of related properties termed "immittance" [303.
Immittance properties, other than admittance and
impedance are the complex dielectric constant,
“ t '+ j f '* ” Yk(jwCfl) , where C0 is the geometric
capacitance of the cell; and the complex modulus f -1 .
Each of these properties has its own area of
application; for example, dielectric spectroscopy is
suitable for RF measurements where significant
conduction by ionic transport is negligible.

2 8
Steady state admittance is given by
Y(f) « Y '(f) + JY' ' ( f ) - I ( f ) /E ( f )
where I f f ) and E(f) are complex quantities. With the
increasing availab ility of cost effic ient computing
power in the late 60's and early 70's, the use of
transient or operational impedance based on LaPlace
transformation of system response to an external
perturbation was expanded C271. Defined in terms of the
LaPlace variable s~ v + jw, the operational impedance
is given as impedance
(12) Z<S> - E(S)/I(S)
or admittance
(13) Y(S) - I(S)/E(S).
Operational impedance makes use of the convolution
property of the LaPlace and Fourier transforms. LaPlace
transformation restricted to the imaginary axis ( i.e .
Fourier transformation) gives an operational admittance
formally equivalent to steady state ac admittance. For
causal (i.e . physically realizable) systems there is
also a practical equivalence C281. This is true not
only for single frequency a.c. perturbations, but also
for multifrequency inputs, such as step, pulse, impulse,
and noise.
Electrochemical cells are inherently nonlinear and,
i f precautions are not taken, analyses of cell responses

29
using 1 invar system Analysis can be misleading. In
order to apply a linear admittance model to an
electrochemical ce ll, the system must be "sufficient 1 y"
linear. That is, potential excursions must be small
enough that the second and higher order terms of the
Taylor series describing the cell response can be
neglected. Typically, this is about S to 10 mV (peak)
across the interface C24D. Since the potential across
the cell is divided between impedance due to the
electrolyte medium, the interface and, in some cases,
the bulk of the electrode, the actual applied signal can
be considerably larger; as much as 100 mV,p- p) may be
acceptable C293. In a ll cases i t is wise to verify the
absence of nonlinearity effects, which are evident from
unexpected current responses at harmonics of the
perturbation frequency. The appearance of harmonics in
nonlinear systems is the reason for the u t i l i ty of odd
harmonic perturbation waveforms; any resulting current
at frequencies corresponding to even harmonics may be
safely regarded as due to system nonlinearity.
Admittance analysis of a cell begins by modelling
the cell as an equivalent circuit composed of aperiodic
elements such as resistors and capacitors. An attempt
is then made to relate these circuit elements and their
potential dependencies to physical-chemical (molecular)
properties of the system. A general equivalent circuit
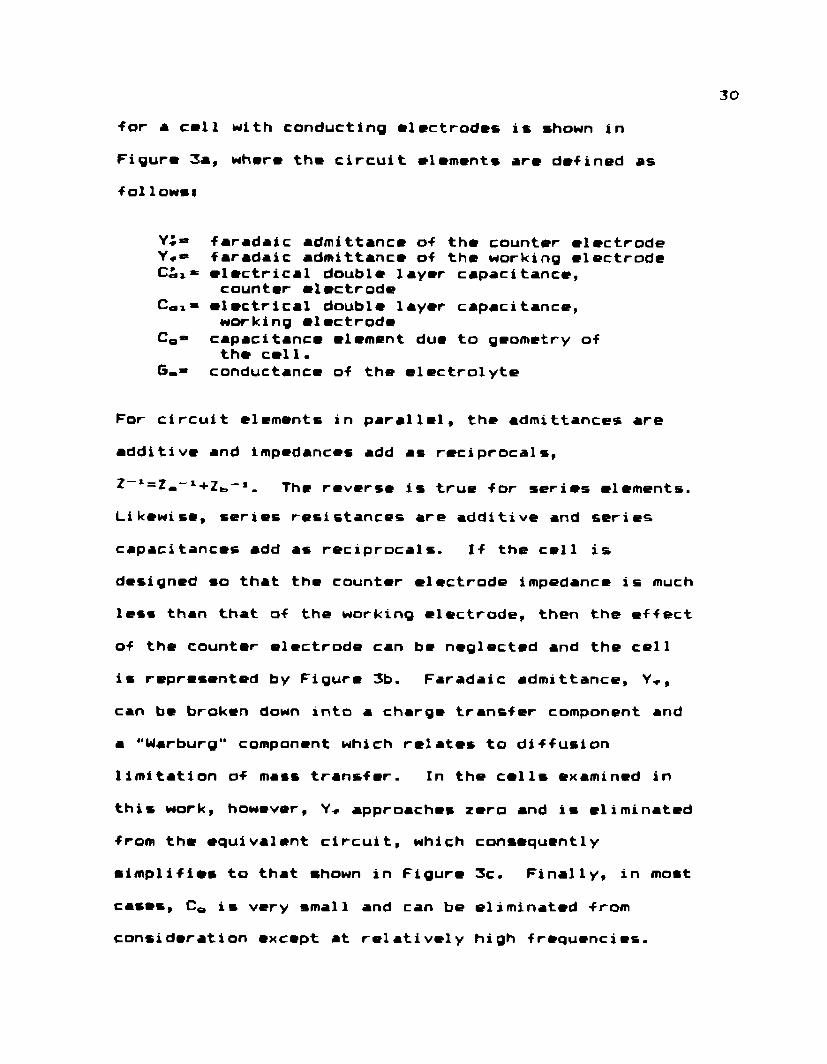
30
for a cel1 with conducting electrodes is shown in
Figure 3s, where tha circuit alamants a n defined as
followst
Yi« faradaic admittance of tha counter electrode Y** faradaic admittance o-f the working electrode Ci»“ electrical double layer capacitance,
counter electrode Cai* electrical double layer capacitance,
working electrode CQ*= capacitance element due to geometry o-f
the ce ll, conductance o-f the electrolyte
For circuit elements in parallel, the admittances are
additive and impedances add as reciprocals,
. The reverse is true for series elements.
Likewise, series resistances are additive and series
capacitances add as reciprocals. If the cell is
designed so that the counter electrode impedance is much
less than that of the working electrode, then the effect
of the counter electrode can be neglected and the cell
is represented by Figure 3b. Faradaic admittance, Y„,
can be broken down into a charge transfer component and
a "Warburg" component which relates to diffusion
limitation of mass transfer. In the cells examined in
this work, however, Y* approaches zero and is eliminated
from the equivalent c ircuit, which consequently
simplifies to that shown in Figure 3c. Finally, in most
cases, C0 is very small and can be eliminated from
consideration except at relatively high frequencies.

31
This is ths circuit shown in Figure 3d. Equivalent
circuits can be derived on the basis of graphic displays
of admittance or impedance data. The most common ways
of analyzing data are through the use of complex plane
(Cole-Cole) plots and Bode plots. In complex plane
prcsentations, the data are plotted as Y '’ <f> vs. Y*(f)
or Z 'M f) vs. ZM f). These graphs generally have one or
more characteristic semicircles or linear regions
corresponding to resistance-capacitance ensembles that
represent electrochemical properties such as interfacial
capacitance, bulk electrical resistance, and electron
transfer kinetics. Often of interest are the constant
phase elements, with a constant slope in the complex
plane, the most well known being the previously
mentioned Warburg impedance, describing a diffusion
controlled system C241. Examples of complex plane plots
are shown in Figure 4. An alternate representation is
the Bode plot, where log lY (f) l, log YMf) or log Y’ ’ (f)
are plotted against log f (Figure S). MacDonald C301
has combined these representations, using "three-
dimensional perspective plotting" to simultaneously
display Y'(f) and Y*' (f) vs. log f .
Two types of cells have been examined in this work:
cells with semiconductor electrodes and cells with ion-
selective electrodes. The object of study in these
cells is the behavior of the electrode its e lf .

32
admittance of Semiconducting ElectrodesWith semiconducting electrodes, the equivalent
circuit in figure 3d must be further modified to include
the impedance of the electrode its e lf . Thus a series
resistance is added to represent bulk resistance of the
semiconductor and a series capacitance is added to
represent the space charge capacitance of the
semiconductor (Figure 6a). Using admittance analysis
alone, the circuit in Figure 6a cannot be distinguished
from the circuit in Figure 6b, where R-r”R.+Rto and
Additional information (e.g. dependence
on chemical parameters) is required in order to separate
contributions from each side of the interface. Often,
however, R.<<Rto and C*,, >>0.^ so that RT=Rt. and CT=C.= .
Normally this is the case; but, for verification,
independent measurement of R. and Ca l must be made. R.
can be determined by conductivity measurements.
Estimation of is made by measuring C-r for electrodes
with several different dopant levels (No) C30D; the
variation with No of the Y-intercept of
1/Ct* v s . E plots, is then proportional to 1/Cdi a.
Thus, the most straightforward application of
admittance analysis to semiconductors is the analysis of
C-e. Measurement of C« and its linear Mott-Schottky
•’"•lotion, as (C « )-a versus applied bias potential, is a
standard feature of semiconductor characterization.

33
Conventionally, C_<= is measured via the
quadrature <0-90*> response to a single frequency
sinusoid input of, typically, 1 kHz. The assumption is
made that lq>EMC. In other words, the admittance of the
cell is assumed to be
(14) Y(w> = O + jwC,c
Actually, according to circuit 2b,
(15) YCw) = <wC~> + j — --------< wC,)*+Gg < wC»)a+Gg
which reduces to equation (14) as w<<(RC>~1. Although
often fu lfille d , this condition may not apply in a ll
cases. Furthermore, a frequency is often chosen
arb itra rily , or on the basis of convention rather than
on the basis of what frequency is optimum for the
measurement of space charge capacitance.
The presence of surface states, energy levels due
to surface phenomena, may also affect the nature of cell
admittance as they may be represented by circuit
elements with characteristic time constants in parallel
with the primary space charge capacitance. The effect
can be considerable i f a single frequency measurement is
used, as shown in Figure 7 C31D.
Given these possibilities i t is apparent that
spectrum analysis is valuable for the investigation of

34
semiconductor/electrolyte systems both ‘from ths
standpoint of obtaining precise space charge capacitance
measurements and determining surface state behavior as a
function of applied potential. The primary d ifficu lty
with making these measurements by Fourier transformation
is the d ifficu lty in obtaining a wide frequency range.
Three separate 512 point measurements and
transformations are necessary to obtain a 6 decade
range, which is about the minimum required when using
admittance analysis to study surface states.
The capacitance and conductance of the equivalent
circuit can be determined from measured admittance data
in two ways. F irst, and most directly, C_t can be read
directly from a plot of Gp/w (Figure 8> and G& can be
read directly from a plot of wC (Figure 7). On the
other hand, admittance data can be rearranged on the
basis of the chosen equivalent circuit (Figure 6b> to
gi ve
(.6) B-_____2TTf 4 ( G , * - t y i f ) ! * )
where N'(f)! “measured admittance magnitude and G_*high
frequency lim it of |Y(f)l . Given this, a precise
determination of C_c can be made. Furthermore, as shown
in Figure 9, deviations from the proposed model,
apparent by a dependence on frequency of the calculated

35
value for C_c, are more apparent than in the original
complex admittance data.
Non-potent iometric Measurement Using Ipn-Selective E*gfftrgd*f
The discovery in 1909 by Haber that certain glass
membrane electrodes developed a potential difference
across the membrane that was dependent on pH marked the
beginning of potentiometry as a viable analytical
technique. Today the glass pH electrode, a membrane
electrode with a fixed site ion exchange membrane, is
the most widely used ion-selective electrode. Other
important fixed site electrodes are the LaF3 fluoride
electrode for measurement of fluoride and silver halide
crystal electrodes for measurement of cyanide.
Membrane electrodes are used in chemical analysis
via potentiometric measurement of the general cell:
Reference f i 11i ng membrane test Referenceelectrode 1 solution soluti on electrode 2
such a cel 1 , the ion-selective electrode is
represented by reference electrode 1, the f il l in g
solution and the membrane. Solution 1 is essentially
used to make electrical contact with one side of the
membrane and is of known constant composition. In many
cases, such as the silver halide electrodes, direct
metallic contact is used. Since the ISE is internally

unchanging, changes in the cell potential can be
ascribed to processes occurring at the interfaces with
the test solution. Normally the potential difference
across the reference electrode-test solution interface
is constant, and potential changes arise predominantly
from ion exchange at the membrane surface. I f the ion
exchange process involves only one (or a few) types of
ion, then the cell potential responds selectively to th
concentration of those ions in the test solution.
The theory of potentiometric response is well
covered elsewhere [32-351j of primary concern here is
charge transport within the membrane its e lf,
particularly the fluoride membrane. The fluoride
electrode consists of single crystal LaFs doped with
EuFa impurity. The conductance of the LaF3 crystal is
due to movement of F ions through crystal site
vacancies called Frenkel defects. The incorporation of
Eu(II) ions increases the number of defects and
consequently increases membrane conductance [331. The
fluoride and glass electrodes both have hydrolyzed
surface films but the fluoride electrode differs from
the glass electrode in that the charge carriers in the
fluoride membrane are the same species as the analyte.
Both electrodes are represented by the same equivalent
circuit [36,371. The equivalent circuit for both
electrodes, shown in Figure 10, is composed of two

3 7
complex impedance elements, each consisting of a
parallel array of resistances, and a nonideal, frequency
dependent RC series. One impedance element represents
the bulk membrane and one represents a hydrolyzed
surface film . The presence of frequency dependent
circuit elements Mas attributed by Brand and Rechnitz to
non—linear response [451. In one study by Brand and
Rechnitz [361, i t was observed that values for the
circuit elements varied from electrode to electrode; but
the nernstian electrode response was unaffected by those
differences.
In the early 1980’s, Rowley and Nieman [38-411
measured the conductance of ion-selective electrodes
with a bipolar pulse conductance technique (BICON).
B1C0N uses two pulses of opposite polarity, but of equal
duration. Based on an equivalent circuit analysis, the
assumption is that the capacitive current is exactly
zero at the end of the second pulse, and the measured
total current is proportional to the dc conductance. A
point of importance regarding BICON is that the pulses
used have large magnitudes (2-3V) C43J.
Powley and Nieman have reported that the
conductances of Ca*~ and F~ ion-selective electrodes
vary systematically with concentration of the ion of
interest [38-421. The advantages claimed for this
technique were faster response times than in

30
potentiometric methods (< SO msec) and the Ability to
perform ion—selective measurements without s reference
electrode. These advantages were not found in similar,
earlier work by Brand and Rechnitz C361, using impedance
measurement techniques. Subsequent work by Sandifer and
Gross C441 using BICON raises doubts about the Powley
and Nieman results as well. Later work by Powley and
Nieman indicated that a reference electrode is , in fact,
required. Further experiments therefore were necessary
to attempt to resolve some of these unanswered questions
and to improve our knowledge of those factors that
effect and control ion-selective electrode measurements.

TABLE I
P R O P E R T I E S O F
F O U R I E R A N D D I S C R E T E F O U R I E R T R A N S F O R M
P r o p e r t y F o u r i e r T r a n s f o r m D i s c r e t e F o u r i e r T r a n s f o r m
L i n e a r i t y x ( t ) + y { t ) X ( f ) + Y ( f ) x ( k > + y ( k ) O X ( n ) + Y ( n )
T i m e S h i f t i n g h ( t - t Q ) H [ f ) e x p [ - j 2 f T f t Q ] e x p [ - j 2 i » n i / N ]
F r e q u e n c y S h i f t i n g h ( t ) e x p l H ( f - f Q ) h ( k ) e x p l j 2 i r k i / N ] H { n - i )
T i m e C o n v o l u t i o n T h e o r e m y ( t ) * h ( t } Y ( f ) H l f ) y t k ) * h ( k > Q Y ( n ) H ( n )
F r e q u e n c y C o n v o l u t i o n
T h e o r e m
P a r s e v a l ' s T h e o r e m
y ( t ) h ( t ) Y < f ) * H ( f )
J " j / / ( / ) ( * 4r
y t k ) h ( k ) 1 Y ( n ) * H ( n )
— N * - l | N ~ l
E = £ £ | y / ( « ) l J * - 0 . . 0
T i m e S c a l i n g
F r e q u e n c y S c a l i n g
h ( k ° o $ H®P ( i ) © « * '
ui<D

I 40
frequencyFigure la: Aliasing: -frequencies above appearerroneously (open bars) in the FFT spectrum as i-f the true spectrum were folded about f* .
A B
1A B
LC
# , i -1
frequencyFigure lb: Leakage occurs when T„ is not an integralmultiple of waveform period.

41
* I
-1! II!!!
t
. . . U l l t f
—T — T
M tUJO
VI h t . _
■ It)
i
1I t1
J,1 ! * i j
N lla.lllaltl
Kr- f
ii
T I 1
*,(11
1)1,
T.
I j’ftuiiii
V
b|ii
Ml
Ml
HU)
o1*1
lb)
MUI.41*1
xm
■i i
|M|fl*d«tfJ|*X|l|
MM
inIfLL
A, ft)
ff11
if f
Ntll
<•1 IVflil'i i u i i-------M'
Figure 2s Brigham** conceptual development of the FFT. (from reference 1)

Rs cdi Rs cd|Figure 3: Four possible equivalent circuits which maybe used to represent an electrochemical cell. See text •for significance of circuit elements.
(a) equivalent circuit for complete electrochemical cell.
(b) equivalent circuit if counter electrode admittance is neglected.
(c) simplification of (b> in the absence of faradaic processes.
<d> low frequency equivalent of (c) since i s smal1.
NJ

OM
Adm ittancea o u
0.012
0.011
aoi
aoo*
aooe
0.005
0.002 0X04 0.000 0.008 0.01 0.012 0.014 0.01* 0.018 0.020Vff>
Figure 4a: Complex plane projection (Cole-Cole plot)of simulated admittance for circuit 3C when C. << and R = 99.5 Q. Frequency increases from le ft to right.

Admittance
'«s(0
Figure 3: Bode diagram (log-log plot) -for admittanceof circuit 3C when C« << C**.

Rc 'dl C SC R. CT r t
CscFigure 6: Three possible interpretations of simpleequivalent circuit for a cell with a semiconducting electrode:
(a) equivalent circuit similar to Figure 3(d) but including the admittance of the electrode itse lf. The broken line represents the interface.
(b) a circuit which is indistinguishable from (a) on the basis of impedance/admittance spectra alone.
<c> interpretation of (b) when R„ >> Ra and CBC ( (C^i.
iji

OiCp
1 0 0 0 0 1 0 0 0 0 0100 1000FREQUENCY(Hz)
Figure 7; Simulated log (wC ) vs log <f> curve -for model circuit with (solid line) and without (broken line) surface state analogues represented by Gt and C*. 6*. = 0.050 -1; C» — 0.53 pF; G* = . 001O-1;C» = 0.53 pf. (based on reference 31)
C-

3
10 100 1000 10000 KXXXX)
FREQUENCY(Hz)
Figure 8: Simulated log (Gb/ w) vs log f curve -formodel circuit with (solid line) and without (broken line) surface state analogues. Circuit elements are the same as for Figure 7.
Xuc

Cap
acita
nce
(far
ads) - 5
-6
1 0 0 1 0 0 0 1 0 0 0 0
FREQUENCY(Hz)Figure 9: log CM vs log (f) -for n-Ti 02 calculatedfrom admittance data on the basis o-f circuit 6C. Deviations -from the model are apparent.
CD

J
K■vNAAwV—
Figure lOi Equivalent circuit of Sandifer and Buck C37] -for Fluoride and glass electrodes. Rm and Z** represent bulk admittance; Rl and Z*_ represent a hydrated surface film.
EXPERIMENTAL TECHNIQUES
INSTRUMENTAL APPROACHES
Three diffvrent instrumental approaches were used
in this research. Although there was some overlap,
essentially separate instrumental configurations were
used in each of the three main sections of this work.
The only common feature of a ll three sections is the
use of the IBM System 9000 microcomputer for data
collection/processing. The CS9000 was a 16 b it
microcomputer based on an MC 68000 microprocessor with
a clock speed of 8 MHz. All data were transferred by
GPIB (IEEE-488) from the appropriate instrument. The
programs, written in BASIC, are discussed
subsequent1y.
Transient Current Response Experiments
Voltage pulses were applied at the external input
of the potentiostat with a Princeton Applied Research
(PAR) Model 175 Universal Waveform Programmer
(Figure 11). The potentiostat used for virtually a ll
TiOs, related experiments was the PAR Model 173
potent!ostat/galvanostat, operated exclusively in the
potentiostatic mode, equipped with a mode) 179 current
follower. The output of the current follower was
filtered with an appropriate passive (RC) low pass
f i l te r to remove frequency components above the
Nyquist sampling lim it. The filtered signal was
50
51
digitized using a Tektronix Model 46B digital
oscilloscope with 8 bit Y-axis and 9 bit X-axis
resolution. The oscilloscope had built in ensemble
averaging capability which allowed ensemble averaging
up to 256 repetitive sweeps. Oscilloscope
synchronization was by triggering the leading edge of
the pulse from the waveform programmer.
Steady State A.C, Experiments
For comparison with the Fourier transform
measurements, conventional single frequency
Mott-Schottky experiments, essentially a.c.
voltammetry at a semiconductor, were performed. For
these experiments, the external source was a PAR Model
124 lock-in amplifier (Figure 12). The internal
reference of the Model 124 was added to the PAR 173
input, and the current follower output was detected
using phase selection detection at the reference
signal frequency. There was, of course, no low pass
filte rin g necessary. The analog output of the PAR
124, proportional to the strength of the detected
signal, was measured with a Kiethley Model 179 TRMS
digital multimeter, and transferred to the CS9000, via
GPIB, for storage and processing.
Ion-Selective Electrode Study
The work with ion-selective electrodes represented
a major change in instrumentation. The PAR 173/175

52
system was replaced with a PAR 273
potentiostat/galvanostat. The PAR 273 was a superior
potentiostat to the older Model 173, and was
controllable by the IBM CS9000. Waveform generation,
experimental control, and data collection could all be
performed via computer control for signals up to 2
kHz. Thus, instrumental configuration for the
potentiometric and bipolar conductance studies
consisted of attaching the cell to the leads of the
potentiostat, and connecting the latter to the CS9000
by GPIB. For the admittance measurements, however,
the technique introduced in the TiOz work was used.
The configuration was as shown in Figure 12, except
that the anti-alising f i l te r was placed along with a
firs t order high pass f i l te r between the external
pulse source and the potentiostat external adder input
(Figure 13). This reduced the compliance requirements
made on the potentiostat since unused frequency
components were filtered out before the signal was
input to the adder. This also reduced the chances of
driving the cell into a nonlinear regime with
excessive potential excursions. A major problem in
the use of the PAR 273 was a design limitation in the
grounding circuits that led to extremely high levels
of high frequency noise (>1 MHz), apparently from
digital switching in the microprocessors. This

53
necessitated the use of an additional low pass
<700 kHz) f i l te r placed between the current -follower
output and the oscilloscope.
SOFTWARE
Five major programs were written for acquisition
and analyses of data: FASTF0U4, for FFT computation;
LINPLOT, a versatile plotting routine; along with the
data acquisition programs, AVSC0PE6, DVMETERG and
PAR273. All programs were written in IBM CS-Basic
(version 1.2) running under the CSOS (version 1.13)
operating system. Using BASIC was inconvenient only
for the FFT programs, where a FORTRAN implementation
was naturally advantageous for reasons of time.
However, the f le x ib ility of BASIC in I/O, especially
graphics, which was not available in our version of
CS-FORTRAN, compensated for the time disadvantage.
Fast Fourier Transform
The central piece of software in this research was
FASTFQU4, a listing of which is given in Appendix A.
This program used an implementation of the Cooley-
Tukey FFT algorithm, written in BASIC by Stanley and
Peterson Cl 3 for the Radio Shack TRS-80 microcomputer.
The program was modified to run on the IBM System
9000. Further modifications enabled the generation of
the fu ll N-l harmonics rather than Just the N/2 unique

harmonics of the Stanley and Peterson version; and
also enabled the b it—reversal subroutine to use
bitwise ANDing instead of arithmetic comparisons
("less than"). This resulted in a net reduction in
commputation time from 161 seconds to 90 seconds for
1024 point transform. Computation time was further
reduced by using multiple statements per line. The
final version performed a fu ll 1024 point FFT in 45
seconds, using double precision real (64 b it)
calculations. This was too slow for anything
approaching real-time calculations, so a FORTRAN
version was written which performed the same
calculations in IS seconds, using single precisian
real (32 bit) math. This was s t i l l too slow for on
line use, and d ifficu lties with the system I/O
subroutines in the FORTRAN libraries made its use
unsui table.
The alternative for o ff-lin e use was batch
processing of time domain data. FABTFOU6 was a
modification of FASTF0U4 that read input f i le names
from "DATA" statements in the BASIC code. This
allowed the user to enter filenames into the program
code and check for errors before the program was
begun. The program would then perform FFT
computations for up to 64 data file s with an option
for normalizing the results with respect to a

55
reference signal. FASTF0U6 included an error trap for
likely errors such as incorrect filenames or
nonexistent input file s . Thus, the f le x ib ility of the
BASIC version effectively compensated for its speed
deficiency.
GrHPhiElSince no graphics software was available for the
System 9000, LINPLOT (Appendix B) was written to
display data graphically. LINPLOT allowed data from
several f ile s to be plotted on one graph without
necessarily using common abcissa values. This feature
allowed comparison of data from several experiments,
an important factor since the frequency range for one
Fourier transform experiment covers only two or three
decades. Thus, several FT experiments could be easily
combined to see a much wider frequency range than was
available from a single experiment. A choice of seven
token symbols or continuous line plots was available
for each data set, simplifying the comparison between
several sets. The program fragments L0G2APP, XVSYAPP,
logXAPP, and logYAPP were written for use with
CS—BASIC's "APPEND" feature. Each of these fragments
could be APPENDed to LINPLOT to produce
log-1og, X-Y, or semi log plots. These "appendix"
routines are also listed in Appendix B.
56
tut*. Acavinti on
A large part of the data was collected using the
Tektronix 468 digital oscilloscope. The program to
interface the CS9000 to the oscilloscope was AVSC0PE6,
based on SC0PE2, written by R. J. Gale and R. E.
Borjas £23. AVSCOPE6, listed in Appendix C, took 512
point data arrays from the oscilloscope, averaged a
user specified number of these arrays in double
precision real variables, and scaled the results based
on user specified oscilloscope range settings. The
data were then saved on floppy disks for later
analyses. The program would save up to four
sequential 512 point arrays under a single filename.
This allowed considerable averaging f le x ib ility in
conjunction with the oscilloscope’ s capability for
ensemble averaging of up to 256 sweeps. The major
limitation of the program was the long recycle time of
the oscilloscope after data transfer (about 1.5
seconds) and the slow disk writes using CS-BAS1C PRINT
statements (3-5 second for 1024 points).
Some of the Mott-Schottky and other cyclic
voltammetry data were digitized with the Keithley 179
TRMS digital multimeter and transferred to the
computer by IEEE—4BB communications, using DVMETER6
(Appendix D>. The Kiethley meter stored data in
binary coded decimal format and transmitted the data

57
as ASCII cod* in 6 bytvs (5 digits + sign). DVMETERG
read tha data and, using CS-BASIC type conversion
functions, converted the character string to real
format. Data Mere then scaled according to a range
setting specified by the user. Data could be acquired
at a maxi mum rate of
4 points/second, Mith real-time graphic display of the
results.
Potentiostat Control
The final major software written was "PAR"
(Appendix E), a GPIB interface program for control of
the PAR 273 potentiostat and subsequent data
collection. The program, PAR, provides for an
interactive dialogue with the potentiostat. All PAR
273 commands are accessible through this program. The
fact that PAR is written in BASIC is actually an
advantage. The relatively slow execution speed
provides a control on the rate at which commands are
transmitted to the potentiostat. Because separate
microprocessors handle the communications and
execution of the commands, the instrument easily
succumbs to "command overrun" error as a new command
arrives before the previous one is completed. The
relatively ponderous command processing in PAR
generally prevents command overrun.

58
The only significant problem with the program was
that the System library IEEE driver timeout could not
be enabled. This imposed two severe restrictions on
the program! the potentiostat could not be polled
with the system library palling routine and, more
seriously, any command that required a response from
the PAR 273 had to be followed by a "Listen" command
(defined by Function key #1). The alternative of
polling the instrument through software to see i f a
response was ready was not available. The problem
with this was that i f the FI key was inadvertently hit
when the PAR 273 had no output ready on the GPIB, the
timeout was inoperative! the computer had to be
rebooted from a cold start. Ordinarily this was only
an inconvenience; the FI key was far enough removed
from the other working keys that the situation arose
only rarely. The timeout problem seems to exist only
in the version 1.13 system; when the routine was
adapted to version 2.0, the timeout was operative. At
the time, however, conversion of the entire program to
CSOS 2.0 would have been too time consuming.
Features of PAR included user defined procedures
that could be incorporated into the BASIC code.
Comments in the program provided instructions for
adding procedures. There was also fa c ility for
including a system function packet for invoking IEEE

59
driver -functions. Finally, the user could create
-floppy disk "command files " , containing series of
commands to be sent to the PAR 273 when that f i le was
called with a "DISK" option. This allowed easy and
reliable recreation of experimental conditions. Data
were transferred in 12 bit twos-complement format and
were automatically converted to mA or mV, whichever
was appropriate. I f the automatic range selection
option in the PAR 273 was active, the data were
automatical1y scaled accordingly. Error traps were
provided to account for a variety of errors, mostly
associated with f i le handling or input format errors,
and to close a ll f ile s and the GPIB in the event of a
fatal error.
CONSIDERATIONS IN SELECTION OF PERTURBATION WAVEFORMS
The original approach with the TiOa experiments was
the same as the earlier approach of Creason et a l. and
others. By the time scaling property, i f the pulse
widths were small, the bandwidth of the signal would
be large) for maximum spectral bandwidth duration of
the pulse had to be a minimum. In the lim it of zero
pulse width, this is the traditional approach of
observing the time domain impulse response. On the
other hand, data quality in general, and particularly
in lower harmonics, suffered i f the pulse duration was

6 0
small) for maximum data quality the pulse duration had
to be a maximum. In the lim it of in fin ite pulse
width, this is the traditional approach of observing
the time domain step response. In the study of
reverse biased semiconductor electrodes, there was
considerable f le x ib ility in waveform choice compared
with the faradaic impedance measurements. The minimum
pulse duration, t , consistent with high quality low
frequency data, corresponded to about three time
constants of the exponentially decaying response. The
observation time varied from 2.0t to 10t. In
practice, observation times greater than 4t were
usually only interpolated results. Because,
according to the above crite ria , t was the time
required for nearly complete relaxation of the "pulse
on" transient, and because the following "pulse off"
transient was roughly symmetrical, there was no data
actually acquired after 2t, and the additional time
amounted essentially to zero—f i 11ing. According to
Ernst C31, zero -filling , appending a string of zeros
to extend a data record to twice the number of
original data paints, actually increases resolution,
but any additional zero -filling amounts only to
Fourier domain interpolation.
A d ifficu lty with the use of the above pulses was
that the spectrum was defined by a (sin X)/X function,

61so not only did the magnitude generally decrease with
increasing -frequency, but i t also passed through nodes
at intervals o-f 1/T0. Thus there were regular
-frequency intervals at which the excitation magnitude
approached zero. Obviously these were points where
precision of impedance results was poor and and where
“catastrophic" errors were often found [43. The
occurance of these nodes was d iffic u lt to account for
in data processing software except at pulse durations
of To/k, where k is a positive integer. The behavior
of the magnitude spectra for several pulse widths is
shown in Figure 14.
Note especially that the behavior of the T0/2
pulse, i.e . square wave, is particularly simple. For
a square wave (Figure J4d>, the frequency domain
sampling points occur only at nodes and local maxima
of the (sin X)/X function describing its Fourier
transform. That leads to an odd harmonic waveform, in
which even harmonics have a magnitude of zero and odd
harmonics a magnitude inversely proportional to f .
Furthermore, the spectrum of the waveform can be
"flattened out" by appropriate filte rin g due to the
Fourier relationship between differentiation with
respect to time and multiplication by Jw. In fact,
advantage was taken of this property by using a
"partially" differentiated square wave (high pass

62
-filtered) as a perturbation signal. A truly
di-f-ferentiated square wave would produce a bipolar
impulse pair, but with compromised quality of low
frequency data. The use of "partial" differentiation
allowed the maintenance of data quality while
producing a distorted bipolar pulse. Coincidentally,
Ooblhoffer and Pi 11a C53 showed that a bipolar pulse
was useful for reducing faradaic nonlinearities.
EXPERIMENTAL PROCEDURES
Unless specified otherwise, water used in a ll
experiments was obtained from a glass Gilmont
continuous s t i l l (Mod V) and was stored in
polyethylene carboys. All chemicals met ACS
standards, and were used "as is" unless specified
otherwise. Electrochemical cells were degassed for at
least 20 minutes with solvent saturated argon that had
been passed over copper catalyst to remove traces of
oxygen. The exceptions to this were the ion—selective
experiments, which were not degassed. Measurements
were made in unstirred air jacketed glass cells, again
with the exception of the ion—selective electrode
studies. These were performed in 100 mL polypropylene
beakers with slow magnetic stirring. In general,
prepared solutions were stored in polyethylene
bott1es.
63
n-TiCU Admittance Mtaturgrognts
Several pieces of single crystal n-Ti03 which had
previously been doped to l O 1* cm-3 by high temperature
hydrogen reduction 163, were used as electrode
material. In pretreatment, the crystals were soaked
in a 1*1 mixture of concentrated sulphuric and n itric
acids for two days, and then rinsed with d istilled
water. They had a semi—glossy blue-black appearance
and were hydrophobic, resisting wetting with water.
Electrodes were prepared by scratching the back of
the n-TiOa crystals with coarse emory cloth, a steel
f i le or a u t i l ity blade. The roughened surfaces were
coated with a 3s1 gal 1ium-indiurn alloy which had a
melting point of about 20-25*’ . Electrical contact was
made with 20 ga. multi strand general purpose
electrical wire. The electrode assembly was then
coated with Devcon General Purpose tEK-l) white epoxy.
Mott-Schottky measurements were made in 0.1 M Na SD
and with 3M NaOH used to adjust pH.
Measurements were made using conventional a.c.
technique and the pulse-FT technique. Comparisons
betweeen the a.c. and FT techniques were made for both
the n—Ti03/0.1 M NaaS0« interface and dummy cells
constructed from aperiodic elements (resistors,
capacitors).
6 4
The a.c. technique was performed with the
experimental configuration shown in figure 12.
Quadrature (0 * +90**) currents were measured for the
semiconductor ce ll, then space charge capacitance was
calculated using the measured quadrature with the
assumption that the low frequency lim it (aquation 14)
applied. Dummy cells using RC series with varying
capacitance were measured to make calibration curves
of X vs. C. Amplitudes were kept to 10 mV and below.
All a.c. Mott-Schottky experiments were repeated at
several frequencies, usually in the range of 500 Hz to
3 kHz. The potential scan rate used was slow, 10 or
20 mV/sec.
Admittance measurements made with the pulse-FT
technique were taken at discrete bias potentials,
normally at +0.5, 0.7...+1.50 vs. SCE. The cell was
le ft at open circuit between response measurements.
The instrumental arrangement was that shown in figure
11, using the PAR 173/175 potentiostat/waveform
programmer. The philosophy behind pulse choices was
that shorter pulses were better for high frequencies
and longer pulses were better for low frequencies.
Often the experiment was repeated with two different
pulse lengths; for example, a short pulse of 0.1 T0
might be followed by a subsequent experiment using 0.4
To. A limitation on the upper frequency lim it of the
65
measurements n » that the PAR 175 Mould not produce
pulses o-f less than 0.1 msec. Pulse amplitudes were
lim ited to a maximum of 50 mV and were exclusively
positive-going.
Data were collected with the Tektronix 468 digital
storage oscilloscope with low pass filte rin g at the
oscilloscope input. For these experiments, f irs t
order f ilte rs were used, with the corner frequency at
the 100th harmonic of the spectrum being observed.
This, combined with the 1/f decay of the perturbation
spectrum, produced a second order ro llo ff in the
measured spectrum, which reduced the effect of
aliasing. Because the perturbation and response could
not be measured simultaneously, the perturbation
waveform was sampled using a high degree of averaging
before cell response measurements began. Typically,
on the order of 64 sweeps were averaged in the
oscilloscope and 64 of the resulting arrays were
averaged using AVSCOPE6. This measurement could be
made with the cell at open c ircu it. Furthermore,
because the perturbation signal, and hence its
spectrum, remained unchanged throughout the
experiment, except for a d.c. offset, only one or two
highly averaged perturbation waveforms needed to be
digitized. These would then serve as reference
signals for a ll admittance calculations. Perturbation

S£>
waveforms were taken directly from the waveform
programmer rather than through the potentiostat
response to a known resistance. This had the major
disadvantage of allowing gain-phase distortion by the
potentiostat-current follower system to appear in the
admitance spectra. Cell response was, of course, also
measured with the Tektronix 466 oscilloscope, but with
less averaging. Normally, 64 sweeps were averaged in
the oscilloscope and no more than 6 arrays were
averaged with AVSCQPE. To maintain a large bandwidth,
the current range on the PAR 173 was kept as high as
possible while maintaining an acceptable signal-to-
noise ratio. The signal could be amplified to
maximize digital resolution using the pre-amp of the
oscilloscope, which in no case produced distortion at
the frequencies studied. In order to increase the
observed frequency range, i t was necessary to perform
the experiment twice (for a 4 decade frequency range)
or three times (for a 6 decade range).
After the comparison of the performance of the
pulse-FT technique to single frequency a.c.
measurements, the effect of pH on the system response,
particularly space charge capacitance and f la t band
potential, was studied. The pH of 0.1 M Na3SCU was
adjusted, using approximately 5M HaSCU or NaOH, as
required. The pH was manitered with a separate pH

67
electrode continuously immersed in the cell during
these pH studies. The order of pH values used was
varied, except that neutral and acidic solutions were
always tested before those with pH > B because of the
tendency of alkaline solutions to etch the TiO=
surface. Solution pH ranged from 3.5 to 9.8.
Admittance spectra for dummy cells were obtained by
both a.c. and pulse-FT measurements. The dummy cells,
built from resistars and capacitors, were based on the
simple RC model shown in Figure 3d. The resistors
were accurately measured to three significant figures
with the Kiethley multimeter, and the capacitors used
had a tolerance of ±5X. The values for dummy cells
were chosen to be similar to Rto and C»=t as determined
in the TiO= experiments. Thus 500 resistors were
used, with capacitors having values from 0.001 pF to
1.0 pF. Unfortunately the PAR 173/175 system was no
longer available, so comparisons between the a.c. and
pulse techniques were made using a PINE RDE-3 and a
newly introduced PAR 273 potentiostat. The procedure
for making a.c. measurements of the dummy cells was
the same as for semiconductor experiments except of
course that measurements were made only at O V bias
potential. Potentiostat frequency response
measurements were made by adding single known
frequency sinusoids at the external input, and

6 8
measuring the current response under a constant,
purely resistive load. Phase selective measurements
were made at -frequencies up to 200 kHz with the PAR
124A lock-in amplifier. For frequencies from 200 kHz
to 1 MHz, nonphase selective a.c. measurements were
made using a Wavetek VCG114 oscillator as a source and
the Tektronix oscilloscope for response amplitude
measurements.
For Pulse measurement, the Global 4001 pulse
generator was used to provide perturbation signals.
Admittance measurements were made with the same
procedure used previously. Additionally, input pulses
were subjected to varying degrees of high pass
filte rin g in order to reduce the disparity between
amplitudes of high and low frequency Fourier
components.
Conductance Measurements on Fluoride Ion-Selective Electrode
Ion-selective electrode (ISE> impedance was studied
in the context of earlier BIC0N studies of the
fluoride electrode by Powley and Nieman C71, in which
electrode conductance was found to be dependent on
analyte concentration. The purpose of the present
work was to apply the pulse-Fourier transform
admittance technique to investigate the reported link
between electrode conductance and analyte

69
concentration, as well as to determine the influence
of the large potential excursions of the BICON
technique on electrode conductance. Electrode
response was measured with three techniques: bipolar
pulse conductance measurements, Fourier transform
admittance measurements and potentiometric
measurements.
The electrode studied was an Orion 94-09 fluoride
electrode. The fluoride electrode was of the same
type as used by Powley and Nieman and consisted of a
LaF3 membrane with an internal Ag/AgCl reference
electrode.
A 10- * M fluoride solution was prepared from
recrystallyzed sodium fluoride which had been dried at
110= for 6 hours. This was diluted to provide 10-3 M
and lO-3 M fluoride solutions. These three solutions,
which were stored in polyethylene bottles, were used
to prepare solutions of 10~* M to 10—'* M fluoride, by
spiking 50.0 mL of total ionic strength adjusting
buffer (T1SAB) with 1 to 50 pL of the appropriate
solution. All fluoride measurements were made using 1
M potassium acetate, adjusted to pH 5.5, as an ionic
strength adjustor. The cell was a three electrode
cell with a saturated calomel reference electrode
(SCE) and a platinum mesh auxilliary electrode in a
100 mL polypropylene beaker. Solutions were stirred

70
magnetically during *11 experiment*. Cork disks were
placed under the cell to prevent solution heating by
the s tirrer.
Bipolar pulse conductance measurements
BICON experiments were performed using the
modification by Powley and Nieman C7], in which a
sequence of pulses with decreasing amplitudes was used
to generate a linear current vs. pulse height curve,
called an "i-V curve". The slope of this curve gives
the electrode conductance and the y-intercept gives
the so-called "2 ero pulse" current, said to be
systematically related to analyte activ ity (although
the relationship is neither linear nor even
monotonic). In the present work, a sequence of six
100 psec pulses, with amplitudes decreasing from 2V to
23 mV, was used. An example of the waveform used is
shown in Figure 13. The pulses were applied by the
14-bit digital to analog converter of the PAR 273,
from a computer generated array stored in memory. The
current was d ig ita lly sampled, with 12-bit resolution,
at the end of each pulse. The average of 16 sweeps
was saved on disk by the CS 9000 for each of the
several concentratione used. Changes of concentration
were made by the standard addition method. The dc
bias to which the pulse sequence was added was the
open circuit potential of the cell containing ISA. A

71
relay in the PAR 273 insured that the cell was at open
circuit when data were not being recorded* thus
reducing the rate of electrode deterioration.
Fourier transform conductance measurements
After repeating the Powley and Nieman BICON
experiments* Fourier transform admittance measurements
were made on each of the electrodes* for several
analyte concentrations* using the procedure described
earlier for semiconductor electrodes. The Global 4001
output was high pass filtered by a f irs t order 32 kHz
f i l te r * and low pass filtered* at 30 kHz* by a third
order f i l t e r . This produced the bipolar waveform*
shown with its magnitude spectrum in Figures 16 and
17. Placement of the low pass f i l te r before the PAR
273 external input reduced performance demand on the
control circuitry. This configuration was an
effective anti-aliasing procedure except for switching
noise from the current follower output. This was
eliminated by placing a 700 kH2 low pass f i l te r
between the current follower output and the
oscilloscope. Experimental conditions were otherwise
unchanged from those for the BICON experiments so that
the electrode would be subjected to the same
environment as in the Powley and Nieman work.
Admittance measurements were made over the frequency
range of 300 Hz to 50 kHz* corresponding to the time

7 2
scale on which the conductance response was said to
occur.
Potentiometric measurements
Frequent patentiometric measurements were made to
verify that the ion selective response of the
electrode had not been damaged by the BICON on the
Fourier transform admittance procedures. Response
time measurements were made, rather than Just steady
state potential measurements, to provide an additional
indicator of possible electrode degradation. Dynamic
response to concentration changes was measured after
immersion into a stirred solution of higher or lower
concentration, or after injection of microliter
quantities of the appropriate concentrated solution.
Potential readings vs. SCE were taken by the PftR 273,
at intervals of 25 milliseconds. The readings were
averaged in blocks of twenty and saved in the data
array, giving an effective time resolution of 0.5
second. The response was recorded for approximately
four minutes, long enough for a ll but the lowest
concentrations to come to a steady state.

P M » * l 175 I f r l r e n a l P u i|i w i f
P M 173 P o te n tto s ta t / G a lv w w tU t
R ttw e rt
P M 179 Current F o llow er
L*fhuF ll ir r
IBM Instrum ents C/5 9000 Microcomiuter System
OP IB
s zT e k tro n ix model 468 O ig ita l O sc i1loscope
Figure 11s Block diagram oF instrumentation For data acquisition in n—TiOa Pulse—FT admittance experiments*

external a.c input signal
PAR 123 Potentlostat
current fo il output
GPIBKiethley 179
Digital Volteeter
PAR 124A Lock-In Amplifier Phase Selective Bandpass Mode
IBM Instruments System 9000 Microcomputer
F i g u r e 1 2 : I n s t r u m e n t a l c o n f i g u r a t i o n f o r s t e a d y
s t a t e a . c . a d m i t t a n c e m e a s u r e m e n t s
'■Jif*

75
3 E l R e t r o d * C a l l
7 0 0 k M * LOW P A S S
F I L T E R
H IG H P A S S F I L T E R
T E K T R O N IX H O D E L 4 A B
d i g i t a l
•S C IL L O S C O P E
G L O B A L 4 0 0 1 V A R I A B L E P U L S E
G E N E R A TO R
IBH IN S T R U M E N T S S Y S T E M VOOO
H IC R O C O W U T E R
P A R 2 7 3 D I G I T A L P O T E N T I D 8 T A T
Figure 13t Instrumental configuration for Pulse-FT admittance study of Fluoride electrode.

Figure 14: Theoretical magnitude spectra for relativepulse widths of (a) 5%, (b) 20%, <c) 30%, <d) 40% and (e) 50%.
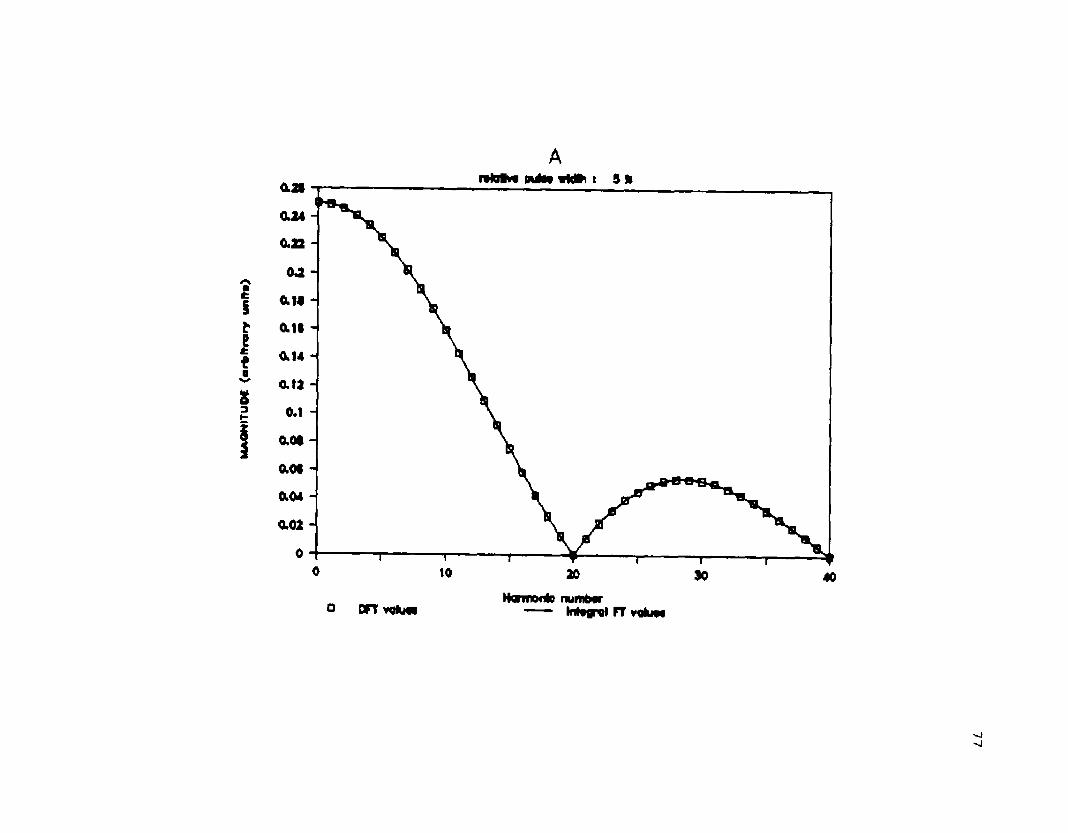
(•41UA Aja
hi
jo) MnilN
OVn
A
Oi4 H
022 H
014
012 H
o.i H
oo* H
004 H
Honrnnto numberorr
'j'j

MA
ON
ITU
K
(arb
itra
ry
un
it*)
B
0.7
0.S
0.1
0 10 20 30
Hwimflb number O (FT voIinn Intv^ol FT v«Ium
Sim

MAO
MIT
UOC
{arb
itra
ry
un
lta
)
c
1.1
1
0.7
O J
0.1
00 10 20
tkrmonto numb*O DFT vaKwv Intaqrql FT vekiee


MA
GN
ITU
DE
{ort
oftr
ory
un
its)
E
t j
M
o.e
OJ
Ik rmwk) nuirbsr ° OFT Mvgrat FT *4kjm
I
m

rela
tive
pula
* h
eig
ht
IJ
IJ
I
OJ
OJ
OJ
OJ
0
-OJ
-OJ
~OJ
-OJ
-I
- t J
-1J0 2 4 e s 10
Dm* (fnlNwcond*)
Figure 15s BICON diminishing pulse sequence.
Exponential decoying puln eoquonco
at

mrn
rvoJ
tv
FMwvd Sauar* Wav*
13 -
!0 -
-3 -
-10 -
-13 -
-20 H0 32 34 93 128 130 192 22* 233 288 320 332 384 413 440 430 312
Dcrio o m y 1n0*x
Figure 16: Filtered squarewave signal used For inputin FT admittance measurements -for Fluoride electrode.
®u>
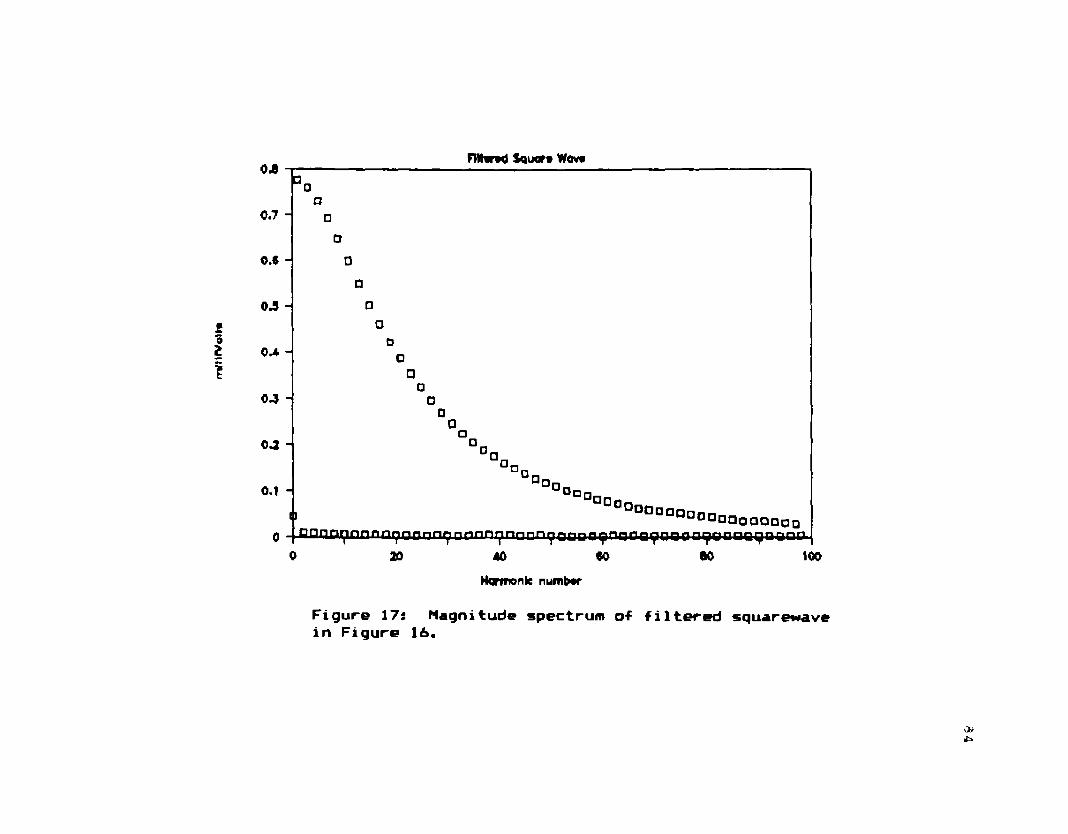
mftirV
otta
FtNrwJ Sgiwf# W«m
0.7 -
0 .* -
04 -
04
04 -
OJ -
0.1 -
°G□
□□
□□
□□
□o
□0o
□□□
"”coDo
Qo □ n _OD°ao
DOOOODODoaoaDooo□ □ r iD r in n n n r in n n n f in n n n r in n n n r » o o n t1 |y f in i i f l y n i)Q n 'j f7 T irB Q P B n n
20 40 00 60 100
Harmonk number
Figure 17: Magnitude spectrum of filtered squarewavein Figure 16.
Oi
RESULTS
MOTT-SCHOTTKY ANALYSIS OF n-TiO»
Mott-Schott ky Analysis is -fundamental to the
characterization o-f the semiconductor/electrolyte
inter-face. I t is usually used to obtain dopant
densities and f la t band potentials via the so-called
Mott-Schottky equation, a linear relation between
and applied potential, with dopant density and -flat—band
potential being key parameters. Ordinarily, space
charge capacitance is obtained by steady state a.c.
measurements during the application of a slow voltage
ramp. The ab ility to rapidly obtain frequency
dispersive information during a single Mott-Schottky
experiment would fa c ilita te the evaluation of
experimental results in terms of the preceding
admittance discussion. Furthermore, the potential speed
advantage of a Fourier transform technique can reduce
changes in the interface by parasitic electron transfer
reactions during the voltage sweep.
Pulse—FT Measurement
As discussed in Chapter 3, the magnitude spectrum
obtained by FFT depends upon the "relative pulse
length", the fraction of the observation period, T<p,
corresponding to the "pulse-on" state. In terms of the
Fourier domain, the choice of relative pulse length
determines the frequencies at which the (sin X)/X
6 5

8 6
function, the Fourier transform of a pulse, M i l l be
“sampled". Experiments were performed on n-Ti02
electrodes using relative pulse lengths of 10%, 20%,
30%, 40% and 60%. Analogously to Figure 14, the
magnitude spectra of some experimental pulses are shown
in Figure 18. Of particular interest is the occurrence
of nodes and very small magnitudes at some frequencies
in the magnitude spectra. Obviously at frequencies
where the input magnitude is small, relative errors will
be large. Consequently, admittance calculations (or any
other normalization operation) w ill produce relatively
low quality results. The & oriori exclusion of such
frequencies is thus justified in interpreting
experimental results. Though pulses with durations of
T0/k, where k is a positive integer, theoretically have
nodes at every kth harmonic, small deviations of pulse
length from T0/k can result in generally small non—zero
magnitudes at the expected nodal points. For the higher
harmonics, the expected nodal frequencies may even
correspond to the larger magnitudes present. An
extension of this concept leads to the result for a
relative pulse length of 30% which deviates markedly
from T0/k. The magnitude spectrum shown in Figure 18c
contains apparently irregular variations in magnitude.
While fewer nodes are expected in this spectrum, the
occurrence of small magnitudes at irregular intervals

87
poses a similar problem that is more tedious to
overcome.
It is important to note here that this phenomenon
should not be considered leakage; leakage errors are
actual deviations -from expected Fourier transform
coefficients. The values obtained are the correct
values if the observation period is equal to the
waveform period, but seemingly irregular behavior arises
here from the nonintegral relationship between the pulse
length and the waveform period. In terms of the
conceptualization shown in Figure 2, the frequency
domain "sampling" is not synchronized with the
oscillations of the (sin X)/X function.
Typical admittance results: magnitude, quadrature
and in-phase components, produced with FASTF0U6, are
shown in Figures 19 and 20 for each of the two crystals.
Each of these spectra covers roughly a 4 decade
frequency range by combining the results of two separate
measurements. The end of each measurement range is
identified by a high density of data points in the
graphs. I t is apparent that the lower harmonics of each
measurement produce relatively high quality results.
The occurrence of obvious outliers resulting from small
magnitudes in the input spectrum are also plainly
visible. The most noticeable problem with these
measurements is a general decrease in precision for the
8 8
higher harmonics in each frequency range. This problem,
arising from the overall inverse proportionality between
spectral magnitude and frequency, is seen at the highest
frequencies on the graphs. I t is significant that the
higher harmonics suffer only from a decrease in
precision and that, in general, there are no systematic
errors associated with the data processing.
The data in Figures 19 and 20 are presented in a
semi 1ogarithmic format to provide a realis tic picture of
the type of scatter found in the admittance calculations
deriving from this technique. The same spectra are
presented in log-log format in Figures 21 and 22. The
data in this case have been "combed", as was done by
others in the past C10I. In Figures 21 and 22 however,
only the data points that can be associated with small
input magnitudes have been removed, rather than
eliminating points on the basis of statistical deviation
from an analytical model. One point emphasized by the
logarithmic presentation, in which relative errors are
converted to absolute errors, is that the increase in
relative deviation at the higher harmonics is roughly as
pronounced in the lower frequency range as in the higher
range.
A major systematic error is shown in these spectra.
Instrumental limitations, especially under such highly
capacitive loads, contribute to a ro llo ff in the

8?
Admittance spectrum. While, ideally, the in-phase
component and magnitude should both approach a limiting
value, they are seen to decrease at higher -frequencies.
The admittance quadrature was expected to decrease above
a critica l -frequency, f t = l/(2nRC), but the measured
capacitance showed a much sharper decrease and,
unexpectedly, became negative. Some of this error could
have been eliminated by using the instrumental response
with a known, purely resistive load as a reference
waveform rather than the directly measured perturbation
waveform. Interestingly though, part of this error
would not be reduced by this procedure. The effect of
instrumental response on the admittance results is
discussed in a later section.
The above factors are significant in the extraction
of space charge capacitance values, C.c, from admittance
spectra. As mentioned, C„c can be determined in two
ways. F irst, measurements can be made in the low
frequency lim it, where the quadrature is determined
predominantly by wC.c. Alternatively, the in-phase
component can be used, by measuring the peak of a
G,»/w vs. f curve. The value of this peak, occurring at
f<=( is equal to wC.c/2 for the simplest model of the
system. I t is evident from Figures 21 and 22 that
measurements at f =, the frequency at which G„ = mCp, can
be more susceptible to instrumental distortion than
9 0
those in the low frequency regime, where f << f c. In
addition to instrumental considerations, the choice
between using wCp and Gp/ m for determining C»= may be
Affected by the location of f^ within the input
spectrum. If frr corresponds to higher harmonics of the
waveform, then, as seen above, the precision of the
result will be somewhat poorer than i f f c corresponds to
a lower harmonic. I f the low frequency lim it
corresponds to lower harmonics while f c corresponds to
higher harmonics, then CB<= may be more precisely derived
from the admittance quadrature.
Because of the observed distortion in admittance
data at frequencies near the G /w peak, series
capacitance values for the equivalent circuit were
calculated using the low frequency Fourier transform
data and the equation
<17> y * O + jwC»,
where y is total admittance, w is radial frequency and
C. is the series, predominantly space charge
capacitance.
The in—phase information was nevertheless useful for
verifying an absence of major parallel capacitance such
as might be associated with electrode surface states
Cl,23. Linear regression of admittance quadrature on
frequency (Hz) yielded a slope of 2 t t C » . The large
magnitudes of the lower harmonics of the pulse were an
91
advantage here and allowed precise calculations of C_.
Based on the relative standard error associated with the
regression slope, the values obtained were generally
± IX at the 90% confidence level.
ft.C. Measurements
Concurrent a.c. measurements returned frequency
dependent capacitance values that decreased with
increasing frequency. This behavior can be explained in
part on the basis of Figure 21, which shows a lower than
expected f c for these cells. Even at the lowest a.c.
frequency used, S00 Hz, the in-phase component is
significant. Thus the system is not in the "low
frequency" regime and the simplification of the equation
(18) wCP = wC-fr-+■ (wC.) =*
by neglecting (wC.)2 in the denominator did not apply
at these frequencies then, because the <wC_)a term was
not negligible with respect to G&*. Calculations based
on the assumption wCp e wC. yielded low results because
wC„ was actually less than wCs. That this was the case
can be shown using the ratio of in-phase to quadrature
components or Cot 0, where 0 is the phase angle. This
can be seen from equation 18 to bet
Cot 0 *= Re (V) - wC- Im(V> G„
so that in the low frequency lim it, where wC_ << G»,
Cot 0 —> O. The value of Re<Y)/Im(V) as a function of

92
-frequency -for this system is shown in Figure 23. A
value of 0.6 for cot 0 at 500 Hz, as obtained from
Figure 23, corresponds to a phase angle of approximately
60°. This is roughly the same as the phase angle of 69°
obtained when both components were measured by the a.c.
method. Using phasor notation, the admittance
quadrature is
wCp * IYI sin 0
Assuming a phase angle of 60° and correcting for the
sin 0 factor gives a calculated capacitance more in
agreement with the FT determined values. An accurate
value for the phase angle was not usually known,
however, because only the quadrature was typically
measured during the a.c. experiments. Thus the Fourier
transform results were compared to the lowest frequency
a.c. measurements, with the expectation that the a.c.
results would yield systematically low capacitance
values. Typical results for each technique are shown in
Figure 24. Also shown are values calculated using FT
admittance, assuming wCp = wC..
Correlation plots of FT results vs. a.c. results
(Figure 25) showed a linear correlation, albeit with the
expected systematic errors discussed above. A fu lle r
validation of the pulse FT approach with respect to the
steady state a.c. technique is discussed in a later
sec t i on.

93
The obtained C. values were used to estimate dopant
density (No) and the f la t band potential (V**,) of the
more highly doped electrode (Crystal I ) .
Mott—Schottky plots, versus yb, are described by the
equat i on
(19) C.-a - 2/ (€eNoA=*> (Vb - - kT/e)
where G is the dielectric constant for TiOa (€ -172),
e is the electron charge, A is electrode area, k is
Boltzmann’ s constant and Vb is the applied bias
potential. I t is evident from equation 19 that the
curve should be linear, with slope inversely
proportional to ND and an intercept on the x-axis at
+ kT/e. liott-Schottky plots obtained for Crystal I
are shown in Figure 26. The correspond!ng linear
regression parameters are shown in Table I I I . The two
FT experiments gave No results differing by less than
0.5X. The donor density calculated from the a.c.
experiment was 2.37. larger. This was not unexpected in
light of the preceding discussion, and was not
inconsistent with earlier reports of "frequency
dependent" dopant densities C3,43. The calculated No is
also consistent with the known value of “MO1"* cm-3 .
Conclusions
The Pulse — FT technique produced consistent
results for the semiconductor involved. In fact, the
results were superior from the standpoint of accurately
94
determining the equivalent circuit parameters. The
ab ility to observe the admittance behavior rapidly, over
a broader ■frequency range, painted out that the system
under study had an unusually low and allowed
correction for i t after the fact. The pulse—FT obtained
a broader range of information less often (complex
admittance at several frequencies but at fewer bias
potentials). Only six potentials were used in the
pulse-FT experiments; in the a.c. experiments the
quadrature was measured at 50 potentials.
Thus, the pulse-FT technique produced
Mott—Schottky results of equal or better precision than
the a.c. technique and, in this case, more accurately.
The flat-band potential should show a nernstisn
dependence on pH due to the acid-base equilibrium at the
hydrated TiOa. surface C3,5,63:
Ti OH + HaQ — -T i-0 + H30-
This equilibrium is affected by the potential difference
across the Hemholtz layer between the electrode surface
and the electrolyte. Being analogous to series
capacitances, the total capacitance would be:
Ct- ‘ = C.r - ' + CM- ‘ ,
where CM is the capacitance representing the Hemholtz
plane. The above chemical equilibrium thus introduces a
shift in measured fla t band potential of -kT/e or —59 mV
at 25*C, for each decade change in proton activity.

95
Tomkiewicz rtporttd a pH dependent f la t bend potential
■for n-TiO* which varied by -60 mV/decade, although
measurements were made at only 3 pH levels.
A series o-f experiments in O. 1M sodium sulphate
solutions o-f varying pH produced widely varying
flat-band potentials. A linear regression line did
yield a slope of -62 mV/decade, compared to the
theoretical value of -59 mV/decade, although the
correlation coefficient was only 0.311 (Table IV). The
pH data are shown in Figure 27. The error bars
show a large uncertainty for V*b estimates. The
variab ility in these data is probably due to variations
in electrode surface with time. I t is well known that
the admittance of n-TiO^ behavior can exhibit a
considerable dependence on the history of the
electrode C3,4,12J.
The Mott-Schottky slope on the other hand should
ideally be constant, being affected only by area,
dielectric constant and dopant level. The data shown in
Figure 2B exhibit a marked increase in slope at higher
pH. This clearly coincides with etching of the crystal
surface^ electrodes subjected to high pH were easily
wetted, whereas fresh electrodes were quite hydrophobic.
The high sensitivity of the interfacial dielectric
constant interaction with the solution makes for a
potentially excellent chemical sensor [131. This same

9 6
property may also be the source o-f the large variab ility
in as the above mentioned Hemholtz layer
capacitance responds to changes other than pH, such as
changes in surface area. In connection with this, i t is
significant that the electrodes were used repeatedly
between polishing procedures. Although the experimental
conditions for most experiments did not cause the
visibly obvious change in electrode surface, i t is
entirely possible that surface changes on a more subtle
scale were responsible for the poor reproducibi1ity in
f la t band potentials.
MODEL CIRCUITS
The presence of obvious systematic artifacts in the
results with TiOa required further tests of the FT pulse
technique with dummy circuits composed of known circuit
elements. Mock three electrode cells were prepared
using resistors and capacitors, according to Figure 29,
where ZH was composed of either a pure resistance or a
resistance-capacitance series. The use of R* on the
order of 50 Ci produced a closer approximation to actual
experimental conditions. R* represented the solution
resistance between the auxiliary and reference
electrodes. This is important because potentiostat
performance is known to deteriorate, in terms of
stab ility , when R., is nonzero C13. The system in

97
Figure 29 has s t i l l somewhat idealized because the
impedance o-f the reference electrode was neglected and
such resistance also decreases instrumental s tab ility .
Response for Purely Resistive Dummy Cells
Pure resistances were used to test the ab ility of
the pulse-FT technique to reproduce known values under
the most stable loadi pure resistive impedance with no
reactive component due to cell capacitance (e.g.
electrical double layer). Typical conductance results
are shown in Figure 30. I t is apparent that the
response is significantly attenuated by the PAR 173 at
frequencies above 20 kHz. The distortion in this case
was maximized by the use of the waveform generator
output as the reference signal. If the reference
waveform used was the system response under a known
resistive load, then much of this distortion would have
been eliminated by the admittance calculation. This
assumes the instrumental ro llo ff has the same profile
for the reference and cell responses as is often, but
not always, the case. The main artifact of the above
"gain-phase" error would then be a decrease in precision
due to the reduced magnitudes of higher frequency
components in the measured signals. This could present
a major problem in using simple pulse waveforms which
have magnitude spectra that generally decrease as 1/f in
the f irs t place. A log-log plot of the system magnitude

9 8
response is shown in Figure 31. The reduced precision
due to the 1/f nature of the pulse is again noticeable
in the higher harmonics. Furthermore, comparison of
curves a and b in Figures 30 and 31 illustrates how the
cell impedance can have a significant effect on system
response. Even though the two curves are for the same
1 mA/V current range, the magnitude response for the
20 o load is down by a factor of 1/-J2 at roughly 5 kHz
while the corresponding frequency for the 200 n load is
approximately 50 kHz. The results of resistance
measurements made using To * O.1 sec. and t = 0.02 sec
(frequency range from 10 to 1000 Hz) are given in
Table V. The correspond!ng semilog plot is shown in
Figure 32. The estimated value of R using the average
of a ll 100 harmonics was remarkably accurate considering
that values at some higher harmonics were incorrect by
±1000’/.! Nevertheless i f only the f irs t 20 harmonics
were used, uncertainty in the measured value was reduced
by a factor of ten (Table V I). The resistances were
supplied by a General Radio decade resistance box and
were accurate to ±2% of their nominal value. The close
agreement between the median and mean of the data
suggest that the errors were normally distributed. The
relative standard error (r .s .e .) over the f irs t 10
harmonics averaged 0.2X. This high precision was
typical for the f irs t several harmonics and the relative
99
error v«ritd from less than 0.1% up to 0.4%. The
relative precisian did not very with signal size.
Roughly constant relative precision over a range of
signal sizes should be expected i f the limiting factor
in the result is the A/D precision. This is because the
preamp in the digital oscilloscope could be varied so
that the same fraction of the A/D range was used even
for signals with different amplitudes. Not at a ll
surprisinglyf the precision of the results decreased as
more harmonics were used in the average, but the
standard error over the f irs t f i f ty harmonics was s t i l l
only on the order of 1%.
The effect on precision of the 1/f decrease in the
pulse spectrum can also be seen in the admittance data
for a 100 ohm resistor (Table V II).
Again, the general increase in standard error with
frequency was seen to be s t i l l only in the 1-2% range.
Table VII also contains the results from a comparison of
three different pulse durations. The number of data
points lying more than 4 standard errors from the median
for each pulse is given in Table V II I . The poor
precision at frequencies above the SOth harmonic is
quite apparent. Significantly, the difference between
pulses is not particularly large) a ll three pulse
durations gave reasonably good results below the 50th
harmonic. The only advantage of the 20% pulse was that

l o o
the discarded frequencies came regularly at every f if th
harmoni c.
The ab ility to make resistance measurements is not,
of course, a great claim for an admittance technique,
but the above measurements do provide an idea of the
type of precision one can expect in the measurement of
more complex systems without such an obvious admittance
spectrum. Relevant to measurement of phenomena such as
space charge capacitance in semiconductor electrodes is
the accuracy with which capacitance values can be
measured. Thus, RC circuits with known resistance and
capacitance were also measured.
Bespons* to r Dummy Cells Having Reactive ElementsAdmittance spectra for these dummy cells, as shown
in Figure 33, have the same type of systematic
distortion as the n-TiO* systems in the previous
section. The admittance is larger than expected at
frequencies near f c, followed by a strong decrease at
higher frequencies. The ro llo ff due to amplifier
bandwidth limitation was expected from the results with
pure resistances, but the unexpectedly high currents
arose from the presence of a reactive element
(capacitance). As can be seen in Figure 34, the smaller
capacitance (and higher f =) circuits produce the
expected quadrature, but the in-phase component was
larger than expected, in this case by a factor of 4. At

l o i
higher frequencies, closer to f t , distortion of the in-
phase component was smaller, but s t i l l quite significant
(Figure 35) .
The result was that accurate capacitance values
could be obtained from the mCp in the low frequency
regime for the test circuits, but resistance values
based on the in-phase component were grossly in error.
Furthermore, the signal attenuation at higher
frequencies (Figure 30) prevented use of the high
frequency lim it estimation of R. Numerical results are
presented in Table IX. The capacitance values were
calculated from the slope of wCp vs, w (using linear
regression), assuming Cp = C». The series resistance was
estimated from the slope, m, of the Gp vs. w curve,
which is linear at low frequencies. In the low
frequency lim it of (wC.)^ << G_*, m = C.=VG_ and
38 C^/m. The precision of this estimate is limited
primarily by the small magnitude of the in-phase
component at low frequencies.
Apparently, the presence of a reactive component
interacts with the feedback system and causes
gain-phase errors, in addition to those caused by the
more simple signal attenuation in purely resistive
loads. The behavior of these systems is consistent with
the discussion of Fitch £91 concerning the reference
signal used for PRWN-FT a.c. polarographic measurements.

1 0 2
According to Fitch, the equivalent circuit o-f the
reference circuit should match as closely as possible
the equivalent circuit of the system under study or
"excessive currents w ill be found at higher
frequencies." These higher currents he attributes to
aliasing, but the PRWN work was done with more
sophisticated f ilte rs than were used here, and on the
basis of the preceding resistance measurements, aliasing
does not seem a likely cause for the "excessive
currents." Certainly here at least, the source of the
error arises in the potentiostat control circuity. The
effect of capacitance potentiostat s tab ility , as
discussed by Roe 181, is shown in Figure 36 in terms of
the ratio of input potential to actual applied
potential. Analogously, the ratio of measured
admittance to predicted admittance, shown in Figure 37,
shows the same behavior.
Comparison between Pulse-FT and a.c. Techniques
A final concern was whether distortion of the
response by the potentiostat/current follower was
accentuated by the use of an input pulse. A series of
experiments, using dummy cells as above, was performed
using the PAR 273 potentiostat with both steady state
a.c. and pulse-FT admittance measurements. The steady
state a.c. admittance magnitude, shown for several dummy
cells in Figure 38, exhibits the same type of behavior

103
as the pulse-FT result with the PAR 173 (Figure 39).
The result* a-f the comparison ere summarized in the
correlation plots presented in Figure 40 and in Table X.
The strong correlation between the methods shows that
the distortion was not aggravated by higher demands
placed on the potentiostat by an input pulse.
NONPOTENTIOMETRIC USE OF FLUORIDE ELECTRODE
Bipolar Conductance Measurements
The original bipolar conductance (BICON)
experiments o-f Powley et al . C71 consisted of current
measurements at a single, precisely timed point in the
cycle o-f a bipolar pulse waveform; point 'A' in
Figure 41a. A subsequent modification of the technique
used a pulse sequence with decreasing pulse heights
(Figure 41b). A plot of I vs. gave a slope
supposedly equivalent to the electrode conductance. The
la tter technique was used with test solutions of
fluoride in an acetate buffer. The conductance obtained
from the I ys. Cl—V) slope was shown to vary in a
systematic but complex manner.
In the current work, an Orion 94-09 fluoride
electrode was measured using the two techniques above,
as well as a further modification in which the current
was measured at the end of the f irs t , positive going,
pulse (point B in Figure 41b>.

104
Fluoride Measurement u«ino BICON with pulse train
Before using Pulse-FT impedance measurements to
examine the relationship between conductance and
-fluoride concentration, an attempt was made to repeat
the earlier BICON experiments using the PAR 273
potentiostat under computer control. The cell response
to the pulse sequence was measured to verify that there
was in fact a concentration dependence and to note how
changes in the application of the technique influenced
the results.
"I-V” curves were obtained at each fluoride ion
concentration using the current at the end of the
negative-going or reverse pulse, as per Powley and
Nieman. These curves were in fact linear, with slopes
having relative standard errors (r.s .e .) of
approximately 0.2% (Table XI). Linear regression of I —V
slope (i.e . "conductance”) on log CF3 showed a
significant linear correlation (93% confidence level) i f
the measurement was made less than 2 seconds after
injection of the fluoride standard. If the measurement
was made after 60 seconds however, the correlation
coefficient was below the critica l value of 0.95. There
was no significant difference between the estimated I-V
curves at t < 2 seconds and t * 60 seconds, but errors
in the slope estimate increased from r.s .e . * 17% at
t * 2 sec to r.s .e . = 32% at t * 60 sec. Thus, there

1 0 5
was a significant positive correlation between
"conductance” and fluoride concentration i f the
measurement was made quickly, but the correlation was
less certain at longer immersion times because of the
increased error on slope estimates. The 2 sec. and 60
sec. results are plotted against log CF~3 in Figure 42.
Slope estimates for I-V curves obtained from the
forward, positive-going pulses had smaller associated
uncertainties, with r.s .e . of only O.IX (Table X II).
Slope estimates were also consistently lower than those
obtained from the negative-going pulses. Linear
regression of thus obtained conductance against log CF~J
showed a very strong correlation with a correlation
coefficient greater than 0.999. An increase in
uncertainty of the parameter estimates with increased
immersion time was observed in this case, as with the
reverse pulses, but even at 60 seconds the correlation
was significant at the 99X confidence level. The
resulting curves are shown in Figure 43. A comparison of
the linear regression results in Table X III shows a much
more definitive correlation associated with the
"conductance" or "I-V" slope derived from the
positive-going pulses than with that obtained from the
negative-going pulses.

1 0 6
Measurements with single pulseThe original BICON technique of miasuring current
at the end of the reverse pulse of a single bipolar
pulse waveform was used to examine the correlation
between I and log CF—], The measured current as a
function of concentration can be seen in Figure 44 for
pulse heights of -2000 mV and -200 mV. The
corresponding linear regression data in Table XIV show a
significant relationship between current for the
-2000 mV pulse at 2 sec and 60 sec following the
standard addition. The slope for the measurement at
60 sec however, is not significantly different from zero
based on a t test at the 957( confidence level. As with
the above I-V experiments, the uncertainty increases for
longer immersion times.
The cell current was also measured at the end of
the positive-going pulse, and again, looking at the
above I-V results, i t is not surprising that the forward
currents provided similar results with lower
uncertainties. These results are illustrated both
graphically (Figure 45) and numerically (Table XIV).
The regression results indicated a correlation between
current and concentration. Once again the 60 second
measurements are of lower precision, but even so, a
significant correlation and a non-zero slope were
obtained at pulse heights of +2000 mV and +200 mV for
ntM unnint* at 2 ucondt and 60 seconds.
Anal v ia of Variance
Using a one-way analysis of variance (Table XV)f
the standard deviation for the method was estimated to
be S.9 pA using the ±2000 mV pulse and 0.6 pA with the
+200 mV pulse. These two values correspond to 3X of th
fu ll scale A/D range that was used. The estimated
standard deviation for the -200 mV pulse current was
significantly larger at 2.4 pA or 12X of the A/D range.
The comparison of the variance between columns
(concentrations) and the variance within columns
(replicates) showed that there was a significant
difference between concentrations. Comparison of the
column averages showed a consistently Increasing
magnitude with concentration for a ll except the
-200 mV measurements, in agreement with the linear
regression results. Similar examination of the I-V
slopes also demonstrated a significant, positive
variation with fluoride concentration. The standard
deviation for slopes obtained using the positive pulses
was 84 microsiemens (r.s .d . “ 0.05X). The standard
deviation for slopes obtained using the negative pulses
was 160 microsiemens, corresponding to a relative
standard deviation of 0.9X. Again, there was a
significant, consistently positive trend with fluoride

1 0 8
concentration, » expected -from the linear regreeeion
results.
Fulse-FT Admittance
lo w e rs !o n P ro c e d u re
Admittance measurements were made by pulse-Fourier
trans-formation immediately following the transfer of the
equilibrated electrode from fluoride free TXSAB to
solutions containing between lO-7 and 10~* M fluoride.
Several additional measurements were made between
immersions, and also after potent!ometric equilibrium
had been achieved. The observed frequency range was
limited to two decades, S00 Hz to 90 kHz. Because the
goal in these experiments was to observe the admittance
behavior in the time between immersion and the
establishment of a potentlometric steady state, i t was
necessary to make rapid measurements. Consequently, the
use of multiple observation periods to increase the
frequency range was not feasible.
The results were similar to those obtained by the
frequency sweep method of Brand and Rechnitz CUD. The
electrode exhibited characteristics of a parallel RC
network at a ll observed concentrations and times. A
plot of Impedance in the complex plane was semicircular
except at lower frequencies, where i t was typical of a
constant phase element such as a Warburg impedance
(Figures 46 and 47). The data at higher frequencies,

109
above about 13 kHz, also ihomwd deviations from ideal RC
behavior) but, based on the results in earlier sections,
this Mas attributed to instrumental arti-facts. Values
o-f parallel resistance (R„>, capacitance <C„) and series
resistance (R.) Mere calculated -for the equivalent
circuit in Figure 4Ba, using an iterative least squares
procedure. These are given in Table XVI. Only
frequencies between 3300 Hz and 11500 Hz were used to
f i t the model because of the above mentioned deviations
st frequencies outside this range. The comparable
values of Brand and Rechnitz Mere based on the
equivalent circuit in Figure 48b, using a high frequency
limiting value of Z to obtain C*,.
Standard Addition Procedure
The behavior of conductance, G * Re(Y), as a
function of frequency for the Standard Addition <SA)
method is shown in Figure 49. These curves, averages of
four spectra at each concentration, show soncMhat
greater electrode conductance in higher fluoride
concentrations at lower frequencies. At frequencies
above about 10 kHz however, such a systematic variation
in conductance is not apparent. Results for the linear
regression of G on log CF'3 are given in Table XVII for
frequencies of 500 Hz, 3500 Hz, 7500 Hz and 10500 Hz.
These frequencies correspond to three distinct regions
of the complex impedance planet the low frequency

110
"constant phase" region (500 Hz) v the "transition"
region (3500 Hz) and the higher -frequency "RC" region
<7500 Hz, 10500 Hz). At 500 Hz and 3500 Hz, linear
regression analysis showed a high correlation between
G and log CF’ 1, significant at the 95% confidence level.
On the other hand, at 7500 Hz and 10500 Hz, no such
correlation could be identified.
When the results of the "immersion" experiment were
similarly treated, the results showed no significant
linear correlation at any frequency. This is shown in
Table XVIII. Although the linear regression results did
not show a significant correlation, i t seemed apparent
from the graphs of the data that there was an upward
trend in conductance with fluoride concentration
(Figure 50).
Analysis of Variance
One-way analysis of variance (AN0VA) was applied to
the results of the two methods in order to determine if
significant differences in electrode conductance were
present in different solutions. A difference between
the results at various experimental levels (e.g.
different fluoride concentrations) is suggested i f the
variance between levels is significantly greater than
the variance within levels. As can be seen in
Table XIX, the differences between concentrations for
the 8A method do in fact seem to be significant, even at

1 1 1
the 99% confidence level. Only the reeults at the
highest frequency tested, 10.3 kHz, yield an F ratio
below the c ritica l value of S.9S. As mentioned earlier,
the data above about 10 kHz may be distorted by
instrumental response characteristics. Given these
results in conjunction with the preceding linear
regression results, i t seems reasonable that some
positive correlation exists between conductance and
concentration in this experiment, although the
relationship may not be s tric tly linear. The mean sum
of squares within columns (8SC) provides an estimate for
the variance due to the method. Thus, the standard
deviation for this method was about 0.1 to 0.2
microsiemens. This corresponds to r.s .d . ■= 0.2%. I t
must be stressed that these ANOVA results apply only to
the SA experiments performed here, in which there is no
movement of the electrode between solutions, and serial
concentration increases are made instead by addition of
known quantities of a standard solution. The replicate
measurements are separate admittance measurements made
In the same stirred solution at 2, 10, IS, and 20
seconds after injection of the standard. This is
analogous to the method used by Powley and Nieman with
the BICON technique. Because no movement of the
electrode occurs between successive spectra, the r.s .d .
1 12
obtained in the BA experiments Is probably a lower lim it
for the pulse-FT technique implemented here. The
0.2% r.s .d . found here Is the same as was found in the
preceding dummy cell measurements. I t is interesting
that 0.2% is smaller than the A/D resolution of the
original measurements, which was no better than 1 part
in 256 or 0.4%. Also, as would be expected on the basis
of preceding semiconductor and dummy cell experiments,
the r.s .d . does not Increase significantly over the
f irs t twenty harmonics of the spectrum.
ANOVA results for the immersion method reinforced
the linear regression results, clearly showing no
significant difference in electrode conductance when
immersed in 10“= li end lO"'7' ri fluoride solutions.
Electrode conductance in fluoride free solutions was
found to vary over a range of about 5% among replicates.
An attempt to compensate for this was made by
subtracting blank values from the conductance obtained
in the succeeding fluoride solutions. The differences
between concentrations were found to be insignificant,
both in a direct comparison of conductance values and in
a comparison of conductances with blank values
subtracted. Because the immersion method, unlike the SA
method, required a physical transfer of the electrodes
between a fluoride free solution and a fluoride
containing solution, poorer precision for measured

1 13
valuu was s k pactad. This m s s in fact th» csss. Ths
stsndsrd dsvistion -for ths immsrsion sxpsrimsnts m s s in
ths 2 - 4 microslamans rang* (r.s .d . <■ 2.S - 3X),
roughly sn ordsr o-f magnituds lsrgsr thsn ths stsndsrd
dsvistion -for ths BA a s thod.
Whan slsctrods admittanca m s s msssursd undsr mors
convsntionsl conditions, i.s . st potantlomstrlc
squilibrium, ths slsctrods conductsncs m s s sgsin -found
to bs insignificsntly affactad by fluorids
concsntrstion. Stsndsrd dsvistions Msrs ssssntislly ths
sain* for ths prsvious immsrsion msthod and sgsin did not
vsry with frsqusncy up to 10.5 kHz. Ths prscision of
ths thrss diffsrsnt nsasursmsnt procsdurss — stsndsrd
addition, immsrsion and potsntiomstric squilibrium - srs
summsrizsd in Tsbls XX.
Conclusions
It is quits intsrssting that currsnt msasursmsnts
on ths rsvsrss pulss of ths ±200 mV bipolar pulss pair
showsd a similar rssult to Powlsy and Nismani in it ia lly
incrsasing with fluorids concsntration and thsn
dscrsssing with furthsr additions in fluorids. In
contrast, largsr pulsss and ths currsnt on ths forward
(posltivs) pulss of ths ±200 mV pair showsd a monotonic
incrsass with fluorids concsntration. 0ns striking fact
was that consistsntly highsr uncsrtaintiss wars
assoc1 atsd with rssults from ths nsgativs-golng pulsss.

1 1 4
This wss tru i for both ths dirsct currsnt miiursmsnti
and ths ''conductancs" calculstsd -from ths I-V curvss.
Ths rssults from BICON jnaasuramants ssss to show s
dafinits tsndsncy to incrssss with fluorids
concsntration* sspscially for largs pulsss. Prsvious
studiss havs not shown howavar* whsthsr this incrsass is
caussd by lncrsasing fluorids concsntration or by mars
coincidsncs. Ths rssult could bs dus to tampsratura
changa, sines nsithsr this nor prsvious work usad
tharmostattad callsf or to d rift* which is
charictsristic of ths fluorids slsctrods* both in
potsntiomstric and conductomatric usa C14D.
Ons point that must bs strsssad is that ths BICON
maasursd conductancs is sursly not conductancs in ths
ordinary sansa* as usad to discuss alactrochainical
calls. Elactrochamical calls ara not slsctrical
circuits compossd of linaar alamantsf squivalsnt
circuits ara only modsls. Ths application of pulsss as
largs as +200 mV* and cartainly thoss on ths ordsr of
volts* cannot bs discusssd in tarns of squivalsnt
circuit ffiodsls for aquillbrium conditions. Ths fact
that ths BICDN conductancs varias with concsntration
rathar than activity* as was pointsd out sarlisr C151,
indicatas a currsnt controllad by mass transport.
Corrasponding FT impsdancs data show a similar
incrsass in conductancs with fluorids concsntration whan

11 5
the standard addition method is used. Ths observed
change occurs only in ths 500 to 3500 Hz region, which
is associated with the "constant phase" portion of the
spectrum. This region corresponds to slower processes
in a hydrolyzed surface film C ll,16 ,173. According to
Brand and Rechnitz, the semicircle representing these
processes extends down into
sub—Hertz frequencies. Hence, only the higher frequency
portion is visible in the present data and the
semicircular behavior is not seen.
The fact that a solution—dependent change in
electrode conductance occurs in a surface film is not
surprising; apparent surface resistance coinciding with
long time constants ( i.e . low frequencies) have been
attributed to mass transport limitations in the film
C183.
The disappearance of any apparent concentration
dependence when immersion or equilibrium measurements
were made suggests that the above conductance changes
were in some way connected with the standard addition
procedure. On the other hand, the increased uncertainty
may simply mask very small changes; the standard
deviation for the la tter two methods was more than an
order of magnitude greater than that for the standard
addition procedure.

1 1 6
Although not so -for equilibrium mtuurmntnts,
adfliittsnem quadrature data Mire very erratic for tha
immersion and standard addition mathods. In fact, in no
casa was thara any discarnabla ralationship between
quadratura and concmtration. I t is intarasting that
vary unusual nagativa inductanca-1ika bahavior of tha
quadratura was obsarvad in situations whara ona would
expect mass transport to ba occurring! that is , during
tha aarly moments aftar a changa in fluoride
concentration. Variability in tha quadratura may
reflect the reaction of an extremely sensitive indicator
to tha d ifficu lties of reproducing surface conditions at
tha electrode surface C19I.
In conclusion, i t does not seem very like ly that
conductometric use of tha fluoride electrode w ill soon,
i f aver, ba a useful quantitative technique!
nevertheless, i t might wall prove worthwhile to pursue
further tha nature of the capacitive current response in
this regard.

TABLE I I I
ttpti-Schottkv RMUltB via A.C. and Fulss-FT Tschniouss
s. c.FT #1•300 Hz FT #2
slop»(xl03*<^F)-*v> 0.81 1.05 1 .05Std. m r r o r 0.050 0.042 0.055
V«.„ (V vs. SCE) -3.5 -2. 1 -1.9Std. trror 0.21 0.09 O. 11
No <x 10~ *"cm3) 7. 1 5.4 5.4Std. error 0.44 0.22 0.28

1 1 8
TABLE IV
L io «r R»qcai»ian_gf V.**» on Solution pH
Slop* t —0.039 V/pH unit y—intorcopti —1.2 V v t. SCE
•td . » rr .i 0.080 std. trror ■ 0.36
r s 0.311

1 1 9
TABLE V
Pul•■-FT Rnsults for Known Rnslstancss Using lOO HTwonici
R (ohii) 20 200 2000
Htdlan 20.3 197 1986
Maan 20. 1 196 1960
Std. Error O • m 7 SO
Rsl. Std. Err. AX AX 2X
TABLE VI
Pul**—FT Rssuits for Known Ri Using 20 Harnonics
R Cohns) 20 200 2000
Haan 20.0 196. B 198S
Std. Error O. 1 0.7 4
Rsl. Std. Err. 0.3X 0.4X 0.2%

1 2 0
TABLE VII
E f f e c t o f H arm onic Number on M easured R e s is ta n c e f o r D i f f e r e n t R e l t t i v t P u ls e L e n g th s
HerMonies 20X pulsm 30X pulsm 40X pulsm
01 100.5 (0.2) ioo. b (0.3) 99.B (0.4)
11-20 lOO. 1 (0.4) 99.5 (0.6) lOl. 1 (0.5)
21-30 101.4 (0.6) 100.0 (0.8) 100.4 (l.B)
31-40 101.B (1.2) 100.4 (4. 1) 98. 3 (1.0)
41-50 100.6 (0.9) 101.7 (1.4) 97.6 (1.3)
FundaMnt«l«10 Hz* data in ohms, std. error in parentheses

1 2 1
TABLE V III
Numbsr pf Data Point* hors Than 4r From ths Hsdlan o-f First 100 Hiriontci
Harmonics 20% pulss 30% pulss 40% pulss
1-10 2 O 0
11-20 2 1 1
21-30 1 1 2
31-40 2 6 1
41-30 1 1 O
31-60 3 3 1
61-70 3 6 3
71—BO 8 B 3
Bl-90 5 4 2
91-100 6 6 7
TOTAL 35 38 22
Fundam*ntal«10 Hz

1 2 2
TABLE IX
E x p e r im e n ta l ly D t t t r m l n t d V i l u w f o r Known CM i c i t a n o *
ftjtltlfztfiHiSiiinittiii
Capacitance Experimental Value (± r.e .e .)
A 0.022 pF 0.0222 pF ±0,3%
B 0.03 0.032 ±0.4%
C O. 10 O. lOl ±0.4%
D 0.47 0.48 ±1.67.
E 1.0 1.0 ±0.4%
*RC w r ite , R»99.5 for *11

1 2 3
TABLE X
Linear Regression E itiiw tt i for Correlation B«twwn F.T. and a .c. Techniques
Magnitude Phase
Slop* 1.007 1.012std. error 0.0049 O.OOB1
Y-int*rc*pt 2. K 10—* 0.9■td. m r r o r 2.9 k lO—• 1.6
r 0.9992996 O.9983BS5

1 2 4
TABLE XI
Llnwr Rtartiilon E it l—t« i of I-V SIopss
sol/L F~ 1 blank io-^ *■* O 1 ► io-« to-*
t<2 ssc.
slop* (pS) std. srror
1B4.30.36
109. 60.30
1B6.00.29
186. 1 0.27
1B6.S0.30
t»AO ssc.
slops (pS> std. srror
1B4.60.29
1B9.70.31
1B5.70.27
186.40.28
1B6.40.31
TABLE XII
U nw r R*flr«ittloa E A tlm tu of I-.V Sloon
sol/L F~ blank io-^ 0 1 * io— io-*
t<2 ssc.
slops (pS> std. srror
172.9 O. 16
173. B O. 10
174. 1 O. 15
174.4 0. 19
174.7 O. 14
t«60 ssc.
slops (pS) std. srror
172.9 0. 13
173.9 O. 16
174.3 O. 13
174.3 0. 19
174.8 0. 11
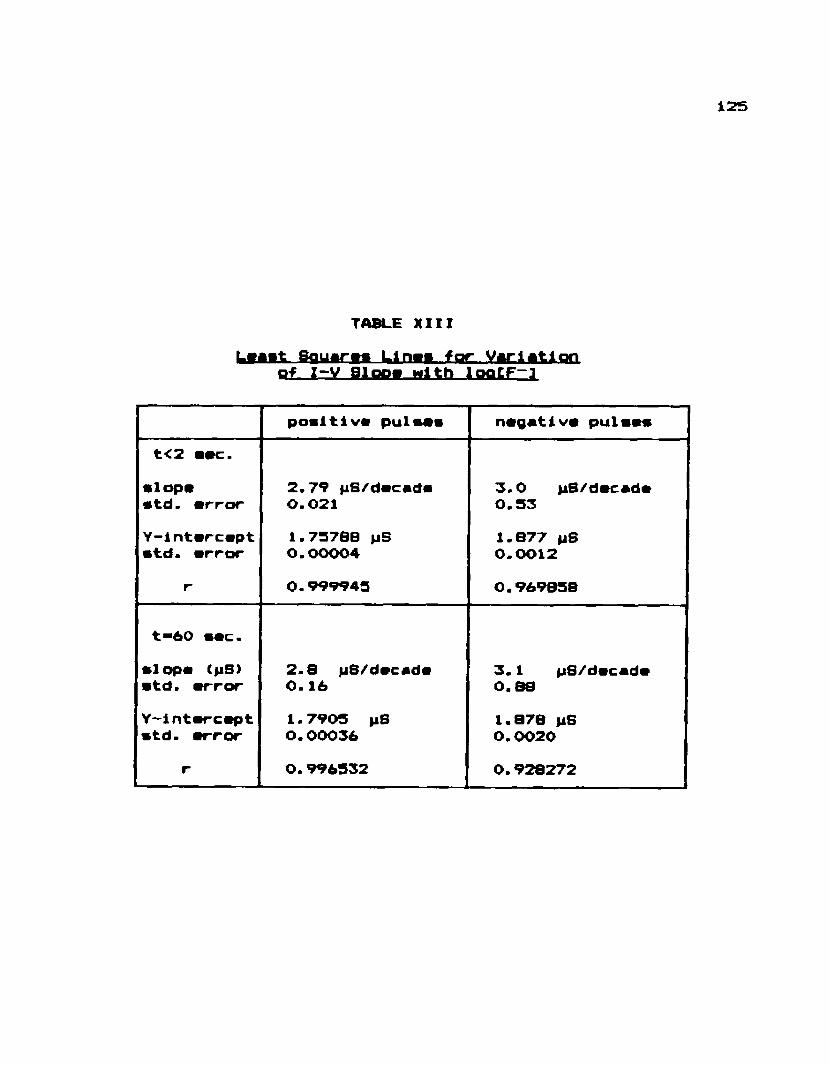
1 2 5
TABLE X III
L * * s t B f lU i r n L ln * » f o r V a r ia t io n o f I - V S lo o « w ith I o q C F - 3
posltlv* pulB*B
t<2 MC.
•lop*■td. m r r o r
2.79 pS/d*c«ds 0.021
3*0 pB/d*csd* 0.53
Y-int*rc*pt std. srror
1.7578B pS 0.00004
1.877 pS 0.0012
r 0.999945 0.969058
t*60 s*c.
Slop* (jlS) •td . srror
2.8 p8/d*c«d* 0. 16
3. 1 pS/d*c«d* 0.88
Y-int*rc*pt std. *rror
1.7905 p8 O.00036
1.878 p8 0.0020
r O.996532 0.928272

126
TABLE XIV
V a r ia t io n o f C u r re n t w ith LPGCF~3 u s in g S in o ls B ip o la r P u l w
-200 nV -2000 fflV +200 aV +2000 aV
t<2 ate.
slops(pA/dscads) std. srror
-0.080.029
-0.4 0. 15
0.200.031
0.480.056
Y—intsrespt CpA)
std. srror38.40.07
39083
35.90.07
353. O. 1
r 0.888313 O.B79403 0.976115 0.9865005
t"iO S S C .
slops(pA/dscads> std. srror
-O. 08 0.038
-0.6 O. 15
O. 19 0.035
0.6 O. 14
Y-intsrespt <pA>
std. srror38.40.08
390B7
35.90.08
354.0.3
r 0.822141 O.947670 0.968640 O.9486600

1 2 7
TABLE XV
Sample One Wav ANOVA Table for Comparing Measured Current at Different Fluoride L tv tlt
levelsi 10-TM 1 0 -
34. 02Day la 34.33 34.66 33. 14
34. B8Day lb 34.39 35. 17
33.34 33.72Day 2a 36.22
Day 2b 35.7235.60
MSSNt 16 d.f
TSSi B687 13
SSci 6682 3 2894 8011
88m i 12 0.33
O. 6 |iAEstimated std. dev. for method
"Data are in yiAmpsy Pulse " +200 mV

1 2 B
TABLE XVI
E q u iv a le n t C i r c u i t E l t i t n t i f o r F lu o r id a E la c t r o d a
&. Ik fli C*. tiiF) B- (ka>i n i U ± i0 M F- 2.70 9.05 X 10-* 5.81 x 10~'r M 2. 90 8.23 X io -» 5.91 x IO-* M 3.35 7.36 X io -* 6.0
JttSBQdftO M F~ 2. 84 9.0 X io~* 5.8I x 1 0 -* ri 3.06 8 . 1 X io -* 5.91 x lO—* M 2.98 7. 1 X io-=» 6.0
Brand <■ Raehnitz <1970?
a ll conc’ni 5 6 x 10“ 3 6

129
TABLE XVII
Raaraamlon R«iult« for Std. Addition Hathod
Slopa<pS/dacada>
Y-intarcapt<MS>
r
500 Hz
3500 Hz
7500 Hz
10500 Hz
0.33 1 0.040
0.42 ± O.080
0.25 ± 0.052
O.1 ±0.14
76.5 ± 0 .11
84.e ± O.18
81.7 ± 0.23
79.2 ± 0.32
O.97754
O.96543
0.78615
O.29678
rangn mrm ±1 »td. m r r o rd.f.»2 r =».9SO at 95X confidanca laval
TABLE XVIII
Raaraaalon Ramulta for Iamaralon Hathod
■FraquancySlopa
(pB/dacada)Y-lntarcapt
Cp8>r
500 Hz
3500 Hz
7500 Hz
10500 Hz
0.3 ± 0.24
0.6 ± 0.44
0.5 ± 0.39
0.6 ± 0.20
104.3 ± 0.52
115.0 1 0.92
125.6 ± 0.87
166. ± 1.9
0.6622
O.6935
O.6443
0.8865
angaa mrm ±1 std. arror.*.■2 r c«.950 at 957C confidanca laval

130
TABLE X IX
A r r i v a l s o f Var_l anca R a s u lts f o r th a S t i n d T d A d d it io n P ro c a d u ra *
c* batwaan cols.<df-12>
a* Mithin cols.(df*3> F*»
ast. v for mathod
500 Hz 0.7695 O.03072 25. 1 O.IB pS
3500 Hz 1.5720 O.011B4 124.4 0.11 pS
7500 Hz 0.5304 0.03791 14.0 O.19 pS
10.5 kHz 0.3001 0.06630 4.5 0.26 pS
" corrnpondi to data In pS "^critical vain* la 5.95 t 95X confidanca laval
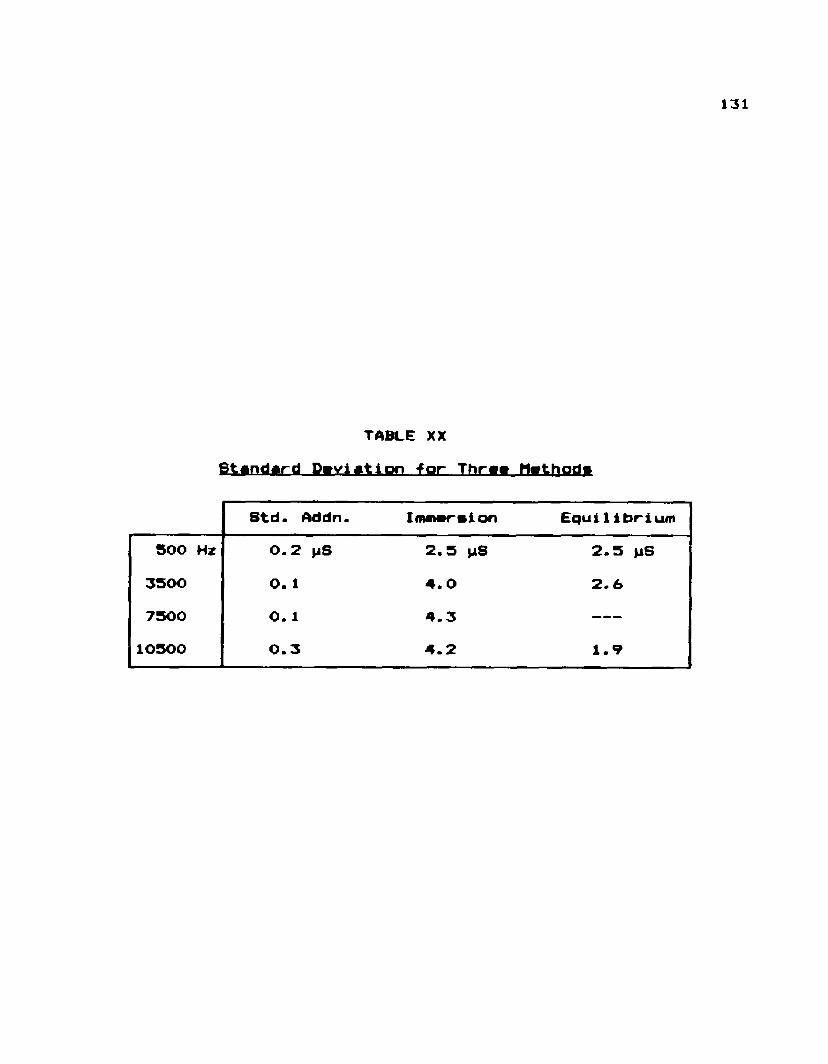
1 3 1
TABLE XX
S ta n d a rd D e v i a t i on f o r T h r« » h « th o d »
Std. Addn. IffMMrsion Equl11brium
500 Hz 0 . 2 >jS 2.5 pS 2.5 tiS
3500 O. 1 4.0 2 . 6
7500 O. 1 4.3 ------
10500 0.3 4.2 1.9

Figure 19: Magnitude spectra of experimental pulsewidths of 207., 307. and 407..
SCI

( a )
i?EB9I
1
OJ
04 -
0.7 -
0.S -
0.9
0*4 -
O J -
OJ -
o.t -
0
2 0 * puIm
□
□ Q
° ° ° ° 7 ° ° ° ° r ° ° ° Q- n n oyP°°flQn0°qynBBnoBnnn)20
Hvirwnto numlMr
40
-13
3

*
2IIIe
( b )
1
0.9
04 H
0,7
0.9 -
0 4 -
04
04 -
04 -
0.1 -
30 % putw
JJ ° a OP ° ° n a ° P n 0 D rTD O nrl 0 a r ,ai20
Harmonto numbvr
OnotpOonQngnnyji40
13
4
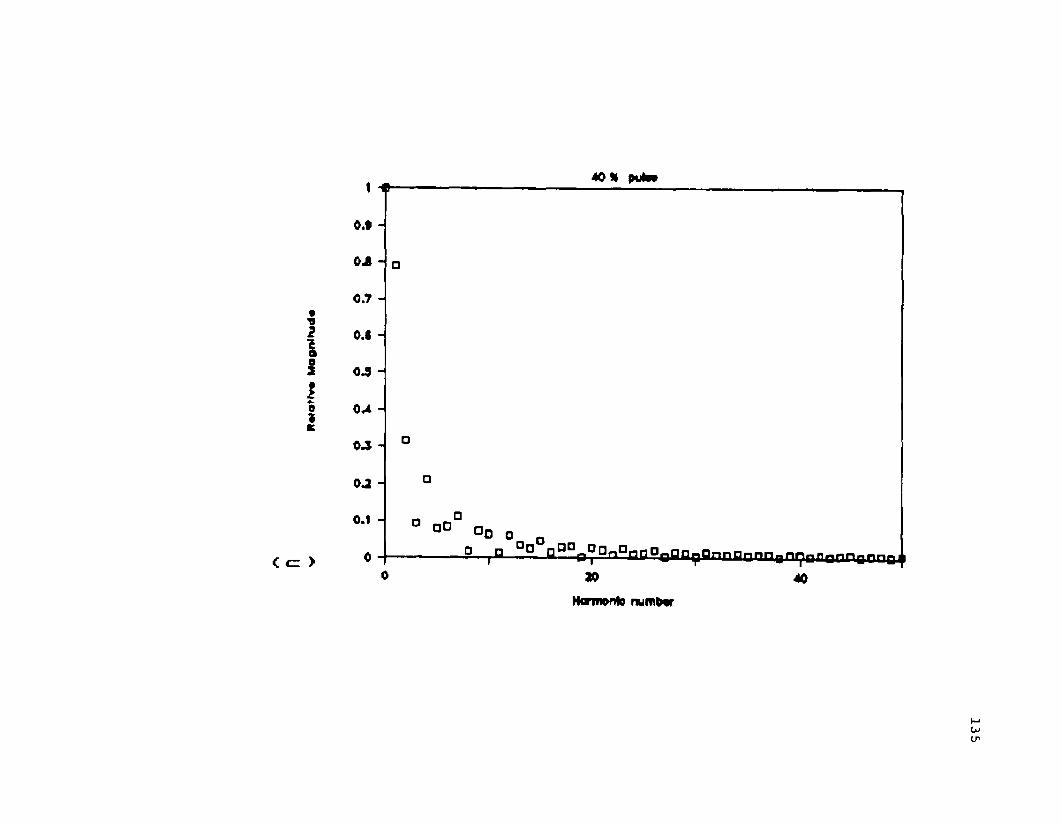
40X pula*
*v2II I*-oK
pfl— - fl— o° anoaBooB0?annBnnnBn9nflonngnnBii
Ntr iivnto numbar
13
5

Figure 19i No s 10- i*
Total admittance of n-TiO* crystal No. 1, Total frequency range covered by twocm
measurements having T, respectively.
0.1 sec and 0.001 sec
o . j s -
0.25 -
0.15 -
0.05 -
CrystalAdmittance
log(f)a magnitude + quodrotur* o In-ptia**

0.001
Crystal IIAdmittance
0.0009 -
0.0006 -
0.0007 -
0.0006 -
iE 0.0005 -
50.0004 -
0.0003 -
0.0002 -
00001 -
1 2 3 4 5
tofl(l)□ magnitude + quodrotur* o In-phase
Figure 20: Total admittance of n-TiO» crystal No. 2having a much lower donor density than crystal No. 1.
137

tEi
C rysta l IAdmtttanc*
□ megrtlfud*M O
+ quadrature
138
* h-ghat*
Figures 21,22i Log-i.og plots of n-TiO» sdsittsncs
f
C rys ta l IIA d fn H to rv c *
oo
542
□ magnitudetoflO)
quadrature 4 In-pfca**

Re(Y)/ lm (Y)FT m2 m u l t a
0.9 -
o.a -
0.7 -
QO0.6 -
0.5 - On
0.4 -
□o0.3 -
oo0.2 -
0 100 200 300 400 500
frtquetey (Hz)
Figure 23: Cot 0 vs frequency for n-TiO* crystal No. 1showing significant in-phase component at frequencies below 1 kHz.
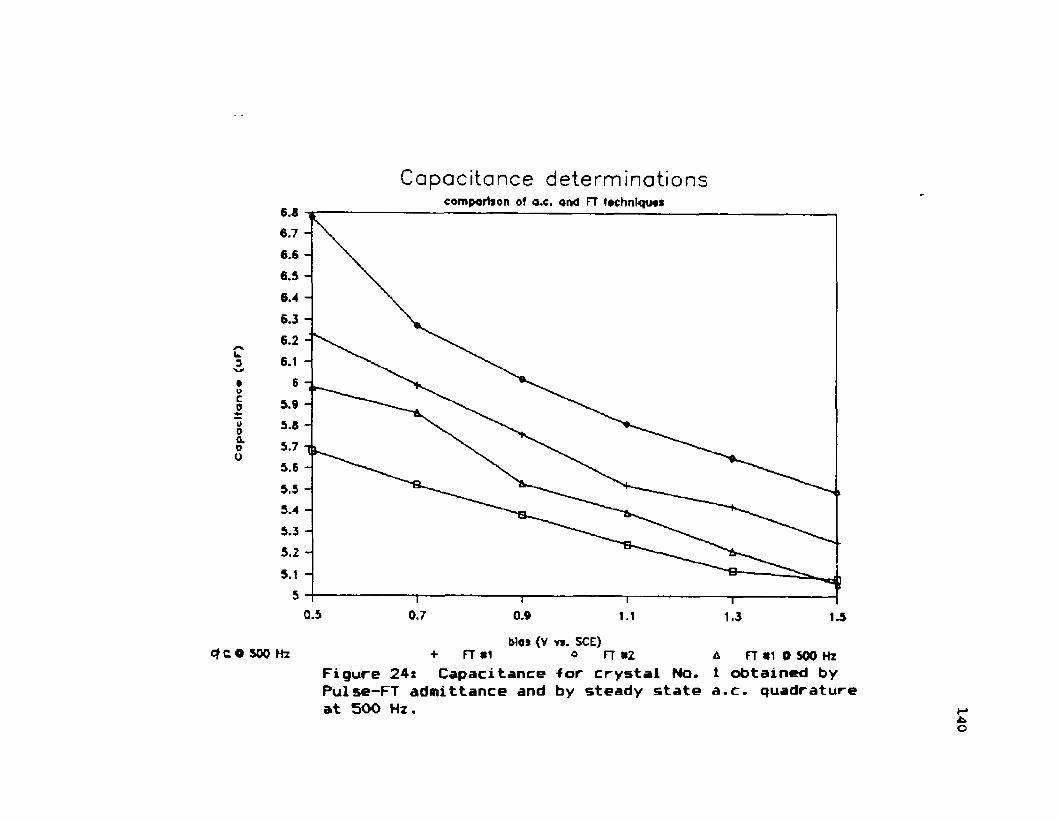
Copocltonc*
(uF
)
Capacitance determ inationscom pari* on of a.c. and FT tochntquos
6.6 -
6.7 -
6.6 -
6.5 -
6.4 -
6.3 -
6.2 -
5.9 -
5.8 -
5.7
5.6 -
5.5 -
5.4 -
5.3 -
5.2 -
0.5 0.7 0.9 1.1 1.3
bios {V v*. SCE)4 C O 500 Hz + FT #1 O F T * 2 A FT 11 O S00 Hi
Figure 24: Capacitance -for crystal No. 1 obtained byPulse-FT admittance and by steady state a.c. quadrature at 500 Hz. 1
40

FT re
sult
141
F T / l «i. oc O SOOHr6.5
6.2
5.9 -
5.5 -
5.3
5.85 5 4
oc result
FT §2 v«. oc O SOOHr6.5
6.4
6.3
6.216
5.9
5.8
5.6
5.5
5.4
5.3
5.2
55 85.4
Oc r e s u l t
Figure 25t Correlation plots of two FT measurements vs a.c. quadrature measurement at SOO Hz for several potentials. Solid line is least squares -fit showing approximately 10% proportional error.

c\
Mott Schottky plotseompariton of o.c. on<> FT ttchnlqiMt
0.0390.0380.0370.0360.0330.0340.0330.0320.031
0.0290.0280.0270.0260.0230.0240.0230.022
bio* (V v* SCE)
1.3
□ o.c. O 300 Hi + FT «1 o FT *2
Figure 26: Mott—Schottky plots -for crystal No. 1,
142
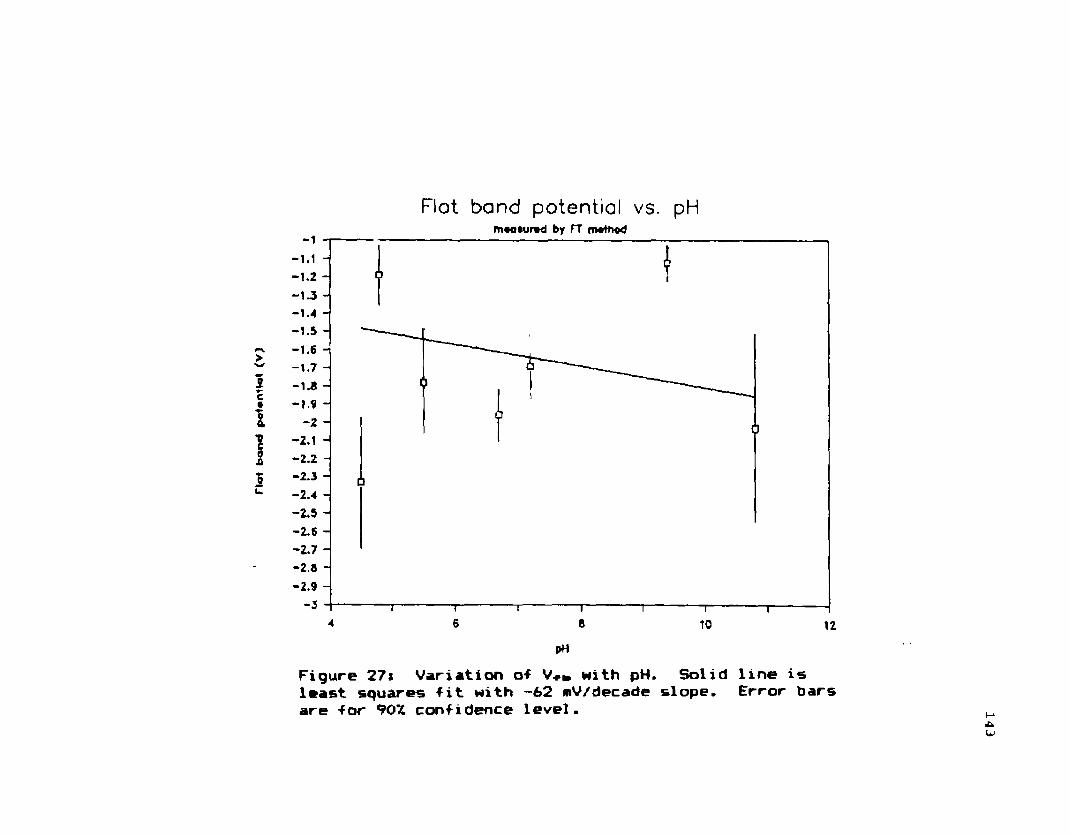
ria
l ba
nd
p«
t*n
tla
l (V
)
-1 -1.1 -1.2 -1 .3 -1 .4 -1 .5
-1.6 -1 .7 -1.8 -1 .9
-2 -2.1 -2.2 -2 .3 -2 .4 -2 .5 -2.6 -2 .7 -2.8 -2 .9
-34 6 8 10 12
PH
Figure 27* Variation of with pH. Solid line isleast squares f i t with -62 mV/decade slope. Error bars are for 90X confidence level.
Flat band potential vs. pHm*atur»d by FT method
14
3

M—S slope vs. pHm«Qtur»d by FT nwthod
0.023 -
0.022 -
0.021 -
0.02 -0.01# -0.018 -
0.017 -
0.016 -
0.015 -
0.013 -
0,012 -0.011 -
0.01 -0.009 -
0.008 -
0.007 -
0.006 -4 6 8 10 12
pH
Figure 28: Mott-Schottky slope ys pH in 0.5M NaxSO*■for crystal No. 1. Error bars are -for 90X confidence level.

1 4 5
rVWV
RefAE
Figure 29i Schematic diagram for dummy cells used to compare FT and a.c. techniques. Analogies with real cell arex AE = auxiliary electrode, Ref * reference electrode, WE * working electrode.
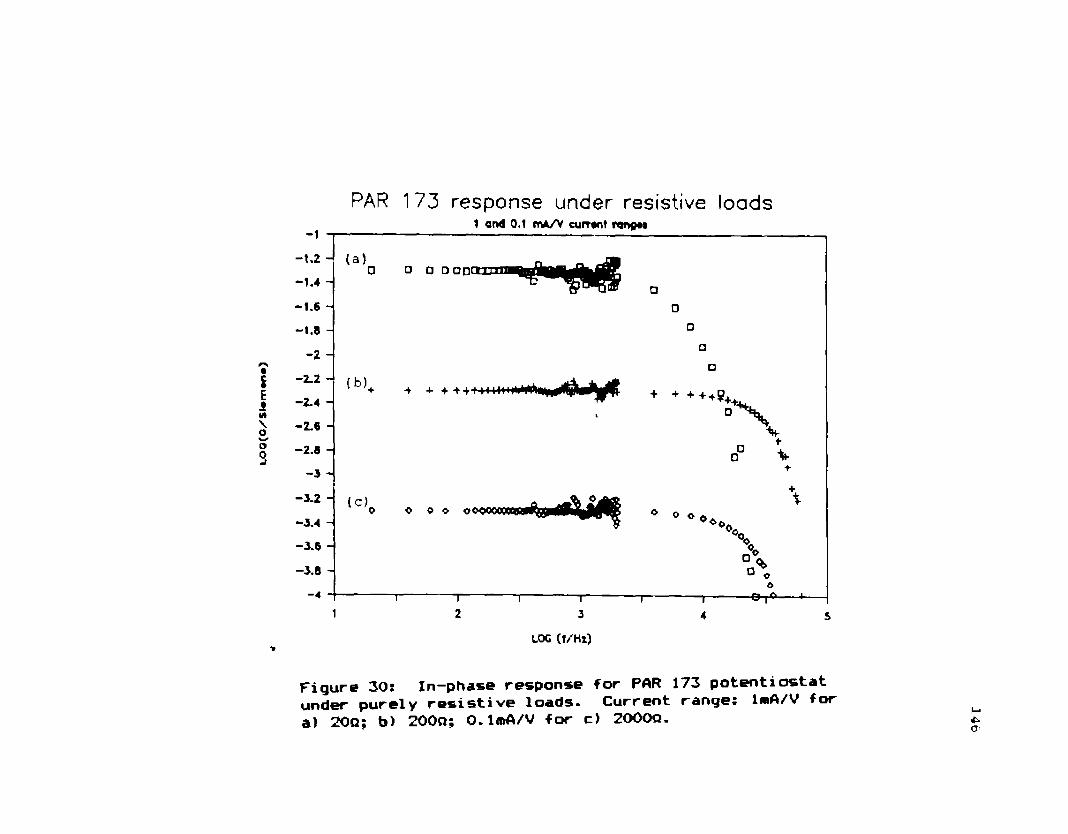
PAR 173 response under resistive loads-1
-1.2
-1 .4
-1.6
-1.8
-2
-2.2
-2 .4
-2.6
-2.8
- 3
-3 .2
-3 .4
-3 .6
-3 .8
1 2 3 4 5
LOG ( f /H l)
1 arid 0.1 rrA/V curr«ot rang«»
la)□ □ O □□□
(b)4 4 4 + 4 4 H
+ ++++e++ “ \
4D 4□ »
4
(c)a a a o o o o
n-------------r“ o o-e-r*-----
Figure 30i In-phase response for PAR 173 potentiostat under purely resistive loads. Current ranges 1*A/V for a) 200; b) 200O; 0 .ImA/V for c) 2000Q.

PAR 173 response under resistive loads-1
-1.2
-1 .4
-1.6
-1.6
-2
-2.2 -2 .4
-2.6
-2.8
-3
-3 .2
-3 .4
-3 .6
-3 .8
1 2 3 4 5
l©g(1/Hz)*, 1mA/V +■ ZOO ohm*, ImA/V © 2000 oh mi. 0.1m A/V
1 mA ond 0.1 mA curront rang**
□ □ a G GQIUS'
+ 4 + + + 4 4 4 4 4 4 + 4 11,1
%
+ + + +++
o o © © o©<>.......... ® © © ©o©
Figure 31: Magnitude response for PAR 173. Currentranges and resistances are the same as for Figure 30.

Cor
vdix
rlof
vc*
(S)
1 4 8
0.020 .0t90.0160.0170.0160.0100.0140.0130.0120.0110.01
0.0090.0060.0070.0060.0030.0040.0030.0020.001
0
Figure 32: 10O ohm resistance measured using pulsewidth of 0.2 T. for T— *= 50 msec and 0.5 msec. Note the occurrence of outliers at every f i f th harmonic and poor precision in the higher harmonics.
100 ohm resistancePW=0.2 To
ftA——iS—fr-j—v
*
A
froquoncy (Hz)

admittance vs. log(f)R=99.5 ; C=0.022 uF
0.01
0.009 -
0.008 -
0.007 -
0.006 -
oo/»90.005 -
0.004 -
0.003 -
0.002 -
0.001 -
3 4.2 4.6 5.85 5.4
Irequancy ( Hz)□ Vi-pftat# o quadrature predktad
Figure 33as Admittance measured by Pulse-FT tor RC series circuit R= 99.5, C = 0.022pF.

Sl*
m*n
«
admittance vs. iog(f)R=99.5 ; C=0.10 uF
0.01
0.009 -
0.008 -
0,007 -
0.006 -
0.005 -
0.004 -
0.003 -
0.002 -
0.001 -
4.23 3.4 4.6 5 5.4 5.8
frequency ( H i)Q 1n-pt>ate o quadrature predicted
Figure 33b: Admittance measured by Pulse-FT for RCseries with R = 99.5, C = 0.10 >iF.

admittance vs. log(f)R=*9.3 ; C=0.50 uF
0.01
0.009 -
0.006 -
0.007 -DO00
0.006 -
0.003 -
0.004 -
0.003 -
0.002 -
0.001
3 3.4 4.2 4.6 3 5.4
frequency ( Hz)□ ln-pho*« ° quadrature predict ad
Figure 33c: Admittance measured by Pulse-FT for RCseries R = 99.5, C =* 0.50 pF.

Im(Y) vs. log(f)To-.01 m o ; RPW=20*
0.01
0.009 -
o.ooa -
0.007 -
0.006 -
0.005 -
0.004 -
0.005 -
0.002 -
0.001 -
5.2 3.62.4 2.5 4.42 4
tofl(f)O .022 F o 0.1 F x .4,7 F ------- th*orr
Figure 34: Admittance quadrature and expected values■for three RC circuits. R = 99.5.

B»(
Y)
0.01
0.002 -
0.001
Re(Y) vs. log(f)To=.01 *•«: RPW=2Q*
0.009 -
0.006 -
0.007 -
0.006 -
0.000
0.004 -
0.003 -
□ 0.022 F o 0.1 F x 0.47 F -----
Figure 35:In-phase admittance corresponding to Figure 34.
—I-----4.4
th««ry
tsi

l i>4
1.
10 10 10
Figure 36i Effect of potenti ostat i c instebility on V^/V«, where V« is the externally applied voltage and Vr is the potential vs. reference actually applied to the working electrode. (From reference 8)

Figure 37: Ratio of measured to calculated admittancemagnitude for three RC circuits. The cresting nature becomes problematic at lower frequencies as C is increased.

rati
o
Ratio of JYIm to lYlcTo=1 m««o ; t=.2 m**c ; 10 mA/V
1.5
1.5 -
1.2 -
0.9 -
0.7 -
0.6 -
0,5 - - 5 5.4 4.2 5
a 0.022 uF f

ratfa
Ratio of iYlm to lYlcTo=t m»*c ; 1*.2 m »o : 10 mA/V
1.5
d0*oo<>00
0.9 H
0.8 -
0 .7 -
0.6 -
0.53 5 5.4
o o.10 uF f
Vi

rati
o
Ratio of lYlm to lYlcTo*1 rm*c ; rraoc ; 10 mA/V
ft ft >4
< <= >
k>o(f/Kij) 0.5 uF
851

FT resu ltsAAnllfance mo^Wtude
0.026 ~r
0.024 -
0-022 -
0.02 -
0.018 -
0.016 -
0.014 -
0.012 -
0.01 -
0.008 -
0.006 -
0.004 -
0.002 -
0 -- 0
+
Figure 38: Admittance magnitudes for several RCcircuits with the PAR 273 potentiostat measured by Pulse-FT. R = 99.5 for all.
0 + + +■
’ ♦ ♦ ♦
° # O ° J * I I■!..xJ L y KJ.& i - i M * S i h ^
□
o *□
□
+6
□□
O+
&
a□
+ □a
+a ° ° r 1---- 1---- r----i---- 1---- 1---- 1---- 1---- 1---- r
20 40 60 80 100(Thau>an<W)Frequency (M i)
O jO S y F O O .IO O y F A O A O Q y F
120
X 1^
6<,
I

ITI
(ilt
mtn
i)
a.c. steady state resultsAdtnfttim c* mopnJhxi*
0.026
0.024 -
0.022 -
0.018 -
0.01* -
0.014 -
0.012 -
0.01 -
0.008 -
b.004 -
0.002 -
200 40 «0 80 100(ntoumdi)
Fr»qu***cy (H i)+ OjOSO uF 0 0.10 uF A 0 3 0 uF X 1 3 uF
Figure 39: Admittance magnitudes for several RCcircuits with the PAR 273 steady state a.c. measured with a digital oscilloscope. Circuits are the same as for Figure 38.
160

161Correlation of F.T. vs. a.c.
nagAud)
8, OlOM -t* OjO II -I*I►k
tuns -
0m o^# ud» (S « T W ^
Figure 40i Correlation plots for Pulse-FT measured magnitude and phase versus steady state a.c. results.
Correlation F.T. vs. a.c. Technique
too
*t -
■o -
so-
to0 10 K>u (jiyw)

Figure 41s ti) Si*igle—pulse BICON orii.(b) Diminishing amplitude pulse sequence.
O'K'

PAR273 wovvform for vlngb pub* 9IC0N
t
2T*9 10
flm* (mMwconda)

r«la
tlv«
pula
* M
gh
l
14
14
1
04
0 4
0 4
0J
0
-04
-04
-0.8
- 0 4
-1
- 1 4
- 1 40 1 4 8 0 10
flma (mlNMCondi)
PAR273 wwoform for mulll-pulM BCOM

"e*n
du
e*«
ne
*"
(mS
)
Conductance vs. log([F~])cokulaM from nvpoHw* l/F cumw
-0.1
-0.1 MT H
-0.1 M2 -I
-0.1 M 3
-0,1 M 4 H
-0 .1 M S H
-0.1
-0.1 M 7 4
-0,1
-0 .1 M S
—7.9 -4 .9
»«oflPVM)□ 1*2 Nt. + f-«0 MC.
Figure 42* 81 CON conductance calculated -fro* I-V slopes for negative-going pulses at t = 2 and t = 60 seconds. Solid line is linear regression estimate for both times.
<591

cand
uclo
ne•"
(mS)
Conductance vs. log([F ] )<;a4cv»lat«d from l/E curvm
-0 .1 7 3 8
-0 .1739 -
-0 .174 -
-0.1741 -
-0 .1742 -
-0 .1743 -
-0.1 748 -
-0 .1 7 4 * -
-0 .1747 -
-7 .5 - 6 .S -5 .5 -4 .5 -3 .5
to on/u)0 1V2 MC. + to*0 M«.
Figure 43: BIC0N conductance calculated from I-Vslopes for positive-going pulses t = 2 and t = 60 seconds.

(m*)
0.003
0.0023
0.002
0.0013
0.001
0.0003
0
-0 .0005
- 0.001
-7 .3 -6 .3 -5 .3 -4 .5 -3 .3
lopflTVM)D -20 0 mV pu ln O -2000 mV puls*
Figure 44: Current on reverse (negative-going) pulse•for bipolar pulse pairs of +200 mV and +2000 mV.
current vs. log([F j / M )n«gotfv« pulMV
l yr

curr
ent
(rrvA)
0
- 0.0002
-0.0004
-0.0006
-0.0000
- 0.001
- 0.0012
-0.001 4
- 0.0016
- 0.0018
- 0.002
- 0.0022
-0.0024
-0.0026
-7 .5 -6.5 -5.5 -4 .5 -5.5
IO0(IT-|/U)O +200 mV pul so C +2000 mV pulsw
Figure 45: Current on the -forward (positive-going)pulse of +200 mV and +2000mV waveforms.
current vs. log([F ] /M )p o W H v * p u l i M
anr

— 1
rn(Z
) /
kO
hm
i
Complex Impedance Plane1 E - 7 U F
2.6
2.2 -
2 -
1.8 -
1061 >3001.4 -
18001.2 -
0.8 -
0.6 -
0.4 -
0.2 -
9 7 9R«(7) / WOtvns
O c t ------------ b
Figure 46: Complex impedance plane projection o f Orion94-09 Fluoride electrode impedance. Solid line is least squares f i t to data points between 3500 and 10500 Hz.
69
T

Impa
donc
a (k
Ofi
ms)
electrode impedanceOM F peti/tico
3.5 -
3 -
2.6 -
0.5 -
0 2 4 6 10 12S 2016 18^Thousands)
frequencyleast squares fit O mol A imoginary
Figure 47s Real and Imaginary components ot electrode iapedance tor the Orion Fluoride electrode. Solid lines are least squares tits to data between 3500 and 10500 Hz.
17
0

1 7 1
< >
sc
C t o >
F i g u r e 4 8 : < a ) E q u i v a l e n t c i r c u i t u s e d i n t h e c u r r e n tw o r k .
( b ) E q u i v a l e n t c i r c u i t u s e d b y B r a n d a n d R e c h n i t z C 1 1 3 .

F i g u r e 4 9 : C h a n g e i n e l e c t r o d e c o n d u c t a n c e w i t hF l u o r i d e c o n c e n t r a t i o n - f o r t h e SA m e th o d a t ( a ) 5 0 0 H z ,( b ) 3 5 0 0 H z , ( c ) 7 5 0 0 Hz a n d ( d ) 1 0 5 0 0 H z . O r d i n a t er a n g e i s a p p r o x i m a t e l y 2% f o r a l l .

cond
ucta
nce
(ms)
0.076 0.0759 - 0.0756 -
0.0757 - 0.0756 - 0.0755 - 0.0754 -
0.0755 - 0.0762 - 0.0751 -
0.075 -
0.0749 -
0.0746 -
0.0747 -
0.0746 - 0.0745 -
0.0744 -
0.0745 -
0.0742 - 0.0741 -
0.074 ------
-7 .5
G vs log([F ] /M )500 Hz
n — 6.5
data
-5 .5
tog(|F 1/-M)— mgraw lon line
T-4 .5 -3 .5
173

Con
duel
one*
(m
S)
G vs. log[F ]3500 Hz
0.0831
0.003
0.0028
0.0827
0.0825
0.0824
0.00Z3
0.082
0.0019
0.0817
0.0816
-7 .5 -6 .5 -5 .5 -4 .5 -3 .5
loo (lri/M )0 data ragmsian [In*

Cen
du
ete
ne*
(mS
)
0,061 -
0.0609 -
0.0808 -
0.0807 -
0.0806 -
0.0805 -
0.0804 -
0.0605 -
0.0802 -
0.0801 -
0.08 -
0.0799 -
0.0798 -
0.0797 -
0.0796 -
0.0795 -
A data
G vs. log[F ]7500 Hz
-5 .5
logflri/M)— ragrasslon llna
“ I-----4.5 -3 .5
175

Conducta
nce
(rn
S)
G vs. log[F ]10500 Hz
0.05
0.0799 -
0.0797 -
0.0794 -
0.0792 -
0.0791
0.079 -
0.0757 -
-7 .5 -6 .5 -5 .5 -4 .5
logflT 1/M)X data regression line
176

F i g u r e 5 0 : C h a n g e i n e l e c t r o d e c o n d u c t a n c e w i t hF l u o r i d e c o n c e n t r a t i o n f o r t h e im m e r s io n m e th o d a t 5 0 0 H r , ( b ) 3 5 0 0 H z , (c > 7 5 0 0 H z a n d <d> 1 0 5 0 0 H z . O r d i n a t e r a n g e i s a p p r o x i m a t e l y 4 7. f o r a l l .

Cunduc1one«
(rn
S)
G vs. lo g [F “] ( im m ers ion )500 Hz
0.105 - i -
0.1045 -
0.104 -
0.1035 -
0.103 -
0.1015 -
0.101
- 7 5 -5 .5 -4 .5
a da*o — 11n«

Conducta
nce
(m
s)
G vs. log[F ] (immersion)3500 Hz
0.115
0 . 1 145 -
0.114 -
0.113 -
0.1126 -
0.112 -
0.1115 -
0.111-7.5 -5.5 -3.5-6 .5 -4.5
l/M )0 dala regression line
179
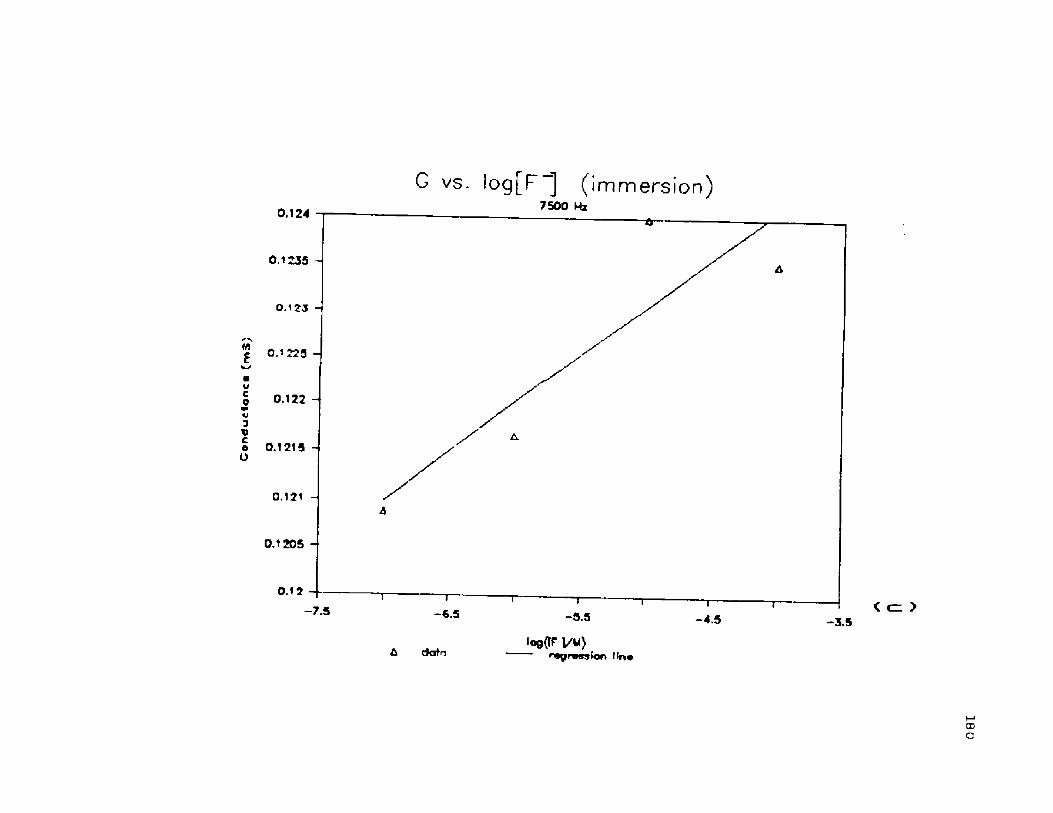
0.124
0.1235 -
0.123 -
0.1225 -
0.122 -
0.1215 -
0.121 -
0.1205 -
0 .1 2 -------
-7 .5
G vs. log[F ] ( im m ers ion )
~i— €.5
7500 Hz
-3 .5
6 dotnlogflf 1/M)
— ra g ra s s lo n t in *
I-4 .3

Conducta
nce
(mS
)
0.1325
0.132 -
0.1315 -
0.131 -
0.1305 -
0.13 -
0.1 295 -
0.129 -
0.1 » a
-7 .5
vs. log[F"]10500 Hz
- 5 5 -4 .5 -3 .5
181

SUMMARY
T h e F o u r i e r t r i n « f o r m i s a p o w e r f u l m a t h e m a t i c a l
t o o l f o r s o l v i n g d i f f e r e n t i a l - i n t e g r a l p r o b l e m s . T h e
c o i n c i d e n t d e v e lo p m e n t o f f a s t a l g o r i t h m s a n d m o r e
e c o n o m i c a l c o m p u t i n g p o w e r h a s m a d e t h e F o u r i e r
t r a n s f o r m a c o m m o n ly a v a i l a b l e t o o l f o r m i c r o c o m p u t e r
e q u i p p e d l a b o r a t o r i e s . T h u s , t h e s o l u t i o n o f a r a n g e o f
p r o b l e m s u s i n g n u m e r i c a l F T a p p l i c a t i o n s a r e r o u t i n e l y
a v a l 1 a b l e .
O n e a p p l i c a t i o n o f F o u r i e r t r a n s f o r m a t i o n i s t h e
f r e q u e n c y d o m a in d e c o n v o l u t i o n o f a n a p p l i e d p o t e n t i a l
w a v e f o r m f r o m t h e i n h e r e n t r e s p o n s e f u n c t i o n o f a n
e l e c t r o c h e m i c a l c e l l , i . e . a d m i t t a n c e s p e c t r u m
c a l c u l a t i o n s . T h o u g h t h e t e c h n i q u e w a s f i r s t d e v e l o p e d
i n t h e e a r l y 1 9 7 0 ' s , t h e u s e o f F T f o r o b t a i n i n g
m u l t i p l e x e d a d m i t t a n c e d a t a h a s n o t g a i n e d w i d e s p r e a d
p o p u l a r i t y . T h i s i s , i n p a r t , b e c a u s e o f t h e n e e d f o r
r e l a t i v e l y s o p h i s t i c a t e d h a r d w a r e f o r w a v e f o r m
g e n e r a t i o n . T h e u s e o f s i m p l e w a v e f o r m s s u c h a s p u l s e
t r a i n s w a s r e j e c t e d o n t h e b a s i s o f p o o r p r e c i s i o n a n d
e x c e s s i v e d i s t o r t i o n o f d a t a b y n o n l i n e a " r e s p o n s e s ,
e x a c e r b a t e d b y t h e r e l a t i v e l y h i g h p e a k v a l u e ( i n t h e
t i m e d o m a in ) r e q u i r e d t o o b t a i n s u f f i c i e n t s p e c t r a l
m a g n i t u d e s f o r h i g h e r h a r m o n i c s .
182

183
I n t h i s w o r k , * m o r e d e t a i l e d s t u d y w a s u n d e r t a k e n
o f t h e p r o b l e m s a s s o c i a t e d w i t h u s e o f p u l s e t y p e
w a v e f o r m s f o r im p e d a n c e a n a l y s i s o f e l e c t r o c h e m i c a l
s y s t e m s . P u l s e - F T a n a l y s i s o f n - T i O a e l e c t r o d e s a n d
m o d e l RC c i r c u i t s s h o w e d t h a t r e l a t i v e l y g o o d r e s u l t s
( p r e c i s i o n s I X r . s . e . o r l e s s ) f o r d a t a u p t o t h e S O th
h a r m o n i c a n d e x c e l l e n t r e s u l t s < s O . I X r . s . e . ) u p t o t h e
2 0 t h h a r m o n i c c o u l d b e e a s i l y o b t a i n e d u s i n g s i m p l e
p u l s e s . C o m p a r i s o n s w i t h s t e a d y s t a t e a . c . r e s u l t s
s h o w e d e x c e l l e n t a g r e e m e n t .
T h e a d m i t t a n c e s p e c t r a o b t a i n e d f o r t h e
n - T iO s e / O . 1M N a a SCU I n t e r f a c e , w e r e u s e d t o p e r f o r m M o t t -
S c h o t t k y a n a l y s i s . T h e s l o p e o f t h e M o t t - S c h o t t k y l i n e s
g a v e r e a s o n a b l e e s t i m a t e s f o r d o n o r d e n s i t i e s ) a n d
r e p l i c a t e a n a l y s e s y i e l d e d N*> v a l u e s t h a t a g r e e d t o
w i t h i n 0 . 5 X . F l a t - b a n d p o t e n t i a l s w e r e a l s o e s t i m a t e d
f r o m t h e M o t t - S c h o t t k y d a t a . A s l o p e o f —6 2 m V /p H u n i t
w a s o b t a i n e d , a l t h o u g h t h e p r e c i s i o n o f t h e
f l a t —b a n d e s t i m a t e s w a s p o o r . T h i s r e i n f o r c e s t h e
r e s u l t s o f e a r l i e r r e s e a r c h e r s , w h o r e p o r t e d a s l o p e
c l o s e t o t h e t h e o r e t i c a l - S ? m V /p H < 9 2 5 * C ) .
R e s u l t s f r o m t h e n - T i O ^ s t u d i e s s h o w e d a c o n s i s t e n t
s y s t e m a t i c e r r o r r e s u l t i n g i n a r t i f i c i a l l y h i g h i n - p h a s e
a n d / o r q u a d r a t u r e c u r r e n t s f o l l o w e d w i t h a r a p i d r o l l o f f
a t h i g h e r f r e q u e n c i e s . C o m p a r i s o n w i t h a . c . e x p e r i m e n t s
s h o w e d t h a t t h i s w a s n o t d u e t o t h e u s e o f a p u l s e

i « 4
i v q u t n c * a s a n i n p u t N a v t f o r m , b u t r a t h e r t o t h e h i g h l y
c a p a c i t i v e n a t u r e o f t h e s e m i c o n d u c t o r / e l e c t r o l y t e
i n t e r p h a s e . T h e s e m i c o n d u c t i n g n a t u r e o f t h e e l e c t r o d e ,
w h i c h i s a d v a n t a g e o u s i n t h a t l a r g e r a p p l i e d p o t e n t i a l s
m a y b e u s e d , a l s o c a u s e s d i f f i c u l t y w h e n u s e d w i t h a
p o t e n t i o s t a t o p t i m i z e d f a r l o w r e s i s t a n c e , l o w
c a p a c i t a n c e c e l l s . T h e t i m e c o n s t a n t a s s o c i a t e d w i t h
t h e c e l l i n t e r a c t s w i t h t h a t o f t h e p o t e n t i o s t a t t o
c a u s e d i s t o r t i o n s a t f r e q u e n c i e s a s l o w a s h u n d r e d s o f
H e r t z . T h e u s e o f t h e c r i t i c a l f r e q u e n c y , f = ( 2 i r R C ) _ 1 ,
f o r o b t a i n i n g c a p a c i t a n c e a n d r e s i s t a n c e v a l u e s w a s
p r o b l e m a t i c b e c a u s e o f t h e s e i n t e r a c t i o n s . F a c t o r s t h a t
w e r e d e t r i m e n t a l t o s y s t e m s t a b i l i t y w e r e i
( a ) h i g h c e l l c a p a c i t a n c e< b ) h i g h c e l l r e s i s t i v i t y , e i t h e r i n t h e s o l u t i o n
o r t h e e l e c t r o d e( c ) l o w r a t i o o f u n c o m p e n s a t e d r e s i s t a n c e ( b e t w e e n
t h e r e f e r e n c e a n d w o r k i n g e l e c t r o d e s ) t o t o t a l c e l l r e s i s t a n c e ( b e t w e e n t h e a u x i l i a r y a n d w o r k i n g e l e c t r o d e s )
( d ) h i g h r e f e r e n c e e l e c t r o d e im p e d a n c e , a n d( e ) a b s e n c e o f f a r a d a i c c o n d u c t a n c e .
N e v e r t h e l e s s , t h e p u l s e - F T t e c h n i q u e w a s a b l e t o
a c c u r a t e l y d e t e r m i n e c a p a c i t a n c e v a l u e s i n m o d e l RC
c i r c u i t s w h e n t h e l o w f r e q u e n c y f o r m s o f c e l l a d m i t t a n c e
e q u a t i o n s w e r e u s e d .
S t u d i e s o f t h e O r i o n 9 4 - 0 9 f l u o r i d e e l e c t r o d e ,
u s i n g b i p o l a r c o n d u c t a n c e m e a s u r e m e n t s ( B 1 C 0 N ) , g a v e
s t r o n g e v i d e n c e o f a c o n c e n t r a t i o n - d e p e n d e n t r e s p o n s e
f o r f l u o r i d e w h e n a s t a n d a r d a d d i t i o n p r o c e d u r e w a s

1 8 5
u s e d . T h e s e m e p r o c e d u r e u s i n g p u l s e - F T a d m i t t a n c e d a t a
s h o w e d a s i m i l a r c o r r e l a t i o n b e t w e e n - f l u o r i d e
c o n c e n t r a t i o n a n d c o n d u c t a n c e , m e a s u r e d a s t h e i n - p h a s e
c o m p o n e n t o f t o t a l a d m i t t a n c e , a t f r e q u e n c i e s
c o r r e s p o n d i n g t o a h y d r a t e d L a F 3 s u r f a c e f i l m . T h i s
c o r r e l a t i o n w a s n o t o b s e r v e d w h e n a d m i t t a n c e w a s
m e a s u r e d o n t r a n s f e r o f t h e e l e c t r o d e f r o m a f l u o r i d e
f r e e s o l u t i o n , o r a f t e r e q u i l i b r i u m w i t h t h e f l u o r i d e
s o l u t i o n . W h e t h e r t h e c o r r e l a t i o n d o e s n o t e x i s t , o r i s
s i m p l y m a s k e d b y i n c r e a s e d u n c e r t a i n t y i n t h e
c o n d u c t a n c e , i s u n c l e a r . T h e h i g h l y v a r i a b l e q u a d r a t u r e
r e s p o n s e s u g g e s t e d t h a t i t m a y b e a m o r e s e n s i t i v e
i n d i c a t o r t h a n c o n d u c t a n c e f o r u s e i n f l u o r i d e
d e t e r m i n a t i o n , a l t h o u g h n o c o r r e l a t i o n w i t h f l u o r i d e
c o n c e n t r a t i o n w a s f o u n d h e r e .
A k e y m o d i f i c a t i o n o f t h e p u l s e w a v e f o r m w a s m a d e
f o r u s e i n t h e f l u o r i d e e l e c t r o d e s t u d y . A 5 0 % r e l a t i v e
p u l s e l e n g t h ( i . e . s q u a r e w a v e ) p r o v i d e d a n o d d h a r m o n i c
w a v e f o r m , a n d a n a l o g f i l t e r i n g w a s u s e d t o r e d u c e t h e
r a t e o f d e c a y , w i t h f r e q u e n c y , i n t h e m a g n i t u d e
s p e c t r u m . T h i s h a d t h e a d d e d a d v a n t a g e o f r e d u c i n g t h e
r o o t - m e a n —s q u a r e p o t e n t i a l a p p l i e d t o t h e c e l l . T h i s ,
a l o n g w i t h t h e b i p o l a r n a t u r e o f t h e r e s u l t i n g w a v e f o r m
s h o u l d b e o f c o n s i d e r a b l e a d v a n t a g e i f t h e w a v e f o r m i s
a p p l i e d t o t h e s t u d y o f m o r e n o n l i n e a r s y s t e m s , e . g .
t h o s e i n v o l v i n g f a r a d a i c p r o c e s s e s .

1 8 6
F i n a l l y , t h e p o t e n t i a l o f p u l s e t y p e w a v e f o r m s f o r
e l e c t r o c h e m i c a l im p e d a n c e a n a l y s i s i s m u c h h i g h e r t h a n
i s g e n e r a l l y c o n s i d e r e d . W i t h a p p r o p r i a t e
c o n s i d e r a t i o n s , p r e c i s e r e s u l t s c a n b e o b t a i n e d u p t o
p o s s i b l y 1 0 0 h a r m o n i c s , u s i n g o n l y a n 8 - b i t A / D . U s e o f
t h e b i p o l a r , h i g h - p a s s f i l t e r e d s q u a r e w a v e m a y a l s o
a l l o w i t s a p p l i c a t i o n t o f a r a d a i c s y s t e m s w i t h o u t u n d u e
n o n l i n e a r c u r r e n t r e s p o n s e .

R E F E R E N C E SC H A P T E R I
1 . I . A s im o v , B i o g r a p h i c a l E n c y c l o p e d i a a ! S c i e n c e a n d T s c h n o i o o v . P a n B o o k s , L o n d o n ( 1 9 7 S ) , p . 0 7 .
2 . " A n a l y s i s , f u n c t i o n a l " , E n c y c l o p a e d i a B r i t a n n i c a .1 9 B 4 , 1 , 7 6 5 .
3 . J . F . P r i c e i n E g M r j g c T e c h n i q u e a n d A p p l i c a t i o n s .H . D . P r i e s , ( e d . ) | P le n u m P r e s s , N e w Y o r k ( 1 9 8 5 ) .
4 . M .D . W i n j e n , R e c . T r a v . C h i m . . 7 9 . 1 2 0 3 ( 1 9 6 0 ) .
5 . J . W . C o o l e y , J . W . T u k e y , N a t h . C o m p . 1 9 , 2 9 7 - 3 0 1 ( 1 9 6 5 ) .
6 . A . A . P i 11 a , J . E l e c t r o a n a l . C h e m . 1 1 7 r 4 6 7 ( 1 9 7 0 ) .
7 . R . L . B i r k e , A n a l . C h e m . ■ £ 5 , 1 2 5 3 ( 1 9 7 1 ) .
8 . S . C . C r e a s o n , D . E . S m i t h , E l e c t r o a n a l . C h e m . 3 6 . A 1 ( 1 9 7 2 ) .
9 . S . C . C r e a s o n , D . E . S m i t h , E l e c t r o a n a l . C h e m . 4 0 . A 1 ( 1 9 7 2 ) .
1 0 . S . C . C r e a s o n , J . W . H a y e s , D . E . S m i t h , J . E l e c t r o a n a l . C h e m . 4 7 , 9 - 4 6 ( 1 9 7 2 ) .
1 1 . K . D o b l h o f f e r , A . A . P i l l a , E l e c t r o a n a l . C h e m .3 9 . 9 1 ( 1 9 7 2 ) .
1 2 . S . C . C r e a s o n , D . E . S m i t h , A n a l . C h e m . 4 5 ( 1 4 ) , 2 4 0 1 ( 1 9 7 3 ) .
1 3 . D . E . S I o v e r , D . E . S m i t h , A n a l . C h e m . 4 5 ( 1 1 ) , 1 8 6 9 ( 1 9 7 3 ) .
1 4 . H . K o j i m a , S . F u j i w a r a , B u i 1 . C h e m . S o c . J o n . 4 4 ( 8 ) , 2 1 5 8 —2 1 6 2 ( 1 9 7 1 ) .
1 5 . M . H i r o t a , Y . U m e z a w a , H . K o j i m a , S . F u j i w a r a , P u l l . C h e m . S o c . J o n . 4 7 ( 1 0 ) , 2 4 B 6 - 2 4 B 9 ( 1 9 7 4 ) .
1 6 . J . W . H a y e s , D . E . G l o v e r , D . E . S m i t h , N .W . O v e r t o n , A n a l . C h e m . . 4 5 ( 2 ) , 2 7 7 ( 1 9 7 3 ) .
1 7 . R . d e L e v i e , J . W . T h o m a s , K . M . A b b e y , J . E le c t r o a n a l . C h e m . 6 7 . i l l ( 1 9 7 5 ) .
187
1 6 8
1 8 . M . S l u y t a r s —R a h b a c h , J . H . S l u y t a r s , E l a c t r o a n i l . C h a m . . A . J . B a r d ( a d . ) , p p . 1 —1 2 8 ,M a r c a l D a k k a r , N Y ( 1 9 7 0 ) .
1 9 . E . O . B r i g h a m , I f r g E i f t l F o u r i a r T r a n s f o r m . P r a n t i c a - H a l 1 , E n g la w o o d C l i f f a , N a w J a r s a y ( 1 9 7 4 ) .
2 0 . C . G a b r i a l l i , M . K a d d a m , J . F . L i z f e a , J .E l a c t r o a n a l . C h a m . . 2 0 5 . 5 9 ( 1 9 B 6 ) .
2 1 . A . M . B o n d , I . D . H a r i t a g a s , E l a c t r o a n a l . C h a m . . 222., 3 5 ( 1 9 8 7 ) .
2 2 . L . P o s p i s i l , N . F a n a l l i , E l a c t r o a n a l C h a m . . 2 2 2 . 3 6 7 ( 1 9 8 7 ) .
2 3 . F . E . W o o d a r d , M . K . H a n a f a y , C . N . R a i l l a y , J . E l a c t r o a n a l . C h a m . . 1 6 7 . 4 3 ( 1 9 8 4 ) .

] 89
CHAPTER I I
1 . E . O . B r i g h a m , Ih tt E ii& F o u r i e r T r a n s f o r m . P r e n t i c e —H a l 1 , E n g le w o o d C l i f f s , N J C 1 9 7 4 ) .
2 . R . B r a c e w e l l , Ttltt F o u r i e r T r a n s f o r m a n d I t * A d d I i c a t i o n * . M c G r a w - H i l l , 8 t . L o u i s ( 1 9 7 8 ) .
3 . D . C . C h a m p e n e y , F o u r i s r T r a n s - f o r m s a n d T h s i r P h y s i c a l A p p l i c a t i o n s . A c a d a m ic P r e s s , N e w Y o r k ( 1 9 7 3 ) .
4 . R .W . R a m ire z , I h * E £ I . F U Q tff lP fn tli . l *Q d C o n c e p t s , P r s n t i c s —H a l1 , E n g l ewood C l l t f i , Nsw J » r * # y (1 9 B 5 ) .
5 . IE E E S u b c o m m i t t e e o n M a a s u r a m a n t C o n c a p t s , IE E E T r ^ n t i . 6 u d i a E l a c t r o a c o u s t i c s A U - 1 5 ( 2 > , 4 5 - 5 5 ( 1 9 6 7 ) .
6 . R . D . S t u a r t , f i n I n t r o d u c t i o n i t t F o u r i a r A n a l y s i s . C h a p m a n & H a l l , L o n d o n ( 1 9 6 1 ) -
7 - A . S a v i t s k y , M . J . E . G o l a y , A n a l . C h a m . . 3 6 ( B ) . 1 6 2 7 ( 1 9 6 4 ) .
8 . H . H . M a d d a n , A n a l . C h a m . . 5 0 . 1 3 8 3 ( 1 9 7 8 ) .
9 . J . S t a i n a r , Y . T a r m o n i a , J . D a l t o u r , A n a l . C h a m . . 4 4 , 1 9 0 6 ( 1 9 7 2 ) .
l O . C . G . E n k a , T . A . N ia m a n , A n a l . C h a m . . 4 8 . 7 0 5 A ( 1 9 7 6 ) .
1 1 . D . E . S m i t h , A n a l . C h a m . ■ 4 8 . 5 1 2 A ( 1 9 7 6 ) .
1 2 . E . E . A u b a n a l , J . C . M y l a n d , K . B . O ld h a m , C .G . Z o s k i ,E l a c t r o a n a l . C h a m . ■ 1 8 4 . 2 3 9 ( 1 9 8 5 ) .
1 3 . A . A m i n i , M . S . T h a s i s , U n i v . o f N e w O r l e a n s ,D e c e m b e r 1 9 8 6 .
1 4 . D .W . K i r m s e , A .W . W e s t e r b e r g , A n a l . C h a m . . 4 3 . 1 0 3 S( 1 9 7 1 ) .
1 3 . R .W . D w y e r , J r . , A n a l . C h a m . . 4 5 1 3 8 0 ( 1 9 7 3 ) .
1 6 . P . R . G r i f f i t h s , G . L . P a r i e n t e , T r e n d s i n A n a l ■ C h a m . . 2 # 2 0 9 ( 1 9 8 6 ) .
1 7 . J . K . K a u p p i n e n , D . J . M o f f a t t , H . H . M a n t s c h , D .G . C a m e r o n , A n a l . C h a m . . 5 3 , 1 4 5 4 - 1 4 5 7 ( 1 9 8 1 ) .

1 9 0
1 8 .
1 9 .
20.
21 .22.
2 3 .
2 4 .
2 5 .
2 6 .
2 7 .
2 8 .
2 9 .
3 0 .
3 1 .
3 2 .
D . E . S m i t h I n F g u r i . g r » H i l b a r t a n d H i d i n u r d T r a n s f o r m s i n C h a m l s t r y . A . G . M a r s h a l l ( a d . ) , P la n u m , N V ( 1 9 8 2 ) .
D . P . B i n k l a y , P h . D . T h a s i s , V i r g i n i a P o l y t a c h n i c I n s t i t u t a a n d S t a t a U n i v . ( 1 9 7 9 ) .
G . H o r l i c k , H . V . M a l m s t a d t , f i n a l . C h a m . . 4 2 . 1 3 6 1 ( 1 9 7 0 ) .
G . H o r l i c k , f i n a l . C h a m . . 4 2 » 6 1 A ( 1 9 7 1 ) .
A . B a z a g h , J . J a n a t a , f i n a l . C h a m . . 5 9 . 4 9 4 A ( 1 9 8 7 ) .
M . S l u y t a r s - R a h b a c h , J . H . S l u y t a r s , E l a c t r o a n a l . C h a m . . A . J . B a r d ( a d . ) , p p . 1 - 1 2 8 ,M a r c a l D a k k a r , NY ( 1 9 7 0 ) .
M . S l u y t a r s - R a h b a c h , J . H . S l u y t a r s i n C o m o r a h a n s i v e T r g f t t j g f Q ± E l a c t r o c h a m i s t r v . £ , E . Y a a g a r ,J . 0 ’ M B o c k r l s , B . E . C o n w a y ( a d s . ) j M c G r a w - H i l l ,N a w Y o r k ( 1 9 8 4 ) .
D . E . S m i t h , C r i t . R a v . f i n a l . C h a m . . 2 , 2 4 B ( 1 9 7 1 ) .
D . D . M a c D o n a ld , M . C . H . M c K u b r a , M o d a r n A i p a c t i o f E l a c t r o c h a m l s t r y . ±4 , 6 1 ( 1 9 8 2 ) .
E . L a v a r t , E . P o i r i a r d ’ A n g * d ’ O r s a y , J . E l a c t r o a n a l . C h a m . , i z , 2 7 7 ( 1 9 6 6 ) . * Zx.E l a c t r o a n a l . C h a m . . 1 9 . 3 3 5 ( 1 9 6 8 ) .
C . G a b r i a l l i , M . K a d d a m , J . F . L i z a a , J .E l a c t r o a n a l . C h a m . . 2 £ 2 » 3 9 ( 1 9 8 6 ) .
M . E t m a n , C . K o a h l a r , R . P a r s o n s , E l a c t r o a n a l .C h a m . . 1 2 a , 5 7 ( 1 9 8 1 ) .
J . R . M a c D o n a ld i n I m o a d a n c a S o a c t r o s c o o y . J . R . M a c D o n a ld ( a d . ) , J o h n W i l a y Sc S o n s , N a w Y o r k ( 1 9 8 7 ) .
P . S m i t h M .S . T h a s i s , C o l o r a d o S t a t a U n i v . , P a l l 1 9 8 0 .
A . J . B a r d , L . R . F a u l k n a r , E l a c t r o c h a m i c a l M a t h o d s . J . W i l a y a n d S o n s , N a w Y o r k ( 1 9 8 0 ) .

1 9 1
3 3 . N . L a k s h m i n a r a y a n a i a h , M i m b n n t E l a c t r o d a * .A c a d a m ic P r a s s , N s w Y o r k ( 1 9 7 6 ) .
3 4 . R . P . B u c k , E l B C t r g f l g g i l l A n a l y t i c a lC h a m i s t r y . v l f P la n u m P r a « « f N a w Y o r k ( 1 9 7 B ) .
3 3 . V . E . M o r f , J fa B P r i n c i o l a a f i t I o n - S a l a c t ! y aE l B C t r P t i t g * n d a t M a m b r a n a T r a n s p o r t . E l s a v i a r , N e w Y o r k <1 9 B 1 ) .
3 6 . M . J . D . B r a n d , G .R . R a c h n i t z , A n a l . C h a m . ■ 4 2 . 4 7 8( 1 9 7 0 ) .
3 7 . J . R . S a n d i f a r , R . P . B u c k , E l a c t r o a n a l . C h a m . .3 6 . 3 8 3 ( 1 9 7 4 ) .
3 8 . C . R . P o w l a y , R . P . G a l g a r , C h a m . . 5 2 . 7 0 5 ( 1 9 8 0 ) .
J r . , T . A . N ia m a n . A n a l .
3 9 . C . R . P o w la y , T . A . N ia m a n , ( 1 9 8 2 ) .
A n i l ,, C h t (Si 1 2 2 , 6 1
a o ■ C . R . P o w la y , T . A . N ia m a n , ( 1 9 B 3 ) .
A n * l . . C h im . . f i f i L t * . 1 2 2 . 8 3
4 1 . C . R . P o w la y , T . A . N ia m a n , ( 1 9 8 3 ) .
A n a l . £ h j ( H j 1 3 2 , 1 7 3
4 2 . C . R . P o w la y , T . A . N ia m a n , ( 1 9 8 3 ) .
A n a l * C h im . 1 3 3 , 1
4 3 . D . E . J o h n s o n , C .G . E n k a , ( 1 9 7 0 ) .
A n t i . CftV fTL .. 6 2 , 3 2 9
4 4 . J . R . S a n d i f a r , S . G r o s s , ( 1 9 8 7 ) .
A n a l . £ h i< !G . A c t * . 1 5 2 , 2 3 7
4 5 . M . J . D . B r a n d . G . A . R a c h n i t z . A n a l . C h a m . . ( 1 9 6 9 ) .
5 1 , 1 1 8 5
1 9 2
CHAPTER I I I
1 . W .D . B t a n l a y , S . J . P a t a r s o n , B v t a . 1 . ( 1 2 ) , 1 4( 1 9 7 2 ) .
2 . R . E . B o r J a s - S a v a r y n , P h D D i s s e r t a t i o n , L o u i s i a n a S t a t e U n i v a r s i t y ( 1 9 B 5 ) .
3 . P . R . G r i f f i t h s , i n F o u r i e r T r a n s f o r m s a n d T h e i r C h e m ic a l A p p l i c a t i o n s , p . 7 4 , P . R . G r i f f i t h s ( a d . ) , P la n u m P r a s s , N a w Y o r k ( 1 9 7 8 ) .
4 . S . C . C r a a s o n , J . W . H a y a s , D . E . S m i t h , J .E l t tC t r _ Q « n * l . C h a m . 4 7 , 9 - 4 6 ( 1 9 7 2 ) .
5 . K . D o b l h o f a r , A . A . P i l l a , E l a c t r o a n a l . C h a m . ■3 9 f 9 1 ( 1 9 7 1 ) .
6 . R . J . G a l a , A . J . N o z i k , J . C o o p a r , R . A . O s t a r y o u n g C o l 1 . C z e c h C o m m u n . . 4 7 1 7 9 4 ( 1 9 B 2 ) .
7 - C . R . P o w la y , T . A . N ia m a n , A n a l ■ C h im . A c t a . 1 3 9 . 8 3 ( 1 9 8 3 ) .
8 . D . K . R o a i n L a b o r a t o r y T a c h n i o u a s i nE l a c t r o a n a l y t i c a l C h a m i s t r y . C h 7 , P . T . K i s s i n g a r , W .R . H e in a m a n , a d s . , l i a r c a l D a k k a r , N Y ( 1 9 8 8 ) .

1 9 3
1 .
2 .3 .
4 .
3 .
6.
7 .
8.
9 .
10.
11.
12.
1 3 .
1 4 .
1 3 .
1 6 .
CHAPTER IV
P . S m i t h M . S . T h e s i s , C o l o r a d o S t a t e U n i v . , P a l l 1 9 8 0 .
K . R a je s h w a r i n M o l t a n S a l t T e c h n i q u e s . v 2 .
M . T o m k i e w i c z E l a c t r o c h a m . S o c . 1 2 6 . 1 5 0 3 < 1 9 7 9 ) .
E . C . D a i t o i t , R . L . v a n M e in h a e g h e , F . C a r d o n , W .P . G o m a a B a r . B u n - G a a a l l . ■ JSL, 1206 < 1 9 7 3 ) .
H . G e r i s c h e r , i n " P h y s i c a l C h e m i s t r y , A n A d v a n c e d T r e a t i s e " , v o l . I X A , C h 5 , H . E y r i n g ( a d . ) , A c a d e m ic P r a s s , N V ( 1 9 7 0 ) .
R . J . G a l e , A . J . N o z i k , J . C o o p e r , R . A . O s t e r y o u n g C o l 1 . C z e c h C o n im u n ■ . 4 7 1 7 9 4 ( 1 9 8 2 ) .
C . R . P o w l a y , R . F . G a i g a r , J r . , T . A . N ie m a n , A n a l . C h a m . 3 2 . 7 0 5 ( 1 9 B 0 ) .
D . K . R o e i n L a b o r a t o r y T e c h n i q u e s in .E l a c t r o a n a l v t l c a l C h e m i s t r y . C h 7 , P . T . K i s s i n g e r , W .R . H e in e m a n , a d s . , M a r c e l D a k k a r , NY < 1 9 8 8 ) .
A . F i t c h J . E l a c t r o a n a l . C h a m . 2 1 5 . 3 1 3 - 3 1 8 ( 1 9 8 6 ) .
S . C . C r a a s o n , J . W . H a y e s , D . E . S m i t h J .E l » C t r g » n # l C h a m . 4 7 , 9 - 4 6 ( 1 9 7 2 ) .
M . J . D . B r a n d , G .R . R a c h n i t z , A n a l . C h a m . 4 2 4 7 B ( 1 9 8 0 ) .
L . A . H a r r i s , R . S c h u m a c h e r , E l a c t r o c h a m . S o c .1 2 7 ( 5 ) , 1 1 B 6 ( 1 9 B O ) .
P . B a t a i l l a r d , F . G a r d i a s , N . J a f f r e z i c , C . M a r t a l e t , B . C o l i n , B . M a n d r a n d , A n a l . C h a m . 6 0 . 2 3 7 4 - 7 9 ( 1 9 8 8 ) .
C . R . P o w l a y , T . A . N ie m a n , A n a l . C h im . A c t a . 1 5 2 ( 1 9 8 3 ) , 1 7 3 - 1 9 0 .
C . R . P o w l a y , T . A . N ie m a n , A n a l . C h im . A c t a . 1 3 9 . B 3 ( 1 9 8 3 ) .
R . P . B u c k , E l a c t r o a n a l . C h a m . I B . 3 8 1 - 8 6 ( 1 9 6 8 ) .
1 9 4
1 7 . R . P . B u c k , I . K r u l l , E l a c t r o a n a l . C h a m . . I f i , 3 0 7 - 9 9 ( 1 9 6 8 ) .
1 8 . R . P . B u c k i n " I o n S a l a c t i v a E l a c t r o d a a i n A n a l y t i c a l C h a m i s t r y , " y j ^ f p . 1 1 7 , H . F r a i m a n ( a d . ) , P la n u m P r a s s ( 1 9 7 8 ) .
1 9 . N . P a r t h a s a r a t h y , J . B u f f l a , W. H a a r d i , A n a l . C h im . A c t a . 9 5 r 1 2 1 - 0 ( 1 9 7 7 ) .

APPENDIX A
MTFBIHiItt1 REM FA8TF0U4 .Coaputt* FFT of t ia * function i t o r t f on dink.2 ! Display* aafnltuda apactrua as kar graph or tabla of valuts3 ? accapts up to 1024 data point* foal and laagtnary array* ara4 ! wscraablad 4/23/M3 * Calculate* Adaittanca K. Camay4 !7 ! t l M I I I I M I I t l t t t t t l l t t t l t t l l l t t l t t t t l l t l l l t t l t t l l t l t t l l l M t t f l l t t t l l I ! m t m i i m i m i m t t t i t m m i m i t input data i t t i m i m i m i t m 10 INPUT •ENTER RECORD DURATlMtin i k m i I i ) *|PN 10 INPUT ' M NO.DATA POINTS, ENTER L ‘ (LX 90 NX«2*LI ifoNX i TI«PN/NS3 NINX-N 1 IF N>512 THEN NINX-312 ELSE NINX*N ! fo r xaro f i l l in g 70 DIN 1112048), 12(2048), 13(2048), 8(2048), RH2048I, R2I2048)40 NAT Xl-ZER I NAT I2-ZER tNAT I3-2ER tNAT S-ZER110 INPUT 'NAME OF DATA FILE FOR INPUT 'jDFILO130 OPEN DFILf FOR INPUT AS FILE 81133 HAT I1»IER tNAT I2-ZER130 INPUT 81 II(ZX) FOR ZX*0 TO NINI-1151 CLOSE 81210 INPUT *D0 YOU NANT A L1ST1N6 OF THE 6ENERATED TINE FUNCTIDN71Y/N) *|A*230 IF A t- ‘ N* THEN 410250 IF A IO T THEN 90270 DO290 FOR 21-0 TO N-l291 IF A B S tllfZ X m i THEN l-A IS (l) IZ1)>292 NEIT ZX330 a s (LINE (73,30,587,30) I LINE (75,30,73,440)353 P8ET(IC0X,240X) FOR IC0X«75 TO 587 STEP 3370 DIV-312/N iYDIV*400/(2IBI390 FOR IX«75+32*D]V TO 587 STEP 32IDIV410 IINEUX,30,U,43I iTEIT(lI-m ,33,NUHllf(IX-73X)/D IV))430 NEIT I t450 FOR JI-40I TO 440X STEP SOX470 LINE(75X,Jt,47X,JX) I TEXT(531,J1-20I,NUfH ( ( JX-40X)/400X),1,1)490 NEIT JX310 TEXT(173,15,‘ SAMPLE POINT NO.*) tTEXT(30,100,'INTENSlTYIV-au-l)',l,l) 530 FOR ZI'O TO N-2330 LIICf79E+ZX0DIV, 11 (IX) tTDIV*-240X,79Z* 12X^1) IDIV, XI (ZI+1X) ITDIV+240I) 370 NEXT 1X410 FOR ZX-0 TO N-l iX lIZX)*II(ZXI/N iNEIT 21489 TOEt-TIHE 490 PRINVUFFT CALCULATION IN PROWESS I t *710 IlX«N/2tl2X-HV«2*PI/N 730 FOR IX»1 TO LX 733 LOCATE 2,2811 I PRINT I t 730 I3X*0iI4X"IIX 770 FOR Kt-1 TO I2X 790 XX*|NT(I3I/11X)
195

196
110 G0SU8 2610tso n *a » (v m > iZ2-s in (v»yx)•90 FOR NX«13l TO I4X-IX910 A laIl(NXIiA2»I2(NX)illaZ llI l(H l* llX ]-Z 2 II2 (N I* I lI I6
t l2 > Z 2 IIU n * llX )« !llI2 ffn « IlX )970 II{m -A t+ lliI2(ffl)-A2+I2 i l l IXI-At-111I2flfX^ElZ>-A2-l21 Of0 NEIT NX1030 I31»13X *2 IIU iH X *m *2 lllX1050 NEIT KX1070 IU*IlX/2iI2I«2ll2Z1090 NEIT IXn o t ! t t i t t m t m i f t t m m t i m m i m m m t m i t m m t i t m m i i1102 ! t t l t t t t l l t t l t t t t l t t l l t UNSCRAHILE MMY I H I t M l t t l l l t l l t t l t t l1103 FOR UX*0 TO N-l 1110 IX-UX1113 GOSUI 26301120 IF YX<*UX THEN 11301123 TR«Il<U I)iTW 2(U IhIl(UXtaIHYXHI2IUX)»I2IYX)iIl(Y l)-TRiI2(YI)»TI 1130 NEIT IIZ1246! m m t m m i t t t m m t t e k of unscramble routi* m t t m t m t1249 ! t t t t M t t l t t t l t t t l l t l t l l l t l l l t l t t t t t l t t t U M t t l l l t l l l l M t l t l t l l t t l1230 FRINT 'NAME OF FILE FOR OUTPUT OF a(DFIL4|a at •|LEFT(DFIL4,6)|a.FFTa1270 INPUT IF H I1273 IF DfIL4<>aREFa THEN 12831276 MT 11*11 i NAT R2*I21276 GOTO 13701283 IF DFIL»Oaa THEN OPEN DFILI AG FILE 13 ELSE 1330 1290 PRINT 43,11(0) iHAT PRINT 13 II1NX/2)1310 PRINT 63,12(0) iNAT PRINT 63 I2(NX/2>1330 CLOSE 631330 PRINT 1 MAGNITUDE CALCULATIONS IN PROGRESS'1370 FOR UX-OZ TO N/2 iI3 (U ll4M (X l<U I> tII(in>*I2 (U I> tl2 tU X » iNEIT UX1429 ! t m i m i m i t m m i m m M i m i m i m t t i i n t t m m i m i m m i m1430 R E R I t l l t t t l t t t l t t t l l M t t l l t t l l t l t t l t Scram output l l t t l l l l l t t l l t l l t t l l l 1430 PRINTaIN MAT FORK DO YOU NANT THE OUTPUT V1470 PRINT* MAGNITUDE SPECTRUM PLOT 411*1490 PRINT* TAKE OF VALUES (2)a 1310 PRINT* CALCULATE ADMITTANCE (3)a1330 INPUT A1350 ON A GOTO 1610,2030,2340 1370 ON ERROR GOTO 143013(9 ! m t t m t m m i m i i t i t t t i m f t t i m m t t m t t i m i m m i i i t t i m m 1590 R E H m m M f t i t i i i t t t m m t i m m i t lupnituda apactrua p lo t t i m m n 1610 8*01630 FOR UX-1 TO N-l1631 IF I3(UXDI THEN (-II(U Z)1632 NEIT UX1690 CLB i LINE(70,50,7)0,30) i LINE(70,30,70,430)1710 |IVXaINT(12IO/NI 1730 FOR UI>0 TO N/21730 IC0X-69X*UX(DIVX tLllCfIC0X+1I,501,IC0X*lSt 49X)1790 FOR H«0 TO 2 iLI*tICOXHIX,36,IC01*MXt30X+400XtX3lUX>/l>iltn NX 1(30 NEIT UX

197
1070 FOR 11*100 TO 430 STEP 301090 U H E W .U ,& 0 ,II) iTEIT(43,11-201,NUWt (11-301)/400I), 1,1)1910 NEIT I I1930 FOR IX*70+32101VI TO 710 STEP 32IDIW !X-a il» la b tl 1950 11*111,30,11,40) i TEIT111-1,22,H«l 1970 *X T I I1990 TEIT(323,3,aHARN0NICa> I TElTi3O,10O,aHAGNITU#Ea, 1,1)2010 GOTO 223020291 i m t m t m t m t m i t m i m m i m t m t t m t m t t t m t m t t t f t m 2030 R E H M i im m im im i i t t im u t t m T i i i i of valuta i m m t i m m t 2030 U*02070 1*02090 PRlNTaHARHONICajTA II14)|aREALa|TAI(30)p2110 PRINTaINAGlNAAYa|TAH3OI(aNA«NITU0Ea2130 PRINT U|TAI(10)fII(U)|TAI(30)|12(U)|TAI(S0)|I3(U)2130 U*U+liZ*Z+l2170 IF I<*22 T*H 21902171 CALL GETKEY(P1,P2,P3,P4,P3)2173 IF PSOO THEN 21712174 IF Pt*08 T*H 2210 ELSE GOTO 2070 2190 IF IK •ft/2 THEN 21302209 ! l l t t l l t t l t M t t l l t t l t t t t l t t M t l t l l H t t t t M f M t l l l t l t l t l M l l t t t t l t M I t2210 R E H t t t l l t t l t t l t t t l t t l t t t l t t t lM t t m TERMINATE ? t t t l t M I M I M t l l t l t t t2230 INPUT 04 tPRINT’ ; NANT ANOTHER OUTPUT (Y/N>? ' l I*U T At2230 IF A4*aYa THEN 14302270 IF A4<>aNa THEN 22302290 INPUT a ANOTHER INPUT IY/NP *|A t2310 IF A4-aYa THEN SO ELSE 23702329 ! t t M t i m m m t m i t t m t i i m m i t m m t t m m t m t m t i m t m2330 i i i i m m m i t i M t u m i m t t t i i t t ca icu ia t* M i i t t u c t t m m t t i t2340 PRINT aNA* of Output f i l t t fo r •(O fIL It * a t <M0H>, (I.GON), <t.HCP)a2341 PRINT aor <cr> to su p rm output of a rtCDfd '2342 INPUT aADM? a|0FILI i INPUT aGON? *|DFIL14 t INPUT aNCP? a|DFIL242330 PRINT 'NAME OF E(u) FILE a t < i»n.FFT> ' t INPUT 0FIL342351 IF DFlL34»aa THEN 60T0 2430 2332 OPEN DFIL34 FOR INPUT AS FILE 122334 FOR 01*0 TO N/2 i INPUT 12,01(01) iHEXT 012340 FOR 01*0 TO N/2 iINPUT «2,R2(B1) iMEXT 012430 FOR U1*0 TO N/22430 H*Rt(UX)tRl(UX)+R2(UX)IR2(U1I 2470 IF H*0 TKN 2330 2490 BF*(11 (UX)tRl(UXHI2(UX)IR2(IA))/H I
!l2 tU l)-(12tU l)tR l(U X)-IU U l)tR 2(U l))/R 2492 11(UX)*IF tl3(U l)*SQR(ll(U l)tli(UX)+12(UX)tI2(U l))2S30 NEIT UI 2332 1 N*2IP1/PN2334 ! FOR U l* l TO 311 i I l tU l) * l l lU l) / IU l lN ) i NEIT Ul2340 INBTP1*1 iF8TPTl*0 iL8TPTl*N/2 ! 8 ttp at i t and f l r c t h irton ic fo r output2349 IF DFILf*” TKN 2339 ELSE OPEN OFILI AS FILE 132330 PRINT S3,13(1X1 FOR IX*FSTPTX TO N/2 STEP INSTPl2331 CLOSE 13
144110
6

198
2539 IF S F IL tt* " THEN 2564 ELSE OPEN OFILIt AS FILE »4 25*0 PRINT *4, I I (IX) FOR U-FSTPTI TO LSTPTX STEP IN8TPX 25*1 CLOSE 1425*4 IF 0F I12*"" TICM 2370 ELSE OPER DFIL24 AS FILE 15 25*5 PRINT 15,12m ) FOR IX-FSTPTX TO LSTPTX STEP INSTPX 25** CLOSE 15 2370 CLOSE 122300 INPUT *NMC OF NIN INPUT FILE *jDFIL«2381 IF DFILIO** THEN WTO 1302340 END ! ---------------------------END OF MIN2*04 ! t m i m m t m i m m i t i t i m i m m i i i t i t t t i m t m m m i i i m t i 2*10 ! t m t f i t i m m i m t i t i i m m t m s i t r m r u i ro u tm m m t t m i2*30 n»o2*31 FOR N I'I TO Lt iNTI»2A(N I-l) I
I IF (IX RND NTX)*NTX TKN YX>(YX OR 2M LI-W ))2*80 NEIT NX 2770 RETURN
APPENDIX 9
IIT IOT.MS
0 ON ERROR 60TD 290102 ! Prograti LINFLQT.MS p lo t on a roctangular coordinate ayatea 4 ! several aota of XY data f i l e t . X ia Indopondont variable and ia 6 ' defined in subroutine 2900. Y valuta aay bo transforaed in aub- 8 * rout in * 2800. Autoaatic acaling according to valuta in th i f i r s t
10 ! data art ia accoopliahtd by aatting BZ*)(for a) , 2<for y ),3 lfo r x,y)12 ! Other valuta fo r BX r t t u l t in acaling according to IHAI,ININ,YHAI,14 ! YHIN. 10,YO a rt the coordinate! fo r the o rig in of the p lo t.14 'IB ! SUBROUTINE LIST!20 ! AXES >1000 SCALE >150022 ! NENCURVE>2500 VTRANS-280024 ! DCFX >2000 PLOTXY-300024 ! Tills version, LINPL0T2, haa been iaprovad to take i t t a t i t r to tram fora 27 ! data. Data input haa been tovid ina id t Bub2800(y-tranaforeetion>. This 2B t a ll out uhich contain sort than one array of data u ith a cotton x*axi» to 20 ! b t t ia i l y plotted la t t FNASAPP.BAS). Alao, th t *-in c re t*n t value can bt30 ’ input fro t the keyboard a i '1 / ix , where xx i t nuteric.31 ! end of coetenta50 ' conatanti51 ! 40 BX>21 f Autoaatic acaling l*x , 2*y,3*x4y80 YHAI*1.00000 tYNIN-0.00000
100 XNAX-0 iiniN-Q 110 10*70 iV0*50 tXLEF-0120 DIN 1(2048), Y(2048)125 130 ! ta in prograa 1*0 '
150 SOSUB 1000 140 SOSUB 2500170 IF (B2 AND 31)00 THEN SOSUB 1500 180 SOSUB 3000190 FILL(72,449,740,470,0) (LOCATE 0,7 (INPUT " ( M200 IF M O " TICN SOTO 250210 SOSUB 2500220 SOSUB 3000230 FILL(72,*49,740,470,0) (LOCATE 0,7 (INPUT " |B t240 IF B M " THEN SOTO 210250 END990 ! I I I M M I t M M I t t l l t t M t t l M t l t M M t l t t l t t t l t t t t l t M t t l t t t t l t t l l l l t t t t t t t l991 ! IttttE n d of ta in prograa U t t l t l l l t t l t t l t t l l f l t t m t t t l t t t t t M l t l t t l l t t l l992 ! I I993 ! III!(SUBROUTINE 'AXES' t t t M M t t t l t l t l l t l l t t t l l t M t t l l t l l l M t l l l t M t M I t994 ! i m m t m i t t t i t i i m t t t u m u m i t t m m m H i i t i i t t n m i t m i i t t i t i995 !1000 CIS1010 IF (BX AND IX)>1 THEN SOTO 12501020 PRINT 'Axe* i 1*440 pixels Y-400 p ixels '
199
200
1030 INPUT * 1/PH- fim dum ta l i incrtaanti ENTER PN *(N0VAR*1040 MINT ' ININ- *|ININ1094 INPUT * ENTER nuabtr of harwmici of 1/PN *|N1052 IF LEFT(N0VMt,2»-al / ' TIEN PN»l/VAl(RIWT(N0VAR9,3)> ElSE PN-VAL(NOVARI)1034 XLEF-ININI033 USUI 20001040!1070! Ora* a m 1010 CLS1090 LINE(10-10,TO,10+440,Y01 tLlNEdO, YO-lO,IO,YO+40CI 1100!1110! tcala x « i i 1120 DELI-N/PN1130 IF XNAK-IHIN THEN XNAX-XHIN+KLI1140 XINCR-440/ (INAI-IHIN) iTINCR-44 iSUlINC-TICR/51130 TCO-VO IICO-101140 TEnUCQ-30,YO-30, HUM (ININ))1170! labal x axis 1110 FOR IX-0 TO 9 1190 FOR KX-1 TO 51200 1CD-IC0+SUBINC iLINE (ICO,TO,ICO,VO-3)1210 NEIT KZ1220 LINE!ICO,YO-5,ICO,Y0-10) iIP-((XCO-IO)/IlNCR)+IHIN1230 TEITIIC0-35,Y0-30,NUNI(XP>11240 NEIT U1230 IF (IZ AND 211-2 THEN UTO 1400 1240 !1270 ! tcala yax ii1280 YI NCR-400/1 THAI-TNI N) tTI NCR-40 lSUHNC-TINCR/3 1290 !1300 ! label f ax it1310 YCO-YO IICO*101313 TEITt10-30,YC0-20, . ,1,111320 FOR IX-0 TO 91330 FOR KX-1 TO 31340 YCO-VCO+SUIINC iLlNE(IO,YCDt IO-3,YCO)1330 NEXT KX1340 LINE 110-3, YCQ.IO-IO.YCO) |YP-((VC0-Y0)/YINCR1+YNIN1370 TEXT (10-30, YC0-20, NURO (YP 1,1,111310 NEXT IX 1390 !1400 RETURN1490 ! m t t m m m i t m m M m m i i m t m t t m i m m m t t m t i i i M i m i t1491 ! ttttlEND of Mbroutina * AXES’ U t l t l t l l t t l l t t t l t U l t t l t l M t t t l t t l M t t t t1492 ! t i l t1493 ! mtfSUBRDUTlNE ’ SCALE' I t l t t t l l l l t l t t l M t l l t l l t M t t t l l t t l l t t l t t l t t t I M1494 ! t t i i t i t m m t i i m i t t i M i m m t i m m i t t t t i m t m i m i m t m m m1493 !1300 IF (BX AND 11)01 THEN 1B50 ! do tha fo i l w ing i f f * flag i t on1310 INAI-1E99 HNIN-IE99 1320 !1330 ! find XHAI.XHIN 1340 FOR IX-0 TO N-l
2261

2011530 IF ItlXKXHIN THEN XNIN-IUXIISM IF Klimtttl THEN XHM«X(IX)1370 NEXT U ISM !1590 ! got scaling fictori for x ails1000 8I«SW(1MI) iIMI'AIEUMI) lT1-L0610(IHAX)1010 IF TKO THEN T1»INTITI-1> &BE T1«INTIT1)1020 T1M0ATU 0W !1040 J I*01050 NHILE T11JKXMX iJ W I+ 1 i NEXT 1000 !1070 IF SX<0 THEN JX«JX*1 10M IHAI-TIMKSX 1090 !1700 SX*SSN(IHIN) iXHIN-ABS(XHIN)1710 T K K lO tlH IN )1720 IF TKO THEN T1*INT<TM) ELSE TI«INT(T1)1730 T1»10*T 11740 !1730 J IM1700 NHILE T1IJK IH IN iJ IM I+ 1 i NEXT 1770 !I7M IF St>0 THEN Jl'JX+1 1790 lNIN>TltJXISX 1800 !1810 StBlX MU -21 ! Turn off sutwcilt x flig1820 XINCR*040/ (XMX-IfUN)1821 !1822 TINCt*04 lEU IINO TI NCR/31124 VCO*TO iXCO*XO1820 TEIT(XC0-30l YO>3Ot NUM(IHIN)>1828 ! ltb tl i i l l s 1830 FOR I 1-0 TO 9 1832 FOR KW TO 31834 XC0*XC0+SU8INC iLIK(IC0,V0,XCD, YO-5)1830 NEXT XX1838 LINE (ICO, YO-3, ICO, VO-10) tIP>MXCO-IOmlNCR)+XMH1840 TEXT 1XCO-35,VO-30, )1842 NEXT I t 1M4 '1890 IF (IX Ml 21)02 THEN 6DT0 2200 1 do thi following iff y flag is on 1800 YHAI»-1E99 iVNIN>tE99 1170 !18M ! find VMI(YNIN1890 FOR IIM TO N-l1900 IF VdlKVHIN TKN YHIN-VMXI1910 IF Y fltD Y IM I TKN YM I>V(IX)1920 K IT IX 1930 !
43
2021940 * {it scaling factors for i aiis1930 SI*S6N(YHAXI iYHAI*AtS(YHAX) IT1 »C0610(VIMI>1940 IF TKO THEN TKINT1T1-I) ELSE TMNTtTl)1970 T1«10AT1 1910 t 1990 Jl'O2000 NHILE THJKYKAX iJZ>JM tNEXT 2010 !2020 IF SK0 THEN JX*JXM 2030 TM I-T ltJ IIS t 2040 !2030 SX*S6N(YHIN) iYHIN*AIS(YNIN)2040 T1«L0610(YHIK)2070 IF TKO THEN Tl-INT(Tl-l) ELSE T1*INT(T1)2000 T1-10-T1 2090 f 2100 JX-02110 NHILE TIIJUYMN i HEIT2120 !2110 IF SX>0 THEN JS-JX+I 2140 YHIN*TJtJXtSX 2130 •2140 Bl*IX AND -31 ! Turn off autoscala y flag2143 ! acala yaila2144 YINCR*400/ (YHAX-YHIN) (T]NCR*40 tSUIINOTINCR/3 2140 ! labal y t i l t2170 YCO-YO iICO-IO2172 TEXT(10-30,YCO-20, . ,1,1)2174 FOR 1X*0 TO 9 2174 FOR KX-1 TO 32170 YCO-VCO+BUIINC tLINE(10,YCO,10-3,YCO)2100 NEXT KX2102 LINE(10-3,YCO,X0-10,YCO) tYP>((YC0-Y01/YlNCRKYHIH2104 TEXT(X0-30,YC0-20,NUHI(YP),1,1)21B4 NEXT IX 2190 !2199 !2200 RETURN2490 ! M M t m t m i m i u i i t i i t m i t m t m m m t m m i t i t i i t n m i t t m i n i2491 1 fttltENO of Mbrouttna ‘SCALE’ t t t t l t t t t t l t t l t t U t l f t t l t t l t t t l U t l t l t M t2492 1 M U t2493 ! ttlttSUlRDUTINE ’ NENCURVE’ t t l l l t t t t M l t t l t f t l t t t l l t t l t t t t t l U l l t M I M t t t2494 ! t l t t f t f t t t l l t t l t t l M l l t t t t t t l l f t l t l l t t t l t t f l l t t l l t t t l t t t l t t m t t l t t M M t 2493 !2300 FILH72,449,740,470,0) ilOCATE 0,74
(PRINT *l/PN*fundas#ntal r Incrmnt, ENTER PNKcD-'jPNj’l'it (INPUT "(NOVARA
2301 IF NOVARA*" THEN 23202302 IF LEFT(NOVARA,2 )* '1 /* THEN PN*1/VAL(RI6HT(NDVARA,3)) ELSE PN*VAL(NOVARA) 2320 IF PN-0 THEN SOTO 23002330 '
9780

2q:
2540 FILL(72,449,760,470,0) (LOCATE 0,71(PRINT ‘NuNor of point! *| I H0»UT "(NNEM
2550 IF NNENOO THEN MNNEN 2560 '2570 FILL(72,449,760,470,0) (LOCATE 0,76
(MINT 'I valuo Tor ftrot point Kcr>-*|ILEF( tlMPOT "|N0VAR4 2500 IF NOVARfO*' THEN XLEF*VAl(N0VAR«l2505 IF N>NNEN 00 PN-NPN 00 N0VAR4O" THEN SOSUB 2900 ! dtfiM * valutt 2590 !2600 FILL 172,449,760,470,0) (LOCATE 0,76
iINPUT 'An of input data flit '(N0FIL9 2602 ACHDX*02605 IF NDFILI-'NEN' THEN AChDX*l2606 IF NDFILI«aLINE* THEN ACNDZ-2 2600 IF ACWX«0 00 ACKDX>2 THEN 26102609 ON ACH01 SOTO 10000,100502610 IF NDF1LM" THEN SOTO 2600 ELBE DFILI-N0F1LI 2660 603UB 2000 ! tranifori y valuta2600 0111(72,449,760,470,0) (LOCATE 0,76
(PRINT *ChooH total 1) 2) 3) 4) 5) 6) 7) 8) J in** iYCD«4572602 IC0-22J iF ILL(ICO-1,YCO-1,IC0+1,YCD+11 2604 IC0«268 iLlNE(ICO-2,rCO,IC0+2,YCOl I LINE(ICO,YCO+2,ICO,YCQ-2)2606 ICO-314 I FILL IICfl-2,VCO-2,ICO+2,YCO+2) iFILLIICO-I,YC0-l,IC0tl,YC0+l,0)2600 IC0»359 (LINE(ICO-2,YC0-2,IC0*2,YCO+2) ilINE(lCO-2,VCO*2,ICO*2,YCO-2)2690 XC0*4O4 iFILL(IC0-2,YC0-I,XC0+2,YC0+1) iFILLIICO-l,YCD-2,IC0*I,YC0+2>6
ILINE(ICO,YCO-J,ICO,YCO+3) I LINE(ICO-I,YCO,IC0+3,YCO)2692 XC0-449 iLlKUCO-3,YCO,ICO,YCO*3) (LINE(IC0-3,YCO,ICO,YCO-316
|LINE(1C043,YC0,IC0,YC0*3) (LINEflCO+I,YC0.IC0.YC0-3)2694 XC0M95 ittLlPSEUCO, YCO.ICO+1, YC(M) i ELLIPSE (ICO, YCO, ICO*4, YCO* 1) 6
(FILLtlC0-l,YCD-t,IC0*l,YCO*]) iYCO>0 iIC0*0 2696 LOCATE 0,63 (INPUT *i'| TDKIK 2698 IF TOKHX>0 THEN 60T0 26002700 IF TOKHZOO THEN TOKNX-T0KRI2701 !2710 RETURN2790' t t m i t m i t m m M t m t m t t m t t i m t m m m M i m m i m i m m n t2791 ! ttttEND of subroutint 'NENCURVE'ttttMttttttttlttlltttttlMtllMMtMttl2792 ! tlttBagin NENCURVEtYTRANS tmttttttttlttltttttlttlltllMtlttMttllttMt2793 ! (Ill*2000 REH i aubroutint to tranifora y valuta btfort plotting2005 HAT Y«IE02006 OPEN OFILf FOR INPUT A8 FILE »l 2807 INPUT II Y(Il) FOR IX«0 TO N-l2111 close at2050 I in u r t tht dtalrtd transform ion algor itha h trt2090 REN2091 RETURN2093 i t i i i M i m i m m i t i t m t t t m t t M m t m t t m t m t m m t t m m m i m2094 ! ttttlagln NEKURVEiOEFI MttltttlUtltlttttltttltttUttltttUttltttltttt2095 ! t i l l !2096 * Dtfaolt io to dtfina I(II) ao II/PN

204
2900 *2950 XtIl>»ILEF*I,0/PNIIX FOR IX-0 TO N-l 2915 !2990 RETURN2991 ! i m m t t m t m i m t m m i m t m i m i m i m i m i t m m t m i m m i i2992 ! IMttEND of Mbroutlnn aisoctitid With 'NENCURVE’tit) Mill ttttt till lilt2993 ( t t m2994 ! IHIBE6IN SUBROUTINE 'n.OTIV’ttttlttlllllfltlflllltttimitttllttHtlltt2995 t t t t t t3000 FILL172,449,760,470,0)3005 IF TOKNI-O THEN 36003006 IF T0KNK0 THEN PHOOX-2 ELSE PHOOX-I3007 TOKNX-AISITOKNX)3010 ON TOKNX 6OT0 3040,3110,3260,3330,3460,3500,3180,3400 3020 !3030 ' ■qutrti3040 FOR Il-O TO N-t3041 IF YUIXYHIN OR imxiHIN THEN SOTO 30703050 ICQ-IO*<IIII>-IHlN>tlINCRtYCO«YO*<YllX)-YHIN)tYINCR3060 FILL(ICO-1,YCO*1,ICO*1,YCO*t,PN0DX13070 NEIT IZ3080 SOTO 36003090 !3100 ! crown t3110 FOR IX-0 TO N-l3111 IF YIIIKYHIN OR XIIIK IH IN THEN SOTO 31403120 XCO-IOXXIID-ININIIIINCR iYCO»YO*(YUX)-YMN)IYINCR3130 LINE1XC0-2,YCO,XCO*2,YCQ,PNO0X)(LINE(ICO,YCQ-2,XC0,YC0*2,PNQDX}3140 NEXT IX 3150 SOTO 3600 3160 !3170 ! f t i r i3180 FOR IX-0 TO N-l3181 IF YdlKYRIN OR X IIX IR IN TtCN 60T0 32203190 lCO>XO+(X(IX)-IHIN)tIINCR jYCO-Y0*(YIIX)-YNINUYINCR3200 ELLIWIXCO,YCO,XCO*l,YCD*4,RM8X)iELLIPSE{XCO,YCO,ICO*l,YCO*l,PNODX)3210 FILL(ICO-1,YCO-1,ICO*1,YCO*1,PHODX)3220 NEIT IX 3230 SOTO 3600 3240 !3250 * optn tquarn3260 FOR IX-0 TON-13261 IF YdXKYHIN OR XtlXXIHIN THIN SOTO 32903270 ICO»IO*(IdIMIUNUItNCR |YCO«YO*(Y(IX)-YNIN1IYINCR3280 FILL(XCO-2,YCO-2,IC0*2,YCO+2,PHO0X>IFILL(ICO-1,YCO-1,ICO*1, YCO*1,0,PRODX)3290 NEIT IX3300 SOTO 360033101

205
3320! cross#* i3330 FOR 12*0 TO N-t3331 IF YdXKYHIN OR XdXKXHIN THEN SOTO 33403340 XCO*XO+<IdX)-XRIN)IIINCR lYCO-YOKYIIXI-YHINllYINCR3330 LINE(ICO-2,YCO-2,1C0+2,YCO+2,PR08IHLINE(ICO+2, YCO-2, ICO-2, YCO+2,PHODX)3340 NEXT I I3370 SOTO 34003380 !3370 ! lint3400 ICQ«I0+(X(01-IRINUIINCR tVCO-VO+ 4V(0)-YHIMttVIHCR3410 FOR IX*1 TO N-23411 IF YdXKYHIN OR XdXKXHIN THEN 60T0 34403420 ICQl*IO+(IdX)-XHIN)tIlNCR iYC01*Y0+(YdX)-YHIN)IYINCR 3430 LINEUCO, YCO, IC01,YCOI,PltODX) i ICO* ICO I tYC0*YC01 3440 NEIT IX 3443 SOTO 3400 3440 !3450 ! diaannd 3440 FOR IX*0 TO N-l3470 IF YdXKYHIN OR XdXKXHIN THEN GOTO 3490 3473 ICO'-XO+UdXI-IHlNllIINCR iYCO*VO+(YdXt-YNIN)IYINCR 3480 FILL(IC0'2,YCO-l,XCO*2,¥CO+l,PRQDX)iFlLL(XCO-l,YCO-2,XCfl+l,YCO+2,PHOSX)4
111 HE (ICQ- 3, YCO, XCO+3, YCO, PHO0X11 LI NEI ICO, YCO-3, ICO, YCO+3, PHODX)3490 NEXT IX3491 GOTO 3400 3493 !3499 'optn diaaond3300 FOR 11*0 TO N-l3310 IF YdXKYHIN OR XdXKXHIN THEN GOTO 1340 3320 XCO*XO+(XdX}-XRIN)tllNCR iYCO*YO+lYdI)-YHIN)|YINCR 3330 LINE(XCD-3,YCO,ICO,YCO+3,PHODX)iLINE(ICO-3,YCO,ICO,YC0-3,PHODX)1
ILINE(ICO+1,YCO,ICO,YCO+3,PNOOX)iLINE(XCQ+3,YCO,ICO,VCO-3,PHODX)3340 NEXT IX 3400 RETURN9090 ! tlttt9091 ! 88889END of lubrwitlfl* PLOTIY tttlllttMltlMfttMHMHtlHttlltlltttt9092 ! tlttl9093 ( IIIIIEND Of SU1RDUTINE LIST MttttllttUlttMtttltmttttttttttlttlttM9094 !9093 ! IIIIMltffftit# C0MM< rotitlm IMtltMtttlltltlttlttltttMttntlMttt 9999! ItllttltClw plotting ar«888tt8t8«*888888f1888888888988880888888888988 10000 FILLdO+l.YO+l,10+440,Y0+400,0)10010 GOTO 230010049 !lltl!!DrM ■ lint using graph coordinattilMlltttMitMMItttlMMIIttl 10030 FILL(72,449,749,470,0) iLOCATE 0,74
iIIWT *11,Y1,I2,Y2,aod« for lint afIIl,YYl,II2,YY2,HH 10032 XX0FFX*10-INlNtlINCR iVYOFFX*YO-YHINIVINCR 10034 XieiXllXINCR+IXOFFI lYYl*YY18VINCR+YY0FFX 10084 X12-II241INCR+IX0FFX tYY2*YY28YlNCR*YYDFFX 10040 LINE(II1,YY1,II2,YY2,HH)10070 GOTO 230011000 ! ItltEND OF PROGRRHIttllttttlttltmtllttlltttllltMllttlMtlMMIHttl

206
29000 ! tttl2tf01 ! IM1ERMR T W r o u t iM t t l t t l l t t l l t M t t t M t t M t t t l l t t t t t l t l t t t l t t t t t t t t29009 f Ittmtllt Can't o p flic trror ttllttlttllttttltllltlllltMlttlttttl29010 IF ERLO2I04 00 ERROS THEN 2902029012 FILLI72,449,760,470,0) tLOCATE 0,76
iPOINT 0FIL4)* not found) mtar nw filanaaa *| iINPUT "iDFILI 29014 RESUME 260629013 ' t29019 tfltmtm End of flit on rod llltltMII29020 IF ERLO2807 00 ERROll THEN 29030 29022 FILL(72,449,760,470,0) I LOCATE 0,76
iPOINT *F1I» contain* only "jIJ|* pointt"29024 Y<IERRI)-0 FOR IERn>II TO N-l29026 RESUME 210029027 ! I29049 ! ItMtltttl Error condition not liatadlMH 29030 POINT 'ERROR ’|E0R|‘ in Lino '[ERL 29032 CLOSE II,12,S3 30000 EN»
*Aon»fid‘ filat for L1NPL0T.6AS
1VSTAPP.IAS 60 lt-3
2910 FILL(72,449,760,470,0)2912 LOCATE 0,7 (INPUT 'Input flit (or X '(XFILI2914 IF XFIL4*" THEN 20192915 OPEN 1F1L4 FOR INPUT AS FILE 122916 INPUT 12 XI12) FOR IX>0 TO N-l2917 CLOSE 12 iIM'V 2919 IF X40T THEN 2912 2930 REM
IPKtffiMS 100 !*UT MnplXRIN), logtKIWXI *|ININ,XNAI
1010 REM 1020 REN 1030 REN 1040 REN 1030 REN1990 MTO 1610 ! skip X-icaling batad on pomri of 101940 GOTO 2160 ! akip Y-acaling bittd on ponart of 102630 FOR II«0 TO N-l 2831 IF YIIDOO THEN GOTO 26332632 V(II)»YNIN-1 lGOTO 26902633 Y(IX)>L0610(A6S(Y(IX)>)2654 NEXT IX2949 IPIhl.O/PN2930 Xtm«L06tOtXLEF*lPMIIX) FOR IX>0 TO N-l

207
UHMfP.tffl100 INPUT Mog(XHIN), log(XHAI) 'fIHIN,XMI
1010 «QI 1020 REN 1030 REN 1040 REN 1030 REN1390 BOTO 1 BIO ! it ip l-tciling butd on pottri of 10 2049 1PN-1.0/PN2930 X(lll-l08I0ULEf*IPMIXt FOR IX-0 TO N-l
LMWP.IM1940 60T0 2100 ! skip V-tciling buri on poMri of 102830 FOR IX-0 TO N-l2131 IF YUXIOO THEN WTO 28332832 V(IX)-VftIN-1 ifiOTO 28902833 Ytill-L0610(ABSIT< 1X1))2834 NEIT IX
jm w ix c
AV8CQPEA.IA8
10 ON ERROR 60TO 1000 20 BEFINT IHI30 DIN IN(3SO),LFP(4),TOT(3H)fYOFFR(3U)tll£TOTI204B)fIRECI(B)31 MTA 0NE,TNO,THREE,FOUR,FIVE,811,SEVEN,EIGHT32 REU IRECt(II) FOR 11-1 TO S40 LFP(l)»23ilFP(21«2lLFPi3)«0iLFP(4)*0 50 K0M>>>iITN0-'<tl£MS>R5tRN«RiL>-Cl«t4tl01)tCNRI(13Xh[18 70 At** AV8C0P5.BAS colltctt data fro* 1EK488 oscilloscope, averages a* BO M*’nlKtil nueber of arrays, displays results graphically I saves*00 CO»*it In a 2048 point array sequential with previous results to*01 DM'give a specified nueber of records par file, *100 PRINT AO iPRINT BO (PRINT CO (PRINT H|10105 PRINT (PRINT I
*Bata coda Is *|DCODO|* | if you eish to changa, edit lino 50*110 PRINT (INPUT 'Nueber of arrays to ba averaged *|NilI RN>N 0
|RINCR*1.5*25/N 115 INPUT 'Nuobar of rKords per file *|NREC 120 CALL SVSOEMfA,stlU6B?B,2,0T 0,BT1125 CLS iPRINT (PRINT 'Bat scope and hit any lay to get baseline '1*0 CALL GETKEY(AASC,A8CN,AKII,AKI2,AER1 1*1 IF AEROO THEN GOTO 1*0 109 !200 CALL BREAD(A,IK(l),*92,13,13,0)201 CALL SY8FUNC(*,LFP(D)202 G08UB 9000 205 !210 PRINT 'Naea of 'tNRECt* record file') (INPUT DFILt 220 DFIL*«DC0D4*DFIL*tITNS (OPEN 0FIII FOR OUTPUT AS FILE 13 224 INPUT "Y scaling factor or 0 far no scaling *|Y8CALE 22* IF Y8CALE-0 THEN YSCALE-23 228 Y8CALE*YBCALE/(2SIRNI250 PRINT Ll|'strike any key to begin data acquisition*252 CALL 6ETKEY(AA8C,A8CN,AKB1,AKI2,AER)253 IF AEROO THEN SOTO 252254 as iMIGI*MECt5t2 (KBI61-0255 FOR IRECM TO NREC 2*0 NAT TOWER2B0 FOR 1-1 TO N300 CALL SREA0(A,lNtli,*92,13,l3,0)320 CALL SY8FUNCI*,lfP(l)l340 MOiPRWT lgtIF LBYTE-2 TKN GOTO 3803*0 K>K»1 iTOT(K)■TOT(X)* IIN(LENS) AND 253Z)380 H1-LEN6 iRA-LfMG+25*400 FOR J«NI TO NA tKHCHiT0T(K)>m(K)t((INMW2S*l AM 2551)420 Mtv|*TOT«i»TOT(K>*(lNIJ) AM 2531) iNE3T i 440 NEIT I
200

20?490 LOCATE 0,0 iPRINT * Record fteaber *t 1KCKIKC)j■ coiplete AM LINE(9OMI,AINCRtT0T III),91*11, AINCRtTOTtll+l)) FOR II»t TO 911 409 NAT TOT-TOT-YOFFA 4M HAT TOT-IYICALE) ITOT440 FOR IZ-1 TO S12iKIIGZ>KIIGX«ii6IGT0TIKI16X>«T0T(II)iNEIT IZ 449 REIT IREC440 PRINT 63 IIGTOT(Il) FOR 1X-1 TO Nll«900 CLOSE 13•00 CLOSE 03t PRINT 'E-endi C«collKt dit« '020 CALL GETKEY(AA8C,A8CN,AICI1,AKI2,AER>840 IF AEROO THEN GOTO 020 040 IF AABC*A7 THEN GOTO 210 880 CALL BYSCLOBE(A)400 ENO1000 PRINT 'Error *|ERRf' In tina 'jERL1010 CLOSE 11,12,03,141020 CALL SY8CL0SEI4I1030 GOTO 4000444 !8449 !6444 f 6447 !8448 !6444 ! Subroutine IOFF g»t loffeet Y offset, length end velue of header 4000 DATAM"4020 FOR I1-1 TO 100 4040 AMCVTII (INI 111)4
I IF( (LEFT(AO, ])-*!') OR (RlbUT (fl», 2)-T) I THEN GOTO 4100 4040 MTAI>MTA«tAI 4080 NEIT II4100 IF LEFTlAA.l)*'!' GOTO 41404120 L£N6*I1«2 »L8YTE»liDATA*-DATA**A4 iGOTD 41404140 LENG‘ll+2 iLIYTE*! tDATAI»0ATAI*A44140 0FF8T-04180 FOR U*LEN6+1 TO LEN6+1004200 AFFST-AFFBTH (INI II1/294) AND 2331) MINI ID AND 2991) iNEIT I)4220 AFF8T*RNIAFFST/200 iIMT VOFFA-CON iNAT YOFFA«IAFFST)IYOFFA 4240 RETURN

APPENDIX D
WHETER6.DAS
0 ON ERROR GOTO 10041 f BVHETERS.BAS— A prograa aiallar to DVHETER to colltct data pointi tt2 ! froa tha KEITHLEV 179 TIMS DIGITAL HULTIHETER. Tha output i> in that!3 ! foraat F3.2, Stapling intarvali gr attar than 0.23 tacondi ara avail tt4 ' abla. Sraphic display li pi van at acguiiition tiaa.3 !6 '7 !B !9 !
19 XLEFTX-SO iIRI6HTI»630 tYT0PX*450 |YWTHI*50is as20 DIR 5(1024), TU024), SX(IO), FP1CX(6)23 ON ERROR SOTO 100030 CALL SYS0PEN(6,*SBUSI?(,2,0,0,BT)31 OPEN *«P0* AS FILE 1740 LOCATE 0,10t INPUT 'Stapling intafval (Hcondali '(INCR 30 LOCATE 0,43iINPUT 'Nuabar of data pointti *|NZ60 LOCATE 1,15 tINPUT 'ENTER DVH rangt aitting in V or aA '(RANG62 FILL (143,433,730,443,0)64 60SUI 51070 YHAI-20000 ! Yani in aV, aA or ohat BO DI*600/NX tDT-400/(2IYNAI) iOFFS«YNAX62 FPK1(1)*4 tFPKX(2l*20 lFPKI(3)*0 |FP«(4)»4 |FPKI(3)»4 iFPKI(6)*0 90 LINE(XLEFTX,YIOTHX,XRIGHTX,YBQTHZ) iLINE(XLEFTX,YB0TR2,ILEFTI,YTOPX)100 VCOI*riOTHXi ICOX-XLEFTIi YADDX-IYTOPZ-YDOTNX) /4i IADD1*(IRIGHTX* XLEFTX) /10 110 FOR IX*1 TO 51LINE(XLEFTX,YC01,XLEFTX-10,YCOI)iVCOX*YCOI+YADDXI NEXT IX 120 FOR 11*1 TO 111LINE(ICOX,YDOTNX,ICOX,YMTNX-10)iXCOX*ICOX*IADDXiNEIT IX 130 f140 LOCATE 1,13) PRINT 'Hit SPACEBAR to coll act data any othar Itay to abort ’130 CALL 6CTKEY(IABC, ISCN, KB 1, KB2,1 EC)160 IF 1ECOO THEN ISO 170 IF IA8C032 THEN 420 173 FILL(143,435,730,443,0)177 CALL SY8FUNC(7,FPKX(1))178 .179 CALL BY8FUNC(7,FPKt(4))110 NON-TINE iT(0)*N0N190 FOR JX*1 TO NX 200 DATA!*"210 UNTIL TIHE>NON 220 NEIT230 T(JX)*TIHE iNON-MN+lNCR 240 CALL BREAD(6,8X(I),1,100,906,0)230 FOR 11*1 TO 3 iDATA«*DATA»*CVTI4(SX(IX>) iNEIT IX 233 Sl«)*VAl(DATAt)
210
^

2112*0 ICQX«0.5*0IW*ILEFTX :YC01-DYI<3(JX>^OFFS)*1101*1270 liic (xcoi, rcoip xcoi+5t rctni210 NEIT JX 290 TI«)>T(JI)-TI0) FOR JM TO NX 299 NAT S>(RAM)tB900 LOCATE l,19i INPUT *Kut of output Till ’lOfllt 305 FILL(145,435,750,495,0)310 IF OFILM'NONE' OR DFILM" THEN 420 320 OPEN BFILt FOR OUTPUT AS FILE »3330 NAT PRINT 13 SINZhPRINT 13 *T1m ordinatt* <ttcondi)'(NAT PRINT 13 TtNX) 340 CONm>"tLOCATE I,1SiPR1NT *Trpt comnti for md of filt «ESC> to Mid)* 350 CALL 5ETKEYUASC,IBCN,IC11,K12,IEC)3A0 IF IECOO THEN 330 370 IF IASC>27 THEN 410380 NCHAR9*CHRf (IABC) i PRINT NCHAR4) i COtM-COMn+NCHAR*390 IF LENICONNtKSO THEN 350 400 PRINT 13 COHHi tCONNO>" iSOTO 350 410 PRINT 13 CONNI (CLOSE »3 415 FILLt145,435,750,443,0)420 LOCATE 1,I3i INPUT 'COLLECT ion data? *(AI 425 FILL!145,435,750,443,0)430 IF A4«'Y* Ok A4>'YES' THEN 140 440 IF AIO'N* AND AIO'NO' TKN 420430 CALL SVSCLOSE(A)431 CLOSE 17 4*0 EN0500 ! SUMOUTINE to adjust telling fictor far data valun according to Rangi310 IF RANK >0.2 TKN 320515 RAM-0.01 iSOTO 330320 IF RAM<)2 TKN 530323 RAM-0.10 tBOTO 530330 IF RAMO20 TKN 540335 RAM-1.00 (SOTO 330340 IF RAM0200 TKN 3*0545 RAM-10350 RETURN3*0 LOCATE 1,13 (INPUT 'CtiQOM 0.2| 2.0) 20 or 200 fittin g 'jftAM 5*3 FILLU43,433,750,443,0)370 SOTO 310 999 ! ERROR TRAP ROUT IK
1000 IF ERL-233 TKN1100 ! PROIAILE ERRORiData out of rang* fw oattr1010 IF ERL>320 TKN RESUHE 300 ! PROSAILE ERROR) Invalid output filt naot 1090 PRINT -Error *|ERR|* in lint *|ERL i RE BUM 430 1100 SIJZI-O iRESUME 2*0

APPENDIX E
tt SU8RDUTINE LISTi tttt SIO Stria) Poll of 273 3010 SYSFUMC routint Ittt 4010 Coaaand inforaation 2310 Load tourct curui to PAR tttt 2010 WRITE routint 3000 ERROR routint tttt 1310 SAEAO rout ini 4310 Dtfint Function ktyt tttt 4010 SAVE tubprograa 3010 Takt data curvt froa PAR tttt 1020 Coaaand typi dtcision 7010 Initialiit variabltt tt
W 211J&
12 ! t t t t t t l l t t l t t t t t l t t t t t l l t t t t t t t t t l f f t t t f I t t t t t t t l t f t l l l f l t t l l l l t t l l t f t l 3 * 1 * An inttractWt toaauni cations prograa for tht FAR 273 It 4 ! t l potfntiottat, Sqm inforaation atnut art givtn but rtftrtnct to I t3 ! tt tht 273 Optration Manual uy bt nKtttary. In addition to tha PAR tl A ! tt coMandt, coaaandt such at SAVE and SYSFUMC art availablt to tt7 ! tt handlt data curvtt and to utt IEEE-488 drlvtr functiont) Mra tt8 t It prograa functions art to bt addtd in tht futurt. Alto to bt avall-tl4 1 It ablt art proctdurt routinti uhich nil 1 providt atnu dirtcttd utt tt
10 ! tt of ttiii prograa for tptcific applications, such at CV I LBV a ip ti.tl11 ! tt Tbatt PROCEDURES Mill bt addtd by uttrt at nttd for that arittt. tt12 ! tftttmttttttttttttmitmtttittttttttttttttttmitttrittmtitttim 13! tttttftttitittttttittfiimtttittmtittiitimttiitttittittiiimttttt1413 It 17 IB192021 ! t t t t t t t t t t t t t t l t t t t l t t t l t t t t t t l t t l t l l l t t t t l t t l t t l t t t t t t t t t t t t t t t t t t t t t t22 1 ifttmitttttttittmfmiiiimttitmttiitttitttttttmmtttttttmi30 ON ERROR SOTO 7310SO BOSUt 7010 f Data initialization70 CALL SYSOPENU,,#IUSI’*,2,0,0,IT) ! «tUSB?*LUN II, bi-dir., fii Itngth 90 CLS ! trantfar110 SOSUB 4310 ' Dtfint Function tiyt1» FILL(0,49,760,450,0) * Cltar SCAN aictpt ICONISO ! SOSUB 310 t Poll PAR273170 IF (SF1 AND 2)00 T)CN SOTO 230 ! It Coaaand inforaation ditplaytd?190 FILL(0,19,740,430,0) ! Cltar SCAN licapt STATUS210 SOSUB 4010 ! Print Coaaand inforaation230 LOCATE 2,18 (PRINT SPACEI(70) ’ Cltar old CHDt230 LOCATE 2,10 (INPUT ’Coaaandt '(CNDt270 CHDI»CVTIt(CHD9,134l) ' Discard I tiding,trailing spactf290 IF CNW»*X* THEN SOTO 390310 LOCATE 3,10 (PRINT *MTA( * (LOCATE 3,18 (PRINT SPACEt(SO)330 USUI 1020 ! Dtcidt coaaand typt340 IF IC1-1S THEN UTO 380 ! A PROCEDURE hat bttn chottn350 OR CTX SOSUt 2010,1310,4010,3010,3310370 UTO 1303U ON CT1 SOBUl 8010,8313 ! SOSUB list for PROCEDURES313 SOTO ISO390 CALL SYSCLOSE(l)400 CLS410 END
212

213
900 !901 ! tttitttititittittittftitiitttittttttiiitmttittmtttftfttftiittttttii902 ! iittmmimmtmtMtmimmtmttmimmmtimttttitmist503 ' tt Subroutine SPOIL tt904 ! tt Conduct! poll of PAR 273 and uaiti If PUR li not rtady to par- tt903 ! tt for* a talk. Tht conttnta of tht Statui Dytt art diiplaytd tt904 ! Ilttltttttttttttttttlttlttttttttttttttlttfttlttttttttlftttltttttltttltt907 ! tttttttttlttttttttttttttttttltttltttttttllttttttttlttlltttttttttlttttlt908 REN Call StrLai Poll and tort bits------310 CHW-'SV311 G08U6 2010 912 608UI 1310313 FILL(0,400,740,420,01314 FI(27,2)*VAL(DATAt)313 NAT IX>IER930 FOR ISPI'71 TO OX STEF -IX 330 RX>2A1SPZ570 IF FX(27,2KHX THEN UTO 430390 D1<IBPI1»1X iFX(27,2)-FXt27,2)-HI410 IF FX(27,2t«0I THEN IBPX-0430 NEIT ISPX430 LOCATE 20,10 (PRINT USING BQt, BltOXtf (PRINT USING B4t,BX(4X)470 LOCATE 21,10 (PRINT USIN6 Bit, (PRINT USIN6 131, BK3X)490 LOCATE 22,10 (PRINT USING B2t, Bl(2X)f (PRINT USING B4t, BI(A1)710 LOCATE 23,10 (PRINT USING Bit, n(3X)| (PRINT USIN6 B7I, BUT!)730 IF BX(1X1>0 THEN 730731 CNOM'ERR'732 GOSUB 2010733 GOSUB 1310734 NAITI31 tFILLfO,400,740,440,0)730 8FX-SFX DR IX770 RETURN
1000 1001 10021003100410031004 1007 1010 1011 10121013101410131014 1017 101B
t t t t t t t t t m t t i m t t t t t t t t t i t t t t t i t t t t t t t t t t i t t t t t m i t t m t t i t i f t t t f t ti t t i t t t i t t t i t t t t t t t t i t t i t t t t i i t i t t i i t t n t t t i i t t i t t t t i t t t t t t t t t i t t t i t t t ttt Subroutine DECISIONS ItIt Thii routint routti prograa flow to (a) PAR 273 cottandt, tttt fbl availablt prograa coaaand a or (c) (pacific dtfinid PROCEDURES ttIt PROCEDURES art dtnottd by prtctding tht Proctdurt naat by ’t' tttt and art addtd to tht prograa at follow tttt 1. Includt an FI CHM*‘lprDcnaat* THEN CTZ«n it at want aa dont tttt btlou. tttt 2. Nritt tht PROCEDURE ai a (ubroutint at tht and of thii pro- tttt graa.t l 3. Plact tht lint nuabtr of tht btginning of tht lubroutini in t t
tht GOSUB lilt in 11m 3B0 mch that it corrttpondi to CTX»n t lt t 4. Includt tht proctdurt nut in tht atnu lilt of tht coaund t tt l inforaation lubroutint t tt t i m t t i i f t f t t t t t t t t f f i i t t t i i i t i i t t i i t t t t t m i t t t i i t t t t t m t f t t i t t t i f t

214
1019 ! Mtl Addition of PROCEDURES if beat done through the text bdltor tttttl1020 IF LEFT(Cm*t l )> 't * THEN SOTO 11301030 CTX-1 i ia -0 1 1 WO IF CMM'LISTEN* THEN CTZ-2X1070 IF CHDO BYBFUNC* THEN CTI«4I1090 IF CnO»«'SAVE' THEN CTX«3Z1093 IF CNOO-'OISK* TKN CTX«3X1110 GOTO 11901130 REN - ....................................................PROCEDURE control lift..........1130 CTl-1 iICZ-11133 FILL(0,143,740,430,0) iSFZ*SFI AND 65532 1160 IF CHM-, tCV‘ TKN CU*2 1170 LOCATE IS, 1 i PAINT 6PACEt(80)1190 RETURN1191 f1300 ! t m t m m m m m m t t m t t m u t t t m t m t m m t m t t i i m t m t M t isoi ! t t t t t t t t t t i t m t m t m t t i i i t i i t i m i f i i t t i t t t t t t t t t t t t t t t t t t t t m t m t1502 * II Subroutine) READSUB It1303 ! It Reidt PAR 273 rtfponui in dialog. Thiu routint dot* not rtad tl 1504 ! It data pointi Iron PAR atoory ticapt tor thou accented by DCiduap >11305 ' t t cum) and DPIduap point). Tht trantlir ot curm by IDibinary II1306 ! t t duap) is accoapllihtd in a ttparatt aubroutint. Data if tint ai t t1307 ! It ASCII codt which in converted to string valuta and displayed. tt1308 ! t t t l t t t t t t t t t t t t t t t t t t t t t t t t t t t t t t t t t t l t l t t l t t l l t t t t t t t t t t t t t t t t t t t t t l t1309 ! t t t t t t t t t t t t t l t t t l t t t t t t t l t t l t t t t t t t t t l l t t t l l t t l l t t t t t t t t t t t t t t t t t t t t t l1310 ! 60SUB 5101530 HAT AWER iDATAt-”1330 CALL 8READfl,AI(IX), 120,10,13,0)1590 FOR IX»1X TO 60Z 1610 TO-CVTXt(AZMX))1615 LZ>A8CII(LEFTITf,lZ)) iRIMSCII(RI6HT(Tl,21))1616 IF L I* 101 OR LI-131 TKN Tt*' "+Tt1617 IF RI-10X DR AXM3X TKN TMTI+' *1620 DATAt«DATAt*TI1630 K IT IZ1630 DATAWVTt* (DATA*, 20X1 ! Eliainatt titra fpecei,<CA>,<LF>..1670 LOCATE 3,18 I PRINT BATA*1690 RETURN 2000 !2001 ! i t t t t t t t t t t m t t i i t t t t i m i t t i t t t t t t i t t t i i t m t t t i t i i t m i i i i m i t t t i t i2002 ! t t Subroutine) MITfSUI t t2003 ! t t Nritt routine for dialog with PAR. Ufte AX(n) an atffage array.t t2004 ! It NRITESUB if not uffd for curve tramfera to PAR tt 2003 ! It Subroutine 3010 (BDSUI) read* contente of ID retponio. Subroutine tt2006 ! t t 2310 (ILBUI) if ufed for Unary Load both to fend the BL coaaand t t2007 ! It and to tend the curve. tt2008 ! t i m t f t t t t t t l t t t l t t t f t t t t t t l l l t t l t t t l t t t t t t t t l t f t t t t t t t t t t t l t t t t t t t t t !2009 ! t t t t t t t t t t t t l t t t l t t t t t t t l t t t t t t t t t t l t t t t l t t l l t t t f l t t t t t t t t t l l t t l t l l t t t l2010 NAT AX-1ER ■ » • '+ ' iIZ-112013 IF LEFTiCNDt^lO'BL' TKN GOTO 2030 2020 GOSUB 2310 2023 GOTO 2162

215
2030 UNTIL C4«"2090 C4-HID(CHDt, 11,21) iAH<IX+l)/2I)-Cmi(Ct) 111-11*21 2070 NEIT2000 A11UMD/21I-132110 CALL SMITE tl, At (11,120,041,131,0)2130 IF LEFT(CHDt, 211»aIDa THEN EOSUI 3010 2102 RETURN2900 !2901 ! ttttttittiittitttiittiitMtttttMttittiittmtttttmtmmtfttttttm2902 ! m f t l l t t t t t t t t t t t t l t t t l l t t t l t t t t t l t t t t t l t f t t t l t l t t l l t t t t t t l t l t t t t t t l t l2903 ! If Subroutln*i BLSUB tt2504 ! It Thii routint ii sptcifically for sanding tht IL coaaand to FAN tt 2905 ! tt uith tht curvt points follouing. It ii acctsstd only through *ub- tt 2504 ! tt routint MITESUB tt2907 1 tttittftffttiitttitttfttmiitttittttifttttttitttttttttttttrttttttttftt 290B ! tttttltttttttttlltttttltttlttltttltttttttttttttttttttlttttttttltttttttt 2510 LX-LENICHDS) iC4«a*a 111-112930 UNTIL LEFTICI,!)-* *2990 CI-RISHT(CNDi,LI-II)2970 IX-IX+ll2590 NEIT 2410 NFTSl-VAUCtl2490 LOCATE 4,10 iINPUT *Natt of disk flit containing curvt points? 'jOFILS 2470 IF BFILI-" THEN GOTO 2790 2472 Cl-*1* ill»l I Jl-1 2474 UNTIL Ct«"2474 CA'ttlDtCHO*, 11,2) i CKJD-CVTIKCtl2476 IX*Il«2i JI-JI+12480 NEXT2482 C1<JW>>132484 OPEN DFILt AS FILE 442488 FOR j«4 TO NPTSI+52490 INPUT «4,CI(J)2492 NEXT 3 2494 CLOSE «42494 CALL SMITE(1,C1(1),2100,104,400,0)2790 RETURN3000 !3001 ! t t t t t t t t t t t t t t t t t t t t t t t t t t t t t t t t t t t t t t t t t t t t t t t t t t t t t t t t t t t t t t t t t t t l t t t3002 i t t i t t i i t f i t t t t t i t i t i t t i t t t t t t t t t i t t t t t t t t t i m i t m t t m t t t t t t t t t t t i i t t3003 ! tt Subroutine BDSUI tt3004 ! tt Rtads curvt frot PAR afttr ID is stnt by MITESUB and convtrts tt 3009 1 tt tht data to ailliunits. 1/E tatting is autoaatically ritritvtd orII3004 1 91 if auto-ranging is on tht data is unpacktd for I ttasurtttnts onlytl3007 ! tt si net all othir Masurtttnts rtad trut in ■)/, SIE frot PAR is ustdlt3008 f tt to dittraint if saaplts contain I valuts or not. tt3009 1 l l t t l t t t t t t t t m t t t t t t t t t t
0 1SOSUB 513010 RAT Cl-IER tNAT Y-IER iLI-LEN(CNW) iCI»a*a ill*l 3012 CALL SR£AD(1,C1(I1),4094,41,131,0)3015 AXIll)-CVTtX<aAR*) t A121)>33181

2163016 CALL SNRITEd,AXdI>,3,41,131,0)3017 CALL BAEADd,*1(111,2,41,131,0)301B ARX'VAL tCVTX*(At(11)))3010 AldXKVTttdJG*) iAl(2X)«CVT«1aAia> iKI3D-CVT»1 l*H*l+1313020 CALL SNRtTEd, AX (1X1,0,41,131,0)3021 CALL SHE ADd,Aldl) ,4,41,131,0)3022 I6AINX*VAl(CVTXI(AXdX)))3032 UNTIL LEFT(C*,1)«* '3034 C*»RIGHTtCHD*,LX-II)3030 IW M X3030 NEXT 3040 NPTBX-VAHC*)3070 IF (MI AND II)*Q THEN GOTO 32703080 Rh --------------Unpack data fro* I/E nng> in(or*ition -------3130 E0L0X*03133 FOR II«IX TO NRTSI3140 IF EOLDXHCXdX) AND “40961) THEN 31 BO3143 EOLDl-CX(lI) AMD -40901 tESCALE*CX(IX)/4090X-lX iESCALE«dO*ESCALE)/I6AINI 3100 CXIIIJMCIUX) AND 4093X) t IF CldXI>»2048 THEN C1(IX)«CX(IX)-4090X 3181 VIID-ESCALEICKIX)31B3 NEXT IX 3250 GOTO 30103200 R£R Autoranging of(, data not pact id---------------- - - - - - -3270 MT AKER3290 AIIlI)«CVTU(aSIa) iAl(2l)-CVT»1I’E*) iAt(3X1*131 3310 CALL SMRITEU,AX(IX),0,041,131,0)3330 CALL SREADI1,AXttl),3,042,131,0)3330 SIEI*VAL(CVT10(AIdX)) )3370 IF (BIEX AND 1X7-1X THEN GOTO 3490 3450 NAT V-C13470 GOTO 30103480 Rh -------------- Data ia currant) convert to ■illiaaps............ - ................3490 NAT AX-ZER3910 AX(lX)*CVmtaI/') i AXl2X>*CVT*X(aEa) |AX(3X)*13X 3530 CALL SMRlTEd,AXdX),0,041,131,0)3950 CALL SREA0d,AI(JX),S,041,131,01 3570 E»VAL(CVTX*(AXdX)>> iEBCALE-dOAE)/IGAM 3590 NAT y-(ESCALE)ICI 3010 RETURN4000 •4001 i ititttmttitttmittttttmtttmtmmmttttmiittttttmmtitttt4002 ! iiittiittttiittmtttiiMtmititiitttiiimiiitmiitttttttttmtmit4003 ! It Subroutinii SAVE It4004 ) It This routina eill writac either to the non!tor or to ditk and It4005 ! II *111 save (a) the latest BD curve, (b) the latest DATA* variable It 4000 * It or (c) a oettage (roe the keyboard. II 4007 ! Mtltttlltttllttllftlltttttttfllttltltltlttttlllttlltllltllttttltllllll4000 ! t t t t l t t n t t t t l t t t t t M t t t l l t l l t l t t l t l l l t t t t l l t l t t t l l l t M t t l l t l t t l l t t l l l l4010 FILUO, 145,700,450,0)4030 8F1*BFX AND 327041 t Input proapt and coooand info oil4050 LOCATE 0,104091 INP1TT 'Nsm o( output filel'SCR'.’tSEROO') or ’X’ to ret to oaln *|DFIL* 4070 IF DFILI>*I* THEN GOTO 3010

io - i f a io.< J lA S H O M ft . J l U I f l , tlUfQd, 1NI88 < 1*9 31*301 0Z lt
IAS90t*Xf 8110io*s8i*ooi*B ti‘o m id o u t
0490 0109 N3H1 00X88 i l 0010 (XM ‘X9d'XId'XZd'Xtd)A3)li39 TOT 0490
, • n u h 3 oi * h au« H t h s . m u » z *41 aivooi oooo0110 0109 N3H1 W O C /If dl 0190
xuxr*xr> * (x m in iw 0990IAS 1318 ISldtt 01 11-11 80d 0800
INMd 9090. lo t nOw»Jt|i t s u it'd , u itw 1 lO . i f £090 XI-XA8 3813 ZC>ZAS N3H1 OOKXSldN dl 0X90
IS id* I . • * * • 01 ijtnod #o jaotnN. ifUNP 01*9 31V301 0Z00 (00)933918 IN IW i 01 '9 319301 0190
.................................................................................UMJ38 “ I * * " 3 o i l * KM 0090N8IU38 OESO
I9SH » 1NIU 0080 998H 1/3*1 0160
.(ija i» j« ip zt l ai Onj a tiftN jai«3. u itu i 01*0 31*301 OESO(00)933VdS 1NHM> 01 *9 310301 Ot&O
........................................ H IP oi ib n iM pjaoqAaq o f i * ^ oofiOMW113U 0E00
9010(1 £• lNIDd 0100.................................... - ............................................ H IP 03 99190 * 3 IJ » ----------H38 0000
KW1139 00X0XI 1I3N> (XI)A t l IK IW XSldN 01 X M I 80d OXXO
X51dN>. • « * 03 «3UH»d to Jfqm i. 1(UNI> 01*9 319301 OEXO (00)933998 IN IW 1 01*9 319301 EIXO
0S40 SHSOS K3H1 .0083SI.H1IdO dl 01X0 ----------------------------------- .008380. »3 90 H IP oi iajds a )N f t 939 00X0
i t t t t m t m t i m t m i t t t i m i i i i t t m i t t i t t t i t t i m u m i i i M t t i t m t t i sozoI t 3A98 tufiMJOns u i 04COI t oi li«Afin|3» 0u;buo|«q loutinojqni 9 >0 }•■ « i f ftufM||Oj t l i X4Z099 SMS I NIK istufinojqns I I , Z4Z09 l t t l t l l t t t l t l l 9 t t t t l 11991(999199991991191199919919919999999999999999999i I4Z0
908)138 0420 XI 38013 08E0
(0*080*001 *801*0) H id 01E0 0800 0109 N3H1 .A .H * dl 08E0
(0*080*001*001*0)11Id OOCO *«*.K83>«N/A}. IDdNPUlIJO t. <>3 lufmAuv 31IW . lN l)M '0I*4t 310301 OXZO
O)40<01B0‘ 01O0'OlE0*Ol00'0!X0 80809 XV NO 0IE0 IX+X*«IV 3813 I I 311 d SV t l l iO N380 N3N1 .838.011130 dl 0410
OIZO 0109 N3H1 .Ai*9V dl 8810 ZX880 WV XdS*XJSl (0*080*001*801*0)1113 0810 IV *. X JO Z 'l »*OOio, irUNP 01 *0 31V301 0110
.pjtoqAai *oj> a l t iu t t (X) .ItO D IV l INttM 0810.IV1V0 3**3»1 (Zt .> (0 I)IV1 IN IW 0X10
, put n o 3 ,09. X1Z 8Vd 3*»3*I «OJ> lAunj ( | ) .((O D IV l INtVd 0(10. t .U l Id f l * . »3 #3UK .*(01)1*1 IN IW 0400
H Z

4730 NC1T I I 4730 RETURN4800 REM Nrita DATA! to Scrctn - - - ...............................................4110 PRINT DATA!4120 RETURN4 tOO REM Nr It* keyboard attaag* to ccrotn (radundant) -------- -4410 LOCATE 4,10 (PRINT SPACE!(40)4420 LOCATE 6,10 (PRINT •Entar ataaaga (up to 132 character*)'4430 INPUT " i MSG!4440 RETURN4450 REM Nrltf cury* to C0M1(PC)4432 REM The data ia urltton to 'SEROO' configured ai oodoa Kith th* f t4454 REN paraaatarai 1200 (baud ra tt),7 (data bita),o (odd parity) and4453 REM ona atop bit. Uting any PC COM progru data can bt lived to PC4454 REM uiing 'COMI'4462 UN FPIClIb)4464 OPEN 'ISEROO' AS FILE 034466 FP« (1) >20t FPKZ (21 «81 FPtCX 13) >22( FPK1 (4)>8*64*141FPKZ(3)*0 446B CALL STSfUNCf3,FPK1<1M 4472 RETURN5000 !5001 ! ttttiittttttiitttiiitimiitimttittfmiitttimiftttittmiftiittim 3002 ! ttmimmmtttmitmtttmtmmttttititmttmitttiimittttiti5003 ! II SubroutInti FUNCSUB It3004 ! tl IEEE-488 driver function* include* aanu of function*. Function It 5003 ! It packet* (FKn)) ara dafinad in aubroutia* DATASU8 It3006 ( ttltttlttlttttttttlttllttlttllltllltlltttltttlltttltttltlttttttttttttttl5010 LOCATE 18,1 i PRINT SPACE!(70)5011 LOCATE 18,1 i PRINT ‘ STSFUNC not currantly availablt * iNAITISO)5020 RETURN3300 ! 5501 i itittmtiimiittittiittmtittmtmttmtmtmimititfimtitm3302 ! IttttllttltttltlltlltltttmtllftlltlltttttltMtltlltttlltttlltltltltlt 3503 ! It Subroutinai DISK II5504 ! Raad* PAR coaaand* froa a tait filo or if th* *option i* u**d ft3505 ! craataa a tait fila fro* thia aubroutin* II3306 ! ittimtmtmttttttmtmttmfttmmttmtimittttmifttiitim5510 SFX>SFX AND 32764Z ! COMMAND AND STATUS INFO OFF3312 FILLtO,44,760,430,0)5320 LOCATE 2,0 (PRINT SPACE!(B0> ! Cl tar old CHD!5323 LOCATE 2,0 (PRINT t
’Enttr nan* of fll* to b* raad, to crcata a nau fila or <cr> to quit'3333 LOCATE 3,0 (PRINT SPACE!(80) (LOCATE 3,0 (INPUT 'CoMand filai '|C0MFIL45540 IF CONTH.!***' OR LEFT1C0NFIL!,1)>'*' T*N 5400 3545 IF COMFILM" THEN GOTO 3800 5550 OPEN CONFILt**.PAR* FOR INPUT AS FILE 84 5553 CNRM**5360 UNTIL CNDO-'END*3363 INPUT 14 CMD!5370 G08UB 2010 UNLESS CND!>aEND*3373 NEXT

219
3378 CLOSE 14 53C0 SOTO MOO5*00 LOCATE 3,0 (PRINT SPACE*(BO) (LOCATE 3,01
tINPUT 'Create file aaaed ‘iCONFILI 5*04 IF CQHFILH" THEN 5800 5*05 OPEN COHFILIs'.PAR* FOR OUTPUT AS FILE 14 5*10 LOCATE 4t3iPRWT *
'Entar PAR273 action cooaands only. Entar 'END' to quit*5*14 CUM***5*13 UNTIL CHD*«*END'5*20 INPUT * 'jCHDt i PRINT 84 CM*5*25 NEXT 5*30 CLOSE 14 5000 RETURN MOO !*001 i tmtitimttMttttitmttiittmMtmtmmttttitmtttittittitttm *002 ! ttiittttimimtmmtittittttttitiiiititmimttmttmimtttiift*003 * tl Subroutine COHINFO II*004 ! I* Print* inforeation about coaaands that can b« used in tt*005 1 tt this prograa. II*00* ! mtiiiiiimtmmitttimmmtmtmiittiiiiimmmittimiiit *007; timmimimtMtmttttmiitmtttittimtmtmmmtttttMmt*010 A10*>SPACEI(10)*030 LOCATE 5,1 iPRINT A!0*('Th* following coaaands art available**050 PRINT *070 PRINT A10t| **040 PRINT A10*i**110 PRINT AlOt;'*115 PRINT A10*|**11* PRINT AlOt)1 *130 PRINT A10t|'*130 PRINT AtOt)**170 PRINT AlOt*'*190 PRINT AlOt)'*210 PRINT A10*|**230 PRINT AlOtj1 *250 PRINT A10V *270 SFI-SFX DR 22 *290 RETURN *300 1*soi i iiitimtmtttHttiitmttmiitmtiimtitttmtttHitimittiimii *502 ! mimmiimitmitiiitiitiiMtmtmimtmmitmimiftmmt*503 1 tl Subroutine DEFKETS II*504 ! ft Defines convenient coaaands on F bays and nritas a aanu It*303 t II in tha consol a boi at tha bottoi of the nonitor scraan tt*50* ! It Kays art dafinad for LISTEN, ERR, REAM READE, REAMUX tt*307 ! t t l t t t t l t t l t t t l l l t t l t t l l l t l l l l l t t t l t t l l l f l t t t t t t t t l t t l t t t t t t t t l t t l t t t l l*3oe i i t t i i t t i i t t t m i t i i m i i i t i m t m i m t m t t t t i t t t i t i i i i i t t t i i t i t t m i i*310 OPEN '8KPD' AS FILE 13*330 IK1X1-14X i II(2X)»3I iIX(3X)>0 ! FPKT to clear old F-bay tabla *340 CALL STSFUNCI3,IX(1I>)
(a) PAR 273 coaaands, using spaca as daliaitar betMen*values (see PAR 273 operation esnual1*
(b) LISTEN (Function 1) raads dialog rotponsa of PAR' RISK loads sari as of PAR 273 coaaands fro* a*
usar crsatad ditbflla.'SVSFUNC accesses functions available froa tha*
IEEE*4B8 driver prograa (ICNU provided)' SAVE eritas data and eeasages to ditb, Proapts*
provided* alit to aiit froa tha prograa1
(c) PROCEDURES'tCV tcyclic voltaaaatry or Rott-Schottby
i ooti990138 0*Z1
83191 0391330 31 01 S93H10 i U U 0 * t t ‘ lZ)13« 3£3£t*(£*iZ)X3i 0-tC‘ iZHJt 3£Zrt*(l'lZH 3i U l*(0 *iZ )I3 06Z1
- .............................................................................mssNdd -»* — m otu.Aptu l*djno OKI
.BUS .+ t9*l9 l 0611.auop dM«s .+I9M68 OKI
• POOJJOAQ ,+ $9*M 0611(lZ)t3398S+t9*«8 OCU
«uop «*J«3 ,+69-KI OIU jo j j i putt>03 0601•uop putaaoj ,« |« .|O I 0101
.( i ) . * * 9 0S01 1KWS - " I --------H9I 0£01
(XAOt)A M W IXI'lS 'O DU 'UW O JO 'U IM 'fO fJW 910 0(01 t i i m i t i t m m t t im t ' t m t t m i t t t i im t m i i t i m im t m i i n im i t , 1001 t l t t t t t l t tU t t t t t t l t t t t t t l l l tU tU t t t t t t tU t l t t t t l t t t l t t tM t l t l t t t t t t t t i 9001 tt am tati(«n?uf pvt it , 5001I I f)ut)ago3 taufiap 'tAtJJt swtiutatp taunwJ Ou|intt)|vi i f j tool
ansVitfO tauunojqns tt ; £001 t l t l l l t l t l l t l t t t t l t t l l t t t l t t t l t t l t l t l t t t U l l t t t t t l t t t t l t t t t t t t t l t t t t t t l i ZOOii t t t t t i t i t t t i t t i i i t i i i t i i t t i t t t i t t t t t t t t t i i t t t t t i t i i t i i i i t t im t t i t t t i i ; 1001
i 0001I l 'B B 'iO 'W W lO 'O B 'l^ 8190 £6*9
B t ' l f ' t l 'O l ' i t ' l t V W 9190 16*9 6*,Z£,9 i ,91,69,19,9 ,l? 8190 16*981 V t 9 9190 06*9
BB*68*£9'B9‘S9**9‘ZB*1*£9 9190 0£*9 £1,89'69‘69'1B,6'19 9190 01*969'89‘&9*69‘ZS‘£*t9 9190 0689
18*10'69'£'09 9190 0189Bl,69l»B,£64£ l(9 l'9 46£ 9190 0689
.............................. upas JlOSO'iUftwt tu u i* ‘tpo3ut3* Aaq i t w U38 0t89880139 0189
3901S38 0089 18 90 138*138 0*19
(Z*99*091'0*0)1113 0919(•330 1133*0(3 . I3193A,*83 .I0938.*t3 ,883.-13.‘0£*09)1131 0619
1. 90 1133-63 11090939.*63 . 30939.*£3 ,931811.« I3 .'6 t*09)1131 0£19£1 38013 0*99
<(ZDII*£)39fl3SAS 1193 6199 0«(X9+H)lli *0*(16+13H I 1199
XX 11391 (16+1)1)XI 09391 (16)11 01 t*U 903 9199(K l I lM lZ H l 0939 6199
I t 1139 0199 ((11 H I 'SlDBfllSAS 1193 0699
0*(19+MHIt l £ l * ( « + n i l l 0£9919 I IW ' (16+1)1)11 0938* ( K m 01 i n * « d 0199
(16)11*(13>II 0938 0*6918 01 11- I f 803 0169
i)uavv*|sit Aai JO) im 3 i II* (1 *)1 I ■ IZ -tXD XI1 IZ I*(H H 1 0669
OZZ

221
7301 i ftmittittttitttiitfimtittittiiMttttfttttittmtttttmmimititt 7302! ttmmtmttmmtttttmmtMtmmmimimmmitmmmtt7303 ! II EMOR TRAP tt7304 ! tt ON EMM WTO ttfldi control to 7310 whtrt the trror lino tt7303 ! tt detertlMt that conditioiti are checked, tt7306 ! tt Md there to rnuo or to torilnoto prograa tt7307 ! ttttttttttittittttimttttimiftittimitttttimmttittttmttttttit730B ! tttttttlttttttttttttttttttttttttttttttttttttttttttttttttttttttttltttttt7310 LOCATE 17,1 i MINT 'EMM *|EM|* In lino '|EftL7330 RLS*1 ! RLI*I team trror not lilted,fatal7330 IF CMOS THEN UT0 7430 ! K«C*n’t find, open (filonaat)7370 IF ERL-2484 THEN RLX-27372 IF ERL«4I90 THEN RLX-37374 IF ERL*3550 THEN Rtl-87373 IF ERL-3403 THEN RLX-97400 MT0 74007430 IF EM<>4 THEN WTO 7490 1 44«Cen’t trito to <filtnu«>7430 IF ERL*4190 THEN RLX»4 7470 WTO 74907490 IF EMO30 AW ERROll THEN 60TO 73SO ' 811*End of lilt)7310 IF ERL-2470 THEN RLI-5 ! 150-tad input fortat7330 GOTO 74907530 IF ERRO50 OR ERLO4210 60T0 7410 ! I56-0N GOTO rang* trror7570 CLOSE 13 >RLX>3 ! In. 4210, SAVE routine7590 WTO 74907410 IF ERR053 THEN WTO 7670 * t55>Hatrif in do trror7430 IF ERL*4330 THEN RLX*47450 IF ERL*4430 TIEN RLX*77470 IF RLl*l THEN WTO 7B707490 INPUT *<CR> to continue any character to end *{AI7710 IF At<>" THEN WTO 7S707730 ON Rll WTO 7870,7730,7770,7790,7B10,7B30,7830,7832,7B347730 RESUME 24307770 RESUME 40307790 RESUME 47407810 RESUME 28107830 RESUME 43207830 RESUME 44207832 LOCATE 10,10 tPRINT 'Error in opening -|C0HFIL*t* for input. '7833 RESUME 53337854 LOCATE 10,10 tPRINT 'Error in opening '(CDHFILti* for output.*7837 RESUME 3400 7870 CALL SYSaOSE(l)7873 FILL(0,0,740,430,2)7890 CLOSE 82,83,447900 END7901 !

2227902! itttttmittttttmmtttitttitttttttttttttttttttmttmtmmttttitt7903 ! t i i m t t i i i t i i t t i t t i t f i t f i i t m i t t i i i m i i i i t t t m i i t i f t m t t i t t i t t t t t t7904 ! tt PROCEDURE LIST tt7905 ! tl 0010 Trip lor undefined procedure catli tt7900 1 tt 8313 Cyclic Voltaaaetry, Nott-Schottky ttBOOO ! tttttttttltttttttttttttttttttttttttlttttttttttttttttttttttttttltttttttttool ! tttitittttttitmittttttttttttttitttttitttttttttttitttitttttttttttttttt0002 ! tt Subroutine! PROCERR tt1003 ! tt Return froa an attaapt to call an undefined PROCEDURE tt6004 ! tt tttttfttMtttiiiititttittitmttitittiimitttttttrtiitttmittiim toot ! ttttttttttmtttiitttttttitttttttttttttttttttttittitttttttttmttittm8010 LOCATE 18,1 (PRINT CHDtj* baa not bHn defined*8020 RETURN8021 !8300 ! tttttttlttltttlttttttttllttltttlttttttttlttttttllttttttttttttltttttttll8301 * mtitttittttmttttitttittitmmttttittttittittttttmimmtitittt8302 ! tt Subroutine PROC.CV tl8303 ! tt Cyclic voltaaaetry aubroutina. Parforat CV eiperiaent tt8304 ! tttha entry of potential Halts and potential taeep rate. This allowstt 8303 f tt tore convenient parameters choice than the raaplnp prograa of the tt 8300 ! It PAR 273 and a aore flexible aavtfora than the CV coaaand. tt8307 ! tt Itott-Schott by eiperiaent a are perf oread by wing ttB30B ! tt SIE*4(raad aui. A7D) and aaking the appropriate connection! II 8549 ! tt nith an external lock-in aaplifier tt8310 ! I t t t l t t t t t t t t t t t t t t t t t t t t t t t l t t t t t l t t t l t t t t t t t t t t t t t l t t l t t t l t t t l t t t t t t t8311 ! tttlllttlltllttttttttttttttltttttttttltttlttttlttlttttltttttltlttlltttt 8313 LOCATE 2,38 (PRINT 'Procedure!'(CHM8320 LOCATE 3,5 (INPUT *Nott-Schottky aeaaureeenti?(y/<cr»*|At 8330 IF At»'Y* THEN AM'SIE 4* ELSE At-'SIE 1*8340 CHDt»'IWI 1| **Af*'jPAH OflNTRP t|KV 0|FP 0'8330 6DSU8 20108333 1 ICItDt tent8334 LOCATE 3,3 (PRINT 'Enter potentials as aV vs ref. *8538 LOCATE 6,10 (PRINT 'Initial potantial*8362 LOCATE 7,10 (PRINT 'First reversal potential*8364 LOCATE 8,10 (PRINT 'Second reversal potential*8363 LOCATE 10,10 (PRINT 'Seeep rats taV/sec)'8366 LOCATE II,10(PRINT 'Nuaber of data points*B367 FILLI333,240,760,380,0)8368 LOCATE 6,33 (INPUT V|!NIU8372 LOCATE 7,33 (INPUT *(*|ER1I8374 LOCATE 8,33 (INPUT *i'iER218373 LOCATE 10,33 (INPUT V|V 8376 LOCATE II,33;INPUT ' i'jN 8390 !8393 CHDt>'LP ■♦NWUHINT(N-1>>8396 60SUB 20108600 At**8IAS '♦NUmtdNlTIl iCNM«CHDltAt 8610 ER1WR1Z-INIT2 (ER21*ER21-1N1TZ 8620 0E*A8S(ER21-ERI2)8630 IF DE>2000 THEN 80T0 8367
7

223
8440 A*«'|NR 2*8*30 IF DE<*200 TKN AM’fWt 1*86*0 IF K<>20 THEN Af«*|NR 0*8*62 NR»VAL(R1SHT(A*,4H 1*70 CHM-CRM+A*8*90 EINC-2IDE/N tT8>(EXMC/V>*1E6 i8Pf*10 iTH8>T8/8PP1700 IF TR8<-30000 MO TND-300 THEN 87308702 IF TI8HD00 THEN 87308704 UNTIL TMB11000870* TNI-2ITHI i8PP«SPP/28708 KIT8710 IF SPP<1 THEN WTO 83678711 WTO 8730 8713 UNTIL TN8<500008717 THI-TH1/2 tSPP-2tSPP8719 K IT8720 SOTO 8700 8730 TKB>INT<THf+.5i1740 At-*|TRB 1 . ♦•jS/F •♦NUNll(SPf)8730 CltD*«CNW*A*87*0 S08U8 201087*2 60SUB 9110 ! Oaf in# Ratping prograa87*4 608UB 20108770 ! ICNDt aant8780 LOCATE 14,14 iPRINT 'Oita acquirad for laat cyda only*B790 LOCATE 13,10 I INPUT ‘Nuabar of aaaapa Kcr>«l) '(NSNPX 8800 IF KNP1-0 THEN NSNP1-18810 LOCATE 13,10 tPRINT 'Call it onj hit any kay to atart or T to 8820 CND*-*CELL 1*8830 SOSUB 20108850 CALL B£TKEVfPI,P2,P3,P4,P5)88*0 IF P3< >0 TKN SOTO B850 88*3 IF Pl-88 TKN SOTO 89308870 LOCATE 13,10 iPRINT 'Saaap in prograat) hit any kay to atop * 8880 CHOI-'SNPS *HNM1I(N8NPZ)8890 SOSUB 2010 8893 CN0*»*NC|TC* ifiOSUB 2010 8900 OtW-'ST* tSOSUB 2010 8903 60SUB 15108910 CALL BETKEV(PIX v P3X,P3Sa P41,P311B912 IF P3X-0I TKN SOTO 89308914 IF UNT(VALfOATAIl) AND 32X10321 TKN SOTO 89008930 CNDI-'CEIL 0*8940 606U8 20108943 FILL(0,80,760,1*0,0)8930 LOCATE 14,10 tPRINT ’9#tap finiahaO'iSPACE*(23)8951 IF P3X<>0 TKN GOTO 89*08932 LOCATE 14,10 iPRINT 'Saaap atoppad *89*0 LOCATE 13,10 (PRINT fc'Sava data(S)| Rapaat(R)| Changt aattingi(C)| <cr)to raturn to PAR273' 8970 LOCATE 13,78 i INPUT "(At
ancapa*
7713
224
8972 IF M«*Ia TKN SOTO 89608973 FILL(0,225,760,263,0)8980 IF At*" THIN SOTO 9060 8990 IF AM*C* THIN 60T0 8336 9000 IF A9«*R* TKN 80T0 S780 9010 IF Al< >*S* TKN SOTO 8960 9020 CHW-'BD 0 *«NUHlt(N>9030 60SUB 20109090 MBUB 90109030 60T0 B960 9060 NITURN9101 ! t t t t t t lt t lM t l lt l l tM t t t tM t t t l l t t lM f l l l t l l t l l t t t l t tM tM tt t t l l l t l t t t l9102 I Subroutine to gontrnto r u p ---------- - - - - - - -9110 CHM«MNITIAL 0 0*9120 HlWOIiOHR9130 CFT>NM8S(£Rll/(2tD£))i CVAL"B£3IERU/HR9111 CPT*INTICPT*.3) iCVAL«INTtCVAL+.SI86NtCVAL))9140 A4»*jVERT£I ■♦NUNIOICPTK* '♦NUH1KCVALI9130 CPT*CPT*N/2i CVAL«8E3t£R2I/NR9131 CPT*INT(CPT*.3) |CVAI*1NT(CVAL+.3IS6N<CVAL) J 9160 A9>A**‘|VERTEI ■♦NUHHtCPTlf •♦NUHlltCVAl)9163 A4»A9**|VERTEI SNUHlKN-llf 0*9170 CHOMClOOtA*9180 LOCATE 19,1 tPRINT CHDI 9190 RETURN

V IT A
Kannath Rob art Camay Mas born in DaFuniak
Springs, Florida on May 31, 19S8. Ha racaivad his High
School diploma from Bossiar High School in Bossiar
City, Louisiana in Hay of 1976. Ha was awardad tha
Bachalor of Scianca Dagraa in Chamistry from Louisiana
Stata Univarsity in Shravaport in May of 1981.

DOCTORAL EXA M INATIO N AND DISSERTATION REPORT
Candidate Kenneth R. Carney
M a jo r Field: (Analytical) Chemistry
Title o f Dissertation Application of the Fast Fourier Transform to impedanceAnalysis of n-TiC>2 and LaF^ Electrodes
A pproved: ____
v.M a jo r Prolessor and C hairm an
Dean ot the G raduate S c h o o L ^ ^ —
E X A M IN IN G C O M M IT T E E
j ?
Date of Examination:
LWemhor 7 , tUHH