application of the “pmp protocolpmp protocol ” to nrmm · pmp mandate • dl ft thi t l l...
TRANSCRIPT

Application of the “PMP Protocol” PMP Protocol
to NRMM
Alois KrasenbrinkEuropean Commission J i t R h C t Joint Research Centre

PMP Background H lth C N P ti lHealth Concerns over Nano-Particles
• The Clean Air for Europe (CAFE) Programme has forecast the likely levels of air pollution given present policies for the period 2000-2020.
• Despite the improvements in pollutant emissions, health impacts from air pollution across the EU are still projected to be considerable in 2020projected to be considerable in 2020.
• For particulate matter, it is estimated that in 2020 some 2.5 million life years will be lost in the EU-25. This is equivalent to about 272,000 premature deaths.

Emission Standards for Light Duty VehiclesType ApprovalType Approval
EURO 1, 1992Pollutant emissions
HCCO PMNOxEURO 2, 1996
EURO 3, 2000
NOx
EURO 4, 2005
OEmission standards have been
already reduced by more than 90% EURO 5 PMEURO 6 NOx
already reduced by more than 90%The CAFE programme called for
further emission reduction

Emission Standards for Heavy Duty VehiclesType Approval
HCCO
Type Approval
Pollutant
EURO I, 1992 EURO II, 1995
CO PMNOxemissions
EURO IV 2005EURO VI
EURO III, 2000EURO V 2008

O f th i bj ti f E 5/6 t f
Regulating Particles from Diesel VehiclesOne of the main objectives of Euro 5/6 was to force
the adoption of the best available technology (i.e. DPF) to reduce particulate emissions
• Concerns over capability of current PM measurement to force technology which measurement to force technology which
effectively controls these emissions• Advanced technology emissions levels approaching limits
of detection on current PM measurement
Development and validation of new measurement ptechniques for PM AND PN:
UN-ECE Particle Measurement Programme (PMP)

• PM does not correlate with PN.• PN method much more sensitive. PN levels vary over three orders
of magnitude while PM by less than 1 order of magnitude for clean systems.

PMP MandateD l t f t h i t l l t • Development of new techniques to replace or complement particulate mass measurement for Light & Heavy Duty type approval
• Simple and robust procedure suitable also for conformity of production testing
• Good repeatability and reproducibility• Good repeatability and reproducibility• Limited investments in terms of measuring equipment
T id d t th f f diff t t h l i • To provide data on the performance of different technologies, including DPF equipped vehicles, according to the new measurement procedures in order to set reasonable particulate emission limits

LD PMP Phases I (2001) & II (2003)
Investigation of:Sampling & Conditioning
– Constant Volume Sampling (+ secondary dilution)
– CVS + thermodenuder or thermodiluter
– Rotary dilutionSystems
– Rotary dilution– Raw exhaust
– Gravimetric (modified US 2007)– Filter + chemical analysisFilter + chemical analysis– TEOM– Laser Induced Incandescence– QCM– Photoacoustic absorption– Coulometric
Measurement TechniquesCoulometric
– Photoelectric charging– Light extinction– Laser Light Scattering– Differential Mobility Spectrometer– Optical counter (CPC)Optical counter (CPC)– Electrical Mobility– ELPI– Diffusion battery– Diffusion charger

Phase I & II: Conclusions1. Improved Particulate Mass Measurement
• Dilute exhaust sampling with HEPA & HC filtered dilution airC clone p e classifie• Cyclone pre-classifier
• Improved sample temperature control 47 +/-5°C• Deletion of back-up filter
2. Solid Particle Number Count• Dilute exhaust sampling with HEPA & HC filtered
dilution air• Cyclone Pre-classifier• Sample thermal conditioning: heated dilution,
evaporation tube, dilutionCondensation Particle Counter with 50% cut point • Condensation Particle Counter with 50% cut point at 23 nm
ONLY SOLID PARTICLES >23 nm ARE MEASURED

PMP procedure focuses on solid particles with a diameter >23 nm
• Accumulation mode very stable and not very stable and not depending on sampling conditions
• Nuclei mode too Nuclei mode too sensitive to sampling conditions – too high variability

PMP Phase III - ValidationObjectives
T t bilit d l b t l b • To assess repeatability and lab to lab reproducibility of proposed PM & PN techniques
• To assess comparability of available PN t tmeasurement systems
• To assess performance levels of different engine/vehicle technologies
Separate Light & Heavy Duty Validation ExercisesValidation Exercises

Experimental set up: Modified Mass Method
• Cyclone (2.5µm to 10µm cut-point)
• Lab modified systems with external heating tapes• Lab modified systems with external heating tapes• Zone held at 47°C +/- 5°C for >0.2s• Temperatures recorded
• Filter face velocity (50cm/s to 80cm/s)
• Pallflex TX40 mandated; single batch for all tests; g• No back-up filter• Single filter for entire NEDC for DPF equipped and
gasoline vehiclesU b d t b h ith t filt • Urban and extra-urban phase with separate filters for conventional Diesels

Experimental: ‘Golden’ Particle Number Measurement System (LDV PMP)

HD PMP Measurement setup
• Two Golden Particle Measurement Systems (Horiba’s SPCS). One at setup CVS and one at the Partial Flow System.
• Additional instrumentation:• VPR systemsy
APCNanometDual Ejector &
Evaporating TubeThermodenuder
• TSI’s SMPS• EEPS• Soot Sensor• DMM

Some experimental results

Background PM
Limited background data collected at the end of the measurement campaign (3 tests from CVS – 2 tests from PFS) were found at the same levels as samples.

PN Repeatability - Reproducibility
• Repeatability ranged between ~20% (over the high emission cold WHTC) and ~60% (over the high temperature WHSC) for both CVS and PFS after removing outliers.
• Reproducibility ranged between ~40% (cold WHTC) and 80% (WHSC).

Summary
• PM:• PM emissions were generally <6 mg/kWh.g y g• However, background levels were equivalent to test cycle
emissions levels.• The majority of PM mass is gaseous volatiles, which contribute j y g
from 10% (cold WHTC) to 99% (hot start cycles) of the total mass.
• Particle Number:a c e u be• PN emission levels over cold WHTC were determined to be ~4×10¹¹
#/kWh with both CVS and PFS systems. At these emission levels, the background effect is insignificant.
• PN emission levels over hot start WHTC and ETC cycles were <2×10¹⁰ #/kWh. Passive regeneration occurring over the WHSC and ESC cycles could result in an increase of the emissions up to
106×1010 #/kWh.

Summary
• Particle Number:Particle Number:• Repeatability and reproducibility levels for the CVS and PFS were
similar, ranging from:~20% and ~40%, respectively, over cold WHTC20% and 40%, respectively, over cold WHTC ~70% and ~80%, respectively, over WHCS, due to passive regeneration related
emissions.• PFS systems showed lower backgrounds than CVS systems, but
when the two systems had similar backgrounds, the correlation between PN emission levels was excellent.
• Particle number emissions do not correlate with PM results, as the latter are almost entirely volatile material.

CONCLUSIONSTh PMP d d i d l i • The PMP succeeded in developing a new measurement technique for particle number suitable for type approval purposes
• The PMP has provided the technical basis for the future European emission standardsthe future European emission standards
• Cooperation between policy makers, industry d h i tit t f d t l f th and research institutes fundamental for the
development of shared and scientifically sound pieces of legislation

Application of the PMP protocol to PMP protocol to
NRMMNRMM
Focus: diesel engines

Land-based NRMM 2005 numbers
Stage IV Stage IV Stage IV not reg.56-75 kW 75-130 kW 130-560 > 560
65.5 102.5 345 600S ll E i t (A i) 0 0 0 0
N0x Emissions (kt)Small Equipment (Agri) 0 0 0 0Small Equipment (Constr) 0 0 0 0Generator Sets 14 20 44 59Agricultural Tractors 107 185 185 0Agricultural Harvesters 0 2.1 80 4.9Agricultural Harvesters 0 2.1 80 4.9Light Construct. Equip. 175 0 0 0Heavy Construct. Equip. 0 71 157 21
Total NOx mass (kt) 296 278 466 85Total (%) 24 22 37 7
Stage IV Stage IV Stage IV not reg.56-75 kW 75-130 kW 130-560 > 560
65.5 102.5 345 600Small Equipment (Agri) 0 0 0 0Small Equipment (Constr) 0 0 0 0
PM Emissions (kt)
Small Equipment (Constr) 0 0 0 0Generator Sets 0.99 0.94 1.81 4.2Agricultural Tractors 7.55 8.58 7.58 0Agricultural Harvesters 0 0.10 3.27 0.4Light Construct. Equip. 12.41 0 0 0
Total PM:~ 70 kt
PM > 56 kW84% = 59 kt
Heavy Construct. Equip. 0 3.16 5.86 1.40Total PM mass (kt) 21 13 19 6.0
Total (%) 30 18 27 9
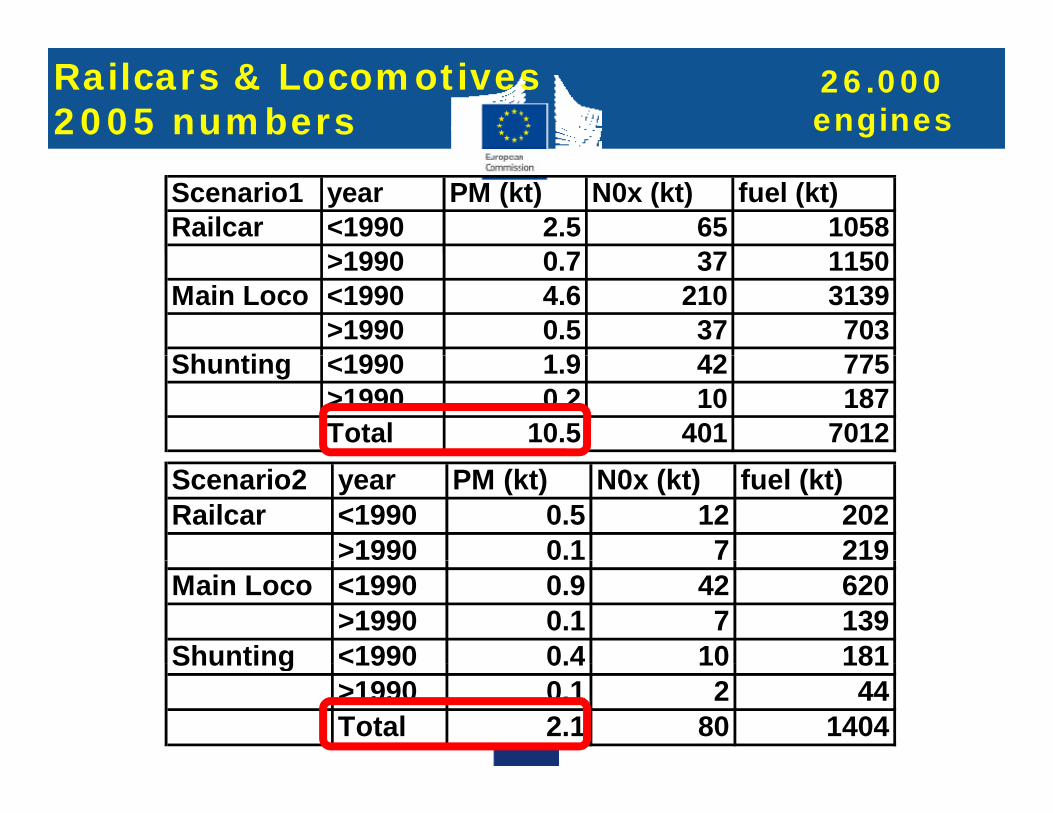
Railcars & Locomotives 2005 numbers
26.000 engines
Scenario1 year PM (kt) N0x (kt) fuel (kt)Railcar <1990 2.5 65 1058
1990 0 7 37 1150>1990 0.7 37 1150Main Loco <1990 4.6 210 3139
>1990 0.5 37 703Sh ti 1990 1 9 42 775Shunting <1990 1.9 42 775
>1990 0.2 10 187Total 10.5 401 7012
Scenario2 year PM (kt) N0x (kt) fuel (kt)Railcar <1990 0.5 12 202
>1990 0.1 7 219Main Loco <1990 0.9 42 620
>1990 0.1 7 139Shunting <1990 0.4 10 181Shunting <1990 0.4 10 181
>1990 0.1 2 44Total 2.1 80 1404

Inland Waterway Vessels 2005 numbers
~ 80 new engines/year
180
200
63% ->
120
140
160
tion
63% >
60
80
100
Pop
ulat
0
20
40
>0.9 0.9-1.2 1.2-2.5 2.5-3.5 3.5-7 7-15 15-20Cylinder capacity (litres)
Inland waterway propulsion engine power distributionInstalled from 2002 to mid 2005 Installed from 2002 to mid 2005
Total PM Emissions similar to rail sector

Considerations
C f l id ti f⇒ Careful consideration of :
- Size of the specific sector (sales numbers road- Size of the specific sector (sales numbers, road engine derivate?)
- Engine specifics (power band, engine specific g p (p , g pemission levels, total emissions contribution)
- Total cost for test facility modifications- Extra cost per engine type approval

The petrol side of NRMM:The petrol side of NRMM:small spark ignited engines

Small SI engines 2005 estimates
Machinery specific
HC + NOx emissions
engine typelimits
HC+NOx EU stage I
limits HC+NOx EU
stage II
typical emission for EU I engines
typical emission for EU II engines
Load factor
environmental load HC+NOx in
2005 [to]
environmental load HC+NOx in
2015 [to]
2-stroke 2005
2-stroke trend 2010
chainsaws hobby 247 50 140 50 0.5 6.440 2.300 100 100
chainsaws professional 166 72 120 72 0.85 20.853 12.512 100 100trimmers hobby 247 50 170 50 0.5 2.896 852 80 50
trimmers professional 166 72 120 72 0.5 2.453 1.472 90 70
others hobby 247 50 170 50 0.5 1.690 497 70 50
others professional 166 72 145 72 0.5 2.223 1.104 90 50
lawn mowers hobby 16.1 16.1 15 15 0.5 5.431 5.431 < 20 0
lawn mowers professional 16.1 16.1 15 15 0.5 67 67 < 20 0
riding mowers hobby 13 4 12 1 12 10 0 4 3 162 2 635 ~ 0 0riding mowers hobby 13.4 12.1 12 10 0.4 3.162 2.635 ~ 0 0
riding mowers professional 13.4 12.1 12 10 0.4 2.999 2.499 ~ 0 0
TOTAL 48.214 29.368
2005 2015
PM (t) 892 543
PM = 2% HC
PM = 1,85% von HC+Nox ~ 5 mio. Engines/year
2stroke HC = 98% HC+Nox
PM (t) 45 27Solid PM fraction = 5% of total

Small SI Engines Conclusions 2007
=>
PMP t hi h t f ll i d tPMP setup: high costs for small industry
Difficult to measure and dilute small exhaust flow without acting on engine (change performance)
Difficulty with high liquid (oil) content
High variability of 2-stroke PM measurements
Need of certified fuels oilsNeed of certified fuels, oils
Certification time increase from 0.5 to ~ 2 days
PM control through HC emissions as cheap optiong p p
Oil/fuel mixture reduction: 50:1 possible for almost all applications, otherwise 25:1 for special construction machinery (dusty environment)

Thank you Thank you for your attention!y