application of t he theory of planned behavior...
TRANSCRIPT
APPLICATION OF THE THEORY OF PLANNED
BEHAVIOR TO SELECT A DESTINATION
AFTER A CRISIS: A CASE STUDY
OF PHUKET, THAILAND
By
KULLADA PHETVAROON
Bachelor of Science in EconomicsKasetsart UniversityBangkok, Thailand
1993
Master of Business Administration in FinanceThe University of Tenessee
Chattanooga, Tennessee1996
Submitted to the Faculty of theGraduate College of the
Oklahoma State Universityin partial fulfillment of
the requirements forthe Degree of
DOCTOR OF PHILOSOPHYDecember, 2006

ii
APPLICATION OF THE THEORY OF PLANNED
BEHAVIOR TO SELECT A DESTINATION
AFTER A CRISIS: A CASE STUDY
OF PHUKET, THAILAND
Thesis Approved:
Dr. Woody KimThesis Adviser
Dr. Jerrold Leong
Dr. Radesh Parakurthi
Dr. William D. Warde
Dr. A. Gordon EmslieDean of the Graduate College

iii
ACKNOWLEDGEMENTS
Achieving and completing my dissertation would not have been possible without
the support and guidance of many people. First, I would like to express my sincere
appreciation to my dissertation advisor, Dr. Woody Kim, for all of his support,
supervision, excellent guidance, inspiration, and friendship throughout the dissertation
process. I also wish to note my deep appreciation and respect to Dr. Jerrold Leong, my
dissertation chair, who devoted himself to my academic process. He has always given me
kindness and encouragement. The members of my dissertation committee, Dr. Radesh
Palakuthi and Dr. William D. Warde, have generously given their suggestions and
overwhelmingly positive comments on my dissertation. This dissertation could not have
been written without their critical comments and suggestions, which influenced the
direction of my dissertation. My sincere gratitude extends to Dr. Hailin Qu, his guidance,
assistance, encouragement and friendship are invaluable. I am grateful to Associate
Professor Manut Chaisawat for encouraging me to earn a doctoral degree.
My sincere gratitude extends to the entire staff for their professionalism and their
friendly kindness, concern, and willingness to help with every request. I am also grateful
to all of the HRAD faculty members for their excellent teaching and care, especially for
international students including me.

iv
A special thank to my best friend forever, Ms. Chotima Iemsawasdikul, for
always being there when I needed emotional support. For all of her love and support, I
am eternally grateful. Thank you to my uncle and my aunt, Mr. Prayuth and Mrs. Nipa
Kajitta, for their love, and emotional support.
Finally, I express my sincere thanks to my parents, Mr. Prakit and Mrs. Jariya
Phetvaroon, my sisters, and my brother who were always there to offer endless love,
support, inspiration, and understanding. Their encouragement has helped me to achieve
tough goals and gives me strength during my hardest time of my life. My heartfelt thanks
go to my grandparents who are always in my mind, for their love, understanding and
emotional support.

v
TABLE OF CONTENTS
Chapter Page
I. INTRODUCTION......................................................................................................1
Background ..............................................................................................................1Problem Statement ...................................................................................................6Research Questions..................................................................................................7Objectives of the study.............................................................................................7Research Model and Hypotheses .............................................................................7Significant of the study ............................................................................................9
Theoretical Contribution....................................................................................9Practical and Management Contribution .........................................................10
II. REVIEW OF LITERATURE..................................................................................11
Theory of Planned Behavior (TPB) .......................................................................11Tourist Behavior Intention...............................................................................12
Antecedents of Tourist Behavior Intention and Hypotheses .................................13Attitude ............................................................................................................13Subjective Norm ..............................................................................................14
Tourist’s country of origin: Asian or Western countries ...........................15Perceived Behavior Control .............................................................................17Past Behavior ...................................................................................................18Applications of TPB ........................................................................................22The sufficiency of the Theory of Planned Behavior ........................................22
Travel Destination..................................................................................................24Definition of Travel Destination......................................................................24Destination Product..........................................................................................24
The Destination Image...........................................................................................26Definition of Destination Image ......................................................................26The Destination Image Attributes....................................................................26
Tsunami..................................................................................................................35Definition of Tsunami .....................................................................................35Signs of an Approaching Tsunami...................................................................35Past Tsunami....................................................................................................36Tsunami in Phuket ...........................................................................................37
vi
Signs and Warnings .........................................................................................38Economic Loss.................................................................................................38
Destination in a Time of Crisis .............................................................................41Attitude towards Destination in Times of Crisis....................................................42Travel Motivation ..................................................................................................44Travel Involvement................................................................................................50Repeat Travelers ....................................................................................................52Definition of the Term ...........................................................................................54
III. METHODOLOGY ................................................................................................56
Research Design.....................................................................................................56Validity and Reliability..........................................................................................56
Validity ............................................................................................................56Reliability.........................................................................................................57
Sampling Plan ........................................................................................................59Target Population.............................................................................................59Sample Size......................................................................................................59Sample Approach.............................................................................................60
Instrument Development and Data Collection ......................................................61Questionnaire Development.............................................................................61Survey Procedure .............................................................................................63
Data Analysis .........................................................................................................64Data Screening .................................................................................................64Descriptive Statistic ........................................................................................65Paired Sample t-test .........................................................................................65Independent Sample Mean t-test......................................................................65Factor Analysis ................................................................................................65
Exploratory Factor Analysis (EFA) ............................................................66Confirmatory Factor Analysis (CFA) .........................................................69
Structural Equation Modeling..........................................................................70
vii
IV. RESULTS..............................................................................................................89
Respondent Profiles ...............................................................................................90Respondent Demographics Profiles.................................................................90Respondent Travel Profiles..............................................................................92
Sources of Information, Tourist Activities, and Money Spent ..............................94Perceived Image of Phuket before the Tsunami ..................................................100Perceived Image of Phuket after the Tsunami .....................................................102Perceived Image differences before and after the Tsunami.................................104Underlying Dimensions of Perceived Image of Phuket before the Tsunami.......108Underlying Dimensions of Perceived Image of Phuket after the Tsunami .........112Underlying Dimensions of Travel Motivation.....................................................116Travel Motivation Differences by Number of Visits...........................................120Applicability of the Theory of Planned Behavior Model to Tourism..................124
Measurement Items........................................................................................124Measurement Model ......................................................................................126Structural Model ............................................................................................128
Moderation Tests .................................................................................................131
V. CONCLUSIONS, IMPLICATION, AND RECOMMENDATIONS .................133
Perceived Image Differences before the Tsunami and after the Tsunami ...........134Underlying Dimensions of Perceived Image of Phuketbefore and after Tsunami ...............................................................................134Implications....................................................................................................135
Travel Motivations...............................................................................................136Implications....................................................................................................137
Destination Choice Intention Model after Crisis .................................................139Implications....................................................................................................140
Moderation Tests .................................................................................................142Implications....................................................................................................143
Sources of Travel Information and Activities......................................................145Sources of Travel Information .......................................................................145Implications....................................................................................................146
Limitations and Future Research Avenues ..........................................................149
REFERENCES ..........................................................................................................152
APPENDICES ...........................................................................................................179APPENDIX A: INSTITUTIONAL REVIEW BOARD (IRB) APPROVAL ....189APPENDIX B: SURVEY QUESTIONNAIRES ...............................................191

viii
LIST OF TABLES
TablePage
1. Tourist Arrival Accommodation Establishments in Phuket ....................................3
2. Tourism receipts from Domestic and Foreign Travelers in Phuket .........................4
3. Summaries of Research Hypotheses......................................................................19
4. Results of the Literature Review on the Effects of Attitude (AT), Subjective Norm
(SN), and Perceived Behavior Control (PBC) on Behavior Intention (BI) ...........20
5. Summary of TPB Applications in the Hospitality and Tourism Research ............21
6. Selected Definitions of Destination .......................................................................24
7. Selected Definitions of Image................................................................................26
8. Review of Major Attributes of Tourist Destination Image....................................28
9. Attributes of Tourist Destination Image used in this study ...................................34
10. Review of Past Tsunami Occurred .......................................................................36
11. Review of Major Attributes of Travel Motivation.................................................45
12. Attributes of Travel Motivation used in this study ................................................49
13. Reliability of Measurements in the Pilot Test........................................................58
14. Endogenous and Exogenous Constructs defined in the Path Diagram ..................74
15. Summary of Scale Items Used in this Study..........................................................77
16. Summary of Statistical Measures and Their Acceptable Range for
Different Fit Measures ...........................................................................................85

ix
17. Demographic Characteristics of Respondents .......................................................91
18. Travel Characteristics of Respondents...................................................................93
19. Sources of Information ..........................................................................................94
20. Tourists’ Activities.................................................................................................96
21. Tourist Expenditure ...............................................................................................99
22. Importance of Attributes in Attracting Tourists to Phuket
before the Tsunami ..............................................................................................100
23. Importance of Attributes in Attracting Tourists to Phuket
after the Tsunami .................................................................................................102
24. Image differences before the Tsunami and after the Tsunami.............................105
25. KMO and Bartlett’s Test for Perceived Image of Phuket before the Tsunami....109
26. Underlying Dimensions of Perceived Image of Phuket before the Tsunami.......110
27. KMO and Bartlett’s Test for Perceived Image of Phuket after the Tsunami.......113
28. Underlying Dimensions of Perceived Image of Phuket after Tsunami ...............114
29. KMO and Bartlett’s test for Travel Motivation Attributes ..................................117
30. Underlying Dimensions of Travel Motivation.....................................................118
31. Travel Motivation differences by Number of Visits............................................121
32. Descriptive Statistics for the Measurements Items of Latent Constructs ............125
33. Correlation Matrix ..............................................................................................125
34. Results of Confirmatory Factor Analysis ............................................................127
35. The Results of Hypothesized Tests......................................................................129
36. Structural Parameter Estimates for Two-group Comparison...............................132
x
LIST OF FIGURES
Figure Page
1. Research Model ........................................................................................................8
2. The seven-stage process for Structural Equation Modeling ..................................72
3. Path diagram for the proposed model ....................................................................75
4. Research Framework .............................................................................................88
5. Final Model of the destination choice intention after crisis.................................130
1
CHAPTER I
INTRODUCTION
Background
Phuket lies off the west coast of Southern Thailand in the Andaman Sea,
approximately 890 kilometers from Bangkok. It is Thailand’s largest island, roughly the
same size as Singapore, and it is surrounded by many smaller islands that add an
additional 70 square kilometers to its total land area. Today, Phuket is the country’s
major tourist attraction. The surrounding waters contain a variety of marine life and the
island is blessed with lovely seashores and forested hillsides. The water is crystal clear
and the sandy beaches are white and soft. However, Phuket has a lot more to offer its
visitors other than its natural heritage of sun, sea, sand, sky, beach, forest, mountain, and
world-renowned diving sites. Sino-Portuguese architecture and old European-style
buildings cast their spell, delighting visitors while Phuket-style hospitality has never
failed to impress visitors from all walks of life. In addition, accommodation options
ranging from tropical-style bungalows to exclusive, super-luxury, and world-class resorts
have warmly catered to the different needs of visitors. Travelers can make their choice
depending on the type of holiday they prefer. Some accommodations are in Phuket town,
in the heart of the nightlife, others are on a quiet beach, and still others are up on a hill for
a vantage view of the sea. For seafood lovers, Phuket is famous for its plentiful seafood
including sea catch fish, crabs, squids, oysters, prawns, and lobsters, all fresh from the
2
Andaman Sea. Altogether, these characteristics have made Phuket a truly unique
destination that attracts tourists from various countries (“Phuket,” 2005).
Since the 1980s, Phuket has become one of the major tourist attractions of
Thailand. Tourists bring foreign exchange that helps support the Thai economy, giving
Phuket the second highest per capita income of any province in Thailand outside of
Bangkok. Tourism has dominated the island’s economy for the past two decades
(“Phuket,” 2005).
Table 1 shows that the number of accommodation establishments in Phuket
increased by 97.62% from 1997 to 2004. In 2005, however, the number of establishments
decreased by 8.81% from 2004 because of the impact of the Tsunami. Many shops, hotels,
and various types of accommodation buildings in the Phuket area were destroyed by the
Tsunami. The number of rooms also increased from 1997 to 2004, by 69.19%. Because
of the Tsunami, again, the number of rooms decreased in 2005 by 1.83% from 2004. In
Phuket, plenty of accommodations are available, ranging from standard bungalow resorts
to luxury hotels. The number of accommodation establishments continues to increase in
order to respond to the continuously increasing number of tourists visiting Phuket.
The number of foreign guests has increased every year except in 2003 and 2005.
The number of foreign guests decreased from 2.6 million in 2002 to 2.5 million in 2003
because the effects of SARS (Severe Acute Respiratory Syndrome) and bird flu. SARS
and bird flu caused tourists to reconsider, or in many cases to cancel, their travel
arrangements to Phuket. In 2004, tourists started to visit Phuket again as evidenced by
the increased number of foreign guest arrivals. However, the Indian Ocean tsunami of

3
26 December 2004 made the number of foreign guests decrease again from nearly 3.3
million in 2004 to about 1.1 million in 2005.
Table 1: Tourist Accommodation and Arrival Statistics for Phuket
Source: (Statistics of Phuket tourism, 2006)
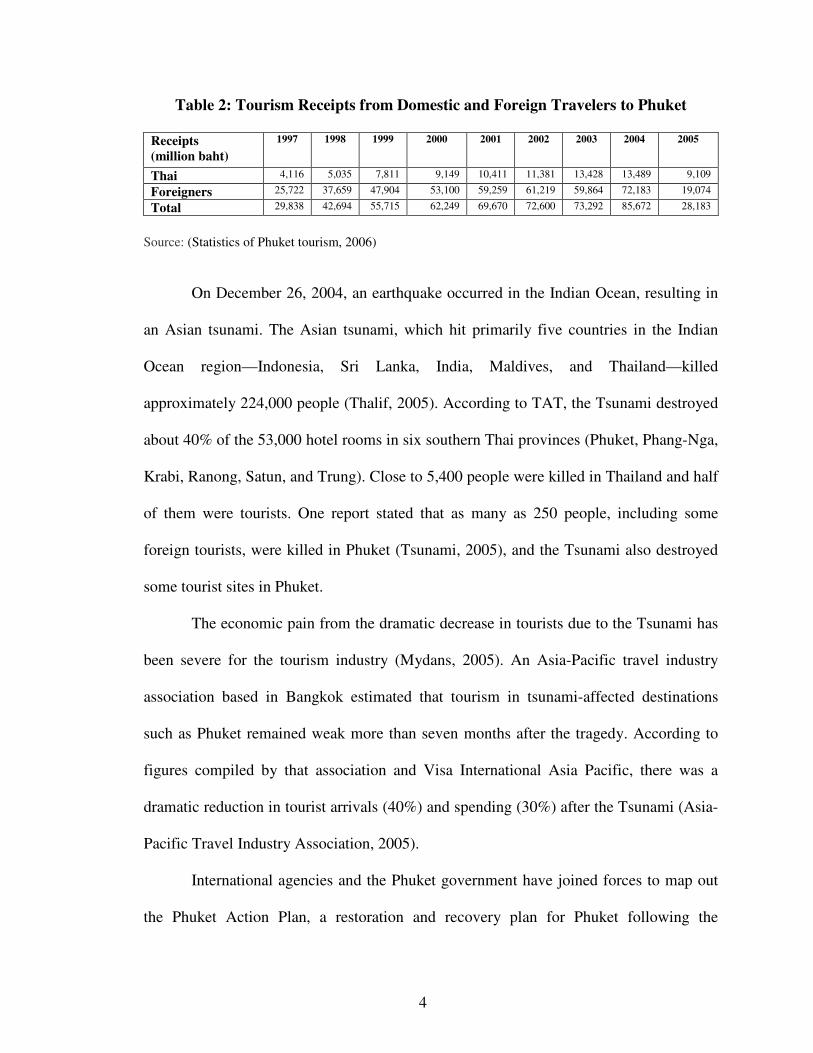
Table 2 shows that tourism receipts from foreign travelers increased every year
except in 2003 and 2005. Receipts from foreign travelers decreased from approximately
61 billion baht in 2002 to just under 60 billion baht in 2003 because of the effects of
SARS and bird flu. However, receipts from foreign travelers increased to just over 72
billion baht in 2004 as a result of a marketing campaign by the Tourism Authority of
Thailand (TAT). Tourism receipts from foreign travelers decreased again in 2005 to just
over 19 billion baht because of the effects of the Tsunami.
Type of data 1997 1998 1999 2000 2001 2002 2003 2004 2005
Accommodation
establishments
293 293 303 344 510 510 549 579 528
Rooms 18,959 17,952 20,150 19,574 26,759 26,637 31,302 32,076 31,488
Occupancy rate
(%)
54 58.87 63.40 67.14 58.86 57.00 57.40 65.47 34.60
Average length
of stay (days)
3.27 3.25 3.25 3.31 3.53 3.20 3.74 3.63 3.19
Number oftourist arrivals
Thai
Foreigner
2,113,419
490,186
1,623,233
2,343,77
498,252
1,845,520
2,753,330
675,907
2,077,423
2,971,211
709,131
2,262,080
3,275,669
799,940
2,475,729
3,492,324
884,949
2,607,375
3,508,950
986,299
2,520,651
4,234,982
964,523
3,270,459
1,971,181
824,330
1,146,851
4
Table 2: Tourism Receipts from Domestic and Foreign Travelers to Phuket
Receipts(million baht)
1997 1998 1999 2000 2001 2002 2003 2004 2005
Thai 4,116 5,035 7,811 9,149 10,411 11,381 13,428 13,489 9,109
Foreigners 25,722 37,659 47,904 53,100 59,259 61,219 59,864 72,183 19,074
Total 29,838 42,694 55,715 62,249 69,670 72,600 73,292 85,672 28,183
Source: (Statistics of Phuket tourism, 2006)
On December 26, 2004, an earthquake occurred in the Indian Ocean, resulting in
an Asian tsunami. The Asian tsunami, which hit primarily five countries in the Indian
Ocean region—Indonesia, Sri Lanka, India, Maldives, and Thailand—killed
approximately 224,000 people (Thalif, 2005). According to TAT, the Tsunami destroyed
about 40% of the 53,000 hotel rooms in six southern Thai provinces (Phuket, Phang-Nga,
Krabi, Ranong, Satun, and Trung). Close to 5,400 people were killed in Thailand and half
of them were tourists. One report stated that as many as 250 people, including some
foreign tourists, were killed in Phuket (Tsunami, 2005), and the Tsunami also destroyed
some tourist sites in Phuket.
The economic pain from the dramatic decrease in tourists due to the Tsunami has
been severe for the tourism industry (Mydans, 2005). An Asia-Pacific travel industry
association based in Bangkok estimated that tourism in tsunami-affected destinations
such as Phuket remained weak more than seven months after the tragedy. According to
figures compiled by that association and Visa International Asia Pacific, there was a
dramatic reduction in tourist arrivals (40%) and spending (30%) after the Tsunami (Asia-
Pacific Travel Industry Association, 2005).
International agencies and the Phuket government have joined forces to map out
the Phuket Action Plan, a restoration and recovery plan for Phuket following the

5
Tsunami. The World Tourism Organization (WTO) offered support for the Plan by
choosing Phuket as the venue for the Information and Communications Technology
(ICT) Solutions for Disaster Recovery Management and Global Warning conference. The
theme of the conference was “Learning from the Tsunami.” By hosting this first post-
Tsunami international conference, Phuket has inspired tourists‚ given confidence, and
offered assurance that Phuket’s service infrastructure and facilities are again operational
(TAT, 2006).
The return of tourists to Phuket is the most meaningful and sustainable way to
help Phuket communities affected by the Tsunami because the livelihoods of people
living in the affected areas depend on tourism. One year after the Tsunami, the demands
for visiting Phuket were stuck, international tourists still have not returned. The number
of foreign traveler arrivals decreased from 2004 to 2005 by 64.93%. Hotel occupancy
rate also decreased from 2004 to 2005 by 30.87%. Tourism Authority of Thailand have
announced plans to speed up recovery of the tourism sector by launching new promotion
campaigns to help reassure international tourists that it is safe to return. The post-
Tsunami tourism recovery progress seems to be satisfied. According to the Tourism
Authority of Thailand report, hotel occupancy rate increased 32.70% in the first two
quarters (January to June) from year 2005 to year 2006. Receipts from foreign travelers
also increased from approximately 7 billion baht in the first two quarter in 2005 to 30
billion baht in the first two quarter in 2006 (TAT, 2006). Overall, the moderate recovery
in tourist arrivals and expenditure is witnessed, but it appears that more time and efforts
are needed to achieve the level of full recovery before Tsunami.

6
Problem Statement
Probably no other industry in the world has suffered more from crises than
tourism (Leaf, 1995). Crises can occur in many different forms, including human-caused
disasters and natural disasters. Many researchers have studied the negative effects of
human-caused crises (Bar-On, 1996; Leslie, 1999; Mansfeld, 1999; Sommez, 1998).
These studies have focused on the effects of the crises on tourism activities and on
responses from within the tourism sector. Additional research, in the context of natural
disasters, is needed.
A disaster can turn tourism flows away from the impacted destination not only at
the time of the crisis, but also in the period following it as travelers reevaluate the
destination. In fact, the magnitude of the Tsunami disaster was so significant that the
tourism industry was not only disrupted, but its survival was jeopardized. While the
management of an actual crisis has become an integral part of business activity in the
tourism industry, how the industry copes with post-disaster situations has not received
much attention. In addition, the tourism industry could benefit from research that
establishes the role of extended theory of planned behavior in the process of selecting
travel destinations.
Therefore, this study seeks to address two deficiencies in existing research: to
examine the perceived importance of destination attributes after a natural disaster has
occurred and to establish a theoretical and conceptual foundation for predicting the
behavioral intention of choosing a travel destination after a major natural disaster.

7
Research Questions
In light of the discussion above, the following research questions have been
generated:
1. Are there any differences between the perceived importance of destination
attributes before and after the disaster occurred?
2. What are the underlying dimensions of motivation for choosing Phuket as a travel
destination after a debilitating natural disaster?
3. By employing the extended the theory of planned behavior (TPB) model, does the
proposed destination selection model truly advance the understanding of specific
determinants of tourist behavior intention toward a destination suffered from a
major natural disaster?
Objectives of the Study
1. To compare tourist perceptions of destination attributes before and after the
disaster occurred.
2. To identify the underlying dimensions of motivation for choosing Phuket as a
travel destination after a devastating natural disaster.
3. To empirically test the applicability of the extended TPB model, in the tourism
context.
Research Model and Hypotheses
Figure 1 shows a research model that forms the basis of the study and provides
general guidelines for the research. The study applies the TPB model as a research
framework to predict the behavioral intention of choosing a travel destination. The model

8
is based on the three constructs of attitude, subjective norm, and perceived behavioral
control adapted from Ajzen and Driver (1992). TPB has been used in the study of a
variety of social behaviors with strong predictive utility (e.g., Ajzen & Driver, 1991,
1992; Chan & Cheung, 1998; Conner, Warren, & Close, 1999; Reinecke, Schmidt, &
Ajzen, 1996). In addition, Conner and Abraham (2001) mentioned that additional
constructs might enhance the TPB’s predictive power. Quellette and Wood (1998) found
that the variance in explaining behavioral intention increased when past behavior was
added into the TPB model. Thus, it is reasonable to assume that the inclusion of past
behavior in the proposed study model should enhance the predictive ability of the original
TPB.
Figure1: Research model.
Attitude
SubjectiveNorm
PerceivedBehaviorControl
TouristBehaviorIntention
H4
PastBehavior
Destination Origin(Asian & Western Countries)
H1
H2
H3
H2-1
9
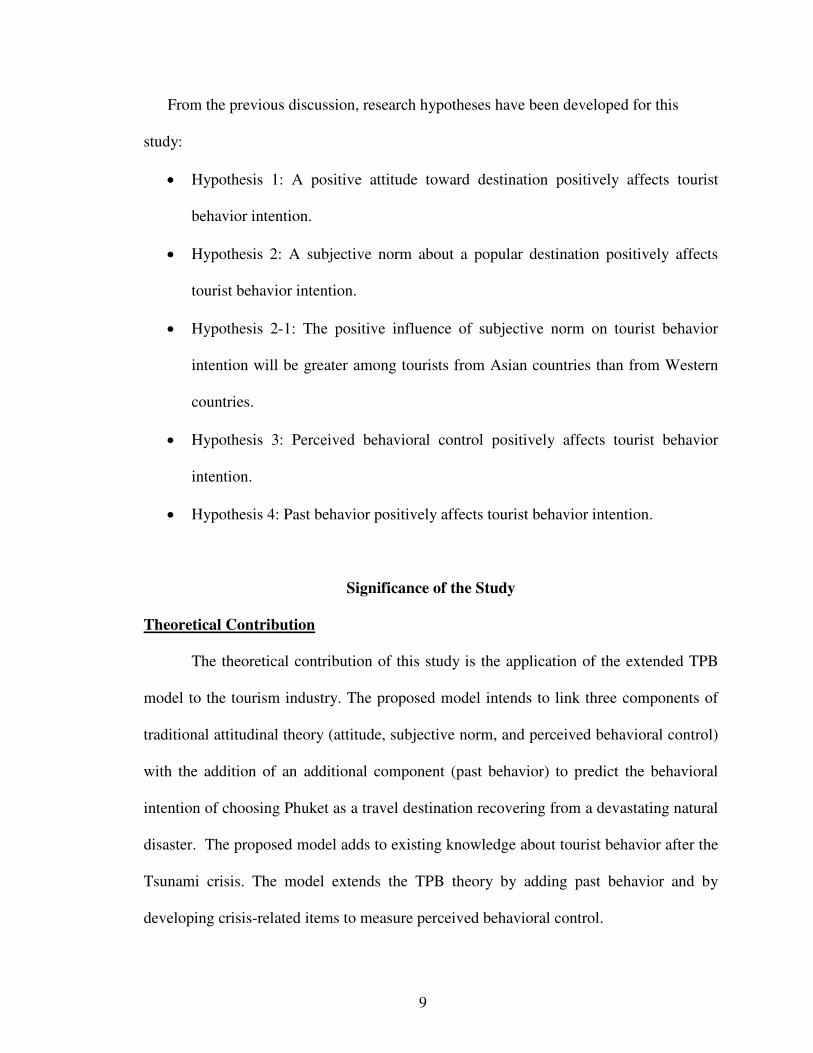
From the previous discussion, research hypotheses have been developed for this
study:
• Hypothesis 1: A positive attitude toward destination positively affects tourist
behavior intention.
• Hypothesis 2: A subjective norm about a popular destination positively affects
tourist behavior intention.
• Hypothesis 2-1: The positive influence of subjective norm on tourist behavior
intention will be greater among tourists from Asian countries than from Western
countries.
• Hypothesis 3: Perceived behavioral control positively affects tourist behavior
intention.
• Hypothesis 4: Past behavior positively affects tourist behavior intention.
Significance of the Study
Theoretical Contribution
The theoretical contribution of this study is the application of the extended TPB
model to the tourism industry. The proposed model intends to link three components of
traditional attitudinal theory (attitude, subjective norm, and perceived behavioral control)
with the addition of an additional component (past behavior) to predict the behavioral
intention of choosing Phuket as a travel destination recovering from a devastating natural
disaster. The proposed model adds to existing knowledge about tourist behavior after the
Tsunami crisis. The model extends the TPB theory by adding past behavior and by
developing crisis-related items to measure perceived behavioral control.

10
At present, most studies developed to test the applicability of the TPB model were
based on non-crisis situations. Therefore, the development of the model to reflect
recovery from a natural disaster will be of significant value in research on predicting the
behavioral intention of choosing Phuket as a travel destination.
Practical and Management Contributions
The results of this study have practical significance to various parties:
• Stakeholders at both the local and national levels are able to improve tourism
products and services in Phuket and thus increase the quality of tourist
experiences in the future.
• Operators and managers of the Tourism Authority of Thailand (TAT) and the
Phuket Tourism Board are able to closely match available tourism product with
the needs of diverse tourists and their differentiated travel motivations.
• TAT and the Phuket Tourism Board are able to develop marketing strategies to
enhance Phuket’s image as a “pearl of Andaman” and return Phuket tourism to its
former level of success.

11
CHAPTER II
REVIEW OF LITERATURE
Theory of Planned Behavior (TPB)
The theory of planned behavior (TPB) is a cognitive model of human behavior
that focuses on prediction and understanding of clearly defined behaviors. The theory
states that people act in accordance with their intentions and perceptions of control over
their behavior, while intentions are influenced by attitudes toward the behavior,
subjective norms, and perceptions of behavior control (Ajzen, 1985).
TPB is an extension of the theory of reasoned action (TRA), which predicts
intention to perform a behavior from two predictors, attitudes toward the behavior and
subjective norms (Fishbein, 1980). TRA, however, does not take into account situations
in which a behavior is not completely under an individual’s control. Ajen (1985)
developed TPB by introducing a third predictor of behavior to TRA, perceived behavior
control. Therefore, TPB postulates three conceptually independent antecedents of
behavioral intention: attitude toward the behavior, subjective norm, and perceived
behavioral control.

12
Tourist Behavior Intention
Behavioral intention is defined as “the degree to which a person has formulated
conscious plans to perform or not perform some specified future behavior” (Warshaw &
Davis, 1985, p. 214). Shim, Eastlick, Lotz, & Warrington (2001) demonstrated that
intention to perform a behavior is the proximal cause of such a behavior.
According to TPB, behavioral intention is determined by relative weights given to
attitude toward behavior, subjective norm, and perceived behavioral control (Park, 2003).
Ajzen & Fishbein (1980) stated that the relative weights (w) of the determinants of
behavioral intention should be reflected in explaining behavioral intention because the
relative importance of attitudinal, normative, and perceived behavioral control factors
may vary from person to person and across situations (Park, 2003). Lee (2005) suggested
that behavioral intention in TPB is determined by the following equation:
Behavioral Intention (BI) = w1Attitude (AT) + w2Subjective Norm (SN) + w3Perceived
Behavior Control (PBC)
Theories of human behavior suggest that the best predictor of behavioral intention
and future actual behavior is the frequency of past relevant behavior (Quellette & Wood,
1998; Sonmez & Graefe, 1998). Although TPB is considered a valid model for predicting
behavioral intention, Quellette & Wood (1998) found that the variance in explaining
behavioral intention increased when past behavior was added to the TPB model. By
applying the TPB model to his research, Lee (2005) developed a meeting participation
model (MPM) that provides a systematic view of the decision-making process of

13
association meeting participation. Specifically, the MPM provides a more complete
understanding of meeting participation intention by adding past meeting participation
experience to the TPB. Therefore, it is reasonable to assume that the inclusion of past
behavior in the study model could enhance the predictive ability of the original TPB.
Therefore, tourist behavior intention can be reformulated:
Tourist Behavioral Intention (BI) = w1Attitude (AT) + w2Subjective Norm (SN) +
w3Perceived Behavior Control (PBC) + w4Past Experience (PE)
Antecedents of Tourist Behavior Intention and Hypotheses
Given the four constructs of attitude, subjective norm, perceived behavioral
control, and past behavior, a relationship between each construct and behavioral intention
is hypothesized. The theoretical support of the relationships is described in the following
sub-sections.
Attitude
Attitude refers to the degree to which a person has a favorable or unfavorable
evaluation or appraisal of the behavior in question. It represents a summary evaluation of
a psychological object captured in attribute dimensions of good-bad, harmful-beneficial,
pleasant-unpleasant, and likable-dislikable (Ajzen, 2001).
Rosenberg & Hovland (1996) viewed attitude as a multicomponent construct and
stated that “all responses to a stimulus object are mediated by the person’s attitude toward
the object.” Prislin & Quellette (1996) found that highly embedded attitudes toward
preservation of the environment were more strongly related to an aggregate measure of

14
behavioral intention than were low-embedded attitudes. Crano (1997) found that vested
interest affects the strength of the relationship between attitude and behavior. In addition,
others have found additional impacts on the attitude-behavior relationship: prior
experience and thought (Millar & Millar, 1998), cognitive load and positive mood
(Blessum et al, 1998), direct and indirect experience (Millar & Millar, 1996), and the
accessibility of alternative action (Posavac et al., 1997). Further, Ajzen & Driver (1992)
showed that leisure choice intentions are predicted with considerable accuracy from
attitudes toward behavior. Therefore, if general measures of attitude have shown a
positive relationship between attitude and behavioral intention, the same should hold for
specific measures between tourist attitude and tourist behavior intention. It is
hypothesized, therefore, that tourists who have a good attitude toward a destination are
more likely to visit that destination.
• Hypothesis 1: A positive attitude toward destination positively affects tourist behavior
intention.
Subjective Norm
The social factor termed subjective norm refers to the perceived social pressure to
perform or not to perform a particular behavior. According to Moutinho (1987), any
person or group that serves as a reference group can exert a key influence on an
individual’s beliefs, attitudes, and choices because the individual might conform to
his/her referent group(s). Hee (2000) stated that subjective norm is social in nature. An
individual considers whether he/she should perform an act based on the opinions of the
people important to him/her and on perceived social pressure to behave in a particular
way. Perceived social pressure refers to an individual’s perception of how important

15
others desire performance or non-performance of a specific behavior. The more an
individual perceives that others think he/she should perform a behavior, the more he/she
will intend to do so.
The role of subjective norm to predict intention has been successfully supported
in many empirical studies. Vanucci & Kerstetter (2001) used TPB to explain meeting
planners’ intentions to use the Internet to plan group meetings. Their studies revealed that
subjective norm is significantly related to use of the Internet. Buttle & Bok (1996) used
TRA to explore the hotel choice process of business travelers. These researchers found a
significant correlation between subjective norm and behavioral intention. Lam & Hsu
(2005) used TPB to predict behavioral intention of choosing a destination. They, too,
found that subjective norm has a significantly positive relationship with behavioral
intention. Drawing on the support of previous empirical findings, it is hypothesized that
tourists’ relevant referents positively affect tourist behavior intention.
• Hypothesis 2: A subjective norm about a popular destination positively affects tourist
behavior intention.
Tourist’s country of origin: Asian or Western
Asian cultures are distinguished from Western cultures in that Asian cultures are
more collectivistic than individualistic in nature (Uba, 1994). Asian cultures generally
depend on group-oriented values such as family, cooperation, harmony, and mutuality.
Asians put more focus on ways to maintain harmony and conformity, and the individual
is expected to respond to the needs of the group. In Asian cultures, people are taught to
identify with the group rather than as an individual. Therefore, respecting a leader and
following his or her directions are important tasks (Kim & Markus, 1999).

16
On the other hand, Western cultures encourage values with a greater emphasis on the
importance of the individual person.
Hofstede (1980) differentiated individualistic from collectivistic cultures and
determined that the distinguishing cultural trait of Asian nations is collectivity (1980).
Hofstede (1980) & Triandis (1994) both consider the United States, in particular, and
English-speaking countries, in general, to be high on individualism, whereas much of
Africa and Asia are high on collectivism. As strong collectivists, Asian cultures are
highly conformist (Becker, 2000). According to Hofstede (1991, p. 51), collective
societies are defined as "societies in which people from birth onwards are integrated into
strong, cohesive groups, which, throughout people’s lifetimes, continue to protect them in
exchange for unquestioning loyalty." Individual societies are defined as "societies in
which the ties between individuals are loose: everyone is expected to look after himself
or herself and his or her immediate family” Compared to individualism, collectivism is
more conscious of relationships with other people and puts a higher value on face, group
harmony, conflict avoidance, respect, and group status (Leung, 1987; Triandis, 1995). In
collectivist nations (e.g., China, Japan, Hong Kong, Korea, and the Philippines), the
group is more important than the individual. In comparison, the Scandinavian countries
(e.g., Norway, Sweden, Denmark, and Finland) represent a high degree of individualism
(Becker, 2000).
The concept of norms is more salient in collectivistic cultures, and the influence
of social norms is more powerful in controlling individuals’ behaviors. Norms show what
behaviors a given culture expects of its members; norms can be assessed by asking
individuals how desirable certain practices are in their society. Collectivist cultures are
17
tight, with less deviation in norms and greater compliance with norms, whereas
individualistic cultures represent less agreement in norms and greater deviation between
normative and evaluative views (Bierbrauer et al., 1994).
Traditionally, Asian people tend to perform an act based on the opinions of
individuals in their family, while Western people tend to emphasize the uniqueness,
privacy, and individual rights within the community (Yang & Rosenbatt, 2000). The
belief in collectivistic notions such as interdependence, conformity, and harmony, as well
as the attitude of focusing on relationships, are prominent in the Asian cultures, while
individualistic ideas such as personal rights and self-actualization prevail in the Western
cultures. Hence, it is hypothesized that the relationship between subjective norm and
tourist behavior intention will vary depending on a tourist’s country of origin (Asian vs.
Western) or their culture (Asian vs. Western).
• Hypothesis 2-1: The positive influence of subjective norm on tourist behavior intention
will be greater among tourists from Asian countries than from Western countries.
Perceived Behavioral Control
The third antecedent of intention is the degree of perceived behavioral control.
Perceived behavioral control refers to a person’s perception of the ease or difficulty of
performing a particular behavior. It is assumed that perceived behavioral control reflects
past experience as well as anticipated impediments and obstacles. According to Chiou
(1998), perceived behavior control reflects an individual’s belief regarding access to
resources and opportunities needed to perform a behavior.
Armitage & Conner (1999) found that perceived behavioral control adds an
average of 6% to the prediction of behavioral intention. They also found a significant

18
correlation between perceived behavioral control and behavioral intention. Using a
modified TPB model, Oh & Hsu (2001) found a significant relationship between
perceived behavioral control and behavioral intention in examining gambling behaviors.
Ajzen & Driver (1992) also found a significantly high correlation between perceived
behavioral intention and behavioral intention in leisure choice behaviors. Many empirical
studies investigating various human behaviors with TPB have provided evidence that
perceived behavioral control is positively and directly associated with behavioral
intention. Therefore, the following hypothesis is established:
• Hypothesis 3: Perceived behavioral control positively affects tourist behavior intention.
Past Behavior
A number of empirical studies have shown that past behavior can be used
successfully as a predictor variable of behavioral intention and future behavior
(Aarts, 1998; Ajzen, 2002; Oh & Hsu, 2001; Ouellette & Wood, 1998; Sonmez & Graefe,
1998; Taylor & Todd, 1995; Yoo, 2004). Ouellette & Wood (1998) conducted a meta-
analysis of extant research to test the direct effect of past experience on future response.
Their study revealed that past behavior was an important predictor of future behavior and
intention. Because of the empirical evidence of past experience contributing to future
behavior, this study includes past behavior as an antecedent of intention.
• Hypothesis 4: Past behavior positively affects tourist behavior intention.
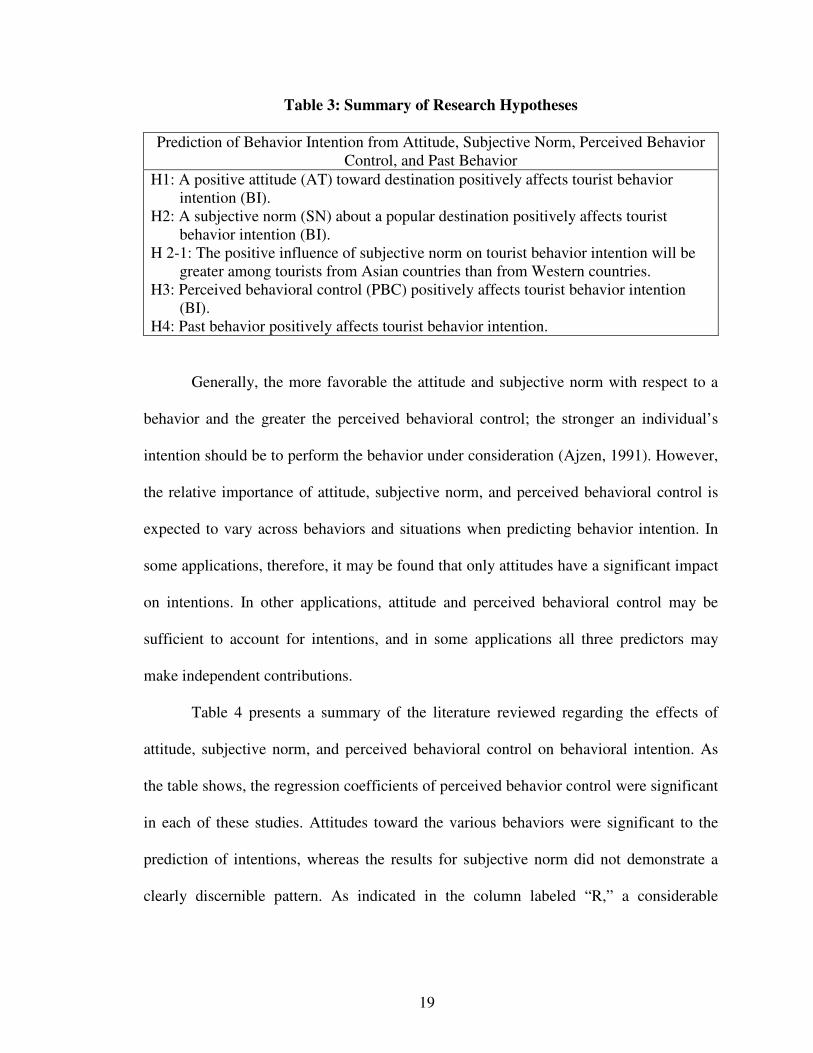
Table 3 summarizes the research hypotheses formulated in the research model.
19
Table 3: Summary of Research Hypotheses
Prediction of Behavior Intention from Attitude, Subjective Norm, Perceived BehaviorControl, and Past Behavior
H1: A positive attitude (AT) toward destination positively affects tourist behaviorintention (BI).
H2: A subjective norm (SN) about a popular destination positively affects touristbehavior intention (BI).
H 2-1: The positive influence of subjective norm on tourist behavior intention will begreater among tourists from Asian countries than from Western countries.
H3: Perceived behavioral control (PBC) positively affects tourist behavior intention(BI).
H4: Past behavior positively affects tourist behavior intention.
Generally, the more favorable the attitude and subjective norm with respect to a
behavior and the greater the perceived behavioral control; the stronger an individual’s
intention should be to perform the behavior under consideration (Ajzen, 1991). However,
the relative importance of attitude, subjective norm, and perceived behavioral control is
expected to vary across behaviors and situations when predicting behavior intention. In
some applications, therefore, it may be found that only attitudes have a significant impact
on intentions. In other applications, attitude and perceived behavioral control may be
sufficient to account for intentions, and in some applications all three predictors may
make independent contributions.
Table 4 presents a summary of the literature reviewed regarding the effects of
attitude, subjective norm, and perceived behavioral control on behavioral intention. As
the table shows, the regression coefficients of perceived behavior control were significant
in each of these studies. Attitudes toward the various behaviors were significant to the
prediction of intentions, whereas the results for subjective norm did not demonstrate a
clearly discernible pattern. As indicated in the column labeled “R,” a considerable
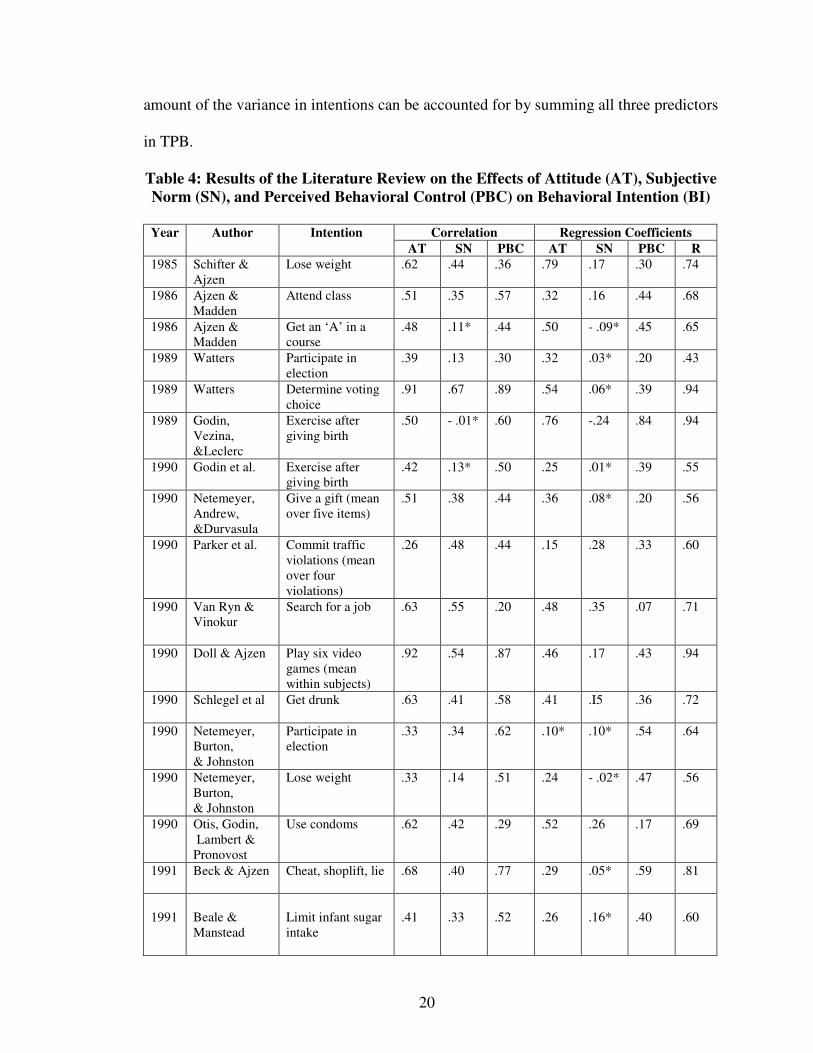
20
amount of the variance in intentions can be accounted for by summing all three predictors
in TPB.
Table 4: Results of the Literature Review on the Effects of Attitude (AT), SubjectiveNorm (SN), and Perceived Behavioral Control (PBC) on Behavioral Intention (BI)
Correlation Regression CoefficientsYear Author IntentionAT SN PBC AT SN PBC R
1985 Schifter &Ajzen
Lose weight .62 .44 .36 .79 .17 .30 .74
1986 Ajzen &Madden
Attend class .51 .35 .57 .32 .16 .44 .68
1986 Ajzen &Madden
Get an ‘A’ in acourse
.48 .11* .44 .50 - .09* .45 .65
1989 Watters Participate inelection
.39 .13 .30 .32 .03* .20 .43
1989 Watters Determine votingchoice
.91 .67 .89 .54 .06* .39 .94
1989 Godin,Vezina,&Leclerc
Exercise aftergiving birth
.50 - .01* .60 .76 -.24 .84 .94
1990 Godin et al. Exercise aftergiving birth
.42 .13* .50 .25 .01* .39 .55
1990 Netemeyer,Andrew,&Durvasula
Give a gift (meanover five items)
.51 .38 .44 .36 .08* .20 .56
1990 Parker et al. Commit trafficviolations (meanover fourviolations)
.26 .48 .44 .15 .28 .33 .60
1990 Van Ryn &Vinokur
Search for a job .63 .55 .20 .48 .35 .07 .71
1990 Doll & Ajzen Play six videogames (meanwithin subjects)
.92 .54 .87 .46 .17 .43 .94
1990 Schlegel et al Get drunk .63 .41 .58 .41 .I5 .36 .72
1990 Netemeyer,Burton,& Johnston
Participate inelection
.33 .34 .62 .10* .10* .54 .64
1990 Netemeyer,Burton,& Johnston
Lose weight .33 .14 .51 .24 - .02* .47 .56
1990 Otis, Godin,Lambert &
Pronovost
Use condoms .62 .42 .29 .52 .26 .17 .69
1991 Beck & Ajzen Cheat, shoplift, lie .68 .40 .77 .29 .05* .59 .81
1991 Beale &Manstead
Limit infant sugarintake
.41 .33 .52 .26 .16* .40 .60

21
1992 Ajzen &Driver
Choose among 5leisure intentions(mean withinsubjects)
.59 .70 .80 .28 .09* .62 .85
1992 Madden,Ellen, &Ajzen
Participate in 10common activities(mean withinsubjects)
.52 .36 .37 .43 .22 .26 .63
*Not significant; all other coefficients significant at p < .05.Source: The Theory of Planned Behavior (Ajzen, 1991).
A significant amount of empirical research has confirmed that the TPB model is
successful in explaining a variety of human behavior in the fields of hospitality and
tourism. Table 5 summarizes these findings in chronological order.
Table 5: Summary of TPB Applications in Hospitality and Tourism Research
Year Author Intention Relationship Correlation1992 Ajzen & Driver Leisure choice (BI + PBC)-B
BI-B PBC-B (AT+SN+PBC)-BIAT-BISN-BIPBC-BI
.78
.75
.73
.86
.54
.70
.802001 Oh & Hsu Gambling BI-B
AT-BISN-BIPBC-BIPB-BIPB-BI
.42*
.10*
.09*-.39 ~ .40*.43*1.20*
2001 Vanucci & Kerstetter Meeting planners’use of Internet
BI-B AT-BISN-BIPBC-BIPBC-B
27.57**44.98**26.21**31.94**48.96**
2005 Lee Associationmembers’ meetingparticipationintentions
AT – BISN – BIPBC – BIDI – BIPB – BI
.53
.20
.23
.15
.192005 Lam & Hsu Travel destination
choiceAT – BISN – BIPB– BI
0.360.280.32
*Path Coefficient (p <. 05); ** χ2 (df = 1, p <. 05); ( ) = Multiple correlation; AT=Attitude TowardBehavior, SN=Subjective Norm, PBC=Perceived Behavioral Control, BI=Behavioral Intention,B=Behavior, H=Habit, PB=Past Behavior, BB=Behavioral Belief, NB=Normative Belief, CB=ControlBelief, DI = Destination Image.

22
Applications of TPB
Studies have demonstrated the application of TPB in various contexts. These
studies have shown strong predictive utility for a wide range of behavioral intentions and
actual behaviors: smoking (Norman et al., 1999; Morrison et al., 1996); eating low-fat
food (Armitage & Conner, 1999; Paisley & Sparks, 1998); receiving hormone
replacement therapy (Quine & Rubin, 1997); safe-sex behavior (Boldero et al., 1999; de
Vroome et al., 2000); drinking alcohol (Morrison et al., 1996; Trafimow, 1996); choosing
a career (Vincent et al., 1998); wearing a safety helmet (Quine et al., 1998); engaging in
physical activity (Courneya et al., 1999; Trafimow & Trafimow, 1998); using illegal
substances (Conner et al., 1998; Conner & McMillan, 1999); choosing restaurants
(Simone et al., 2004); and choosing a travel destination (Lam et al., 2005). In general, the
literature supports the predictive power of TPB on behavioral intentions.
The Sufficiency of the Theory of Planned Behavior
Conner & Abraham (2001) mentioned that additional constructs might enhance
the theory of planned behavior. Many studies included measures of additional variables
in the prediction equation and showed significant improvement in the prediction of
intentions or behavior.
The addition of personal or normal norms can improve the prediction of
environmentally relevant behavior (Harland et al, 1999; Kristiansen & Hotte, 1996;
Manstead, 2000). Prediction of playing the lottery and of precautionary sexual behavior is
improved by adding anticipated regret (Richard et al, 1998; Sheeran & Orbell, 1999, Van
der Pligt et al, 1998). Measures of personality traits also improved prediction (Courneya
et al., 1999), but the addition of various demographic variables did not (Albarracin et al.,

23
1997). However, even when improvements were found, for the most part the
improvement in prediction of intentions or behavior was relatively minor, and their
generalizability to other behavioral domains has yet been demonstrated (Ajzen, 2001).
Sparks & Guthrie (1998) have challenged the assumption that the three variables in the
TPB model (attitude, subjective norm, and perceived behavior control) are sufficient to
permit prediction of behavioral intentions. Norman et al. (1999) argued that other
variables could further enhance the model’s predictive utility and significantly improve
its predictive power. Furthermore, Bentler & Speckart (1979) have suggested that past
behavior, which was not included in the TPB, could have a direct impact on the
formation of behavioral intention. Ajzen (1991) also believes that past behavior can be
used to test the sufficiency of any model because past behavior provides a control for at
least some of the omitted variables.

24
Travel Destination
Definition of Travel Destination
Destinations and their images attract tourists, motivate visits, and energize the
whole tourism system (Cooper et al., 1998). Researchers have used a number of
definitions that have contributed to the conceptualization of destination. Table 6 presents
selected definitions of destination.
Table 6: Selected Definitions of Destination
Author DefinitionMiddleton(1988)
Consists of five components: 1) the natural and man-made attractions of an area; 2) itsfacilities and services; 3) the ease of access to it; 4) the images used to attract touriststo it; and 5) the total cost of the holiday.
Hu & Ritchie(1993)
A package of tourism facilities and services, which, like any other consumer product,is composed of a number of multi-dimensional attributes.
Laws (1995) A place where people spend their holiday; its elements entail place, people, andholiday.
Seaton &Bennett (1996)
The catalyst link that precipitates all the industries in the tourism sector. Unlesspeople want to go somewhere, provisions for transporting them, housing them,feeding them, and amusing them will be in vain.
Cooper,Fletcher,Gilbert, &Wanhill (1998)
The focus of facilities and services designed to meet the needs of the tourist.Destination brings together all aspects of tourism including demand, transportation,supply, and marketing.
Murphy,Pritchard, &Smith (2000)
An amalgam of individual products and experience opportunities that combine toform a total experience of the area visited.
Deng, King, &Bauer (2002)
Overall attractiveness of a natural-based destination consists of 1) tourism resources,including natural and cultural resources; 2) tourists facilities, subdivided intoinfrastructure, recreational, and educational facilities; 3) accessibility, includingexternal and internal accessibility of destination; and 4) local communities andattractions.
Destination Products
Destination products include physical elements; social factors; the level, use, or
lack of infrastructure and technology in a destination; economic conditions; culture; and
politics. The physical elements of destination include scenic views, flora and fauna, and
environmental conditions such as the weather (Dunn & Iso-Ahola, 1991; Buckley, 1994;
Smith, 1999). Social factors include the friendliness of local people, the language spoken,
25
family structures, occupations, urban layout, and population density (Canestrelli & Costa,
1991; Machlis & Burch, 1983; Smith, 1999). Infrastructure (e.g., water and power) and
technology (e.g., computer technology and communications) are visible factors of
developed or under-developed tourism products that affect tourists’ experiences (Choy,
1992; Johnson & Edwards, 1994; Smith, 1999). Economic conditions, such as currency
exchange, market behavior, and pricing, can influence tourist experiences and thoughts
about a destination (Dieke, 1991; Stevens, 1992; Smith, 1999). Cultural attributes,
including authentic local culture and destination history, may be presented through
exposure to new destinations, sights, and experiences (Crompton, 1979; Dieke, 1991;
Stevens, 1992; Smith, 1999). Finally, the political dimension includes features such as
political stability, government policy, and the treatment of tourists (e.g., visa applications,
port of entry, specific entry conditions, etc.), all of which can affect the destination
environment that tourists experience (Teye, 1988; Hall, 1997; Richter, 1989; Smith,
1999). Smith (1999) concluded that a tourism product’s setting at the destination and the
effect of the service infrastructure on tourists’ experiences play significant roles in
determining tourists’ intentions to return to the destination.

26
The Destination Image
Definition of Destination Image
Destination image is one of the most prevalent topics in the tourism literature.
There are many definitions of images proposed in tourism context. Table 7 presents some
selected definitions of image.
Table 7: Selected Definitions of Image
Author(s) Definition
Hunt (1971) impressions that a person holds about a state in which they do not resideMarkin (1974) our own personalize, internalized and conceptualized understanding of what we
knowLawson & Bond-Bovy (1977)
an expression of knowledge, impressions, prejudice, imaginations andemotional thoughts an individual has of a specific object or place
Crompton (1979) the sum of beliefs, ideas and impressions that a person has of a destinationDichter (1985) an image is not only individual traits or qualities but also the impression an
entity makes on the minds of othersEchtner & Ritchie(1991&1993)
consist of two main components; those that are attribute based and those that areholistic based
Kotler et al (1994) the sum of beliefs, ideas, and impressions that a person has of a placeArrebola (1994) a mental representation of attributes and benefits sought of a productParenteau (1995) a favorable or unfavorable prejudice that the audience and distributors have of
the product or destinationGartner (1996) are made up of three distinctively different but hierarchical interrelated
components: components: cognitive, affective and conativeGallarza et al. (2002) Define image in term of its four features: 1) complex (it is not unequivocal), 2)
multiple (in elements and processes), 3) relativistic (subjective and generallycomparative), and 4) dynamic (varying with time and space)
Source: Gallarza, Saura & Garcia (2002: p. 60)
The Destination Image Attributes
Tourist destinations are an important element of the tourism system. Tourists
make decisions based on the composite value they attach with various attributes
(Swanson & Horridge, 2002). The perceived destination attributes affect the attitude of
the tourists toward selecting a destination (DelVecchio, 2001). As a consequence
destination competitiveness has become a significant part of tourism literature (Goodrich,
1978; Ahmed, 1991; Haahti & Yavas, 2003). Tourist perceptions of quality and overall

27
performance will play a significant role in determining repeat business or positive word-
of-mouth recommendation. The marketing of a destination requires an understanding of
what is important to tourists. A good understanding of tourists’ perceived importance of
destination presumably enables destination marketers the ability to entice potential
tourists. The result of this study will help destination marketers identify a location’s
strengths and weaknesses, providing critical insights on service delivery and product
development.
Destination image that represents the overall perception of physical activities or
characteristics of the destination is called functional image. On the other hand, the
intangible aspect of destinations such as atmosphere, mood of the place, and stereotypic
personality of destinations are called symbolic image (Echtner & Ritchie, 1993).
Functional and symbolic images are used during the destination selection process.
Traveling occurs when people perceive benefits associated with destinations. Functional
image of destinations create a mental picture of benefit that fulfill the needs of potential
travelers (Chon, 1991).
While studies of the destination attributes are somewhat plentiful, there has been
limited research on perceived attributes and their implications in determining the
competitive positions of destinations, particularly in a situation after a crisis. The analysis
measuring pre- and post-crisis offers a useful tool for understanding the perception that
may change after the crisis. Therefore, a formal study on the tourists’ perception of
important destination attributes before and after a crisis needs to be conducted.
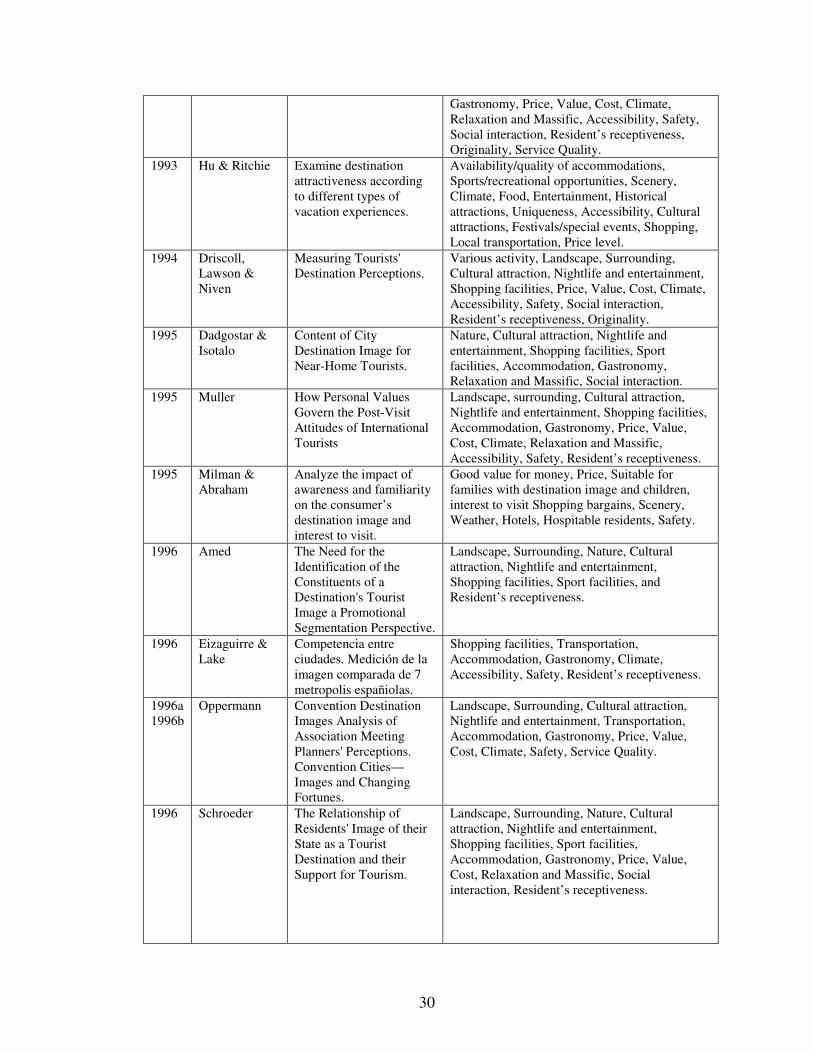
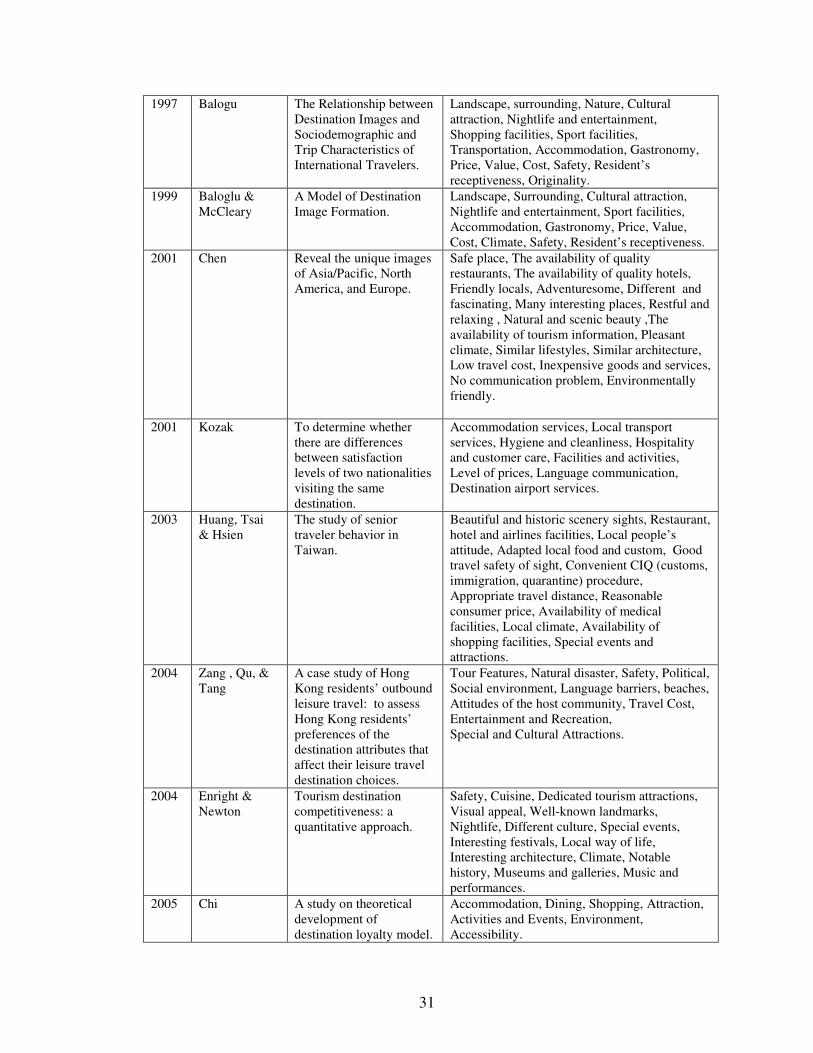
A review of the framework for outlining the attributes of a tourism destination
image has been developed. Table 8 summarizes the results of literature review showing
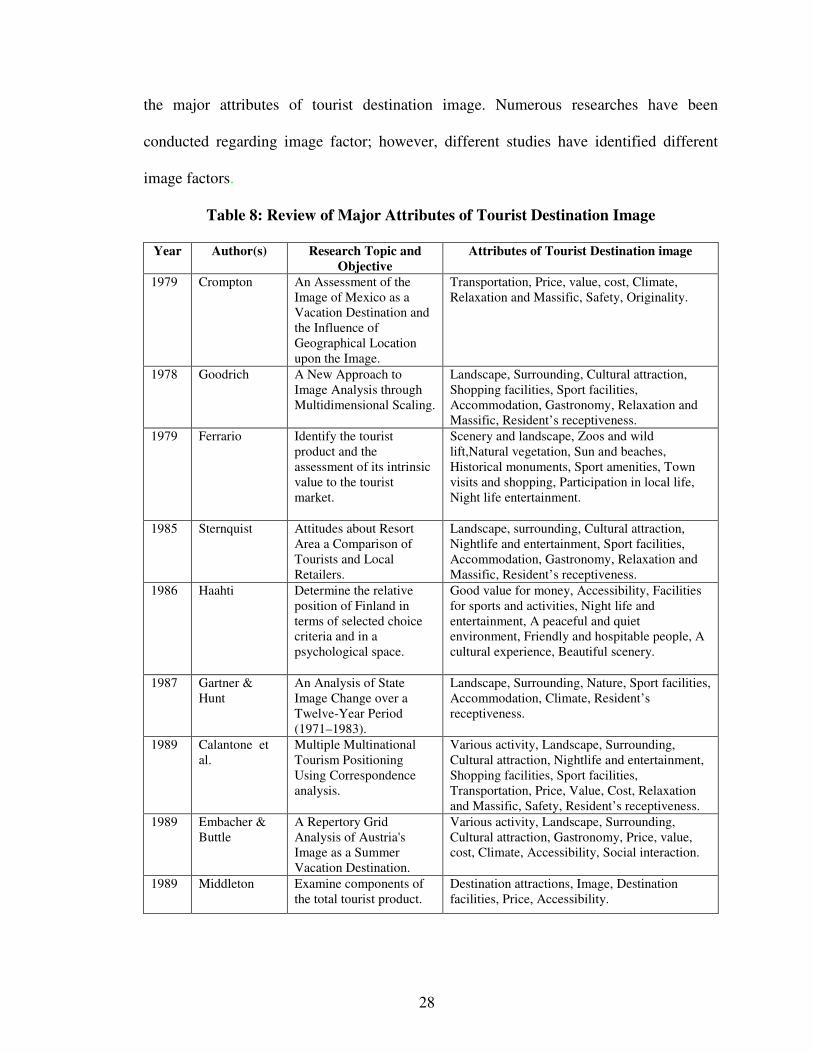
28
the major attributes of tourist destination image. Numerous researches have been
conducted regarding image factor; however, different studies have identified different
image factors.
Table 8: Review of Major Attributes of Tourist Destination Image
Year Author(s) Research Topic andObjective
Attributes of Tourist Destination image
1979 Crompton An Assessment of theImage of Mexico as aVacation Destination andthe Influence ofGeographical Locationupon the Image.
Transportation, Price, value, cost, Climate,Relaxation and Massific, Safety, Originality.
1978 Goodrich A New Approach toImage Analysis throughMultidimensional Scaling.
Landscape, Surrounding, Cultural attraction,Shopping facilities, Sport facilities,Accommodation, Gastronomy, Relaxation andMassific, Resident’s receptiveness.
1979 Ferrario Identify the touristproduct and theassessment of its intrinsicvalue to the touristmarket.
Scenery and landscape, Zoos and wildlift,Natural vegetation, Sun and beaches,Historical monuments, Sport amenities, Townvisits and shopping, Participation in local life,Night life entertainment.
1985 Sternquist Attitudes about ResortArea a Comparison ofTourists and LocalRetailers.
Landscape, surrounding, Cultural attraction,Nightlife and entertainment, Sport facilities,Accommodation, Gastronomy, Relaxation andMassific, Resident’s receptiveness.
1986 Haahti Determine the relativeposition of Finland interms of selected choicecriteria and in apsychological space.
Good value for money, Accessibility, Facilitiesfor sports and activities, Night life andentertainment, A peaceful and quietenvironment, Friendly and hospitable people, Acultural experience, Beautiful scenery.
1987 Gartner &Hunt
An Analysis of StateImage Change over aTwelve-Year Period(1971–1983).
Landscape, Surrounding, Nature, Sport facilities,Accommodation, Climate, Resident’sreceptiveness.
1989 Calantone etal.
Multiple MultinationalTourism PositioningUsing Correspondenceanalysis.
Various activity, Landscape, Surrounding,Cultural attraction, Nightlife and entertainment,Shopping facilities, Sport facilities,Transportation, Price, Value, Cost, Relaxationand Massific, Safety, Resident’s receptiveness.
1989 Embacher &Buttle
A Repertory GridAnalysis of Austria'sImage as a SummerVacation Destination.
Various activity, Landscape, Surrounding,Cultural attraction, Gastronomy, Price, value,cost, Climate, Accessibility, Social interaction.
1989 Middleton Examine components ofthe total tourist product.
Destination attractions, Image, Destinationfacilities, Price, Accessibility.

29
1989 Gartner Investigate attributeidentification along withtourism product position,using MDS.
Outdoor life, Sightseeing, Natural environment,Historical sites, Cultural sites, Night lift,Receptiveness, Liquor.
1990 Um &Crompton
Test the roles of attitudesin the pleasure traveldestination process.
A lot of fun, Travel cost, Others’recommendation, Climate, Outdoor recreation,Wide variety, Meet people with different lifestyle, Good to relax, Safety, Attractiveness ofnatural environment, Feeling of well-being,Time spent.
1990 Tang &Rochananond
Identify and quantify thefactors that make acountry attractive totourists.
Natural Beauty & Climate, Culture & Socialcharacteristics , Sport, Recreation & EducationFacilities, Shopping & Commercial Facilities,Infrastructure of the Country, Cost of Living,Attitudes Towards Tourists, Accessibility of theCountry.
1991 Ahmed The Influence of thecomponents of a state'stourist image on productpositioning strategy.
Landscape, Surrounding, Nature, Culturalattraction, Nightlife and entertainment,Shopping facilities, Sport facilities, Climate,Resident’s receptiveness.
1991 Chon Tourism DestinationImage ModificationProcess.
Landscape, Surrounding, Nature,Cultural attraction, Sport facilities,Transportation, Accommodation, gastronomy,Price, value, cost, Accessibility, Safety,Resident’s receptiveness, Originality.
1991 Fakeye &Crompton
Examine imagedifferences betweenprospective, first-timeand repeat visitors to theRio Grande Valley.
Social opportunities and attractions, Natural andcultural amenities, Accommodations andtransportation, Infrastructure, Foods, andfriendly people, Physical amenities andrecreation activities, Bars and eveningEntertainment.
1991 Guthrie &Gale Positioning Ski Areas. Various activity, Nightlife and entertainment,Information available, Sport facilities,Accommodation, Gastronomy, Price, Value,Cost, Relaxation and Massific, Accessibility,Social interaction, Resident’s receptiveness,Service Quality.
1992 Camichael Using Conjoint Modellingto Measure Tourist Imageand analyze Ski ResortChoice.
Various activity, Price, value, cost,Accessibility, Resident’s receptiveness.
1992 Chon The Role of DestinationImage in Tourism.
Various activity, Landscape, Surrounding,Cultural attraction, Shopping facilities, Sportfacilities, Accommodation, Gastronomy,Relaxation and Massific, Accessibility,Resident’s receptiveness, Service Quality.
1992 Cromptonet al.
Positioning: The Exampleof the Lower Rio GrandeValley in the Winter LongStay Destination Market.
Various activity, Nature, Nightlife andentertainment, Price, value, cost, Climate,Accessibility, Social interaction,Resident’s receptiveness, Originality.
1993 Echtner &Ritchie
The Measurement ofDestination Image: AnEmpirical Assessment.
Landscape, Surrounding, Nature, Culturalattraction, Nightlife and entertainment,Shopping facilities, Information available, Sportfacilities, Transportation, Accommodation,
30
Gastronomy, Price, Value, Cost, Climate,Relaxation and Massific, Accessibility, Safety,Social interaction, Resident’s receptiveness,Originality, Service Quality.
1993 Hu & Ritchie Examine destinationattractiveness accordingto different types ofvacation experiences.
Availability/quality of accommodations,Sports/recreational opportunities, Scenery,Climate, Food, Entertainment, Historicalattractions, Uniqueness, Accessibility, Culturalattractions, Festivals/special events, Shopping,Local transportation, Price level.
1994 Driscoll,Lawson &Niven
Measuring Tourists'Destination Perceptions.
Various activity, Landscape, Surrounding,Cultural attraction, Nightlife and entertainment,Shopping facilities, Price, Value, Cost, Climate,Accessibility, Safety, Social interaction,Resident’s receptiveness, Originality.
1995 Dadgostar &Isotalo
Content of CityDestination Image forNear-Home Tourists.
Nature, Cultural attraction, Nightlife andentertainment, Shopping facilities, Sportfacilities, Accommodation, Gastronomy,Relaxation and Massific, Social interaction.
1995 Muller How Personal ValuesGovern the Post-VisitAttitudes of InternationalTourists
Landscape, surrounding, Cultural attraction,Nightlife and entertainment, Shopping facilities,Accommodation, Gastronomy, Price, Value,Cost, Climate, Relaxation and Massific,Accessibility, Safety, Resident’s receptiveness.
1995 Milman &Abraham
Analyze the impact ofawareness and familiarityon the consumer’sdestination image andinterest to visit.
Good value for money, Price, Suitable forfamilies with destination image and children,interest to visit Shopping bargains, Scenery,Weather, Hotels, Hospitable residents, Safety.
1996 Amed The Need for theIdentification of theConstituents of aDestination's TouristImage a PromotionalSegmentation Perspective.
Landscape, Surrounding, Nature, Culturalattraction, Nightlife and entertainment,Shopping facilities, Sport facilities, andResident’s receptiveness.
1996 Eizaguirre &Lake
Competencia entreciudades. Medición de laimagen comparada de 7metropolis españiolas.
Shopping facilities, Transportation,Accommodation, Gastronomy, Climate,Accessibility, Safety, Resident’s receptiveness.
1996a1996b
Oppermann Convention DestinationImages Analysis ofAssociation MeetingPlanners' Perceptions.Convention Cities—Images and ChangingFortunes.
Landscape, Surrounding, Cultural attraction,Nightlife and entertainment, Transportation,Accommodation, Gastronomy, Price, Value,Cost, Climate, Safety, Service Quality.
1996 Schroeder The Relationship ofResidents' Image of theirState as a TouristDestination and theirSupport for Tourism.
Landscape, Surrounding, Nature, Culturalattraction, Nightlife and entertainment,Shopping facilities, Sport facilities,Accommodation, Gastronomy, Price, Value,Cost, Relaxation and Massific, Socialinteraction, Resident’s receptiveness.
31
1997 Balogu The Relationship betweenDestination Images andSociodemographic andTrip Characteristics ofInternational Travelers.
Landscape, surrounding, Nature, Culturalattraction, Nightlife and entertainment,Shopping facilities, Sport facilities,Transportation, Accommodation, Gastronomy,Price, Value, Cost, Safety, Resident’sreceptiveness, Originality.
1999 Baloglu &McCleary
A Model of DestinationImage Formation.
Landscape, Surrounding, Cultural attraction,Nightlife and entertainment, Sport facilities,Accommodation, Gastronomy, Price, Value,Cost, Climate, Safety, Resident’s receptiveness.
2001 Chen Reveal the unique imagesof Asia/Pacific, NorthAmerica, and Europe.
Safe place, The availability of qualityrestaurants, The availability of quality hotels,Friendly locals, Adventuresome, Different andfascinating, Many interesting places, Restful andrelaxing , Natural and scenic beauty ,Theavailability of tourism information, Pleasantclimate, Similar lifestyles, Similar architecture,Low travel cost, Inexpensive goods and services,No communication problem, Environmentallyfriendly.
2001 Kozak To determine whetherthere are differencesbetween satisfactionlevels of two nationalitiesvisiting the samedestination.
Accommodation services, Local transportservices, Hygiene and cleanliness, Hospitalityand customer care, Facilities and activities,Level of prices, Language communication,Destination airport services.
2003 Huang, Tsai& Hsien
The study of seniortraveler behavior inTaiwan.
Beautiful and historic scenery sights, Restaurant,hotel and airlines facilities, Local people’sattitude, Adapted local food and custom, Goodtravel safety of sight, Convenient CIQ (customs,immigration, quarantine) procedure,Appropriate travel distance, Reasonableconsumer price, Availability of medicalfacilities, Local climate, Availability ofshopping facilities, Special events andattractions.
2004 Zang , Qu, &Tang
A case study of HongKong residents’ outboundleisure travel: to assessHong Kong residents’preferences of thedestination attributes thataffect their leisure traveldestination choices.
Tour Features, Natural disaster, Safety, Political,Social environment, Language barriers, beaches,Attitudes of the host community, Travel Cost,Entertainment and Recreation,Special and Cultural Attractions.
2004 Enright &Newton
Tourism destinationcompetitiveness: aquantitative approach.
Safety, Cuisine, Dedicated tourism attractions,Visual appeal, Well-known landmarks,Nightlife, Different culture, Special events,Interesting festivals, Local way of life,Interesting architecture, Climate, Notablehistory, Museums and galleries, Music andperformances.
2005 Chi A study on theoreticaldevelopment ofdestination loyalty model.
Accommodation, Dining, Shopping, Attraction,Activities and Events, Environment,Accessibility.

32
2005 Truong &Foster
Using HOLSAT toevaluate touristsatisfaction atdestinations: The case ofAustralian holidaymakersin Vietnam. This paperseeks to review the valueof HOLSAT as a meansof identifying tourists’satisfaction with a holidaydestination, in this caseVietnam.
Positive attributes:The climate, Architecture sightseeing, Safewhilst traveling, Vietnam War sites, Cruise on ariver, Ethnic minority people, Food andbeverages, Hotel staff , Trekking orbackpacking, Vietnamese artifacts, Coastalregions religious sites and temples NationalParks and Reserves, Traditional Vietnamesemusic and dance, Historical sites, Local foodand drink, Shop in local markets, Local , Visitmuseums.Negative attributes:Crowding at attractions, Many beggars andstreet vendors, A lack of public toilet facilities,Pollution in the cities, Inefficient of Immigrationand Customs clearance.
Destination image, which affects the buying behaviors of potential tourists, has
received a lot of attention in recent years (Chon, 1991). Because potential tourists create
images of a destination, relative to competitors’ destinations, marketers must identify the
strengths and weaknesses of each destination to develop strong images to successfully
position that destination. The travel industry allocates a lot of money and effort to reduce
negative images and enhance positive images.
In the tourism literature, however, researchers vary in their identification of the
attributes that constitute destination image (e.g., Baloglu & McCleary, 1999; Crompton,
1979; Echtner & Ritchie, 1993; Fakeye & Crompton, 1991; Gartner & Shen, 1992).
Baloglu & McCleary (1999) considered image as being formed by perceptive/cognitive
evaluations and affective appraisals. Crompton (1979) considered destination image as
consisting only of a cognitive component. Garner & Shen (1992) stated that image
consists of three hierarchically interrelated components: cognitive, affective, and
conative. Variation in the attributes that constitute destination image may be due to the
characteristics of tourism products/services: intangibility (Fakeye & Crompton, 1991),
multidimensionality (Gartner & Shen, 1992), complexity (Echtner & Ritchie, 1993), and
33
subjectivity (Baloglu & McCleary, 1999). Such characteristics make it difficult to
conceptualize and measure destination image. Destination image is also complex because
of multiple views regarding its nature – collective vs. unipersonal. The content of
destination image – the components that generate the image and the ways in which these
components interact – is also debated. Therefore, destination image is relativistic because
it is simultaneously subjective (varying by person) and multidimensional (attribute-based
or holistic). Lastly, destination image is comparative because it involves assessments
among various objects and destinations (Gallar et al., 2002).
Therefore, the destination selection attributes used in this study are based largely
on the attractions of the destinations. Previous researchers have used unique images to
study tourist attractions. For example, Chon, Weaver, & Kim (1991) used the unique
images of tours of naval bases and ships to describe Norfolk, Virginia, Echtner & Ritchie
(1993) used reggae music, tropical climate, and Montego Bay as unique images of
Jamaica.
Based on the aforementioned literature review, a total of 32 attributes were
mainly derived from the eight previous empirical studies to measure tourist destination
image (Garner, 1989; Um & Crompton, 1990; Tang & Rochananond, 1990; Hu &
Ritchie, 1993; Eizaguirre & Lake, 1996; Chen, 2001; Enright&Newton, 2004; & Chi,
2005). Some ambiguous attributes were transformed into more concrete terms and are
adapted to suit to the Phuket situation, which results in designing more reliable and valid
survey instrument. Table 9 shows the 32 attributes of tourist destination image used in
this study.
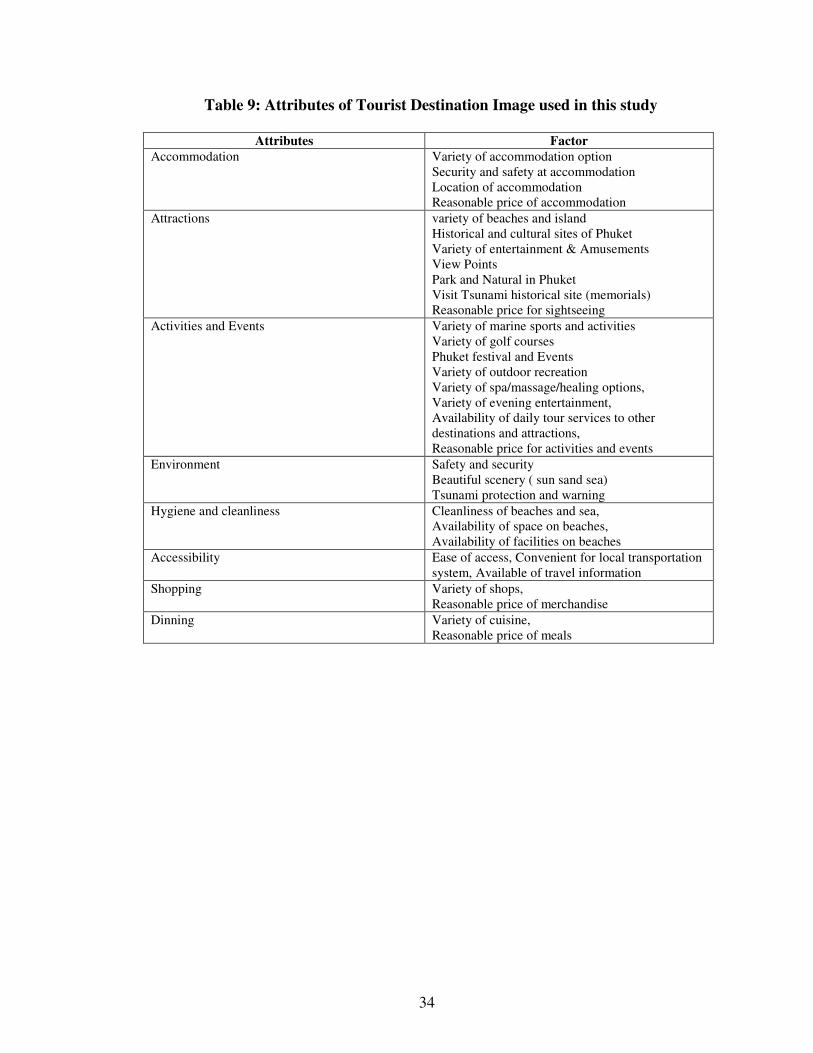
34
Table 9: Attributes of Tourist Destination Image used in this study
Attributes FactorAccommodation Variety of accommodation option
Security and safety at accommodationLocation of accommodationReasonable price of accommodation
Attractions variety of beaches and islandHistorical and cultural sites of PhuketVariety of entertainment & AmusementsView PointsPark and Natural in PhuketVisit Tsunami historical site (memorials)Reasonable price for sightseeing
Activities and Events Variety of marine sports and activitiesVariety of golf coursesPhuket festival and EventsVariety of outdoor recreationVariety of spa/massage/healing options,Variety of evening entertainment,Availability of daily tour services to otherdestinations and attractions,Reasonable price for activities and events
Environment Safety and securityBeautiful scenery ( sun sand sea)Tsunami protection and warning
Hygiene and cleanliness Cleanliness of beaches and sea,Availability of space on beaches,Availability of facilities on beaches
Accessibility Ease of access, Convenient for local transportationsystem, Available of travel information
Shopping Variety of shops,Reasonable price of merchandise
Dinning Variety of cuisine,Reasonable price of meals
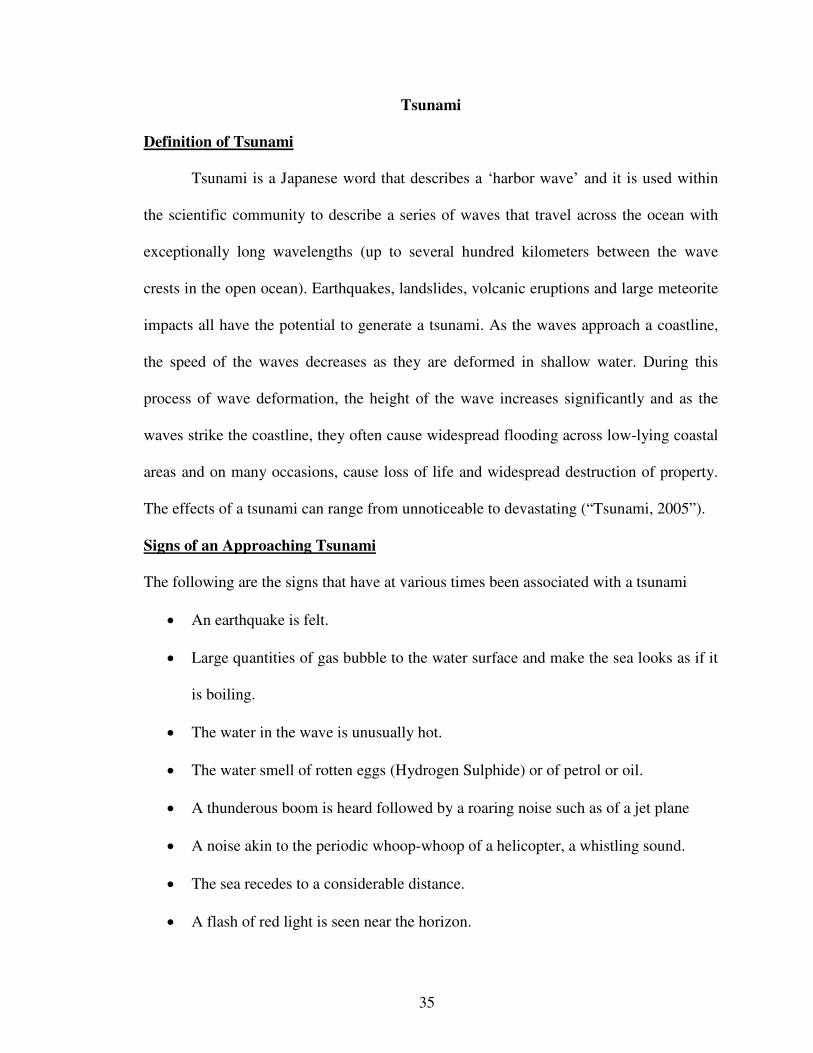
35
Tsunami
Definition of Tsunami
Tsunami is a Japanese word that describes a ‘harbor wave’ and it is used within
the scientific community to describe a series of waves that travel across the ocean with
exceptionally long wavelengths (up to several hundred kilometers between the wave
crests in the open ocean). Earthquakes, landslides, volcanic eruptions and large meteorite
impacts all have the potential to generate a tsunami. As the waves approach a coastline,
the speed of the waves decreases as they are deformed in shallow water. During this
process of wave deformation, the height of the wave increases significantly and as the
waves strike the coastline, they often cause widespread flooding across low-lying coastal
areas and on many occasions, cause loss of life and widespread destruction of property.
The effects of a tsunami can range from unnoticeable to devastating (“Tsunami, 2005”).
Signs of an Approaching Tsunami
The following are the signs that have at various times been associated with a tsunami
• An earthquake is felt.
• Large quantities of gas bubble to the water surface and make the sea looks as if it
is boiling.
• The water in the wave is unusually hot.
• The water smell of rotten eggs (Hydrogen Sulphide) or of petrol or oil.
• A thunderous boom is heard followed by a roaring noise such as of a jet plane
• A noise akin to the periodic whoop-whoop of a helicopter, a whistling sound.
• The sea recedes to a considerable distance.
• A flash of red light is seen near the horizon.

36
• As the wave approaches the top of the wave may glow red (“Tsunami, 2005”).
Past Tsunami
On December 26, 2004 an earthquake occurred in the Indian Ocean, resulting in
an Asian tsunami. It was not only Asian tsunami that has caused widespread destruction,
historically tsunami also have affected coastlines and islands worldwide. The information
in Table 10 shows past tsunami worldwide and cause of tsunami.
Table 10: Review of Past Tsunami Occurred
Year Location Cause6100 B.C.and before
The North Atlantic Ocean The Storegga Slides were a major series of suddenunderwater land movements over the course of tens ofthousands of years, which caused tsunamis across a widearea.
1650 B.C. Santorini, Greek island the volcanic Greek island Santorini erupted, causing a100 m to 150 m high tsunami that devastated the northcoast of Crete.
1755 Lisbon, Portugal Lisbon earthquake caused tsunami that killed more than athird of Libon’s population.
1883 Indonesia The island volcano of Krakatoa in Indonesia exploded withdevastating fury in 1883, blowing its underground magmachamber partly empty so that much overlying land andseabed collapsed into it. A series of large tsunami waveswas generated from the explosion.
1929 Burin Peninsula on thesouth coast ofNewfoundland
An earthquake of magnitude 7.2 occurred beneath theLaurentian Slope on the Grand Banks. The quake was feltthroughout the Atlantic Provinces of Canada and as farwest as Ottawa, Ontario and as far south as Claymont,Delaware. The resulting tsunami measured over 7 metersin height and took about 2½ hours to reach the BurinPeninsula on the south coast of Newfoundland.
1946 Pacific Tsunami The Aleutian Island earthquake resulted tsunami that killedpeople on Hawaii and Alaska.
1960 Onagawa, Japan ( ChileanTsunami)
The Great Chilean Earthquake generated one of the mostdestructive tsunamis. It spread across the entire PacificOcean, with waves measuring up to 25 meters high. Whenthe tsunami hit Onagawa, Japan, almost 22 hours after thequake, the wave height was 3 m above high tide.
1963 Northern Italy ( VajontDam disaster)
The reservoir behind the Vajont Dam in northern Italy wasstruck by an enormous landslide. A tsunami was triggeredwhich swept over the top of the dam (without bursting it)and into the valley below.
1964 Alaska, Britist Columbia,California, and coastalPacific Northwest towns
Good Friday Earthquake generated tsunami that struckAlaska, British Columbia, California and coastal PacificNorthwest towns, killing 121 people.
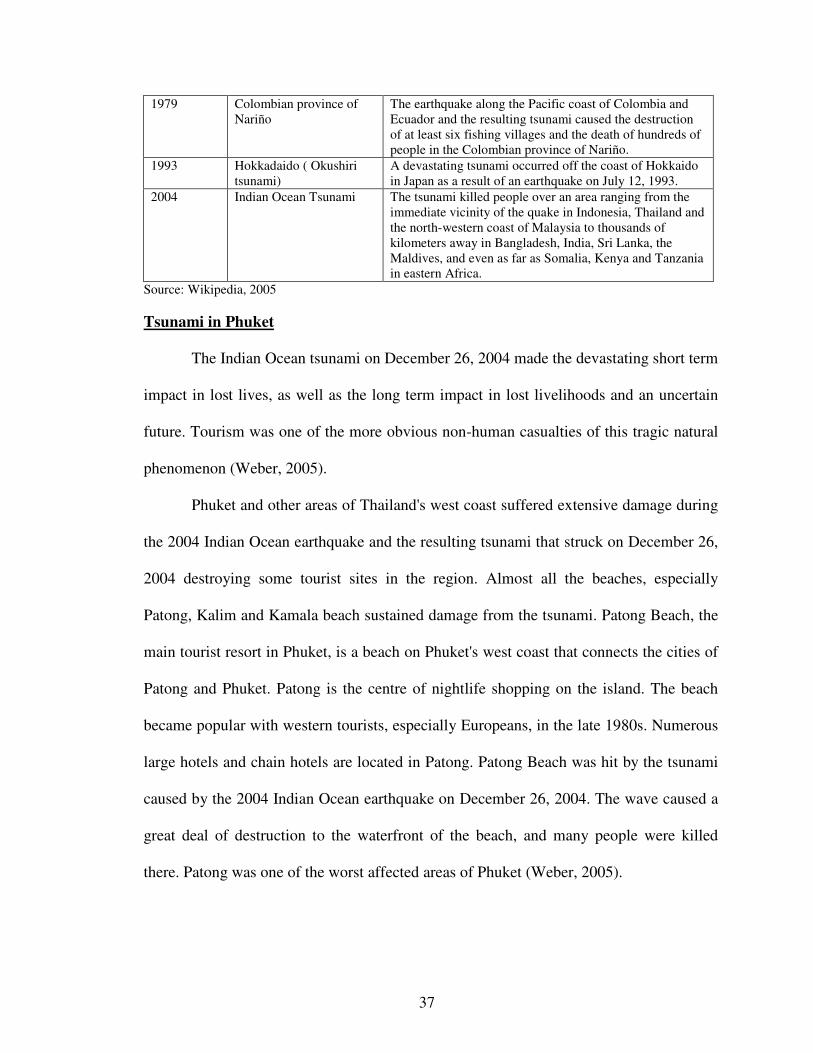
37
1979 Colombian province ofNariño
The earthquake along the Pacific coast of Colombia andEcuador and the resulting tsunami caused the destructionof at least six fishing villages and the death of hundreds ofpeople in the Colombian province of Nariño.
1993 Hokkadaido ( Okushiritsunami)
A devastating tsunami occurred off the coast of Hokkaidoin Japan as a result of an earthquake on July 12, 1993.
2004 Indian Ocean Tsunami The tsunami killed people over an area ranging from theimmediate vicinity of the quake in Indonesia, Thailand andthe north-western coast of Malaysia to thousands ofkilometers away in Bangladesh, India, Sri Lanka, theMaldives, and even as far as Somalia, Kenya and Tanzaniain eastern Africa.
Source: Wikipedia, 2005
Tsunami in Phuket
The Indian Ocean tsunami on December 26, 2004 made the devastating short term
impact in lost lives, as well as the long term impact in lost livelihoods and an uncertain
future. Tourism was one of the more obvious non-human casualties of this tragic natural
phenomenon (Weber, 2005).
Phuket and other areas of Thailand's west coast suffered extensive damage during
the 2004 Indian Ocean earthquake and the resulting tsunami that struck on December 26,
2004 destroying some tourist sites in the region. Almost all the beaches, especially
Patong, Kalim and Kamala beach sustained damage from the tsunami. Patong Beach, the
main tourist resort in Phuket, is a beach on Phuket's west coast that connects the cities of
Patong and Phuket. Patong is the centre of nightlife shopping on the island. The beach
became popular with western tourists, especially Europeans, in the late 1980s. Numerous
large hotels and chain hotels are located in Patong. Patong Beach was hit by the tsunami
caused by the 2004 Indian Ocean earthquake on December 26, 2004. The wave caused a
great deal of destruction to the waterfront of the beach, and many people were killed
there. Patong was one of the worst affected areas of Phuket (Weber, 2005).

38
Signs and Warnings
At approximately 09:30 AM (local time), the sea started to retreat by about 100
meters within 5 minutes. While the sea was staying at a very low level quite far from the
beach, people started to see that fish were stranded in pools of water and started to play
with the fish. Suddenly, without warning and any visible sign of approaching danger, the
sea started to rise again, inducing everyone to run to the higher part of the beach. The
retreat-and-rise cycle was repeated several times that day, a full cycle taking between 30
to 45 minutes between each peak (“Tsunami, 2005”).
Despite a time lag of up to several hours between the earthquake and the impact
of the tsunami, nearly all of the victims were taken completely by surprise; there were no
tsunami warning systems in the Indian Ocean to detect tsunamis, or equally important, no
system to warn the people living around the ocean. Tsunami detection is not easy because
when a tsunami is in deep water, it is also very low in height and a network of sensors is
needed to detect it. Setting up the communication infrastructure to issue timely warnings
is an even bigger problem, particularly in a relatively poor part of the world (Tsunami,
2005).
Economic Loss
Across the six provinces of Thailand’s Andaman Sea Coast, namely Ranong,
Phang-nga, Phuket, Krabi, Trang and Satun, many coastal areas and islands in their
territories were affected by the tsunami. Total damages in the six provinces was estimated
as amounting to 14,636.19 million baht, equivalent to US$ 3.7 billion
([email protected]) or Euro 2.9 billion (Euro1.00@baht 50.00) (Weber, 2005).
According to Thailand’s National Economic and Social Development Board (NESDB),

39
the worst affected sector was the tourism and hospitality industry. Thailand was assumed
to lose approximately 30,000 million baht (approximately equivalent to US$ 750 million
or Euro 600 million) in revenue solely because of cancellations of holiday booking. The
cancellations of holiday booking decrease Gross National Product (GNP) approximately
0.3%.
Prior to Tsunami occurs, tourism and hospitality industry of Thailand’s Andaman
Sea coast and island, especially in the province of Phuket, Phang-nga and Krabi had
generated income approximately 400,000 million baht (equivalent to US$10 billion or
Euro 8 billion), or one quarter of the national earning from the tourism and hospitality
industry. Tourism Authority of Thailand (TAT) reported the impact on the tourism and
hospitality industry for the first quarter of the year 2005 that the number of international
tourists to Thailand decreases approximately 5 million travelers, which would cause a
loss of income amounting to approximately 43,000 million baht (equivalent to US$1,075
million or Euro 860 million) (Weber, 2005).
According to Weber (2005), the valuation of losses in Phuket was:
• The biggest portion (90.81%) accounted for business enterprises in the
industry and service sectors. It was estimated approximately to
3,954,082,932 baht, equivalent to US$ 100 million or Euro 80 million.
• An estimate of the damage caused by the Tsunami to fisheries sector
was approximately to 344,911,169 baht, equivalent to US$8.6 million
or Euro 6.9 million.

40
• An estimate of the damage caused by the Tsunami to livestock
production was approximately to 303,650 baht, equivalent to US$
7,600 or Euro 6,100.
• An estimate of the damage caused by the Tsunami to cropping
enterprise was approximately to 300,000 baht, equivalent to US$ 7,500
or Euro 6,000.
• An estimate of the damage caused by the Tsunami to school building
was approximately to 30,000,000 baht, equivalent to US$ 750,000 or
Euro 600,000.
• Live damage: 260 people were dead (149 Thais and 111 foreigners).
1,111 people were injured (591 Thais and 520 foreigners). 646 people
have been missing (261 Thais and 385 foreigners).
41
Destination in a Time of Crisis
A crisis may be defined as any unplanned event or situation emerging from the
internal or external environment. Crisis can disrupt operations, threaten tourists and
employees both physically and mentally, as well as endanger an economic status and
future viability (Kash & Darling, 1988). Crisis is also seen as a surprise, panic,
uncertainty, shock, fear, threat and stress ( Burnett, 1998; Darling, 1994).
Tourism demand is particularly sensitive to security and health concerns (Blake &
Sinclair, 2003). The list of cases where tourism has taken a sudden and unexpected
downturn is long, and those events include the effects of the Gulf War on tourism in the
Middle East, the Mediterranean, and other European countries, the 1997 terrorist attacks
at Luxor in Egypt, the Kosovo conflict in 1999, the effects of the 2001 foot and mouth
disease outbreak in the United Kingdom, the effects of the September 11 terrorist attacks
in the United States, and most recently, the Indian Ocean tsunami in December, 2004 in
most of these cases, where governments have actually recognized the importance of the
tourism downturn and acknowledged the need for a policy response.
The case of the tsunami in Phuket is a notable example. Tsunami crisis has
become an integral part of business activities, and tourism is no exception. The risks that
lie within tourism are not only related to the individual tourist, but also related to the host
society (Steene, 1999). The image of a destination is a critical factor in the tourists’
destination selection process (Sirgy & Su, 2000). A positive image of destination results
in more visitations (Gartner & Hunt, 1987; Gartner & Shen, 1992; Dimanche & Lepetic,
1999), but changing a negative image requires long and costly marketing efforts. Since
the tourists’ perceptions of safety concerning a destination will influence their intentions

42
to visit (Dimanche & Lepetic, 1999; Sonmez & Graefe, 1998), it is important to
reintroduce a destination by providing up-to-date information (Durocher, 1994).
Nowadays tourists have a wide choice for holiday travel. One destination can
easily be substituted by a similar or even completely different place elsewhere. Tourists
usually do not even consider traveling near places where they might be at risk. They
prefer to wait until the crisis in the respective country becomes normal again. This is
simply the basic attitude of tourists (Cavlek, 2002). Crisis leads to negative economic
effects on international tourism flow in respective destinations. Hence, the tourism
industry has to find ways to manage the disasters after effects (Sonmez, Apostopoulos
and Tarlow, 1999).
Attitude towards Destination in Times of Crisis
In time of crisis, media and journalists will not recommend to their reader or
viewers that it is safe to travel to a destination that their government considers to be a
risky zone; even when they themselves might have been to the destination and are
convinced that some parts of the destination are safe. In times of crisis people find
negative reports far more interesting than positive. These influence the image of a
destination and thus have a direct impact on the tourism industry (Croatia, 2002). There
have been many examples of the reactions of tourists towards destinations hit by crisis,
which support the points raised.
• In 1989, after Beijing China’s Tiananmen Square incident, about 300 tour
groups cancelled their travel plans, and the country's tourism earnings
declined by $430 million in 1989 (Gartner & Shen 1992).

43
• In Egypt between 1992 and 1994, over 120 tourists were targeted by
Islamic terrorists’ attacks during this period. While some European tour
operators removed the country from their program entirely, others reduced
the number of tours significantly. During this time, Egypt recorded a
significant drop in arrivals of 22% (Wahab 1996).
• Between 1992 and 1994, after several killings of foreign tourists in
different locations in Florida, European tour operators still decided to keep
Florida in their programs. The drop in tourists in 1993 from the British
market alone was around 10% (Cavlek, 2002).
• In Moscow, during August of 1993, Moscow television broke a story
reporting that more than 4,000 people were affected by diphtheria in
Russia, with 900 in Moscow alone, the biggest British tour operator,
Thomson, cancelled its whole Moscow and St. Petersburg program for the
entire year (Cavlek, 2002).
44
Travel Motivation
Travel motivation refers to a set of needs that cause a person to participate in a
tourist activity (Pizam, Neumann, & Reichel, 1979). According to Cropmton (1979) most
tourist motivation related to travelers’ decision making in choosing a destination involves
the concept of push and pull factors. Tourists are pushed and pulled by some sources of
inherent forces. These forces explain how individuals are pushed by internal variables,
and how they are pulled by a travel destination (Uysal & Hagan, 1993). The push factors
are socio-psychological motives such as the desire for escape, novelty seeking, adventure
seeking, dream fulfillment, rest and relaxation, health and fitness, prestige, and
socialization. Most push factors originate from intangible or intrinsic desires of human
beings (Uysal & Jurowski, 1993; Chon, 1989). The pull factors are motives aroused by
the destination rather than emerging exclusively from within the travelers themselves.
Pull factors include tangible and intangible cues of a specific destination that pull people
to realize the needs of particular travel experiences, such as natural and historic
attractions, food, people, recreation facilities, and marketed image of the destination
(Uysal & Hagan, 1993). The push motivations have been thought useful for explaining
the desire to go on a vacation while pull motivations have been thought useful for
explaining the choice of destination. For example, Dann (1977) states:
While a specific resort may hold a number of attractions for the potentialtourist, his actual decision to visit such a destination is consequent on hisprior need for travel. An examination of "push" factors is thus logically,and often temporally antecedent to that of "pull" factors.
According to Kozak (2001), an empirical examination of tourist motivations
should be undertaken because it helps identify the attributes that are to be promoted to
match tourist motivations, or to identify markets in which destination features and

45
resources match tourist motivation. Recent recognition that tourism is one of the fastest
growing sectors has prompted researchers to explore the motivations of travel. Significant
research has been done regarding motivation factor; however, different studies have
identified different motivation factors. Table 11 reviews major attributes of travel
motivation.
Table 11: Review of Major Attributes of Travel Motivation
Year Author(s) Research Topic and Objective Attributes of Tourist Destination1979 Crompton Motivations for pleasure
vacation: to identify motiveswhich directed respondents’selection of destination
Socio-Psychological Motive (Escapefrom a perceived mundaneenvironment, Exploration andevaluation of self, Relaxation, Prestige,regression, Enhancement of kinshiprelationships, Facilitation of socialinteraction.
Cultural Motives (Novelty-curiosity-adventure-new and different,education).
1989 Pyo, Mihalik& Uysal
Attraction Attributes andMotivation: A canonicalcorrelation Analysis: toinvestigate the relationshipbetween two sets ofvariables(destination attributesand motives) by using canonicalanalysis
Visiting places important in history,Spending time with someone special,Experiencing a simpler lifestyle,Going place many people hasn’t seen,Talking about the trip after I returnhome, Getting away from pressures andresponsibilities, Experiencing differentcultures. Ways of life, Traveling toplaces where I feel safe and secure,Being physically active, Having fun,being entertained, Having lots ofdifferent things to see and do, Visitingfriends and relatives, Visiting placesmy family came from, Becoming morehealthy and fit, Just resting andrelaxing, Taking advantage of reducedfares, Fulfilling a dream of visiting aplace I’ve always wanted to visit,Meeting someone of the opposite sex,Finding thrills and excitement, Meetingpeople of similar interests, Beingpampered.
1990 Gitelson &Kerstetter
The relationship betweensociodemographic variable,benefits sought and subsequentvacation behavior: a case study
Relaxation (Relax, Experience solitude,Get away from it all, Get recharged, Beable to do nothing, Release tension,Have privacy, Escape from the routine,Not have to rush).

46
Explorer (Learns new things, Seeinteresting sights, Explore new places,View scenery).
Excitement (Do exciting things, Beentertained, Do a specific activity,Experience luxury, Be in control)
Social (Visit friends, Share a familiarplace with others, Return to favoritevacation site, Do something with thefamily)
Miscellaneous (Eat good food, Goshopping)
Miscellaneous ( Meet new people,Learn about yourself)
1992 Loker &Perdue
A benefit-based segmentation ofnonresident summer travelmarket: to examine thefeasibility of segmenting anonresident tourist market on thebasis of vacation benefit sought.
Escape/Relaxation (To take it easy, Toget away from daily routine, To getaway from demands of everyday life,To relax and do nothing, To have apeaceful vacation).
Natural Surrounding (To get awayfrom commercialized tourist traps, Toget away from crowds, To experienceunpolluted/natural surrounding).
Excitement variety (To visit new andexciting places, To do as manydifferent things as possible, Toexperience new/ different places).
Family and Friends. (To spend timewith family and friends).
1995 Tinsley &Eldredge
Psychological benefits of leisureparticipation: taxonomy ofLeisure Activities based on theirNeed-Gratifying Properties.
Novelty, Sensual enjoyment, Cognitive,stimulation, Self-expression, Creativity,(Vicarious) competition, Relaxation,Agency, Belongingness, and service.
1998 Ryan &Glewndon
Application of leisure motivationscale to tourism
Relax Mentally, Discover New Placesand Things, Avoid the Hustle andBustle of Daily Life, Relax Physically,Be in a Calm Atmosphere, Increase myKnowledge, Have a Good Time withFriends, Be with Others, BuildFriendships with Others, Use myImagination, Gain a Feeling ofBelonging, Challenge my Abilities,Use my Physical Abilities/Skills inSport, Develop Close Friendships.
1999 Kozak &Rimmington
Measuring tourist destinationcompetitiveness: conceptualconsiderations and empiricalfindings
Relax, Enjoy good weather, Have fun,Forget day-to-day problems, Increaseknowledge of new places, Beemotionally and physically refreshed,
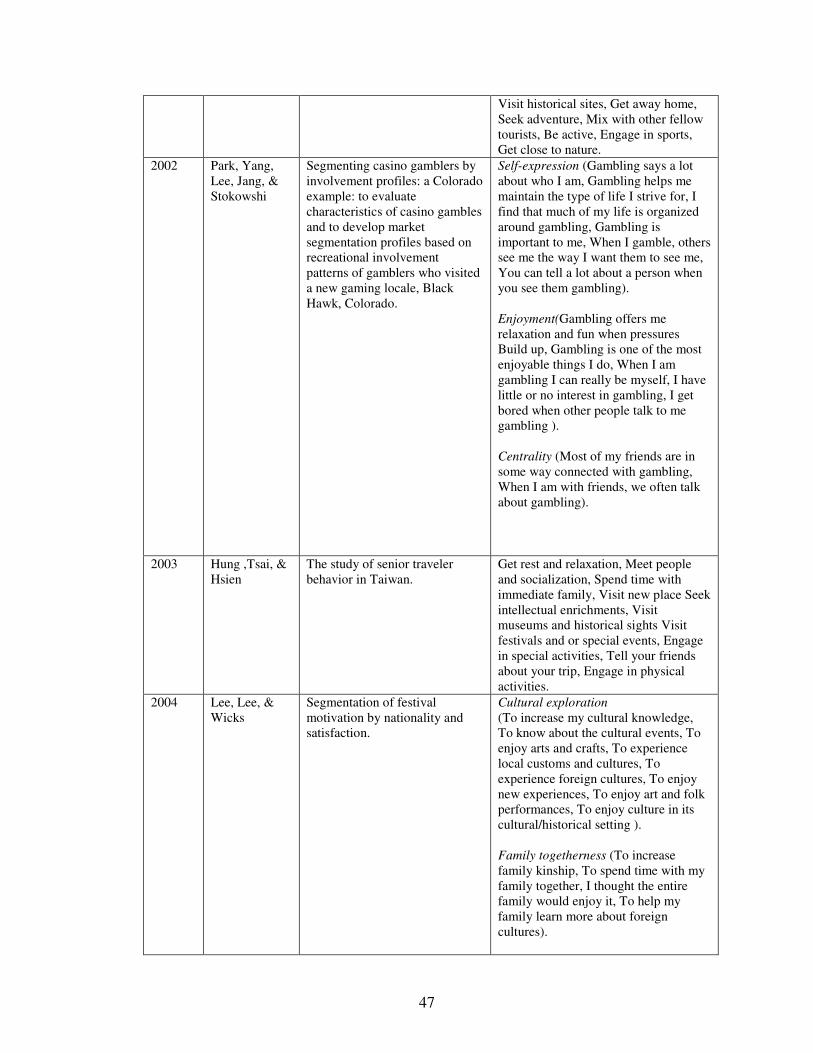
47
Visit historical sites, Get away home,Seek adventure, Mix with other fellowtourists, Be active, Engage in sports,Get close to nature.
2002 Park, Yang,Lee, Jang, &Stokowshi
Segmenting casino gamblers byinvolvement profiles: a Coloradoexample: to evaluatecharacteristics of casino gamblesand to develop marketsegmentation profiles based onrecreational involvementpatterns of gamblers who visiteda new gaming locale, BlackHawk, Colorado.
Self-expression (Gambling says a lotabout who I am, Gambling helps memaintain the type of life I strive for, Ifind that much of my life is organizedaround gambling, Gambling isimportant to me, When I gamble, otherssee me the way I want them to see me,You can tell a lot about a person whenyou see them gambling).
Enjoyment(Gambling offers merelaxation and fun when pressuresBuild up, Gambling is one of the mostenjoyable things I do, When I amgambling I can really be myself, I havelittle or no interest in gambling, I getbored when other people talk to megambling ).
Centrality (Most of my friends are insome way connected with gambling,When I am with friends, we often talkabout gambling).
2003 Hung ,Tsai, &Hsien
The study of senior travelerbehavior in Taiwan.
Get rest and relaxation, Meet peopleand socialization, Spend time withimmediate family, Visit new place Seekintellectual enrichments, Visitmuseums and historical sights Visitfestivals and or special events, Engagein special activities, Tell your friendsabout your trip, Engage in physicalactivities.
2004 Lee, Lee, &Wicks
Segmentation of festivalmotivation by nationality andsatisfaction.
Cultural exploration(To increase my cultural knowledge,To know about the cultural events, Toenjoy arts and crafts, To experiencelocal customs and cultures, Toexperience foreign cultures, To enjoynew experiences, To enjoy art and folkperformances, To enjoy culture in itscultural/historical setting ).
Family togetherness (To increasefamily kinship, To spend time with myfamily together, I thought the entirefamily would enjoy it, To help myfamily learn more about foreigncultures).
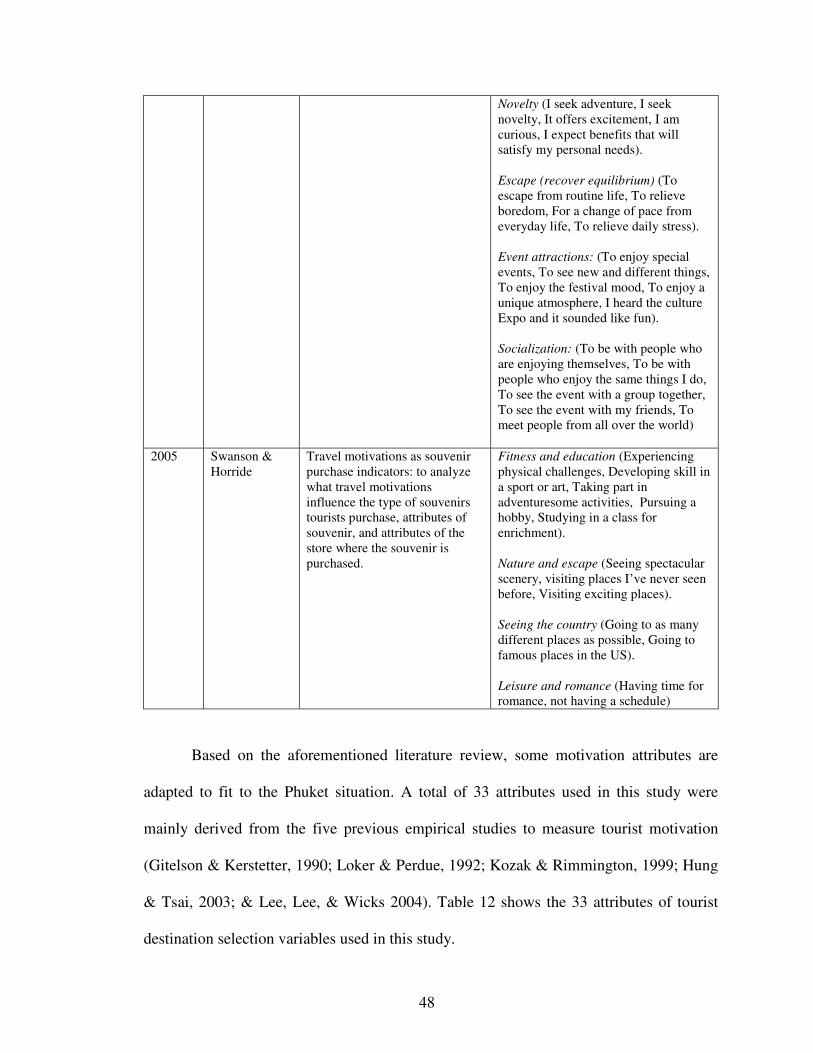
48
Novelty (I seek adventure, I seeknovelty, It offers excitement, I amcurious, I expect benefits that willsatisfy my personal needs).
Escape (recover equilibrium) (Toescape from routine life, To relieveboredom, For a change of pace fromeveryday life, To relieve daily stress).
Event attractions: (To enjoy specialevents, To see new and different things,To enjoy the festival mood, To enjoy aunique atmosphere, I heard the cultureExpo and it sounded like fun).
Socialization: (To be with people whoare enjoying themselves, To be withpeople who enjoy the same things I do,To see the event with a group together,To see the event with my friends, Tomeet people from all over the world)
2005 Swanson &Horride
Travel motivations as souvenirpurchase indicators: to analyzewhat travel motivationsinfluence the type of souvenirstourists purchase, attributes ofsouvenir, and attributes of thestore where the souvenir ispurchased.
Fitness and education (Experiencingphysical challenges, Developing skill ina sport or art, Taking part inadventuresome activities, Pursuing ahobby, Studying in a class forenrichment).
Nature and escape (Seeing spectacularscenery, visiting places I’ve never seenbefore, Visiting exciting places).
Seeing the country (Going to as manydifferent places as possible, Going tofamous places in the US).
Leisure and romance (Having time forromance, not having a schedule)
Based on the aforementioned literature review, some motivation attributes are
adapted to fit to the Phuket situation. A total of 33 attributes used in this study were
mainly derived from the five previous empirical studies to measure tourist motivation
(Gitelson & Kerstetter, 1990; Loker & Perdue, 1992; Kozak & Rimmington, 1999; Hung
& Tsai, 2003; & Lee, Lee, & Wicks 2004). Table 12 shows the 33 attributes of tourist
destination selection variables used in this study.
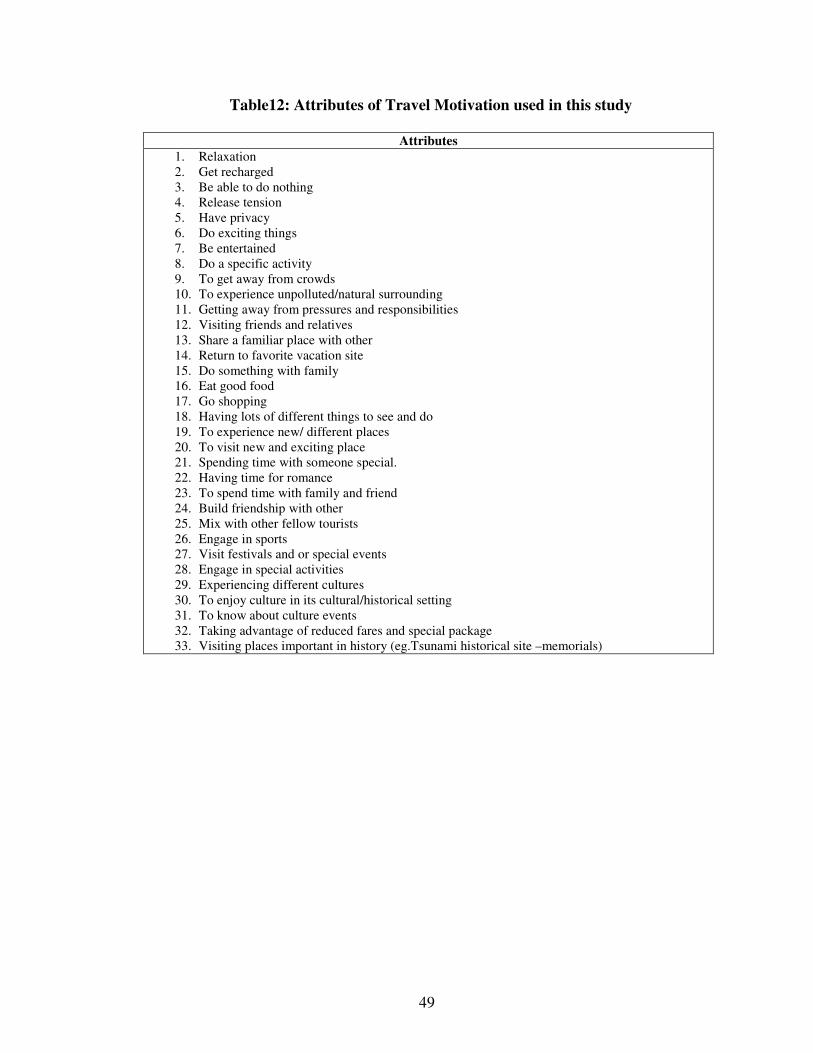
49
Table12: Attributes of Travel Motivation used in this study
Attributes1. Relaxation2. Get recharged3. Be able to do nothing4. Release tension5. Have privacy6. Do exciting things7. Be entertained8. Do a specific activity9. To get away from crowds10. To experience unpolluted/natural surrounding11. Getting away from pressures and responsibilities12. Visiting friends and relatives13. Share a familiar place with other14. Return to favorite vacation site15. Do something with family16. Eat good food17. Go shopping18. Having lots of different things to see and do19. To experience new/ different places20. To visit new and exciting place21. Spending time with someone special.22. Having time for romance23. To spend time with family and friend24. Build friendship with other25. Mix with other fellow tourists26. Engage in sports27. Visit festivals and or special events28. Engage in special activities29. Experiencing different cultures30. To enjoy culture in its cultural/historical setting31. To know about culture events32. Taking advantage of reduced fares and special package33. Visiting places important in history (eg.Tsunami historical site –memorials)

50
Travel Involvement
Involvement has been conceptualized in the consumer behavior field. Many
studies view perceived personal relevancy and the resulting motivational function as the
essential characteristics of involvement (Greenward & Leavitt, 1984; Rothschild, 1984;
Park & Mittal, 1985; Zaichkowsky, 1985; Celsi & Olson, 1988).
Travel involvement, therefore, is defined as a person’s perceived relevance to and
interest in travel and tourism based on inherent needs, values, and interests
(Zaichkowsky, 1985). Involvement can be divided into two dimensions, intention and
behavior. Involvement is based on personal subjectivity. It explains how an individual
develops involvement from an uninterested state to being involved positively (Mitchell,
1980).
Zaichkowsky (1985) defined involvement as a person’s perceived relevance of an
object based on inherent needs, values, and interests. Houston & Rothschild (1978)
defined involvement as a function of an enduring involvement or a need, derived from a
value in the individuals’ hierarchy of needs.
Warrington & Shim (2000) considered involvement as a motivational force
consisting of three fundamental features: intensity, direction, and persistence. Intensity
refers to the degree of involvement, direction means the target of the involvement
intensity, and persistence indicates the duration of the involvement intensity. Involvement
is a goal-directed arousal capacity. It is a person’s motivational state directed toward that
capacity (Park & Mittal, 1985).
Broderick & Mueller (1999) found that involvement has a significant impact on
all aspects of the consumption process including evaluation of alternatives, decision-

51
making, and the search for information. When a person’s involvement increases, he or
she is more inclined to have a positive attitude and decision-making paradigm due to his
or her increased interest in the object (Koufaris, 2002). More specifically, as a tourist’s
involvement increases, he or she is more eager to search for product-related information
and tends to develop more expertise by gaining familiarity with destination choices and
tourism products (Gursoy & McCleary, 2004). Reid & Crompton (1993) found that the
level of involvement significantly influences a person’s response to leisure purchases.
People with high involvement are more inclined to purchase leisure services.
Miguel, Caplliure, & Aldas-Manzano (2002) stated that people with a high level
of involvement tend to show a greater level of product knowledge by realizing the
strengths and weaknesses of alternatives. Applied to the tourism context, highly involved
tourists tend to pay more attention to the search for information and are more likely to be
opinion leaders by delivering that information to other individuals in a preferred manner
(Jamrozy, Backman, & Backman, 1996). Quester & Lim (2003) studied the relationship
between product involvement and loyalty. They found that highly involved consumers
are more likely to exhibit high levels of psychological attachment, including brand
commitment and brand loyalty. The entire consuming behavior is affected by
involvement, which includes the desire to purchase again.
According to Zaichkowsky (1985), an individual’s level of involvement is
affected by three components: (1) personal characteristics including inherent needs,
values, and interests toward the object; (2) physical elements of the object evoking a
person’s interest such as characteristics of the object that cause differential and increased

52
interest; and (3) situational factors, which temporarily increase relevance toward or
interest in the object.
Repeat Travelers
A number of researchers have examined the differences between first-time and
repeat travelers (Gitelson & Crompton, 1984; Fakeye & Crompton, 1991). Gitelson &
Crompton (1984) found that repeat travelers are more likely to be seeking relaxation,
while new travelers are more likely to be seeking variety. According to Gitelson &
Crompton’s study (1984), people return to a familiar destination for one or more of five
reasons: 1) reduce risk/are satisfied with a particular destination; 2) reduce risk/find the
same kind of people; 3) have an emotional attachment to a particular destination; 4)
further explore a destination, and 5) show the destination to other people.
Fakeye & Crompton (1991) studied the differences in motives between non-
travelers, first-timer travelers, and repeat travelers. They found that a destination’s pull
factors (the physical attractions of the destination) are the key motivators for non-
travelers and first-timer travelers, whereas push factors (an individual’s social-
psychological needs) are the key motivators for repeat travelers. Fakeye & Crompton also
mentioned that travelers develop a more complex and differentiated image of a
destination once they have spent time there. During the first visit, most aspects of a
traveler’s image of the destination can change. However, repeat travelers tend to
reconfirm previously formed images of the destination.
Most destination choice models have included previous experience as one of the
factors affecting destination awareness and traveler destination preferences. Familiarity

53
with a destination may produce a tendency for tourists to either quickly select or reject
the destination. Familiarity may cause tourists to not even seek information on other
destinations for their next destination choice (Mayo & Jarvis, 1981; Um & Crompton,
1990; Woodside & Lysonski, 1989).
54
Definition of Terms
Attitude: An attitude is an index of the degree to which a person likes or dislikes an
object, where "object" is used in the generic sense to refer to any aspect of the
individual's world (Ajzen & Fishbein, 1980).
Behavioral Intention: Behavioral intention is an individual’s decision or commitment to
perform a given behavior (Ajzen & Fishbein, 1980).
Crises: “Crises can be described as the possible but unexpected result of management
failures that are concerned with the future course of events set in motion by human action
or inaction precipitating the event” (Blake & Sinclair, 2003).
Destination Image: Destination image is the signal or symbol presented to the individual
by a site or region. It is the aggregate sum of beliefs about each destination attribute
(Mercer, 1981).
Disasters: “Disaster can be described as unpredictable catastrophic change that can
normally only be responded to after the event, either by deploying contingency plans
already in place or through reactive response” (Blake & Sinclair, 2003).
International Tourist: International Tourist is a people who visited Phuket, Thailand
for both leisure and business purpose. Local residents are excluded from this definition
Perceived behavioral control (PBC): PBC is the individual's control beliefs weighted
by the perceived facilitation of the control factor in either inhibiting or facilitating the
behavior (Taylor & Todd, 1995).
Salient Beliefs: Salient beliefs are a small number of beliefs- perhaps five to nine- that a
person can attend to at any given moment (Ajzen & Fishbein, 1980).

55
Subjective norm: Subjective norm is defined as a person's perception that most people
who are important to him think he should or should not perform the behavior in question
(Chang, 1998).
Theory: A set of interrelated constructs and propositions that presents a systematic view
of phenomena (Kerlinger, 1979).
Theory of Reasoned Action (TRA): The theory of reasoned action (TRA) is an
expectancy value model to predict and understand an individual’s behavior. The theory
assumes that human beings are rational and motivation-based and thus a person's
behavior is determined by his/her intention to perform the behavior and that this intention
is, in turn, a function of his/her attitude toward the behavior and his/her subjective norm
(Ajzen & Fishbein, 1980).
Theory of Planned Behavior (TPB): The theory of planned behavior (TPB) is an
extension of the TRA. The only difference between the TRA and the TPB is that the TPB
takes account for non-volitional control, named “actual control,” over the behavior
(Ajzen, 1985).
56
CHAPTER III
METHODOLOGY
Research Design
Both descriptive and causal research design were used to investigate tourists’
perceptions of destination attributes and to empirically test the applicability of the theory
of planned behavior (TPB) model. Causal research design was employed to examine the
causal relationship between predictor variables (attitude, subjective norm, perceived
behavioral control, and past experience) and tourist behavioral intention, and to test
hypotheses to confirm the causal relationship. The target population for the study was
international tourists who traveled to Phuket during the survey period.
Validity and Reliability
Validity
Validity is the extent to which a scale or set of measures accurately represents the
concept of interest (Hair et al., 1998). The two types of validity checks are content
validity and construct validity. To ensure the content validity of the questionnaire, both a
pre-test and a pilot test were conducted. For the pre-test, ten research faculty in the field
of hospitality, tourism, and marketing were asked to rate the appropriateness of the items
in each scale, the format of the scale, and the length of the instrument. Some items and
57
some scales were changed. After the pre-test, 50 international tourists were randomly
selected for the pilot test.
Construct validity is the extent to which a measure adequately assesses the
theoretical concept it purposes to assess. Researchers can establish construct validity by
correlating a measure of a construct with a number of other measures that should,
theoretically, be associated with it (convergent validity) (Nunnally & Berstein, 1994).
The scale used in this study was adapted from established existing measures that have
been used and validated in previous tourism research. Convergent validity exists when a
researcher’s proposed scale items are correlates with the same construct. The
standardized loadings and the squared multiple correlations (SMC) for the measurement
items and the constructs were investigated as a confirmation of convergent validity
(Bollen, 1989). Large factor loadings for a specified construct suggest evidence of
convergent validity, demonstrating that indicators for a given construct are strongly
correlated among themselves.
Reliability
Reliability is an assessment of the degree of consistency between multiple
measurements of variables (Hair et al., 1998). The initial research instrument, which was
developed based on a review of the literature, was refined through the pilot study. The
purposes of pilot study were to (1) assess the reliability of multiple measurements and (2)
check the content validity of the questionnaire wording.
A total 50 international tourists participated in the pilot test, which yielded a
response rate of 100%. Of the 50 respondents, 78% were male and 22% were female.
About 76% of the respondents were in the age range of 21 to 50 years old.

58
Approximately 22% of the respondents reported an annual household income from
$50,000 to $74,999, while 30% of them earned $100,000 or above each year. The results
showed that 36% of respondents had earned a college degree, followed by those who
reported high school/vocational school (34%).
The majority of respondents (76%) reported that the major purpose of their visit
was vacation and pleasure. About 76% of respondents also reported that they had stayed
at Phuket more than a week, while around 14% of them had stayed 3 to 5 days. Only 2%
stayed less than a day at Phuket.
Cronbach’s coefficient alpha (α) was used as a measure of internal consistency of
measurements. The past behavior construct was not included in the reliability analysis
because this construct had only one quantifiable measure (i.e., the frequency of visiting
Phuket).
The details of the reliability of measurements are shown in Table 13. The
reliability scores, ranging from 0.72 for perceived behavior control to 0.91 for attitude,
indicated that the scales used in this study were relevant to measure the constructs of
interest. Kline (1994) suggested that Cronbach’s coefficient alpha is commonly used as a
recommended benchmark.
Table 13: Reliability of Measurements in the Pilot Test
Construct Number of variables Cronbach’s alpha (α)
Attitude 5 0.91
Subjective norm 4 0.86
Perceived behavior control 4 0.72
Behavior intention 4 0.81
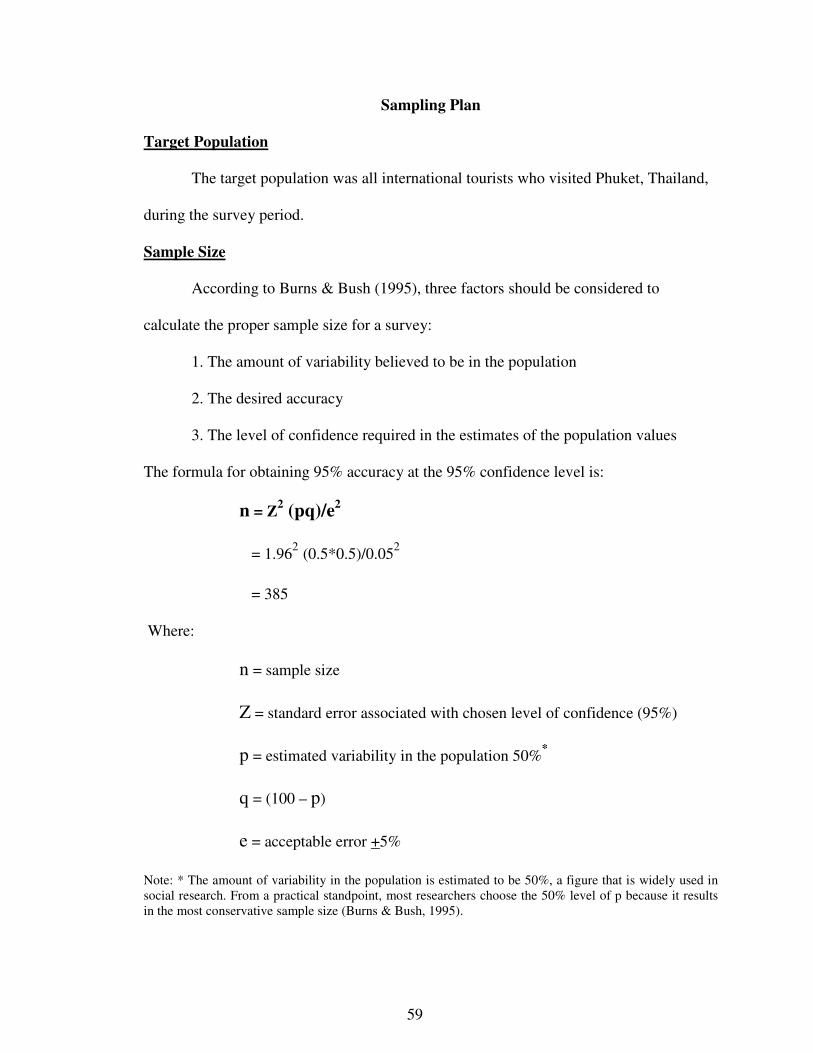
59
Sampling Plan
Target Population
The target population was all international tourists who visited Phuket, Thailand,
during the survey period.
Sample Size
According to Burns & Bush (1995), three factors should be considered to
calculate the proper sample size for a survey:
1. The amount of variability believed to be in the population
2. The desired accuracy
3. The level of confidence required in the estimates of the population values
The formula for obtaining 95% accuracy at the 95% confidence level is:
n = Z2 (pq)/e2
= 1.962 (0.5*0.5)/0.052
= 385
Where:
n = sample size
Z = standard error associated with chosen level of confidence (95%)
p = estimated variability in the population 50%*
q = (100 – p)
e = acceptable error +5%
Note: * The amount of variability in the population is estimated to be 50%, a figure that is widely used insocial research. From a practical standpoint, most researchers choose the 50% level of p because it resultsin the most conservative sample size (Burns & Bush, 1995).

60
Based on this formula, the sample size would be set at 385 with a confidence level
of 95% and 95% desired accuracy. However, Hair et al. (1998) stated that the sample size
suitable for most multivariate data analysis approaches should have a minimum ratio of at
least 5 respondents for each estimated variable.
It was estimated that there would be 114 variables (excluding variables for travel
and demographic characteristics) for measuring the constructs of perception of
destination before the Tsunami (31 variables), perception of destination after the Tsunami
(32 variables), motivation (33 variables), attitude (5 variables), subjective norm (4
variables), perceived behavioral control (4 variables), past behavior (1 variable), and
behavior intention (4 variables). Based on this number of variables, the sample size
suitable for the study was 570 (114*5), or approximately 600.
Sampling Approach
A two stage sampling approach including quota sampling and convenience
sampling will be used to select 600 departing international travelers. First, quota
sampling will be used to select departure flights which are posted on the web-site of the
Phuket International Airport. The quota will be used to limit the amount of respondents in
each region to the predetermined number in order to obtain a variety of respondents that
represent the total population. Second, a convenience sampling will be used to select
individuals within the selected flights.
According to Immigration Bureau and Police Department statistic from year
1999 to 2003, the top three inbound tourist markets to Phuket were Asia, Europe, and
Oceania. In 2003, international tourists were primarily from Asia (49.37%), Europe
(41.45%), Oceania (4.24%), and the Americas (3.55%) (Immigration Bureau and Police

61
Department, 2004). Base on statistic data in year 2003, the quota of the sample from the
selected inbound tourist markets were Asia (50%), Europe (40%), and other (10%). The
survey was conducted during weekdays and weekends from 6.00 am. to 01.00 am. The
time spread will be designed in order to meet different groups of respondents.
The instrument, an exit survey, was given to these travelers as they waited for
departure flights at Phuket International Airport. The survey was conducted in the
restricted transit areas of the airport, the only location permitted by the airport authority
to capture international tourists for the study of their behavioral intention of visiting
Phuket. Once respondents agreed to participate, the purpose of the survey was explained
and the self-administered questionnaire was distributed for completion. Questionnaires
were collected on-site.
Instrument Development and Data Collection
A questionnaire was the instrument used for data collection. Survey items for the
proposed study were developed based on the previous empirical research and modified to
better fit the tourism industry in Phuket. The scale items used to measure tourists’
perception and motivations were derived from the previous literature review. In addition,
items derived from industry magazines issued by the Tourism Authority of Thailand were
used to formulate the unique image and motivation attributes of tourist to Phuket.
Questionnaire Development
Based on the results of the pilot study, changes were made to the questionnaire’s
wording and design. However, all initial measurement items were kept for the actual
survey.
62
The questionnaire was divided into five main sections. The first section consisted
of items measuring tourist perception and motivation. The list of attributes of tourist
destination selection and travel motivation are summarized in Table 9 and Table 12,
respectively. Respondents were asked to rate their perceptions on a 7-point Likert scale
ranging from 1 (very unimportant) to 7 (very important).
The second section of the questionnaire was designed to collect information on
the likelihood of choosing Phuket as a travel destination (behavioral intention), likely
outcomes of choosing Phuket as a travel destination (attitude), groups or individuals
whose views might influence respondent selection of Phuket as a travel destination
(subjective norm), and factors that might facilitate or inhabit travel to Phuket (perceived
behavioral control). Items on attitude, subjective norm, perceived behavioral control, and
behavior intention were based on the measurement scales of the theory of planned
behavior (Ajen, 1988, 1991). Attitude was measured by statements using a semantic
differential scale. The five questions used a seven-level semantic differential scale
ranging from 1 (unenjoyable) to 7 (enjoyable), 1 (boring) to 7 (fun), 1 (unpleasant) to 7
(pleasant), 1 (harmful) to 7 (beneficial), and 1 (unfavorable) to 7 (favorable),
respectively. Subjective norm was measured by four statements, each with a seven-point
Likert scale ranging from 1 (strongly disagree) to 7 (strongly agree). Four statements
were used to measure perceived behavioral control, each with a seven-point Likert scale
ranging from 1 (strongly disagree) to 7 (strongly agree). Behavior intention was also
measured by four statements, each with a seven-point Likert scale from 1 (most unlikely)
to 7 (most likely).
63
The third section of the questionnaire collected information about international
tourists’ demographic characteristics.
The fourth section of the questionnaire collected information about tourists’ trips
to Phuket. This section included questions about the number of times each tourist had
visited Phuket (including the current trip), purpose of visit, length of stay, mode of
transportation, etc.
The fifth section consisted of questions about accommodation and activities.
Questions included asking about hotels, attractions, and activities.
Survey Procedure
To collect the data, a questionnaire accompanied by a cover letter was distributed
to international tourists at Phuket International Airport. According to Manfredo, Driver,
and Tarrant (1996), a survey should be administered immediately after the trip or the
activity in order to determine what the individual’s past experience has been. Because the
study was being used to determine tourist perception of destination attributes, it was
appropriate to conduct the survey after the tourist experience. Phuket International
Airport was chosen because tourists had already consumed tourism products or used
services in Phuket. At the airport, while waiting for flights, tourists may have had time to
complete the questionnaire. The data collection period included both weekdays and
weekends during the airport’s operating hours at the time of the study period.
Thai souvenirs including crystal, candle, and Thai silk books were given as
incentives to stimulate survey participation. A field screening was conducted at the
airport to check for completeness of the questionnaires. When international travelers
64
returned the questionnaires, research teams thanked the tourists and let them choose one
of the three types of incentives.
Data Analysis
Data was analyzed using both univariate and multivariate techniques with the
Statistical Package for Social Sciences (SPSS) and LISREL. Data analysis was
undertaken in a series of steps. First, data screening was carried out to check the accuracy
of the data. The second step was to analyze descriptive statistics of different variables.
Third, the Paired Sample t-test was used to compare the means of image differences
before the Tsunami and after the Tsunami. Fourth, factor analysis and reliability were
conducted using principal component analysis with varimax rotation to examine the
underlying dimensions of perception and motivation. Factor analysis is a useful technique
to reduce a large number of variables to a smaller set of factor groupings. Next, the
independent sample mean t test was used to determine the mean difference in travel
motivation between first-time and repeat travelers. Finally, structural equation model
(SEM) was adopted because this technique enables simultaneous estimation of multiple
regression equations in a single framework. All direct and indirect relationships in the
model are estimated simultaneously; therefore, this method allows all the
interrelationships among the variables to be assessed in the same decision context.
Data Screening
According to Tabachnick & Fidell (1996), when data has been coded and
collected, it should be checked for errors to maintain its accuracy and the honest analysis
of it prior to commencing the data analyzes. Steven (1996) noted there are many possible

65
sources of data errors within research from the initial data collection to the final coding
and entry; therefore, it is important that such errors be at a minimum. To ensure the
accuracy of the data, all questionnaires were thoroughly examined. Results from the
questionnaires were then cross-examined with the SPSS data file to ensure that data entry
had been completed without any errors.
Descriptive Statistics
Descriptive statistics such as means, standard deviations, and percentages were
examined to determine information about tourists’ trips to Phuket and generate
demographic profiles of the survey respondents.
Paired Sample t-test
The paired sample t-test was used to compare the mean of two variables for a
single group. This test computes the differences between values of the two variables for
each case and tests the average difference from 0 (SPSS, 1999). In this study, the paired
sample t-test was used to determine the image differences before the Tsunami and after
the Tsunami.
Independent Sample Mean t-test
The independent sample mean t-test represents whether the mean of a single
variable for subjects in one group differs from the mean of that variable in another group
(SPSS, 1999). The independent sample mean t-test was used to determine the mean
difference in travel motivation between first-time and repeat travelers in this study.
Factor Analysis
Factor analysis is a multivariate statistical technique whose primary purpose is to
define the underlying structure in a data matrix. It is also used to reduce the number of
66
variables into a smaller set of dimensions (factors), while maximizing the amount of
information found within each factor.
The advantage of a multivariate technique, over a univariate or a bivariate
technique is the ability to accommodate multiple variables in an attempt to understand the
complex relationships among variables. However, when the number of variables
increases, it is possible that the variables are not all uncorrelated and representative of
distinct concepts. Therefore, groups of variables may be interrelated to the extent that
they are all representative of a more general concept. In this case, factor analysis should
be conducted.
The two general types of factor analysis are exploratory factor analysis (EFA) and
confirmatory factor analysis (CFA), and each is used for quite different purposes.
Exploratory Factor Analysis (EFA)
EFA is normally used in the early stage of research to describe and summarize
data by grouping variables that are correlated with one another, but largely independent
of other subsets of variables, into a specific factor (Tabachnick & Fidell, 1996).
According to Pallant (2001), factor analysis consists of three steps: (1) assessment of the
suitability of the data for factor analysis, (2) factor extraction, and (3) factor rotation and
interpretation.
(1) Assessment of the Suitability of the Data for Factor Analysis
The first step of factor analysis is to assess the suitability and appropriateness of
data (Tabachnick & Fidell, 1996; Pallant, 2001). The techniques available to determine
the suitability of data for factor analysis include correlation matrix, Bartlett’s test of
sphericity, & the Kaiser-Meyer-Olkin measure of sampling adequacy (Nunnally &

67
Berstein, 1994; Pallant, 2001). A correlation matrix refers to a set of correlation
coefficients between numbers of variables. Tabachnick & Fidell (1996) state that there
should be a correlation coefficient of 0.30 or above in the correlation matrix. The Bartlett
test of sphericity recommends that the test of sphericity should be significant (p<0.05) for
the factor analysis to be considered appropriate (Pallant, 2001). The Kaiser-Meyer-Olkin
measure of sampling adequacy index is another, more sophisticated, test for factorability
(Tabachnick & Fidell, 1996). This index helps measures which variables belong together
and are appropriate for factorability. The index can range from 0 to 1, but a minimum
value of 0.6 should be obtained for the data to be considered appropriate for factor
analysis (Pallant, 2001).
These three techniques were used to assess the suitability of data for factorability,
and the following criteria had to be met for the data to be considered appropriate for
factor analysis: (1) correlation coefficient of 0.30 or above in the correlation matrix, (2)
value of Bartlett’s test of sphericity at the significance level of (p<0.05), and (3) Kaiser-
Meyer-Olkin measure of sampling adequacy index of 0.6 or greater.
(2) Factor Extraction
Factor extraction refers to “determining the smallest number of factors that can be
used to best represents the inter-relations among the set of variables” (Pallant, 2001).
Principal component analysis can be employed to extract the factors. According to
Pallant, the principal component analysis technique is one of the more commonly used
techniques that are “psychometrically sound, more mathematically simple and it avoids
some of the potential problems with ‘factor indeterminacy’ associated with factor
analysis” (2001).

68
Pallant (2001) also mentioned that there are two techniques that can be used to
assist in the decision as to how many factors should be retained, Kaiser’s criterion and
scree test. With regard to Kaiser’s criterion, only factors with an eigenvalue of 1.0 or
above should be retained. However, this technique often leads to retaining many factors;
therefore, it is recommended that the technique be used in combination with a Catell’s
scree test (Pallant, 2001). The scree test involves plotting the eigenvalues of every factor
and inspecting the plot to find a point at which a curve line changes its direction and
becomes horizontal. All factors above the point at which the curve line changes direction
should be retained as these factors normally contribute to most of the explanation of the
variance in the data (Pallant, 2001).
In this study, factor analysis using principal component analysis was carried out
to determine the number of underlying factors of tourist perception of destination
attributes and motivation. All factors to be retained had to have an eigenvalue greater
than one.
(3) Factor Rotation and Interpretation
The Varimax rotation procedure is the technique used for factor rotation (Pallant,
2001; Tabachnick & Fidell, 1996). This technique is used to minimize the number of
variables that have high loadings on each factor. Hair, Anderson, Tatham, & Black
(1998) recommended that factor loadings greater than 0.30 are the minimum level,
loadings of 0.40 are considered more important, and loadings of 0.50 or greater are
considered practically significant. Ticehurst & Veal (1999) suggested it is important to
assess the internal reliability of all factors to be retained. Kline (1994) stated that

69
Cronbach’s coefficient alpha is commonly used to measure the internal reliability of
factors, and the alpha of .60 is commonly used as a minimum threshold recommended.
Therefore, this research used the Varimax rotation procedure and only variables
with factor loadings greater than 0.4 and a contamination of less than 0.3 were retained in
each factor grouping. To measure the internal reliability of factors, Cronbach’s
coefficient alpha was employed.
Confirmatory Factor Analysis (CFA)
CFA is used to investigate the model’s goodness of fit, the magnitude of
individual relationships, and the hypothesized paths. To examine the overall fit of the
structured model, χ2 statistics are used. A significant χ2 statistic shows an inadequate fit,
but this statistic is sensitive to sample size and model complexity. Other measures of fit
compensating for sample size are goodness of fit index (GFI), adjusted goodness of fit
index (AGFI), normed fit index (NFI), comparative fit index (CFI), and root mean square
error of approximation (RMSEA). The recommended acceptance of a good fit to a model
requires that the GFI, AGFI, NFI, and CFI values should be greater than or equal to 0.90.
An acceptable value of RMSEA ranges from 0.05 to 0.08 (Hair et al., 1998).
After the overall model fit has been evaluated, the measurement of each construct
can then be assessed for unidimensionality and reliability. The fit of the measurement
model is assessed by significant indicator loadings, composite reliability (CR), and
average variance extracted (AVE). The convergent validity of the measures with values
between zero and one is represented by both CR and AVE; the closer the value is to one,
the better the variable acts as an indicator of the latent construct. The validity of the
construct is questionable when the AVE of a construct is less than 0.5 because it indicates

70
that the variance, due to measurement error, is larger than the variance captured by the
construct. Discriminant validity is conducted by comparing the AVE values with the
square of the correlations between each pair of constructs. AVE values should exceed the
squared correlations values (Fornell & Larcker, 1981).
In this research, factor analysis used both EFA and CFA. The EFA technique was
employed for the purpose of reducing tourist perception of destination attributes into a
more manageable set of factors to be used for subsequent analysis. This same technique
was employed to reduce the motivation items in the tourist participation decision-making
process into a more manageable set of factors to be used for subsequent analysis. CFA
was used to investigate the model’s goodness of fit for the proposed factor solution. CFA
is particularly useful in the validation of scales for measurements of specific constructs.
Structural Equation Modeling
Structural equation modeling (SEM) encompasses an entire family of models
known by many names, among them covariance structure analysis, latent variable
analysis, confirmatory factor analysis, and often LISREL analysis (the name of one of the
more popular software packages) (Hair et al., 1998).
SEM was adopted because it can simultaneously estimate multiple regression
equations in a single framework. Moreover, the direct and indirect relationships in the
model can be estimated simultaneously, and this method also allows the entire
interrelationship among the variables to be assessed in the same decision context. This
method can “estimate many equations at ones, and they can be interrelated, which means
that the dependent variable in one equation can be an independent variable in other
equation(s)” (Hair et al., 1998, p. 586). In simple terms, SEM estimates a series of

71
separate, but interdependent, multiple regression equations simultaneously by specifying
the structural model used by the statistical program. Therefore, some dependent variables
become independent variables in subsequent relationships, giving rise to the
interdependent nature of the structural model. In addition, many of the same variables
affect each of the dependent variables, but with differing effects. The structural model
expresses these relationships among independent and dependent variables, even when a
dependent variable becomes an independent variable in another relationship (Hair et al.,
1998).
Stages in Structural Equation Modeling
The advantage of SEM comes from the benefits of using the structural and
measurement models simultaneously, each playing distinct roles in the overall analysis.
To ensure both models (as shown in Figure 2) are correctly specified and the results are
valid, the seven-stage model-building process developed by Hair et al. (1998, p. 592 and
602) was used. The seven stages are listed below:
1) Develop a theoretically based model
2) Construct a path diagram of causal relationships
3) Convert the path diagram into a set of structural equations and a measurement model
4) Choose the input matrix type and estimate the proposed model
5) Assess the identification of the structural model
6) Evaluate goodness-of-fit criteria
7) Interpret and modify the model (if theoretically justified)
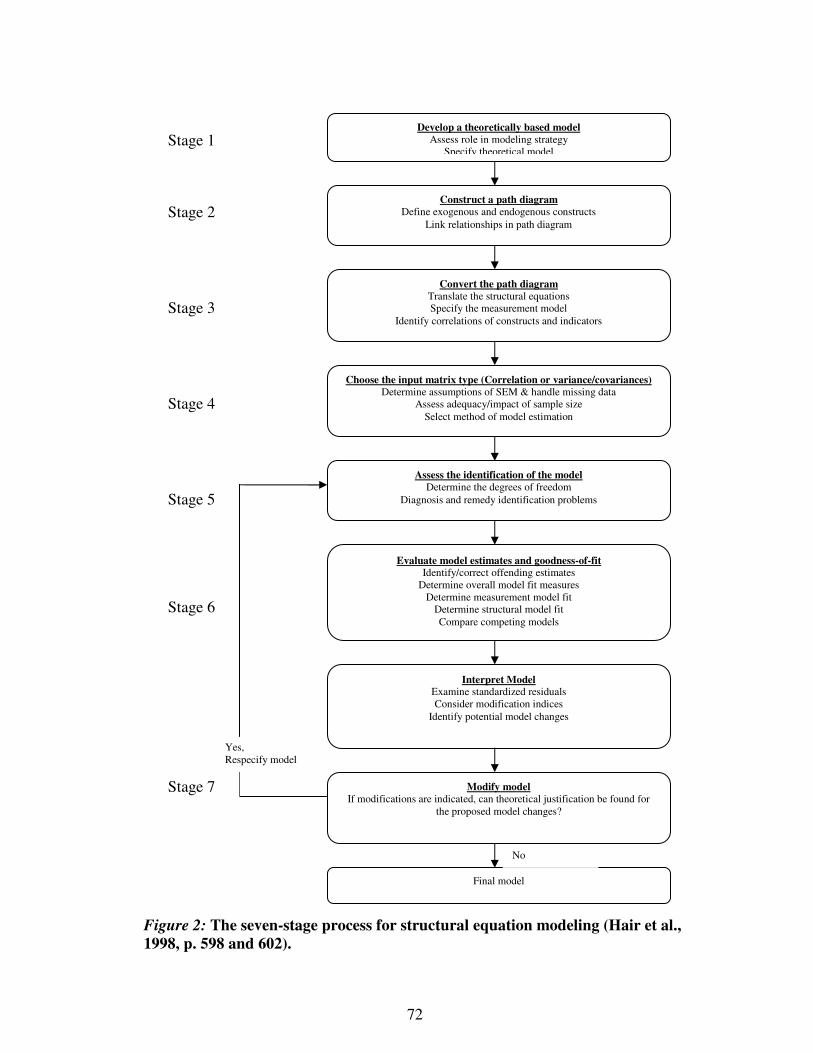
72
Figure 2: The seven-stage process for structural equation modeling (Hair et al.,1998, p. 598 and 602).
Develop a theoretically based modelAssess role in modeling strategy
Specify theoretical model
Construct a path diagramDefine exogenous and endogenous constructs
Link relationships in path diagram
Convert the path diagramTranslate the structural equationsSpecify the measurement model
Identify correlations of constructs and indicators
Choose the input matrix type (Correlation or variance/covariances)Determine assumptions of SEM & handle missing data
Assess adequacy/impact of sample sizeSelect method of model estimation
Assess the identification of the modelDetermine the degrees of freedom
Diagnosis and remedy identification problems
Evaluate model estimates and goodness-of-fitIdentify/correct offending estimates
Determine overall model fit measuresDetermine measurement model fit
Determine structural model fitCompare competing models
Interpret ModelExamine standardized residualsConsider modification indices
Identify potential model changes
Final model
No
Yes,Respecify model
Stage 1
Stage 2
Stage 3
Stage 4
Stage 5
Stage 6
Stage 7 Modify modelIf modifications are indicated, can theoretical justification be found for
the proposed model changes?

73
Stage 1: Develop a theoretically based model
SEM is based on causal relationships in which the change in one variable is
assumed to result in a change in another variable (Hair et al., 1998). The latent constructs
and their observed variables included in the model were identified based on theories and
the “requirement” for asserting causation. According to Hair et al. (1998), there is general
agreement with at least four established criteria for making causal assertions: 1) sufficient
association between the two variables, 2) temporal antecedence of the cause versus the
effect, 3) lack of alternative causal variables, and 4) a theoretical basis for the
relationship. Although in many instances all of the established criteria for making causal
assertions are not strictly met, causal assertions can possibly be made if the relationships
are based on a theoretical rationale (Hair et al., 1998).
Stage 2: Construct a path diagram of causal relationships
A path diagram is useful in depicting a series of causal relationships. It is more
than just a visual portrayal of the relationship because it allows the researcher to present
not only the predictive relationships among constructs (i.e., the dependent-independent
variable relationships), but also associative relationships (correlations) among constructs
and even indicators. Therefore, a path diagram is developed at this stage.
Before examining a path diagram, two basic elements must be defined. The first is
the concept of a construct, a theoretically based concept that acts as a “building block”
used to define a relationship. The path diagram is defined in term of constructs and then
finds variables to measure each construct. The second element is the arrow, used to
present specific relationships between constructs. A straight arrow presents a direct
causal relationship from one construct to another. A curved arrow (or a line without
74
arrowheads) between constructs indicates simply a correlation between constructs. A
straight arrow with two heads presents a recursive, or reciprocal, relationship between
constructs (Hair et al., 1998).
The two types of constructs in the path diagram are “exogenous construct” and
“endogenous construct.” An exogenous constructs acts as a predictor or “cause” for other
constructs or variables in the model. In a path diagram, the exogenous constructs have
only causal arrows leading out of them and are not predicted by any other constructs in
the model (Hair et al., 1998). They are indicated by ξ1… ξ4 in Figure 3. An endogenous
construct is the dependent or outcome variable in at least one causal relationship. In a
path diagram, there are one or more arrows leading into the endogenous construct or
variable. They are indicated by η1 in Figure 3.
Hair et al. (1998) stated that two assumptions underlie path diagrams. First, all
causal relationships are indicated and justified by theories. Second, casual relationships
are assumed to be linear. Table 14 indicates the exogenous and endogenous constructs
defined in the path diagram.
Table 14: Endogenous and Exogenous Constructs Defined in the Path Diagram
Endogenous construct Exogenous constructs
η1 Tourist Behavioral Intention ξ1 Attitude
ξ2 Subjective Norm
ξ3 Perceived Behavioral Control
ξ4 Past Behavior
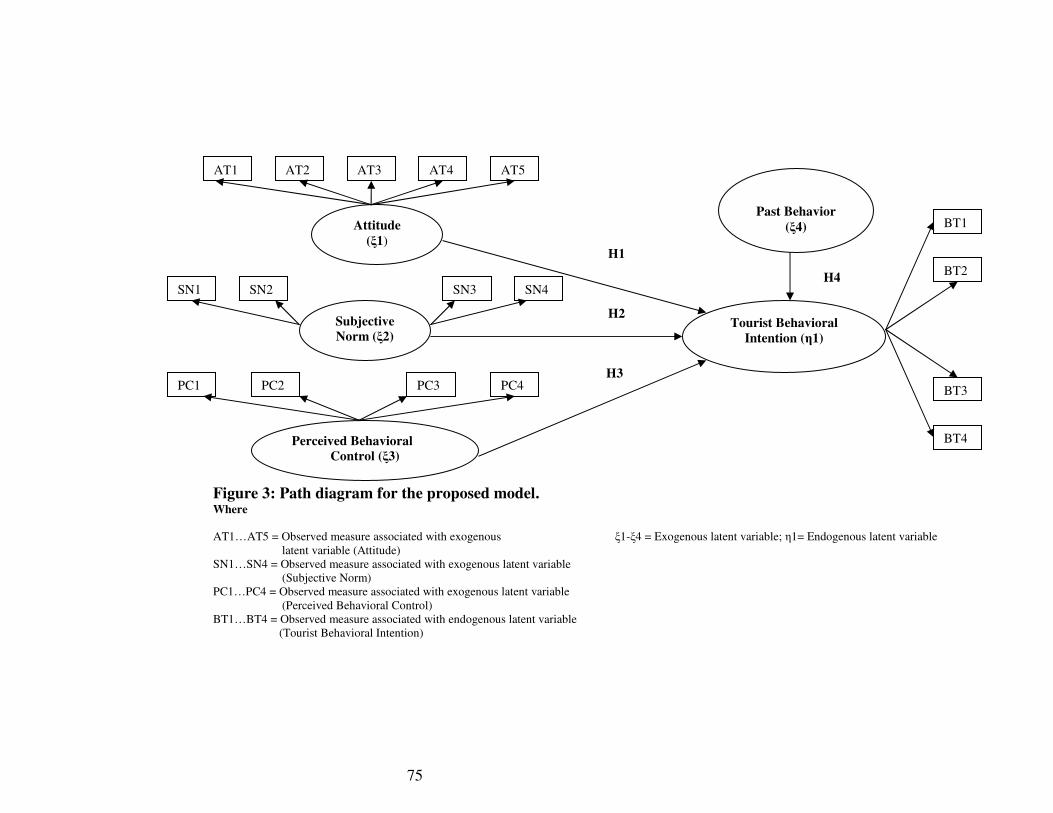
75
Figure 3: Path diagram for the proposed model.Where
AT1…AT5 = Observed measure associated with exogenous ξ1-ξ4 = Exogenous latent variable; η1= Endogenous latent variablelatent variable (Attitude)
SN1…SN4 = Observed measure associated with exogenous latent variable(Subjective Norm)
PC1…PC4 = Observed measure associated with exogenous latent variable(Perceived Behavioral Control)
BT1…BT4 = Observed measure associated with endogenous latent variable(Tourist Behavioral Intention)
Attitude(ξ1)
SubjectiveNorm (ξ2)
Perceived BehavioralControl (ξ3)
AT1 AT2 AT3 AT4 AT5
SN2 SN3 SN4
PC1 PC2 PC3 PC4
Tourist BehavioralIntention (η1)
BT1
SN1
BT2
BT3
BT4
Past Behavior(ξ4)
H1
H2
H3
H4

76
As mentioned previously, this study included the following hypotheses:
• Hypothesis 1: A positive attitude (AT) toward destination positively affects
tourist behavior intention (BI).
• Hypothesis 2: A subjective norm (SN) about a popular destination positively
affects tourist behavior intention (BI).
• Hypothesis 2-1: The positive influence of subjective norm on tourist behavior
intention will be greater among tourists from an Asian country than from a
Western country.
• Hypothesis 3: Perceived behavioral control (PBC) positively affects tourist
behavior intention (BI).
• Hypothesis 4: Past behavior positively affects tourist behavior intention.
Table 15 summarizes the variables used in the structural modeling approach in
this study.

77
Table 15: Summary of Scale Items Used in this Study
Construct Indicatorname
Scale Items
BehaviorIntention
BI1BI2BI3BI4
I intend to select Phuket as my travel destination in the future.I would be willing to pay a higher rate to visit Phuket.I will recommend Phuket to others.I will revisit Phuket.
Attitude AT1AT2AT3AT4AT5
Unenjoyable/EnjoyableBoring/FunUnpleasant/PleasantHarmful/BeneficialUnfavorable/Favorable
SubjectiveNorm
SN1SN2
SN3SN4
Most people I know choose Phuket as a travel destination.Members of my family think that it is a good idea to choose Phuketas a travel destination.Members of my family approve of my visiting Phuket.Most of my friends and acquaintances think that choosing Phuket asa travel destination is a good idea.
PerceivedBehavioralControl
PC1
PC2
PC3
PC4
If I want, I could easily visit Phuket from now on(after crisis recovery).It is mostly up to me whether or not I select Phuket as my traveldestination (after crisis recovery).Visiting Phuket is wholly under my control even in case of crisis(Tsunami, bird flu, SAR-Severe Acute Respiratory Syndrome, andterrorist in Southern Thailand).Recovery campaign (reduced fares and special packages) factored inselecting Phuket as my travel destination.
Past Behavior PB How many times have you visited Phuket, including this trip?
Stage 3: Convert the path diagram into a set of structural equations and ameasurement model
After developing the theoretical model and designing the path diagram, the
model needs to be specified in more formal terms through a series of equations that
define (1) the structural equations linking constructs, (2) the measurement model
specifying which variables measure which constructs, and (3) a set of matrices
indicating any hypothesized correlations among the constructs or variables. The
purpose is to link operational definitions of the constructs to theory for the appropriate
empirical test (Hair et al., 1998).
78
Structural model: The path diagram is translated into a series of structural
equations. Each endogenous construct (any construct with one or more straight arrows
leading to it) is the dependent variable in a separate equation. The predictor variables
are all constructs at the ends or “tails” of the straight arrows leading into endogenous
variables. Therefore, each endogenous construct ηj can be predicted either by an
exogenous construct(s) ξj or by other endogenous construct(s) (Hair et al., 1998).
Measurement model: In order to specify the measurement model, the issues
regarding the number of indicators per construct and the process of specifying the
reliability of each construct needs to be defined. This process is quite analogous to
factor analysis. To specify the measurement model, the researcher makes the
transition from factor analysis, in which the researcher had no control over which
variables describe each factor, to a confirmatory mode, in which the researcher
specifies which variables define each construct (factor). The indicator variables in the
measurement model are called manifest variables because they are used to “indicate”
the latent constructs. According to Hair et al. (1998), the minimum number of
indicators for a construct is one, but the use of only one indicator requires the
researcher to provide estimates of reliability. Two indicators can be presented, but
three is the preferred minimum number of indicators because using only two
indicators increases the chances of reaching an infeasible solution. However, in
practice, five to seven indicators should be able to represent most constructs (Hair et
al., 1998).
79
After the measurement model has been specified, the reliability of the
indicators has to be determined. The two principal methods to establish reliability are
empirical estimation and specification by researcher. The exact steps required for this
approach will be illustrated further in Stage 6 of this process.
In addition to the structural and measurement models, the researcher needs to
specify any correlations between the exogenous constructs or between the endogenous
constructs. Mostly, exogenous constructs are correlated, representing a “shared”
influence on the endogenous variables.
Stage 4: Choose the input matrix type and estimate the proposed model
Input used in a program is a correlation or variance-covariance matrix of all
indicators used in the model. The measurement model specifies which indicators
correspond to each construct, and the latent construct scores are then employed in the
structural model. SEM shares three assumptions with the other multivariate methods:
independent observation, random sampling of responds, and linearity of all
relationships. However, SEM is more sensitive to the distributional characteristics of
the data, particularly the departure from multivariate normality (critical in the use of
LISREL) or a strong kurtosis (skew ness).
An important issue in interpreting the results is the use of the variance-
covariance matrix and the correlation matrix. The covariance matrix can provide valid
comparisons between different populations or samples, a feature not possible when
models are estimated with a correlation matrix. A correlation matrix can be used when
the researcher is concerned only with the pattern of relationships, not with total
explanation as is needed in theory testing. Hair et al. (1998) recommended that
researchers employ the variance-covariance matrix any time a true “test of theory” is
being performed as the variances and covariance satisfy the assumption of the

80
methodology and are the appropriate form of the data for validating causal
relationships.
Sample size also plays an important role in the estimation and interpretation of
SEM results. According to Hair et al. (1998), sample size provides a basis for the
estimation of sampling error. Four factors impact the sample size requirement: 1)
model misspecification, 2) model size, 3) departures from normality, and 4)
estimation procedure. The model that suffers from specification error is called model
misspecification. Specification error is the omission of relevant variables from the
specified model. Hair et al. (1998) suggested that the absolute minimum sample size
must be at least greater than the number of covariances or correlations in the input
data matrix. However, the most appropriate size is a minimum ratio of at least five
respondents for each estimated parameter, with a preferred ratio of ten respondents
per parameter. Although there is no correct sample size, Hair et al. (1998)
recommended that the sample size should range from 100 to 200. If misspecification
is suspected, the model is overly large or complex, the data exhibit abnormal
characteristics, or an alternative estimation procedure is used, and the sample size
should be increased to more than 200 responses (Hair et al., 1998).
Stage 5: Assess the identification of the structural model
Degree of Freedom: According to Hair et al. (1998), an identification problem
is the inability of the proposed model to generate unique estimates. For the purpose of
identification, the researcher needs to consider the size of the covariance or
correlation matrix relative to the number of estimated coefficients. The degree of
freedom is the difference between the number of correlations or covariances and the
actual number of coefficients. The number of degrees of freedom for a proposed
model is

81
df = ½ [(p+q)(p+q+1)]-t
Where:
p=the number of endogenous indicators
q=the number of exogenous indicators
t=the number of estimated coefficients
Rules for Identification: In SEM, the sample size does not affect the degree of
freedom, but it is used to estimate sampling error. Two basic rules that will establish
the identification of a model are order and rank conditions.
The order condition states that the model’s degree of freedom must be greater
than or equal to zero, which corresponds to what are called just-identified or over-
identified models. A just-identified model has exactly zero degrees of freedom.
Although zero degrees of freedom will provide a perfect fit of the model, the solution
is uninteresting because it has no generalizability. An over-identified model has more
information in the data matrix than the number of parameters to be estimated. It
means that there are a positive number of degrees of freedom. An over-identified
model is the goal for all structural equation models. An under-identified model is one
that fails to meet the order condition. It has negative degrees of freedom and it tries to
estimate more parameters than there is information available. The model cannot be
estimated until some parameters are fixed or constrained (Hair et al., 1998). The order
condition is necessary, but the model also has to meet the rank condition, in which
each parameter is uniquely identified (estimated).
Diagnosing Identification Problems: Perform tests can be used when the
equation is identified to see whether the results are unstable because of the level of
identification. With the first perform test the model can be reestimated several times,
each time with a different starting value. The identification should be examined more

82
thoroughly if the results do not converge at the same point for different starting
values. The second test, to assess the identification’s effect on a single coefficient,
estimates the model and obtains the coefficient estimate then “fixes” the coefficient to
its estimated value and reestimates the equation. Identification problems are indicated
if the overall fit of the model varies markedly.
Other possible symptoms of an identification problem include 1) very large
standard errors for one or more coefficients, 2) the inability of the program to invert
the information matrix, 3) unreasonable or impossible estimates such as negative error
variances, or 4) high correlations (+.90 or greater) among the estimated coefficients
(Hair et al., 1998).
Three common sources of identification problem exist: 1) a large number of
estimated coefficients relative to the number of covariances or correlations, indicated
by a small number of degrees of freedom, 2) the use of reciprocal effects (two-way
causal arrows between two constructs, and 3) the failure to fix the scale of a construct.
The solutions for an identification problem are to eliminate some of the
estimated coefficients (deleting paths from the path diagram) until the problem is
solved, to fix the measurement error variance of constructs if possible, to fix any
structural coefficients that are reliably known, to remove multicollinearity by using
data reduction methods like principal components analysis, to eliminate highly
correlated or redundant variables, and to check for missing values and outliers (Hair et
al., 1998).

83
Stage 6: Evaluate goodness-of-fit criteria
The first step in evaluating the results is an initial inspection for “offending
estimates.” After the model is established and provides acceptable estimates, the
goodness of fit must be assessed at several levels, first for the overall model and then
for the measurement and structural models separately.
Offending Estimates: Offending estimates are estimated coefficients in either
the structural or measurement model that exceeds acceptable limits. The most
common examples of offending estimates are negative error variances or no
significant error variances for any construct, standardized coefficients exceeding or
very close to 1.0, or very large standard errors associated with any estimated
coefficient. If offending estimates are identified, each occurrence should be resolved
before evaluating any specific results of the models, as changes in one portion of the
model can have significant effects on other results.
In the case of negative error variances (also known as Heywood cases), the
offending error variances can be fixed by changing to a very small positive value
(0.005). If correlations in the standardized solution exceeding one or two estimates are
highly correlated, the researcher should consider elimination of one of the constructs
or should ensure that true discriminant validity has been established among the
constructs (Hair et al., 1998).
Overall Model Fit: If there are no offending estimates, the next step is to
assess the overall model fit with one or more goodness-of-fit measures. According to
Hair et al. (1998), goodness-of-fit measures the correspondence of the actual or
observed input (covariance or correlation) matrix with that predicted from the
proposed model.

84
The three types of goodness-of-fit measures are absolute fit measures,
incremental fit measures, and parsimonious fit measures.
• Absolute fit measures assess only the overall model fit (both structural and
measurement models collectively), with no adjustment for the degree of “over
fitting” that might occur.
• Incremental fit measures compare the proposed model to another model
specified by the researcher.
• Parsimonious fit measures “adjust” the measures of fit to provide a
comparison between models with differing numbers of estimated coefficients.
Table 16 summarizes the statistical and non-statistical measures and their acceptable
ranges for different fit measures as suggested by Hair et al. (1998).

85
Table 16: Summary of Statistical Measures and Their Acceptable Ranges for
Different Fit Measures
Fit measures Statistical measures Acceptable rangeAbsolute fit measures Likelihood ratio chi-square to
the degree of freedomAcceptable level between 0.05to 0.10 or 0.20.A large value of chi-squareindicates poor fit of the model tothe data while a small valueindicates a good fit.
Goodness-of-fit index (GFI) Range from 0 (poor fit) to 1.0(perfect fit).Higher values indicate better fit.A marginal acceptance level is0.90.
Root mean square residual(RMSR)
The closer the value is to zero,the better the fit.Marginal acceptance level is0.08.Must be interpreted in relationto the sizes of the observedvariances and covariance.
Root-mean-square error ofapproximation (RMSEA)
Values between 0.05 and 0.08are acceptable.
Incremental fit measures Tucker-Lewis index (TLI) Should exceed the minimumlevel of 0.90.
Normed fit index (NFI) Should exceed the minimumlevel of 0.90.
Parsimonious fit measures Adjusted goodness-of-fit index(AGFI)
Value between 0 and 1.Recommended level is 0.90.
Normed chi-square (χ2/df) Recommended level is between1.0 and 2.0.
Source: Hair et al. (1998).
Measurement Model Fit: After the overall model fit has been accepted, the
measurement of each construct can be assessed for unidimensionality and reliability.
Unidimensionality is the process for calculation of reliability and is demonstrated
when the indicators of a construct have acceptable fit on a single-factor (one-
dimensional) model. This can be done by examining the indicator loadings for
statistical significance and assessing the construct’s reliability and variance extracted.
Reliability is a measure of the internal consistency of the construct indicators,
showing the degree to which they “indicate” the common latent (unobserved)
construct. More reliable measures give greater confidence that the individual
indicators are all consistent in their measurement. Variance extracted measure

86
represents the overall amount of variance in the indicators accounted for by the latent
construct. Higher variance extracted values are generated when the indicators are truly
representative of the latent construct. Both the construct reliability and the variance
extracted measures should exceed 0.50 (Hair et al., 1998).
Structural model fit: Structural equation modeling methods present not only
estimated coefficients, but also standard errors and calculated t values for each
coefficient. However, the most obvious examination of the structural model involves
the significance of estimated coefficients. The selection of a critical value also
depends on the theoretical justification for the proposed relationships. If a hypothesis
is a positive or negative relationship, a one-tailed test of significance can be employed.
However, if the direction of the relationship cannot be specified, a two-tailed
significance test must be used. An overall coefficient of determination (R²) is
calculated to measure the proportion of the variance of the dependent variable about
its mean that is explained by the independent, or predictor, variables. The higher the
value of R², the greater the explanatory power of equation, and therefore, the better
the prediction of the dependent variable (Hair et al., 1998).
Stage 7: Interpret and modify the model
After the model is deemed acceptable, the results for its correspondence to the
proposed theory should be examined as follows:
• Are the principal relationships in the theory supported and found to be
statistically significant?
• Are all of the relationships in the hypothesized direction (positive or
negative)?
Two issues of interpretation need to be considered: the use of standardized
versus unstandardized solutions and model respecification.
87
Standardized coefficients are useful for determining relative importance, but
are sample specific and are not comparable across samples. In contrast,
unstandardized coefficients are comparable across samples and retain their scale
effect because the scale varies for each construct. However, comparison between
coefficients is more difficult than with standardized coefficients.
Model respecification is the process of adding or deleting estimated
parameters from the original model. However, obtaining theoretical justification for
what is deemed empirically significant should be considered before undertaking the
process of model respecification (Hair et al., 1998). Figure 4 depicts the research
framework of this study.

88
SURVEY QUESTIONNAIRE
Perception ofdestination-after 26
Dec. ‘04i
Factoranalysis
Underlyingdimension of
perceptionafter theTsunami
Structural equation modeling
Perception ofdestination-before 26
Dec. ‘04i
Attitude(5 attributes)
Subjectivenorm
(4 attributes)
Behavioralintention
(4 attributes)
To test the theory of planned behavioral model
Figure 4: Research Framework
Perceivedbehavioral
control(4 attributes)Factor
analysis
Travel characteristicsDemographiccharacteristics
Underlyingdimension of
perceptionbefore theTsunami
Past Behavior(1 attribute)
Motivation(33 attributes)
Factoranalysis
Underlyingdimension ofmotivation
Paired sample t-test
First timetravelers
Repeattravelers
Independent SampleMean t-test

89
CHAPTER IV
RESULTS
This chapter presents the results of data analysis and hypothesis testing. First,
descriptive statistics are reported from respondent demographic profiles, respondent
travel profiles, sources of information, and activities. Second, descriptive statistics are
reported regarding perceived images of Phuket before and after the Tsunami. Third, a
paired-samples t test examines whether there is a significant in the perceived image of
Phuket before and after the Tsunami. Fourth, factor analysis and reliability tests
examine the underlying dimensions of the perceived image of Phuket before and after
the Tsunami and the underlying dimensions of travel motivation. Fifth, an
independent sample mean t-test examines whether there is a significant difference in
the travel motivations between first-time and repeat travelers. Sixth, structural
equation model (SEM) was adopted to answer research questions related to the
proposed model and the effects of the four determinants on tourist behavior
intentions. And seventh, the existence of a moderational effect of country of origin
was tested to see if the positive influence of subjective norm on tourist behavior
intention is greater among tourists from Asian countries than from Western countries.
90
Respondent Profiles
Respondent Demographic Profiles
Table 17 provides a demographic profile of international tourists who
participated in this survey. Among the 600 respondents, 387 respondents (64.5%)
were male and 213 respondents (35.5%) were female. The majority of the respondents
were between 22 and 35 years old (40.5%), while only 1.8% of the respondents were
over 65 years old. Approximately one-third (33.3%) of respondents were 36-50 years
old. Education levels were fairly high, with 69.8% having a college education (2-year,
4-year, or post-graduate education). About 17% of the respondents were in
management positions, followed by students (14.2%), self-employed (12.8%), and
professionals, such as doctor or lawyer, (10.7%).
Approximately 20% of the respondents earned under $25,000 annually, while
nearly 23% of them earned $25,000 to $49,999 per year. About one-fourth (25%) of
respondents had annual income in the range of $50,000 to $74,999, while 12.5%
earned $75,000 to $99,999. The remaining respondents (19.7%) earned $100,000 or
more. Respondents were primarily from Asia (41.8%), Europe (37.2%), Oceania
(11.2%), and the Americas (5%).

91
Table 17: Demographic Characteristics of Respondents (n = 600)
Variable Frequency Percentage
GenderMale 387 64.5Female 213 35.5Total 600 100.0
AgeUnder 21 years old 63 10.522-35 years old 243 40.536-50 years old 200 33.351-65 years old 83 13.8Over 65 years old 11 1.8Total 600 100.0
Education levelElementary School (Grade1-8) 31 5.2High school/vocational school 150 25.02-year college 71 11.84-year college 190 31.7Master’s degree 137 22.8Doctorate degree 21 3.5Total 600 100.0
OccupationManagement 102 17.0Administrative support 16 2.7Government/military 33 5.5Construction 32 5.3Production 22 3.7Professional related 64 10.7Sale 31 5.2Service 13 2.2Student 85 14.2Housewife 30 5.0Self-employed 73 12.8Retired/not in the workforce 22 3.7Other 77 12.2Total 600 100.0
Annual household incomeUnder $25,000 120 20.0$25,000-$49,999 136 22.7$50,000-$74,999 151 25.2$75,000-$99,999 75 12.5$100,000 and above 118 19.7Total 600 100.0
Country of residenceEurope 223 37.2Asia 251 41.8The Americas 30 5.0Oceania 67 11.2Africa 9 1.5Middle East 20 3.3Total 600 100.0
92
Respondent Travel Profiles
Table 18 presents the travel behaviors of international tourists who
participated in the survey. More than half of the respondents were first-time travelers,
while around 16% were visiting Phuket for the second time. Approximately one-third
(32.6%) had made more than two trips to Phuket. The majority of respondents (85%)
reported their major purpose for the visit was vacation, pleasure, and leisure. Around
7% went for business and visits with friends or relatives. Only 0.2% of respondents
reported their major purpose for traveling to Phuket was for shopping, while 3.3%
went to Phuket for a wedding and honeymoon, and another 2.3% were en route to
somewhere else.
Over half of the visitors (55%) stayed at Phuket more than a week, while
about 18% stayed for one week. Approximately 4% stayed at Phuket for 1-2 days,
while 21.5% stayed 3-5 days. Only 0.8% stayed less than a day at Phuket.
Approximately one-third of the respondents (31.3%) traveled with friends or relatives,
25.2% traveled with family and children, and 22.7% traveled with a spouse. Other
travel party statistics were those who traveled by themselves (17.8%), those who
traveled with a tour group (2.2%), and those who traveled with business associates
(0.8%). The majority of visitors (80%) stayed at hotels near the beach. Other forms of
accommodation were homes of friends or relatives (5.3%); hotels in Phuket town
(5.2%); timeshare, vacation hotel, or condo (5%); commercial cottage, cabin, or suit
(3.2%); and bed and breakfast hotel (1.3%).

93
Table 18: Travel Characteristics of Respondents (n = 600)
Variable Frequency Percentage
Frequency of visitsFirst time 309 51.5Second time 95 15.83-4 times 69 11.55-6 times 53 8.8More than 6 times 74 12.3Total 600 100.0
Primary purpose of visitVacation/pleasure/Leisure 510 85Business/professional 21 3.5Visit friends/relatives 21 3.5Wedding/honeymoon 20 3.3Shopping 1 0.2En route to somewhere else 14 2.3Other 13 2.2Total 600 100.0
Length of stayLess than one day 5 0.81-2 days 25 4.23-5 days 129 21.5A week 109 18.2More than a week 332 55.3Total 600 100.0
Travel partyWith friends/relative 188 31.3With family and kids 151 25.2With spouse 136 22.7By yourself 107 17.8With tour group 13 2.2With business associates 5 0.8Total 600 100.0
Type of accommodationHotel near beach 480 80.0Home of friends/relatives 32 5.3Hotel in Phuket town 31 5.2Time share/vacation hotel/condo 30 5.0Commercial cottage/cabin/suit 19 3.2Bed and Breakfast 8 1.3Total 600 100.0
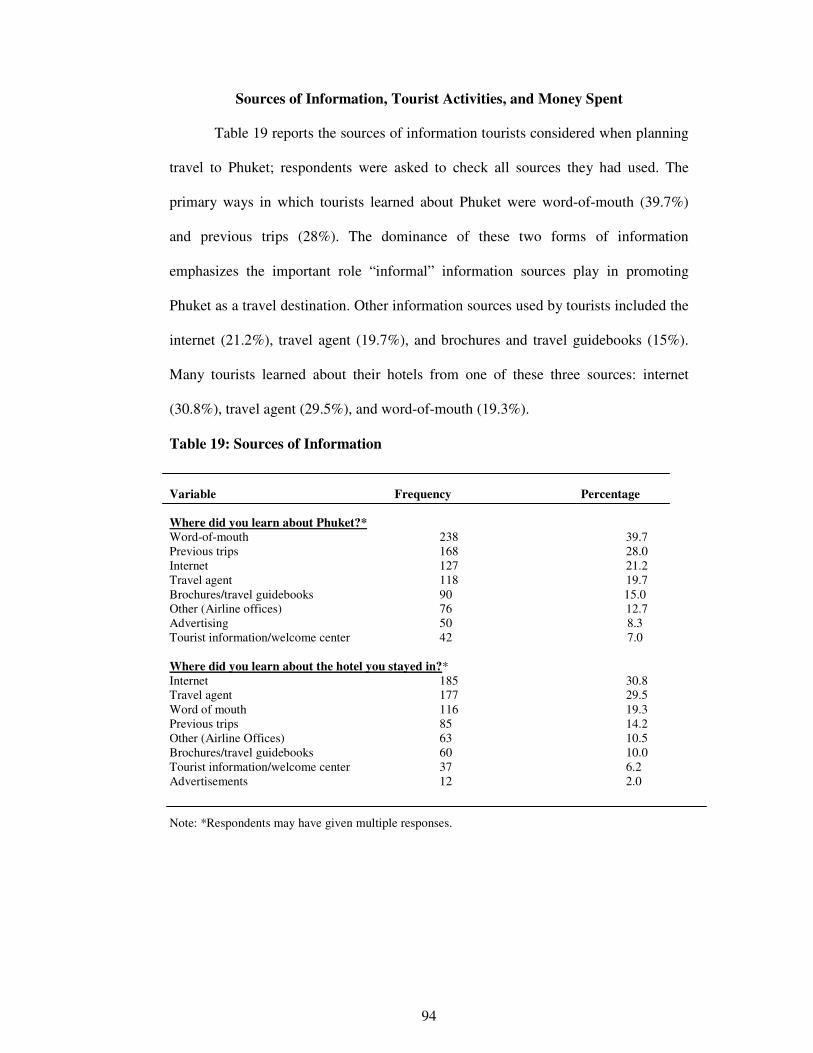
94
Sources of Information, Tourist Activities, and Money Spent
Table 19 reports the sources of information tourists considered when planning
travel to Phuket; respondents were asked to check all sources they had used. The
primary ways in which tourists learned about Phuket were word-of-mouth (39.7%)
and previous trips (28%). The dominance of these two forms of information
emphasizes the important role “informal” information sources play in promoting
Phuket as a travel destination. Other information sources used by tourists included the
internet (21.2%), travel agent (19.7%), and brochures and travel guidebooks (15%).
Many tourists learned about their hotels from one of these three sources: internet
(30.8%), travel agent (29.5%), and word-of-mouth (19.3%).
Table 19: Sources of Information
Variable Frequency Percentage
Where did you learn about Phuket?*Word-of-mouth 238 39.7Previous trips 168 28.0Internet 127 21.2Travel agent 118 19.7Brochures/travel guidebooks 90 15.0Other (Airline offices) 76 12.7Advertising 50 8.3Tourist information/welcome center 42 7.0
Where did you learn about the hotel you stayed in?*Internet 185 30.8Travel agent 177 29.5Word of mouth 116 19.3Previous trips 85 14.2Other (Airline Offices) 63 10.5Brochures/travel guidebooks 60 10.0Tourist information/welcome center 37 6.2Advertisements 12 2.0
Note: *Respondents may have given multiple responses.
95
Table 20 summarizes the activities in which tourists participated during their
travel to Phuket; respondents were asked to check all activities in which they
participated. The attractions that respondents visited in Phuket were beaches and
islands (90.2%), the Tsunami site (38.5%), and scenic views (29.7%). Most tourists
(90%) visited the southern beaches, including those in Naihan, Kata, Karon, Patong,
Kalim, and Larm Ka.
The primary activities in which tourists participated during their trips were
activities at sea (56.3%), spas (34.3%), and activities on land (32.7%). In addition, the
special events that tourists attended in Phuket were seafood festivals (6.8%),
vegetarian festivals (4.2%), and tourist season opening festivals (3.2%). Tourists did
not attend many special events as evidenced by the small number of responses.

96
Table 20: Tourist Activities
Variable Frequency Percentage
What tourist attractions did you visit in Phuket during this trip?*Beach and island 541 90.2Tsunami site 231 38.5Scenic views 178 29.7Natural wonder (e.g., Mangrove forest) 86 14.3Other 84 14.0Historic site (Wat Chalong) 72 12.0
What beaches did you visit during this trip? *Southern beach 540 90.0-Naihan Beach,-Kata Beach,-Karon Beach,-Patong Beach,-Kalim Beach,-Larm Ka BeachMiddle beach 179 29.8- Kamala Beach- Laem Sing Beach- Pansea Beach- Bang Tao BeachNorthern beach 60 10.0-Nai Thon Beach-Naiyang Beach-Mai Khao Beach
In what activities did you participate during this trip?*Activities at sea 338 56.3Spa 206 34.3Activities on land 196 32.7Other 84 14.0Golfing 45 7.5
What special events did you attend in Phuket during this trip?*Seafood Festival 41 6.8Vegetarian Festival 25 4.2Tourist Season Opening Festival 23 3.8Annual Gay Festival 16 2.7Laguna Phuket Triathlon 16 2.7Chao Le (Sea Gypsy) Boat Floating Festival 13 2.2Phuket King’s Cup Regatta 9 1.5Phuket Travel Fair 9 1.5Turtle Releasing Fair 1 0.2Other 68 11.3
Note: *Respondents may have given multiple responses.

97
The last open-ended question on the survey asked respondents to report the
amount of money they had spent for accommodations, dining, shopping,
transportation, attractions, activities, and festivals. Approximately 26% (159) of the
total respondents (600) answered this question. The low response rate may be
attributed to the inconvenience in calculating the amounts of money tourists had spent
for the various items. It may also reflect the unwillingness of respondents to report the
money they spent during their trip. Regardless of the low response rate, tourist
expenditures reported serve as valuable information to better understand the socio-
economic profile of international tourists.
The amount of money that tourists spent during their trips is shown in
Table21. Of the 159 respondents, approximately one-third (32.1%) spent 5,000 baht
per day (equivalent to US$ 125: [email protected]) for accommodations, while
15% spent 8,000 baht per day (equivalent to US$ 200). Over half of respondents
(52.8%) paid 2,000 to 4,000 baht per day (US$ 50 to US$ 100) for accommodations.
Approximately 40% of the respondents spent 1,000 baht per day (equivalent to
US$ 25) for dining. More than one-fourth (27%) spent 2,000 baht per day (equivalent
to US$ 50) for dining, followed by 1,500 baht per day (equivalent to US$ 37.5)
(21.4%), 3,000 baht per day (equivalent to US$ 75) (6.3%), 4,000 baht per day
(equivalent to US$ 100) (3.1%), 500 baht per day (equivalent to US$ 12.5) (1.3%),
and 800 baht per day (equivalent to US$ 20) (0.6%).
About 34.6% of the respondents spent no money for shopping. The percentage
of tourists who spent 1,000 baht (equivalent to US$ 25) for shopping (13.8%) was
almost equal to the percentage that spent 3,000 baht (equivalent to US$ 75) for
shopping (11.3%). Approximately one-fourth of the respondents (25.2%) spent 2,000
baht (equivalent to US$ 50) for shopping.
98
Over half of respondents (50.9%) spent 2,000 baht per day (equivalent to US$
50) for attractions, activities, and festivals, while 20% of them spent 1,500 baht
(equivalent to US$ 37.5) and approximately 13% spent 3,000 baht (equivalent to US$
75).
Approximately one-fourth (25.2%) of the respondents spent 40,000 baht
(equivalent to US$ 1,000) for transportation to Phuket, followed by 35,000 baht
(equivalent to US$ 875) (18.9%), 30,000 baht (equivalent to US$ 750) (17.6%),
20,000 baht (equivalent to US$ 500) (13.8%), and 12,000 baht (equivalent to US$
300) (8.2%).
There are three mode of transportation to Phuket; by air, by sea, and by road.
By air, Phuket has an international airport; both regularly scheduled and charter
flights from around Asia, Australia, and Europe. Most other international flights
arrive via Bangkok. There are at least ten daily flights leaving from Bangkok to
Phuket. From the airport tourists have many choices to reach their hotel, Phuket town,
or beaches. There are official airport limousine taxis, which are booked in the arrivals
hall. Official airport minibuses are also available and leave when they are full, to all
the major beaches. Private cars can be rented at the airport or at the most major hotels.
By Sea: The Deep Sea Port at Phuket is visited by both cargo and cruise ships
from Thailand and from abroad. If tourists come from abroad by yacht, it's necessary
to check in with Immigration and Customs on Chalong Bay, on the southern end of
Phuket.
By Road: Phuket, 885km south of Bangkok, is connected to the mainland by a
1200m causeway. The bus ride from Bangkok takes 12hrs, leaving from the Southern
Bus Terminal.
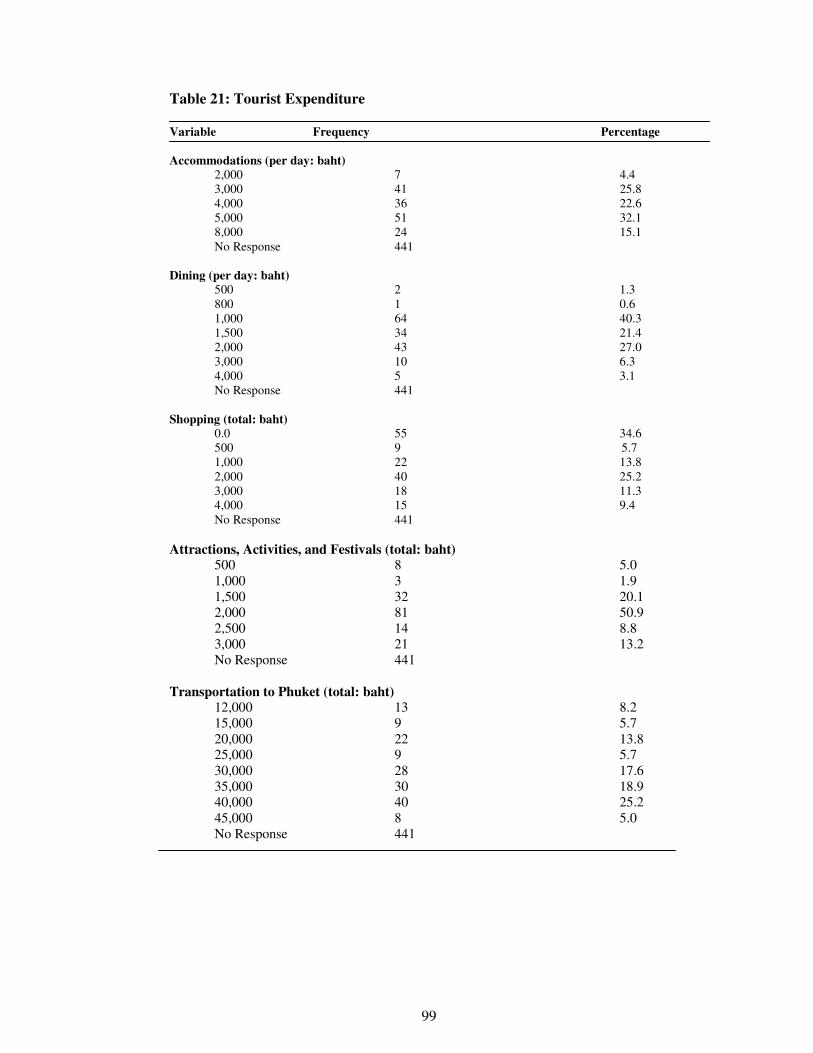
99
Table 21: Tourist Expenditure
Variable Frequency Percentage
Accommodations (per day: baht)2,000 7 4.43,000 41 25.84,000 36 22.65,000 51 32.18,000 24 15.1No Response 441
Dining (per day: baht)500 2 1.3800 1 0.61,000 64 40.31,500 34 21.42,000 43 27.03,000 10 6.34,000 5 3.1No Response 441
Shopping (total: baht)0.0 55 34.6500 9 5.71,000 22 13.82,000 40 25.23,000 18 11.34,000 15 9.4No Response 441
Attractions, Activities, and Festivals (total: baht)500 8 5.01,000 3 1.91,500 32 20.12,000 81 50.92,500 14 8.83,000 21 13.2No Response 441
Transportation to Phuket (total: baht)12,000 13 8.215,000 9 5.720,000 22 13.825,000 9 5.730,000 28 17.635,000 30 18.940,000 40 25.245,000 8 5.0No Response 441
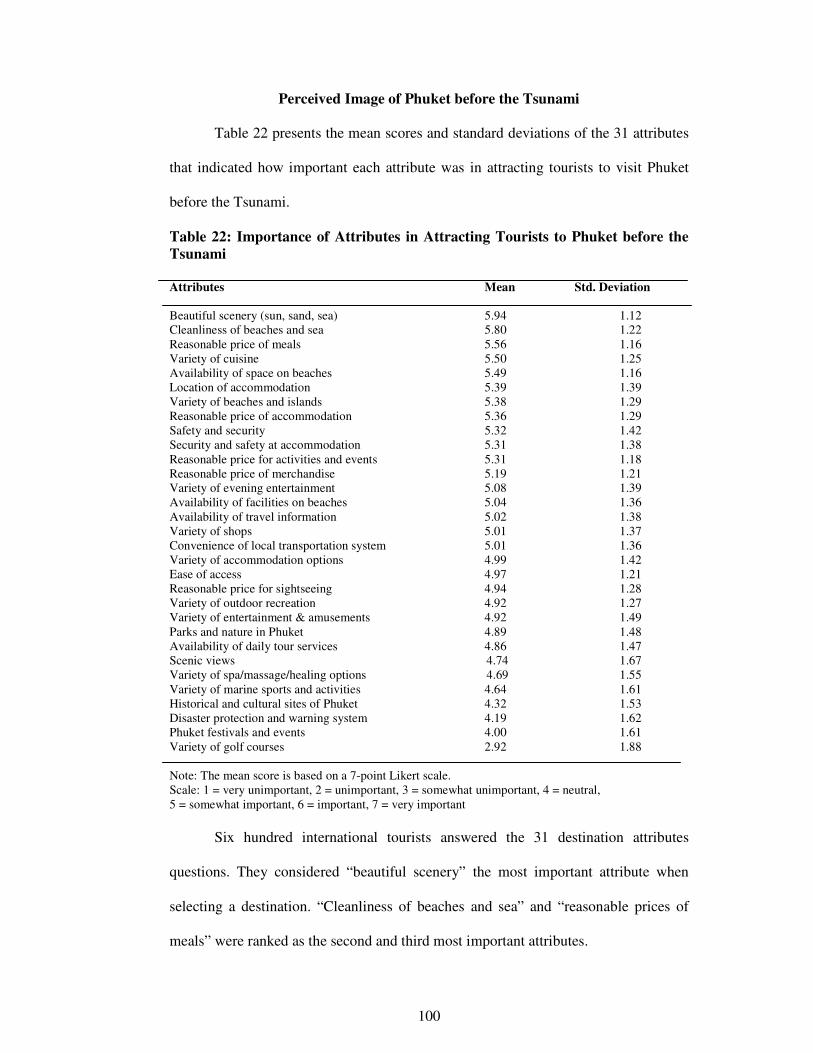
100
Perceived Image of Phuket before the Tsunami
Table 22 presents the mean scores and standard deviations of the 31 attributes
that indicated how important each attribute was in attracting tourists to visit Phuket
before the Tsunami.
Table 22: Importance of Attributes in Attracting Tourists to Phuket before theTsunami
Attributes Mean Std. Deviation
Beautiful scenery (sun, sand, sea) 5.94 1.12Cleanliness of beaches and sea 5.80 1.22Reasonable price of meals 5.56 1.16Variety of cuisine 5.50 1.25Availability of space on beaches 5.49 1.16Location of accommodation 5.39 1.39Variety of beaches and islands 5.38 1.29Reasonable price of accommodation 5.36 1.29Safety and security 5.32 1.42Security and safety at accommodation 5.31 1.38Reasonable price for activities and events 5.31 1.18Reasonable price of merchandise 5.19 1.21Variety of evening entertainment 5.08 1.39Availability of facilities on beaches 5.04 1.36Availability of travel information 5.02 1.38Variety of shops 5.01 1.37Convenience of local transportation system 5.01 1.36Variety of accommodation options 4.99 1.42Ease of access 4.97 1.21Reasonable price for sightseeing 4.94 1.28Variety of outdoor recreation 4.92 1.27Variety of entertainment & amusements 4.92 1.49Parks and nature in Phuket 4.89 1.48Availability of daily tour services 4.86 1.47Scenic views 4.74 1.67Variety of spa/massage/healing options 4.69 1.55Variety of marine sports and activities 4.64 1.61Historical and cultural sites of Phuket 4.32 1.53Disaster protection and warning system 4.19 1.62Phuket festivals and events 4.00 1.61Variety of golf courses 2.92 1.88
Note: The mean score is based on a 7-point Likert scale.Scale: 1 = very unimportant, 2 = unimportant, 3 = somewhat unimportant, 4 = neutral,5 = somewhat important, 6 = important, 7 = very important
Six hundred international tourists answered the 31 destination attributes
questions. They considered “beautiful scenery” the most important attribute when
selecting a destination. “Cleanliness of beaches and sea” and “reasonable prices of
meals” were ranked as the second and third most important attributes.

101
For international tourists, “variety of golf courses” was the least important attribute
with a mean score of only 2.92.
Other attributes receiving lower scores were “variety of accommodation
options,” “ease of access,” “reasonable price for sightseeing,” “variety of outdoor
recreation,” “variety of entertainment & amusements,” “parks and nature in Phuket,”
“availability of daily tour services,” “scenic view,” “variety of spa/massage/healing
options,” “variety of marine sports and activities,” “historical and cultural sites of
Phuket,” “disaster protection and warning system,” and “Phuket festivals and events.”
The mean scores for these attributes ranged from 4.99 to 4.00.

102
Perceived Image of Phuket after the Tsunami
Table 23 displays the mean scores and standard deviations of the 32 attributes
that indicated how important each attribute was in attracting tourists to visit Phuket
after the Tsunami.
Table 23: Importance of Attributes in Attracting Tourists to Phuket after theTsunami
Attributes Mean Std. Deviation
Cleanliness of beaches and sea 6.21 1.03Beautiful scenery (sun, sand, sea) 6.20 0.97Safety and security 6.03 1.22Reasonable price of meals 5.85 1.06Security and safety at accommodation 5.83 1.31Location of accommodation 5.78 1.25Variety of cuisine 5.68 1.24Availability of space on beaches 5.67 1.18Disaster protection and warning system 5.66 1.67Variety of beaches and islands 5.55 1.23Reasonable price of accommodation 5.52 1.28Reasonable price for activities and events 5.47 1.26Availability of travel information 5.45 1.27Convenience of local transportation system 5.42 1.38Availability of facilities on beaches 5.35 1.28Ease of access 5.32 1.24Reasonable price of merchandise 5.30 1.32Variety of accommodation options 5.25 1.30Variety of evening entertainment 5.24 1.44Available of daily tour services 5.13 1.49Variety of shops 5.12 1.49Reasonable price for sightseeing 5.08 1.51Variety of entertainment & amusements 5.05 1.42Parks and nature in Phuket 5.01 1.44Variety of spa/massage/healing options 4.96 1.62Variety of outdoor recreation 4.91 1.47Scenic views 4.90 1.54Variety of marine sports and activities 4.90 1.67Historical and cultural sites of Phuket 4.47 1.61Visit Tsunami site 4.16 1.95Phuket festivals and events 4.04 1.72Variety of golf courses 2.74 1.94
Note: The mean score is based on a 7-point Likert scale.Scale: 1 = very unimportant, 2 = unimportant, 3 = somewhat unimportant, 4 = neutral,5 = somewhat important, 6 = important, 7 = very important
Six hundred international tourists answered the 32 destination attribute
questions. They considered “cleanliness of beaches and sea” as the most important
attribute when selecting a destination. “Beautiful scenery” and “safety and security”
were ranked as the second and third most important attributes. For international

103
tourists, “variety of golf courses” was the least important attribute, followed by
“Phuket festivals and events,” and “visit the Tsunami site.”
This study found that after the Tsunami, respondents paid more attention to
the “safety and security” attribute (mean score = 6.03) when compared with before the
Tsunami occurred (mean score = 5.31), to the “security and safety at accommodation”
(mean score = 5.83; before the Tsunami mean score = 5.31), and to “disaster
protection and warning system” (mean score = 5.66; before the Tsunami mean score =
4.19). The results suggest that all stakeholders at both local and national levels
implement safety and security systems and disaster protection systems in order to
enhance Phuket’s image as a safe destination.
Several attributes remained low in importance to respondents after the
Tsunami. “Variety of spa/massage/healing options,” “variety of outdoor recreation,”
“scenic views,” “variety of marine sports and activities,” “historical and cultural sites
of Phuket,” “visiting the Tsunami site,” and “Phuket festivals and events” received
mean scores ranging from 4.96 to 4.04. The perception of “variety of golf courses”
was very weak in respondents’ minds, with a mean score of only 2.74.

104
Perceived Image Differences before and after the Tsunami
The paired-samples t test for two dependent samples was employed to
determine whether there is a significant difference in the importance of attributes
before and after the Tsunami. As shown in Table 24, the results of the test indicate a
statistically significant difference (p≤ 0.05) between the perception of how important
each attribute was in attracting international tourists to visit Phuket before the
Tsunami and after the Tsunami.
Significant differences between the groups were found for twenty-seven
attributes: “variety of accommodation options,” “security and safety at
accommodation,” “reasonable price of accommodation,” “variety of beaches and
islands,” “historical and cultural sites of Phuket,” “scenic views,” “parks and nature in
Phuket,” “reasonable prices for sightseeing,” “variety of marine sports and activities,”
“variety of golf courses,” “Phuket festivals and events,” “variety of outdoor
recreation,” “variety of spa/massage/healing options,” “availability of daily tour
services to other destinations and attractions,” “safety and security,” “beautiful
scenery,” “disaster protection and warning system,” “cleanliness of beaches and sea,”
“availability of space on beaches,” “availability of facilities on beaches,” “ease of
access,” “convenience of local transportation system,” “availability of travel
information,” “variety of shops,” “reasonable price of merchandise,” “variety of
cuisine,” and “reasonable price of meals.” Travelers who visited Phuket after the
Tsunami perceived these attributes as being much more important in their decision to
visit the island than did those who traveled to Phuket before the Tsunami.
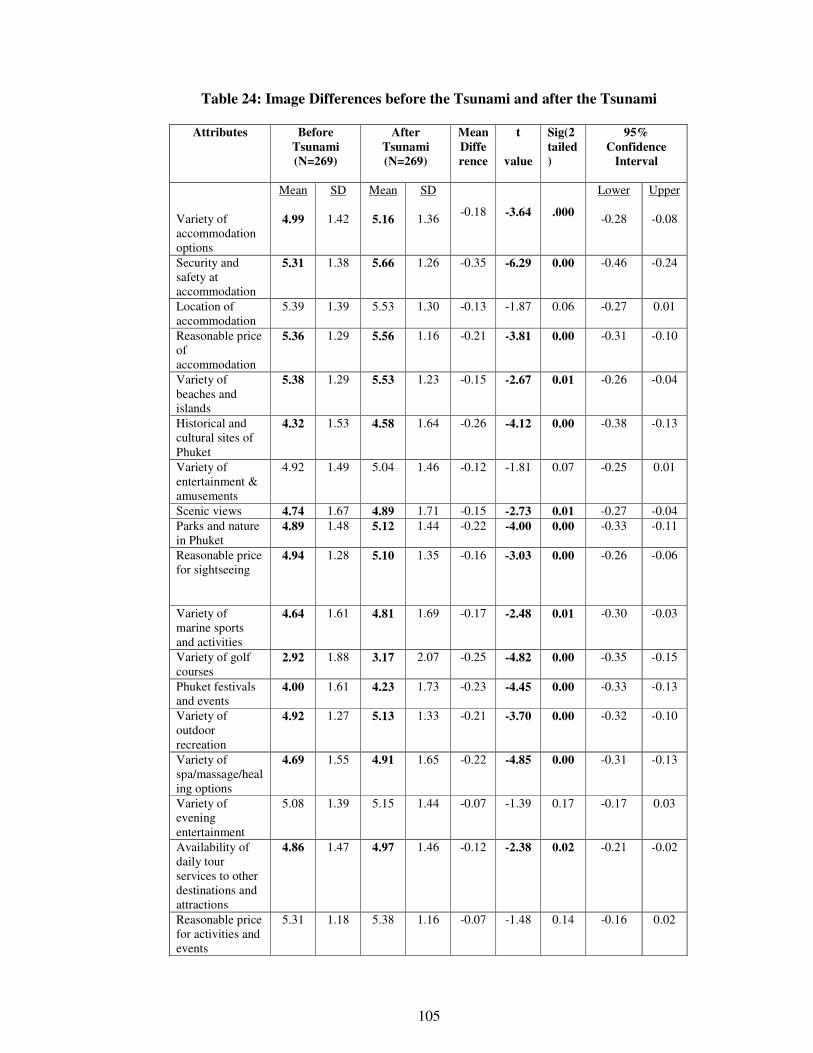
105
Table 24: Image Differences before the Tsunami and after the Tsunami
Attributes BeforeTsunami(N=269)
AfterTsunami(N=269)
MeanDifference
t
value
Sig(2tailed)
95%Confidence
Interval
Variety ofaccommodationoptions
Mean
4.99
SD
1.42
Mean
5.16
SD
1.36-0.18 -3.64 .000
Lower
-0.28
Upper
-0.08
Security andsafety ataccommodation
5.31 1.38 5.66 1.26 -0.35 -6.29 0.00 -0.46 -0.24
Location ofaccommodation
5.39 1.39 5.53 1.30 -0.13 -1.87 0.06 -0.27 0.01
Reasonable priceofaccommodation
5.36 1.29 5.56 1.16 -0.21 -3.81 0.00 -0.31 -0.10
Variety ofbeaches andislands
5.38 1.29 5.53 1.23 -0.15 -2.67 0.01 -0.26 -0.04
Historical andcultural sites ofPhuket
4.32 1.53 4.58 1.64 -0.26 -4.12 0.00 -0.38 -0.13
Variety ofentertainment &amusements
4.92 1.49 5.04 1.46 -0.12 -1.81 0.07 -0.25 0.01
Scenic views 4.74 1.67 4.89 1.71 -0.15 -2.73 0.01 -0.27 -0.04Parks and naturein Phuket
4.89 1.48 5.12 1.44 -0.22 -4.00 0.00 -0.33 -0.11
Reasonable pricefor sightseeing
4.94 1.28 5.10 1.35 -0.16 -3.03 0.00 -0.26 -0.06
Variety ofmarine sportsand activities
4.64 1.61 4.81 1.69 -0.17 -2.48 0.01 -0.30 -0.03
Variety of golfcourses
2.92 1.88 3.17 2.07 -0.25 -4.82 0.00 -0.35 -0.15
Phuket festivalsand events
4.00 1.61 4.23 1.73 -0.23 -4.45 0.00 -0.33 -0.13
Variety ofoutdoorrecreation
4.92 1.27 5.13 1.33 -0.21 -3.70 0.00 -0.32 -0.10
Variety ofspa/massage/healing options
4.69 1.55 4.91 1.65 -0.22 -4.85 0.00 -0.31 -0.13
Variety ofeveningentertainment
5.08 1.39 5.15 1.44 -0.07 -1.39 0.17 -0.17 0.03
Availability ofdaily tourservices to otherdestinations andattractions
4.86 1.47 4.97 1.46 -0.12 -2.38 0.02 -0.21 -0.02
Reasonable pricefor activities andevents
5.31 1.18 5.38 1.16 -0.07 -1.48 0.14 -0.16 0.02

106
Safety andsecurity
5.32 1.42 5.88 1.20 -0.55 -9.25 0.00 -0.67 -0.44
Beautifulscenery(sun, sand, sea)
5.94 1.12 6.08 0.99 -0.13 -2.53 0.01 -0.24 -0.03
Disasterprotection andwarning system
4.19 1.62 5.90 1.33 -1.71 -17.9 0.00 -1.90 -1.53
Cleanliness ofbeaches and sea
5.80 1.22 6.12 0.96 -0.32 -6.19 0.00 -0.42 -0.22
Availability ofspace on beaches
5.49 1.16 5.65 1.09 -0.16 -3.95 0.00 -0.24 -0.08
Availability offacilities onbeaches
5.04 1.36 5.30 1.36 -0.26 -5.43 0.00 -0.35 -0.17
Ease of access 4.97 1.21 5.21 1.21 -0.24 -4.98 0.00 -0.33 -0.14Convenience oflocaltransportationsystem
5.01 1.36 5.43 1.30 -0.42 -6.27 0.00 -0.56 -0.29
Availability oftravelinformation
5.02 1.38 5.33 1.30 -0.32 -6.03 0.00 -0.42 -0.21
Variety of shops 5.01 1.37 5.14 1.50 -0.13 -2.33 0.02 -0.23 -0.02Reasonable priceof merchandise
5.19 1.21 5.33 1.26 -0.14 -2.33 0.01 -0.25 -0.03
Variety ofcuisine
5.50 1.25 5.84 1.11 -0.34 -5.72 0.00 -0.45 -0.22
Reasonable priceof meals
5.56 1.16 5.91 0.99 -0.35 -5.94 0.00 -0.47 -0.23
The results reveal a significant difference in the perception of “variety of
accommodation options” before and after the Tsunami. The paired samples t test,
applied to the overall variety of accommodation scores, yielded a value of -3.64,
which is significant at the .05 level. Travelers who visited Phuket after the Tsunami
rated the importance of “variety of accommodation options” higher (mean=5.16) than
those who visited before the Tsunami (mean = 4.99). The results of the paired
samples t test also indicate a significant difference in the perception of “security and
safety at accommodation” between those who visited Phuket before and after the
Tsunami (t = -6.29, p ≤ 0.00). Travelers who visited Phuket after the Tsunami rated
the importance of “security and safety at accommodation” higher (mean = 5.66) than
those who visited before the Tsunami (mean = 5.31).

107
Moreover, the paired samples t-test found significant differences in the
perception of the following attributes: “reasonable price of accommodation” (t =
-3.81, p ≤ 0.00), “variety of beaches and islands” (t = -2.67, p ≤ .01), “historical and
cultural sites of Phuket” (t = -4.12, p ≤ 0.00), “scenic views”(t = -2.73, p ≤ 0.01),
“parks and nature in Phuket” (t = -4.00, p ≤ 0.00), “reasonable prices for sightseeing”
(t = -3.03, p ≤ 0.00), “variety of marine sports and activities” (t = -2.48, p ≤ 0.01),
“variety of golf courses” (t = -4.82, p ≤ 0.00), “Phuket festivals and events” (t = -4.45,
p ≤ 0.00), “variety of outdoor recreation” (t = -3.7, p ≤ 0.00), “variety of
spa/massage/healing options” (t = -4.85, p ≤ 0.00), “availability of daily tour services
to other destinations and attractions” (t = -2.38, p ≤ 0.02), “safety and security” (t =
-9.25, p ≤ 0.00), “beautiful scenery” (t = -2.53, p≤ 0.01), “disaster protection and
warning system” (t = -17.90, p ≤ 0.00), “cleanliness of beaches and sea” (t = -6.19,
p ≤ 0.00), “available of space on beaches” (t = -3.95, p ≤ 0.00), “availability of
facilities on beaches” (t = -5.43, p ≤ 0.00), “ease of access” (t = -4.98, p ≤0.00),
“convenience of local transportation system” (t = -6.27, p ≤ 0.00), “availability of
travel information” (t = -6.03, p ≤0.00), “variety of shops” (t = -2.33, p ≤ 0.02),
“reasonable price of merchandise” (t = -2.32, p ≤ 0.01), “variety of cuisine” (t = -5.72,
p ≤ 0.00), and “reasonable price of meals” (t = -5.94, p ≤ 0.00). In each of these cases,
travelers who visited Phuket after the Tsunami rated the importance of these attributes
higher than those who visited before the Tsunami.
108
Underlying Dimensions of the Perceived Image of Phuket before the Tsunami
To verify the dimensions of the perceived image of Phuket before the
Tsunami, exploratory factor analysis was performed. Factor analysis helps obtain a
relatively smaller number of dimensions that explain most of the variations among the
important attributes that attracted travelers to visit Phuket.
Assessment of the Suitability of the Data for Factor Analysis
To assess whether the data were suitable and appropriate for common factor
analysis, the data set was examined to ensure that assumptions were met. Three
techniques were used to assess the suitability of the data for factor analysis. The
following criteria need to be met for the data to be considered appropriate for factor
analysis: (1) a correlation coefficient of 0.30 or above in the correlation matrix, (2) the
value of Bartlett’s test of sphericity (using a chi-square test) at the significant level of
(p<0.05), and (3) a Kaiser-Meyer-Olkin Measure of Sampling Adequacy index
(MSA) of 0.60 or greater.
Table 25 shows that the Bartlett Test of Sphericity and the Kaiser-Meyer-
Olkin Measure of Sampling Adequacy indicated the appropriateness of using an
exploratory factor analysis for the set of attributes perceived as being important. The
Bartlett Test of Sphericity showed a value of 4063.17 at a significance level of .00,
indicating that a nonzero correlation exists among variables. The Kaiser-Meyer-Olkin
Measure of Sampling Adequacy was above .60, indicating that the data are suitable
for factor analysis.

109
Table 25: KMO and Bartlett’s Test for Perceived Image of Phuket before the
Tsunami
Kaiser-Meyer-Olkin Measure of Sampling
Adequacy
0.87
Bartlett’s Test of Sphericity
Approx. Chi-Square 4063.17
Df 465
Sig 0.00
Factor Extraction
The criteria to determine the smallest number of factors that can be used to
best represent the inter-relations among the variables in the set were based on the size
of eigenvalues and the pattern of factor loading. All factors to be retained must have
an eigenvalue greater than one.
Factor Rotation and Interpretation
The Principal Component Analysis with eigenvalues greater than one was
rotated by the varimax analysis. Only factor loadings of 0.40 or higher were retained,
indicating good correlations between the items and the factors to which they belonged
(Hair et al., 1998). The final factor analysis generated five factors, consisting of 19
items, which accounted for 64.38 percent of the total variance (see Table 26).
Factor Reliability
To test the reliability and internal consistency of each factor, Cronbach’s
coefficient alpha was performed and the factors with alpha of 0.60 were retained for
further analysis (Kline, 1994). The Cronbach’s alphas for the five factors were robust,
ranging from 0.66 to 0.80, which indicates high internal consistency among the
variables within each factor.

110
Table 26: Underlying Dimensions of the Perceived Image of Phuket before the
Tsunami
AttributesFactor
LoadingsEigenvalue
VarianceExplained
Cronbach’sα
Factor 1: Accessibility and Price 6.54 34.43% .80Ease of accessReasonable price of mealsVariety of cuisineAvailability of space on beachesAvailability of facilities on beachesReasonable price of merchandiseConvenience of local transportation system
.78
.75
.71
.68
.64
.63
.60
Factor 2: Entertainment and Relaxation 1.81 9.51% .71Variety of evening entertainmentVariety of entertainment & amusementsVariety of shopsVariety of spa/massage/healing options
.75
.71
.60
.47
Factor 3: Accommodation, Beaches, andIslands
1.50 7.90% .66
Variety of accommodation optionsLocation of accommodationVariety of beaches and islands
.74
.68
.64
Factor 4: Outdoor Activities and HistoricAttractions
1.31 6.87% .69
Variety of outdoor recreationParks and nature in PhuketHistorical and cultural sites of Phuket
.75
.74
.71
Factor 5: Safety and Security 1.08 5.68% .78Safety and securitySecurity and safety at accommodation
.82
.76
Total variance explained 64.38%
As shown in Table 26, five factors represented 64.38% of the total variance.
These five factors are “Accessibility and Price,” “Entertainment and Relaxation,”
“Accommodation, Beaches, and Islands,” “Outdoor Activities and Historic
Attractions,” and “Safety and Security.”
Factor 1, “Accessibility and Price,” had an eigenvalue of 6.54 and explained
34.43% of the total variance. It consisted of seven items: “ease of access,”
“reasonable price of meals,” “variety of cuisine,” “availability of space on beaches,”
“availability of facilities on beaches,” “reasonable price of merchandise,” and
111
“convenience of local transportation system.” The alpha coefficient, which was 0.80,
is considered acceptable as it is greater than 0.60.
Factor 2, “Entertainment and Relaxation,” captured 9.51% of the total
variance with an eigenvalue of 1.81. It contained four items: “variety of evening
entertainment,” “variety of entertainment and amusements,” “variety of shops,” and
“variety of spa/massage/healing options.” The alpha of 0.71 is considered acceptable.
Factor 3, “Accommodation, Beaches, and Islands,” included three items:
“variety of accommodation options,” “location of accommodation,” and “variety of
beaches and islands.” It explained 7.90% of the total variance with an eigenvalue of
1.50. The alpha coefficient was 0.66 and well within the acceptable range.
Factor 4 was “Outdoor Activities and Historic Attractions.” It contained three
items and explained 6.87% of the variance in the data with an eigenvalue of 1.31. The
three items were “variety of outdoor recreation,” “parks and nature in Phuket,” and
“historical and cultural sites of Phuket.” The alpha was 0.69.
Factor 5, “Safety and Security,” included two items: “safety and security” and
“security and safety at accommodation.” It represented 5.68% of the total variance
with an eigenvalue of 1.08. The alpha coefficient was 0.78.
112
Underlying Dimensions of the Perceived Image of Phuket after the Tsunami
To verify the dimensions of the perceived image of Phuket after the Tsunami,
exploratory factor analysis was performed. Factor analysis helps obtain a relatively
smaller number of dimensions that explain most of the variations among the important
attributes that attracted travelers to visit Phuket after the Tsunami.
Assessment of the Suitability of the Data for Factor Analysis
To assess whether the data were suitable for common factor analysis, the data
set was examined to ensure that assumptions were met. Three techniques were used to
assess the suitability of data for factor analysis. The following criteria need to be met
for the data to be considered appropriate for factor analysis: (1) a correlation
coefficient of 0.30 or above in the correlation matrix, (2) the value of Bartlett’s Test
of Sphericity (using a chi-square test) at the significant level of (p<0.05), and (3) a
Kaiser-Meyer-Olkin Measure of Sampling Adequacy index (MSA) of 0.60 or greater.
Table 27 shows that the Bartlett Test of Sphericity and the Kaiser-Meyer-
Olkin Measure of Sampling Adequacy indicate the appropriateness of using an
exploratory factor analysis for the set of attributes perceived as being important. The
Bartlett Test of Sphericity shows a value of 7121.21 at a significance level of .00,
indicating that a nonzero correlation exists among variables. The Kaiser-Meyer-Olkin
Measure of Sampling Adequacy was above .60, indicating that the data are suitable
for factor analysis.
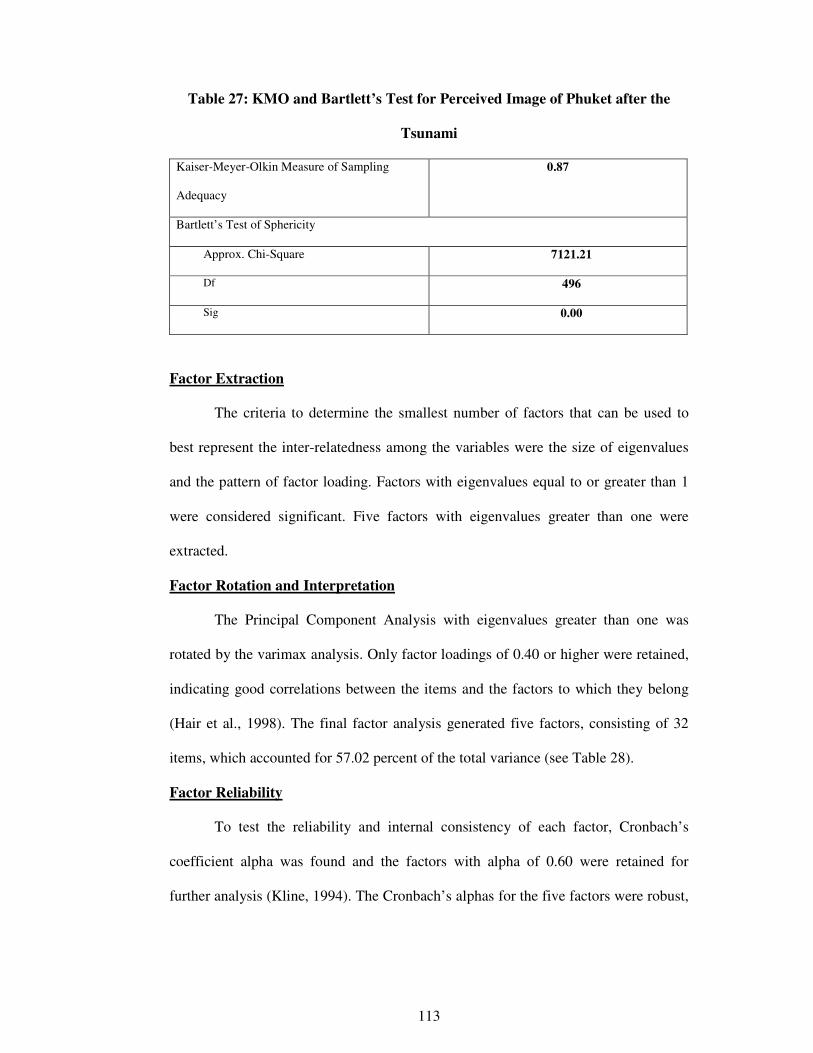
113
Table 27: KMO and Bartlett’s Test for Perceived Image of Phuket after the
Tsunami
Kaiser-Meyer-Olkin Measure of Sampling
Adequacy
0.87
Bartlett’s Test of Sphericity
Approx. Chi-Square 7121.21
Df 496
Sig 0.00
Factor Extraction
The criteria to determine the smallest number of factors that can be used to
best represent the inter-relatedness among the variables were the size of eigenvalues
and the pattern of factor loading. Factors with eigenvalues equal to or greater than 1
were considered significant. Five factors with eigenvalues greater than one were
extracted.
Factor Rotation and Interpretation
The Principal Component Analysis with eigenvalues greater than one was
rotated by the varimax analysis. Only factor loadings of 0.40 or higher were retained,
indicating good correlations between the items and the factors to which they belong
(Hair et al., 1998). The final factor analysis generated five factors, consisting of 32
items, which accounted for 57.02 percent of the total variance (see Table 28).
Factor Reliability
To test the reliability and internal consistency of each factor, Cronbach’s
coefficient alpha was found and the factors with alpha of 0.60 were retained for
further analysis (Kline, 1994). The Cronbach’s alphas for the five factors were robust,
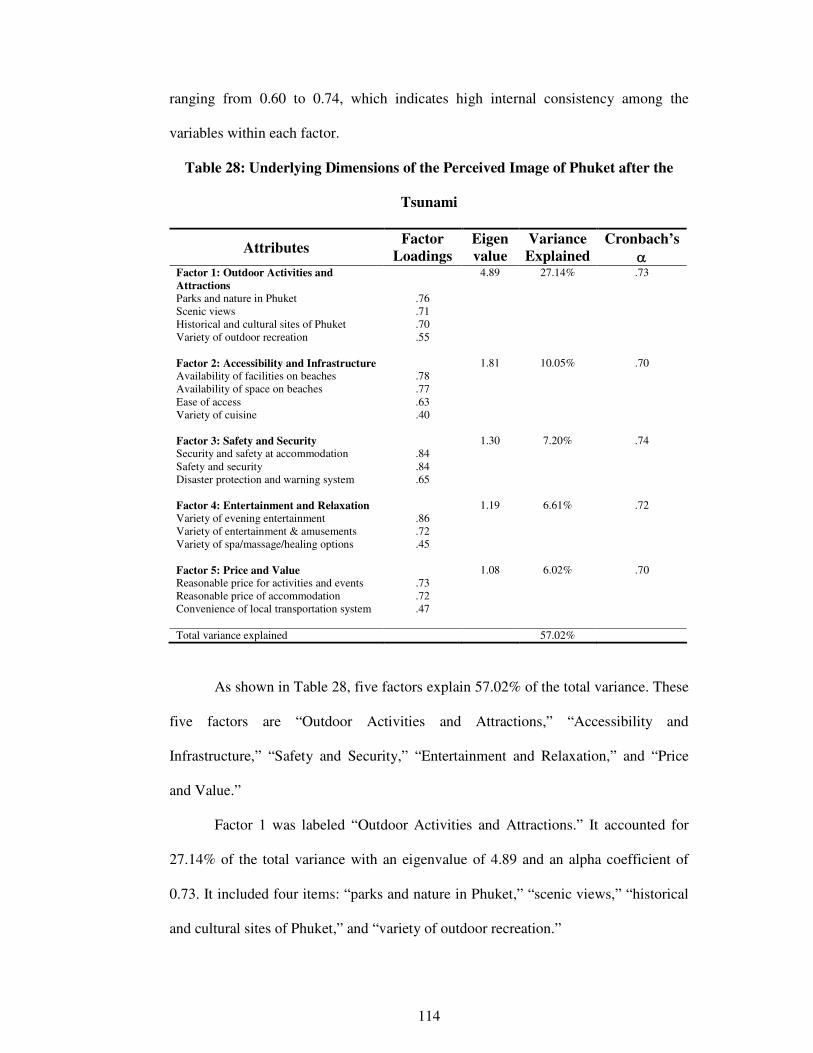
114
ranging from 0.60 to 0.74, which indicates high internal consistency among the
variables within each factor.
Table 28: Underlying Dimensions of the Perceived Image of Phuket after the
Tsunami
AttributesFactor
LoadingsEigenvalue
VarianceExplained
Cronbach’sα
Factor 1: Outdoor Activities andAttractions
4.89 27.14% .73
Parks and nature in PhuketScenic viewsHistorical and cultural sites of PhuketVariety of outdoor recreation
.76
.71
.70
.55
Factor 2: Accessibility and Infrastructure 1.81 10.05% .70Availability of facilities on beachesAvailability of space on beachesEase of accessVariety of cuisine
.78
.77
.63
.40
Factor 3: Safety and Security 1.30 7.20% .74Security and safety at accommodationSafety and securityDisaster protection and warning system
.84
.84
.65
Factor 4: Entertainment and Relaxation 1.19 6.61% .72Variety of evening entertainmentVariety of entertainment & amusementsVariety of spa/massage/healing options
.86
.72
.45
Factor 5: Price and Value 1.08 6.02% .70Reasonable price for activities and eventsReasonable price of accommodationConvenience of local transportation system
.73
.72
.47
Total variance explained 57.02%
As shown in Table 28, five factors explain 57.02% of the total variance. These
five factors are “Outdoor Activities and Attractions,” “Accessibility and
Infrastructure,” “Safety and Security,” “Entertainment and Relaxation,” and “Price
and Value.”
Factor 1 was labeled “Outdoor Activities and Attractions.” It accounted for
27.14% of the total variance with an eigenvalue of 4.89 and an alpha coefficient of
0.73. It included four items: “parks and nature in Phuket,” “scenic views,” “historical
and cultural sites of Phuket,” and “variety of outdoor recreation.”
115
Factor 2 was labeled “Accessibility and Infrastructure.” It represented 10.05%
of the total variance explained with an eigenvalue of 1.81 and an alpha coefficient of
0.70. It included four items: “availability of facilities on beaches,” “availability of
space on beaches,” “ease of access,” and “variety of cuisine.”
Factor 3, “Safety and Security,” accounted for 7.20% of the total variance with
an eigenvalue of 1.30 and an alpha coefficient of 0.74. Three items are included in
this factor: “security and safety at accommodation,” “safety and security,” and
“disaster protection and warning system.”
Factor 4, “Entertainment and Relaxation,” consisted of three items: “variety of
evening entertainment,” “variety of entertainment and amusements,” and “variety of
spa/massage/healing options.” It accounted for 6.61% of the total variance with an
eigenvalue of 1.19. The alpha coefficient was 0.72 and greater than the threshold
of .60, indicating that the reliability is considered acceptable.
Factor 5 was labeled “Price and Value.” It contained three items and explained
6.02% of the variance in the data with an eigenvalue of 1.08 and an alpha coefficient
of 0.70. The three items included were “reasonable price for activities and events,”
“reasonable price of accommodation,” and “convenience of local transportation
system.”

116
Underlying Dimensions of Travel Motivation
Exploratory Factor Analysis (EFA) was used to describe and summarize the
data related to travel motivation by grouping variables that correlate with one another.
Factor analysis helps obtain a relatively smaller number of dimensions that explain
most of the variation among the travel motivation attributes.
Assessment of the Suitability of the Data for Factor Analysis
To assess whether the data were suitable and appropriate for common factor
analysis, the data set was examined to ensure that assumptions were met. Three
techniques were used to assess the suitability of data for factor analysis. The
following criteria must be met for the data to be considered appropriate for factor
analysis: (1) a correlation coefficient of 0.30 or above in the correlation matrix, (2) the
value of Bartlett’s Test of Sphericity (using a chi-square test) at the significance level
of (p<0.05), and (3) a Kaiser-Meyer-Olkin Measure of Sampling Adequacy index
(MSA) of 0.60 or greater.
Table 29 shows that the Bartlett Test of Sphericity and the Kaiser-Meyer-
Olkin Measure of Sampling Adequacy indicate the appropriateness of using an
exploratory factor analysis for the set of travel motivation attributes. The Bartlett Test
of Sphericity shows a value of 10479.05 at a significance level of .00, indicating that a
nonzero correlation exists among variables. The Kaiser-Meyer-Olkin Measure of
Sampling Adequacy was above .60, indicating that the data are suitable for factor
analysis.
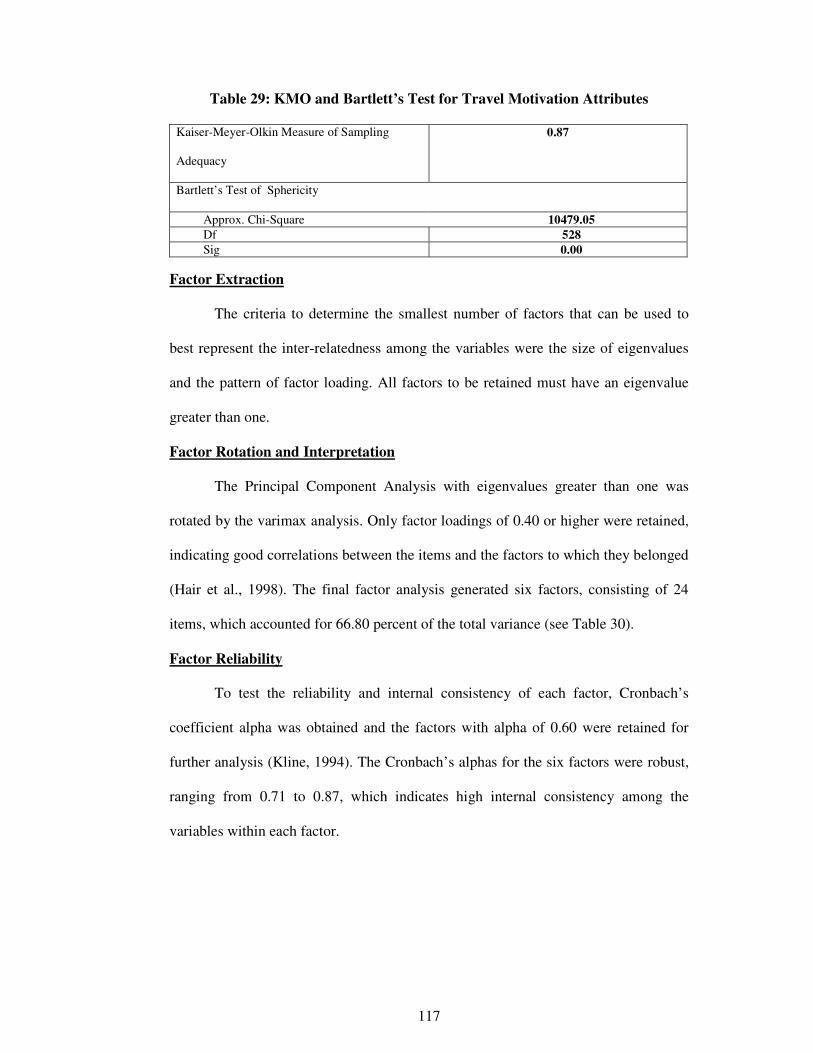
117
Table 29: KMO and Bartlett’s Test for Travel Motivation Attributes
Kaiser-Meyer-Olkin Measure of Sampling
Adequacy
0.87
Bartlett’s Test of Sphericity
Approx. Chi-Square 10479.05Df 528Sig 0.00
Factor Extraction
The criteria to determine the smallest number of factors that can be used to
best represent the inter-relatedness among the variables were the size of eigenvalues
and the pattern of factor loading. All factors to be retained must have an eigenvalue
greater than one.
Factor Rotation and Interpretation
The Principal Component Analysis with eigenvalues greater than one was
rotated by the varimax analysis. Only factor loadings of 0.40 or higher were retained,
indicating good correlations between the items and the factors to which they belonged
(Hair et al., 1998). The final factor analysis generated six factors, consisting of 24
items, which accounted for 66.80 percent of the total variance (see Table 30).
Factor Reliability
To test the reliability and internal consistency of each factor, Cronbach’s
coefficient alpha was obtained and the factors with alpha of 0.60 were retained for
further analysis (Kline, 1994). The Cronbach’s alphas for the six factors were robust,
ranging from 0.71 to 0.87, which indicates high internal consistency among the
variables within each factor.

118
Table 30: Underlying Dimensions of Travel Motivation
AttributesFactor
LoadingsEigenvalue
VarianceExplained
Cronbach’sα
Factor 1: Cultural Events and PlaceExploration
6.90 28.75% .87
Enjoy culture in its cultural/historicsettingKnow about cultural eventsExperience different culturesVisit new and exciting placeTake advantage of reduced fares andspecial packageVisit places important in history(e.g., Tsunami site)Visit festivals and/or special events
.87
.85
.81
.61
.60
.59
.58
Factor 2: Socialization 2.40 10.01% .76Visit friends and relativesShare a familiar place with otherReturn to favorite vacation siteMix with fellow tourists
.79
.73
.69
.44
Factor 3: Relaxation 2.21 9.19% .78RelaxationGet rechargedBe able to do nothingRelease tension
.79
.77
.76
.75
Factor 4: Excitement 1.58 6.59% .74
Be entertainedDo exciting thingsDo a specific activityEngage in sports
.78
.78
.65
.47
Factor 5: Leisure and Romance 1.34 5.58% .71Spend time with someone specialHave time for romanceEat good food
.85
.78
.47
Factor 6: Escape 1.13 4.69% .76Get away from crowdsExperience unpolluted/naturalsurrounding
.86
.80
Total variance explained 66.80%
As shown in Table 30, six factors explained 66.80% of the total variance.
These six factors are “Cultural Events and Place Exploration,” “Socialization,”
“Relaxation,” “Excitement,” “Leisure and Romance,” and “Escape.”
119
Factor 1, “Cultural Events and Place Exploration,” contained seven items and
explained 28.75% of the variance in the data, with an eigenvalue of 6.90. The seven
items were “enjoy culture in its cultural/historic setting,” “know about cultural
events,” “experience different cultures,” “visit new and exciting places,” “take
advantage of reduced fares and special packages,” “visit places important in history
(e.g., Tsunami site),” and “visit festivals and/or special events.” Alpha was calculated
to be 0.87, and as it is greater than 0.60, it is considered acceptable.
Factor 2, “Socialization,” contained four items and explained 10.01% of the
variance in the data, with an eigenvalue of 2.40. The four items were “visit friends
and relatives,” “share a familiar place with others,” “return to a favorite vacation site,”
and “mix with fellow tourists.” Alpha was calculated to be 0.76, and as it is greater
than 0.60, it is considered acceptable.
Factor 3 was labeled “Relaxation.” It contained four items and explained
9.188% of the variance in the data, with an eigenvalue of 2.21. The four items were
“relaxation,” “get recharged,” “be able to do nothing,” and “release tension.” Alpha
was calculated to be 0.78. Because it is greater than 0.60, it is considered acceptable.
Factor 4 was “Excitement,” which contained four items and explained 6.59%
of the variance in the data, with an eigenvalue of 1.58. The four items were “be
entertained,” “do exciting things,” “do a specific activity,” and “engage in sports.”
Alpha was calculated to be 0.74, and as it is greater than 0.60, it is considered
acceptable.
Factor 5, “Leisure and Romance” contained three items and explained 5.58%
of the variance in the data, with an eigenvalue of 1.34. The three items were “spend
time with someone special,” “have time for romance,” and “eat good food.” Alpha
was calculated to be 0.71, which is acceptable because it is greater than 0.60.
120
Factor 6 was named “Escape.” It contained two items and explained 4.69% of
the variance in the data, with an eigenvalue of 1.13. The two items were “get away
from crowds” and “experience unpolluted/natural surrounding.” Alpha was calculated
to be 0.76; it is acceptable because it is greater than 0.60.
Travel Motivation Differences by Number of Visits
To determine whether there is a significant difference in the travel motivations
between first-time and repeat travelers, the Independent Sample Mean t-test was
employed. In addition, the Levene’s test was performed to check for the homogeneity
of variance assumption. The Levene’s test showed there were unequal variances in
five out of thirty-three travel motivation attributes (see Table 31). Therefore, the
separate-variance t test for means (the equal variances not assumed) was used for
comparing means of these four attributes (SPSS, 1999).
The results of the independent sample t-tests revealed a significant difference
in the “relaxation” motivation between first-time and repeat travelers (t = -2.58, p ≤
0.01). Repeat travelers were more motivated by “relaxation” than were first-time
travelers. The finding is consistent with the previous literature. Gitelson & Crompton
(1984) reported that repeat travelers were more likely to be seeking relaxation. The
results of the independent sample t-tests also indicated a significant difference in the
following attributes: “do specific activity” (t = -2.89, p ≤ 0.00), “visit friends and
relatives” (t = -7.25, p ≤ 0.00), “share a familiar place with others” (t = -6.49, p ≤
0.00), “return to favorite vacation site” (t = -11.42, p ≤ 0.00), “do something with
family” (t = -3.80, p ≤ 0.00), “eat good food” (t = -2.03, p ≤ 0.04), “spend time with
someone special” (t = -2.4, p ≤ 0.02), “have time for romance” (t = -2.68, p ≤ 0.01),
“spend time with family and friends” (t = -3.67, p ≤ 0.00), “build friendship with

121
others” (t = -2.59, p ≤ 0.01), “mix with fellow tourists” (t = -1.99, p ≤ 0.05), and “visit
places important in history” (t = -2.56, p ≤ 0.01). In each of these cases, repeat
travelers were more motivated than were first-time travelers.
Moreover, significant differences were also found in the following attributes:
“do exciting things” (t = 2.70, p≤ 0.01), “experience new/different places” (t = 5.97, p
= 0.00), “visit new and exciting places” (t = 6.60, p ≤ 0.00), “engage in special
activities” (t = 2.15, p ≤ 0.03), “experience different cultures” (t = 3.18, p ≤ 0.00), and
“enjoy culture in its cultural/historic setting” (t = 2.97, p ≤ 0.00). In each of these
cases, repeat travelers were less motivated than were first-time travelers.
Table 31: Travel Motivation Differences by Number of Visits
Attributes First TimeTravelers(N=309)
RepeatTravelers(N=291)
MeanDifference
t value Sig.(2-tailed)
95%Confidence
Interval
Relaxation
Mean
5.96
SD
1.02
Mean
6.18
SD
1.01 -0.22 -2.58 0.01
Lower
0.052
Upper
0.39
Get
recharged
5.83 1.32 5.64 1.20 0.19 1.84 0.07 -0.01 0.39
Be able todo nothing
5.21 1.67 5.32 1.38 -0.11 -0.90 0.37 -0.36 0.13
Releasetension
5.49 1.42 5.48 1.32 0.00 0.04 0.97 -0.22 0.22
Have
privacy
5.11 1.49 5.09 1.42 0.02 0.20 0.84 -0.21 0.26
Do excitingthings
5.34 1.45 5.01 1.54 0.33 2.70 0.01 0.09 0.57
Be
entertained
4.91 1.50 4.93 1.51 -0.03 -0.21 0.84 -0.27 0.22
Do aspecificactivity
4.46 1.70 4.85 1.57 -0.39 -2.89 0.00 -0.65 -0.12

122
Get awayfrom crowds
5.05 1.58 4.98 1.69 0.07 0.54 0.59 -0.19 0.33
Experienceunpolluted/naturalsurrounding
5.59 1.38 5.52 1.27 0.06 0.58 0.56 -0.15 0.28
Get awayfrompressuresandresponsibilities
5.70 1.51 5.81 1.32 -0.11 -0.91 0.36 -0.33 0.12
Visit friendsand relatives
2.79 2.09 4.03 2.11 -1.25 -7.25 0.00 -1.58 -0.91
Share afamiliarplace withothers
3.50 1.99 4.53 1.90 -1.03 -6.49 0.00 -1.34 -0.72
Return tofavoritevacationsite*
3.44 2.06 5.19 1.65 -1.75 -11.42 0.00 -2.05 -1.45
Dosomethingwith family*
4.04 2.33 4.71 1.95 -0.67 -3.80 0.00 -1.01 -0.32
Eat good
food*
5.56 1.62 5.80 1.24 -0.24 -2.03 0.04 -0.47 -0.01
Go shopping 4.80 1.74 4.90 1.65 -0.10 -0.73 0.47 -0.37 0.17
Have lots ofdifferentthings to seeand do
5.41 1.37 5.24 1.48 0.17 1.49 0.14 -0.06 0.40
Experiencenew/differentplaces
5.86 1.30 5.18 1.50 0.68 5.97 0.00 0.46 0.91
Visit newand excitingplace
5.86 1.29 5.10 1.55 0.77 6.60 0.00 0.54 1.00
Spend timewithsomeonespecial
5.00 1.94 5.34 1.54 -0.34 -2.40 0.02 -0.63 -0.06

123
Have timeforromance*
4.77 2.06 5.18 1.71 -0.42 -2.68 0.01 -0.72 -0.11
Spend timewith familyand friend*
4.79 1.98 5.33 1.64 -0.55 -3.67 0.00 -0.84 -0.25
Buildfriendshipwith others
4.20 1.90 4.59 1.75 -0.39 -2.59 0.01 -0.68 -0.09
Mix withfellowtourists
3.81 1.83 4.11 1.88 -0.30 -1.99 0.05 -0.60 0.00
Engage insports*
4.06 1.91 3.91 1.96 0.15 0.94 0.35 -0.16 0.46
Visitfestivalsand/orspecialevents*
3.95 1.83 3.97 1.72 -0.03 -0.19 0.85 -0.31 0.26
Engage inspecialactivities
4.39 1.73 4.08 1.75 0.31 2.15 0.03 0.03 0.59
Experiencedifferentcultures
5.46 1.54 5.07 1.47 0.39 3.18 0.00 0.15 0.63
Enjoyculture in itscultural/historicsetting
5.09 1.57 4.71 1.62 0.39 2.97 0.00 0.13 0.64
Know aboutculturalevents*
4.66 1.68 4.52 1.62 0.15 1.10 0.27 -0.12 0.41
Takeadvantage ofreducedfares andspecialpackage*
4.48 1.92 4.54 1.75 -0.05 -0.36 0.72 -0.35 0.24
Visit placesimportant inhistory (e.g.,Tsunamisite)
4.33 1.81 4.71 1.84 -0.38 -2.56 0.01 -0.67 -0.09
Note: * equal variances are assumed for these t-tests.
124
Applicability of the Theory of Planned Behavior (TPB) Model to Tourism
The main objective of this study was to empirically test the applicability of the
theory of planned behavior (TPB) model in predicting tourist behavior intention
toward a destination recovering from debilitating Tsunami. Structural Equation
Modeling (SEM) was applied in order to test four hypotheses that were based on a
comprehensive review of the literature.
In Chapter 2, the literature review discussed the theoretical foundation for the
interrelationships among the latent constructs in the proposed model. In this model a
positive attitude, a subjective norm, and perceived behavior control toward a
destination are posited to positively affect a tourist behavior intention.
Measurement Items
Descriptive statistics for the measurement items of the latent constructs were
assessed. Table 32 presents the mean value, the standard deviation of each
measurement item, and the reliability alpha for each construct. The mean value of the
five measures of “attitude toward destination” ranged from 5.31 to 6.04 with a
reliability alpha value of 0.91. The mean value of the four items of “subjective norm”
ranged from 4.77 to 5.53 with a reliability alpha value of 0.86. The four indicators of
“perceived behavior control” showed a mean value ranging from 4.48 to 5.88 with a
reliability alpha value of 0.72. Lastly, the four measures of “behavior intention”
showed a mean value ranging from 4.24 to 5.87 with a reliability alpha value of 0.81.
The Cronbach’s alphas for all constructs were robust, ranging from 0.72 to 0.91,
above the generally agreed upon lower limit of 0.60 (Kline, 1994). These results
demonstrate that the scale is appropriate for further analysis.

125
Table 32: Descriptive Statistics for the Measurement Items of Latent Constructs
Reliability Mean SDAttitude 0.91AT1: For me visiting Phuket was unenjoyable (1)/enjoyable (7) 6.04 1.08AT2: For me visiting Phuket was boring (1)/fun (7) 5.59 1.60AT3: For me visiting Phuket was unpleasant (1)/pleasant (7) 5.52 1.61AT4: For me visiting Phuket was harmful (1)/beneficial (7) 5.31 1.59AT5: For me visiting Phuket was unfavorable (1)/favorable (7) 5.54 1.55
Subjective norm 0.86SN1: Most people I know choose Phuket as a travel destination. 4.77 1.78SN2: Members of my family think it is a good idea to choose
Phuket as a travel destination.5.22 1.55
SN3: Members of my family approve of my visiting Phuket. 5.50 1.44SN4: Most of my friends and acquaintances think that choosing
Phuket as a travel destination is a good idea.5.53 1.39
Perceived behavioral control 0.72PBC1: If I want, I could easily visit Phuket from now on (after
crisis recovery).5.74 1.15
PBC2: It is mostly up to me whether or not I select Phuket asmy travel destination (after crisis recovery).
5.88 1.10
PBC3: Visiting Phuket is totally under my control even in caseof crisis (Tsunami, Bird Flu, SARS-Severe Acute RespiratorySyndrome, and terrorist in Southern Thailand).
5.67 1.23
PBC4: A recovery campaign (reduced fares and specialpackages) factored in selecting Phuket as my travel destination.
4.48 1.85
Behavior intention 0.81BI1: I intend to select Phuket as my travel destination in the
future.5.70 1.33
BI2: I would be willing to pay a higher rate to visit Phuket. 4.24 1.60BI3: I will recommend Phuket to others. 5.87 1.16BI4: I will revisit Phuket. 5.78 1.36
Table 33 shows that attitude, subjective norm, and perceived behavior were all
significantly correlated to behavior intention.
Table 33: Correlation Matrix
Variables (1) (2) (3) (4)(1) Attitude -(2) Subjective norm .13** -(3) Perceived behavioral control .22** .10* -(4) Behavior intention .33** .27** .45** -
** p < .01. * p < .05.
126
Measurement Model
Confirmatory factor analysis (CFA) was used to assess the adequacy of the
measurement model. Overall model fit shows the degree to which the specified
indicators represent the hypothesized constructs. The following are the overall model
fit measures. 1) Chi-square (χ2) test and absolute fit measures include the goodness-
of-fit (GFI) index. These indices directly assess how well an a priori model
reproduces the sample data. 2) Incremental fit measures include the Comparative Fit
Index (CFI) and the Normed Fit Index (NFI). These indices measure the proportionate
improvement in fit by comparing a target model with a more restricted, nested
baseline model. Finally, 3) parsimonious fit measures include the root mean square
error of approximation (RMSEA). The parsimonious indices are non-independent of
both absolute fit measures and incremental fit measures because some of the absolute
fit and incremental fit indices have already adjusted their formulas for the degrees of
freedom.
To assess the adequacy of the measurement model, a confirmatory factor
analysis was performed. The fit between the structural model and the data was
evaluated by the goodness of fit indices, including goodness of fit (GFI) and root
mean square error of approximation (RMSEA), the comparative fit index (CFI), and
the normed fit index (NFI).
The various fit indices of the measurement model (χ2 = 131.79, df = 64, p <
.001; GFI = 0.97; RMSEA = 0.054; CFI = 0.99; NFI = 0.98) implied that the model
provided a good fit to the data (Hu & Bentler, 1999).
Because the proposed measurement model achieved an acceptable fit, each of
the constructs was evaluated by 1) assessing the convergent validity of the constructs
by examining the statistical significance of the indicator loading and 2) assessing the

127
reliability coefficients of the study’s constructs by examining the composite construct
reliability (CCR). Construct validity was evaluated by examining the statistical
significance of each estimated loading and the CCR (Anderson & Gerbing, 1988).
As shown in Table 34, factor loadings on latent constructs provided evidence
of convergent validity, which demonstrates satisfactory item convergence on the
intended constructs. All indicators loaded significantly on their specified construct.
CCR was also computed for the latent constructs. All four constructs surpassed the
threshold value of 0.70. Taken together, these results indicate that the proposed
measurement model is appropriate for further analysis.
Table 34: Results of Confirmatory Factor Analysis
StandardizedLoadings
t-value
CCR b
Attitude .93AT1a: For me visiting Phuket was unenjoyable (1)/enjoyable (7) - -AT2: For me visiting Phuket was boring (1)/fun (7) .81 18.19AT3: For me visiting Phuket was unpleasant (1)/pleasant (7) .91 20.29AT4: For me visiting Phuket was harmful (1)/beneficial (7) .85 18.95AT5: For me visiting Phuket was unfavorable (1)/favorable (7) .90 20.12
Subjective norm .77SN1: Most people I know choose Phuket as a travel destination. .51 8.78SN2: Members of my family think it is a good idea to choose
Phuket as a travel destination..75 12.58
SN3: Members of my family approve of my visiting Phuket. .79 13.09SN4: Most of my friends and acquaintances think that choosing
Phuket as a travel destination is a good idea..77 13.21
Perceived behavioral control .70PBC1: If I want, I could easily visit Phuket from now on (after
crisis recovery)..86 17.07
PBC2: It is mostly up to me whether or not I select Phuket as mytravel destination (after crisis recovery).
.59 12.50
PBC3: Visiting Phuket is totally under my control even in case ofcrisis (Tsunami, Bird Flu, SARS-Severe Acute RespiratorySyndrome, and terrorist in Southern Thailand).
.51 10.17
PBC4 a: A recovery campaign (reduced fares and specialpackages) factored in selecting Phuket as my travel destination.
- -
Behavior intention .77BI1: I intend to select Phuket as my travel destination in the
future..70 15.57
BI2 a: I would be willing to pay a higher rate to visit Phuket. - -BI3: I will recommend Phuket to others. .77 18.00BI4: I will revisit Phuket. .77 17.59
Note: χ² = 131.79, d.f. = 64 (p < .001), GFI=.97, RMSEA=.054, CFI=.99, NFI=.98.a. The item was deleted after reliability test.b. CCR: Composite construct reliability.
128
Structural Model
Since the proposed measurement relationships were consistent with the data,
the structural model was evaluated. An examination of the structural model involves
significance tests for the estimated coefficients (paths), which provide the basis for
accepting or rejecting the proposed relationships between latent constructs. Table 35
shows the results of the model estimation with parameter estimates of the
hypothesized paths, standard path coefficient, t-values, and goodness of fit indices for
the model.
Structural equation modeling revealed a good level of fit (χ2 = 155.61, df = 75,
p < .001; GFI = .96; RMSEA = 0.049; CFI = 0.99; NFI = 0.97). An examination of
the standardized path coefficients among variables showed that all the paths have
statistically significant effects on behavior intentions [attitude (γ11 = 0.17; p <0.001),
subjective norm (γ12 = 0.23; p <0.001), perceived behavior control (γ13 = 0.21; p
<0.001), and past behavior (γ14 = 0.10; p <0.05)]. The significant, positive signs of all
structural paths also supported all four hypotheses (H1, H2, H3, and H4). These
findings indicate that a positive attitude toward destination, a subjective norm about a
popular destination, tourists’ perceived behavioral control, and past behavior all
positively affect tourist behavior intention. The full structural model shown in Figure
5 was derived from the hypotheses since the proposed measurement relationships
were consistent with the data.

129
Table 35: The Results of Hypothesized Testsa
Hypothesized relationship Proposed modelStandardized path
coefficient(t-value)
Results
H1: Attitude→ Behavior intention (γ11) .17 (3.44)*** SupportedH2: Subjective norm→ Behavior intention (γ12) .23 (4.94)*** SupportedH3: Perceived behavioral control→ Behavior intention(γ13)
.21 (4.61)*** Supported
H4: Past behavior→ Behavior intention (γ14) .10 (2.53)*** SupportedNote: χ² = 155.61, d.f. = 75, p < .001, GFI=.96, RMSEA=.049, CFI=.99, NFI=.97. a R2 (Behavior intention) = .48.*** p < .001. ** p < .01. * p < .05.

130
WhereAT1…AT5 =Observed measure associated with an exogenous ξ1- ξ4 = Exogenous latent variable; η1= Endogenous latent variable
latent variable (Attitude)SN1…SN4 =Observed measure associated with an exogenous latent variable
(Subjective Norm)PC1…PC4 =Observed measure associated with an exogenous latent variable
(Perceived Behavior)BT1…BT4 =Observed measure associated with an endogenous latent variable
(Tourist Behavior Intention)
Attitude(ξ1)
SubjectiveNorm (ξ2)
Perceived BehavioralControl (ξ3)
AT2AT3 AT4
AT5
SN2 SN3
SN4
PC1
PC2
PC3
TouristBehavioral
Intention (η1)
BT1
SN1
BT3
BT4
Past Behavior(ξ5)
0.17
0.23
0.21
0.10
0.81
0.91 0.85
0.90
0.51
0.75 0.79
0.77
0.86
0.59
0.51
0.70
0.77
0.77
Figure 5: Final Model of the Destination Choice Intention after Crisis

131
Moderation Tests
A moderation test was introduced to account for situations in which the
relationship between the antecedent and the consequent variable is presumed to depend
on some third variable. That is, the presence of a third variable (the moderating variable)
modifies the original relationship between the independent and dependent variables.
The significant causal relationship between subjective norm and intention has
been successfully supported in empirical studies. In the review of 137 TPB studies,
Armitage and Conner (2001) found that the average correlation of subjective norm and
intention is 0.34. Similarly, in the review of 87 TRA studies, Sheppard, Hartwick, and
Warshaw (1988) found that the average correlation of subjective norm and intention is
0.62.
This study considered in detail the specific analysis procedures for appropriately
measuring and testing a moderational hypothesis (H2-1). Within this framework,
moderation implied that the causal relation between subjective norm and intention
changes as a function of the tourist’s country of origin: Asian or Western countries.
The sample was split by the nationality of the respondents to form two subgroups
that represent Westerners and Asians, 320 and 251, respectively. To assess how the
hypothesized relationship (H2-1) varies according to country of origin, two subgroup
models were tested and compared: the baseline model and the constrained model. The
baseline model is based on the assumption that all estimated hypothesized structural paths
are allowed to vary across Western and Asian subgroups. On the other hand, the
constrained model assumes that only the hypothesized structural paths are constrained to
be equal across the two subgroups (Joreskog & Sorbom, 1993). Because the two models

132
are nested, the resulting one degree of freedom χ2 difference test provides a statistical test
for the moderating effect of country of origin. A significant chi-square difference
suggests that the equality constraints are not consistent with the data, and thus that a
moderating effect exists (Joreskog & Sorbom, 1993). The results show that the effect of
subjective norms and behavioral intention differs across the two subgroups (∆χ2= 3.79, df
= 1, p < .10). However, the relative importance is not consistent with the expected
direction across the subgroups. Interestingly, Westerners (β12 = .26, p < .001) displayed a
stronger positive relationship between subjective norms and behavioral intention than did
Asians, who demonstrated no statistically significant difference (β12 = .06, n.s.), thus do
not support H2-1 (see Table 36).
Table 36: Structural Parameter Estimates for Two-Group Comparison
Parameter Western(n = 320)
Asian(n = 251)
Estimate t-value Estimate t-value
Subjective norm → Behavior intention Β12 .26
3.39***
.06 1.19
n.s.
Free model: χ2 (151) = 543.11 (p < .001) − Constrained model: χ2 (152) = 546.90 (p < .001)∆ χ2 (1) = 3.79 (p < .10)
** p < .01; *** p < .001; n.s. = non significant

133
CHAPTER V
CONCLUSIONS, IMPLICATIONS, AND RECOMMENDATIONS
This chapter presents the summary, discussion of the findings, and
recommendations. Once the summary, discussion, and theoretical implications of the
hypotheses tested are reported, the practical implications and recommendations are
discussed. Finally, the limitations of the study and suggestions for future research are
presented.
The main purpose of this study was to compare tourists’ perceptions of
destination attributes before and after the Tsunami disaster occurred, to empirically test
the applicability to the tourism context of the extended theory of planned behavior (TPB)
model, and to identify the underlying dimensions of motivation for choosing Phuket as a
travel destination recovering from a major natural catastrophe. The study also examined
travel characteristics and demographic backgrounds. The major findings reported in
Chapter 4 are summarized in the context of the research objectives stated at the outset.

134
Perceived Image Differences Before and After the Tsunami
The descriptive statistics of attributes that are directly related to attracting tourists
to visit Phuket have been reported. The superiority of natural beauty to manmade
environments (such as shopping facilities, outdoor activities, festivals, night
entertainment, and golf courses) was found both before and after the Tsunami; however,
the findings showed that after the Tsunami, tourists paid more attention to “safety and
security” and “disaster protection and warning system” than before the Tsunami.
Underlying Dimensions of Perceived Image of Phuket Before and After the Tsunami
In this study, a set of attributes was generated from a review of the literature.
Exploratory factor analysis verified the dimensions of attributes perceived as important
by tourists visiting Phuket before and after the Tsunami. Before the Tsunami, the final
factor analysis generated five factors consisting of 19 items that accounted for 64.38% of
the total variance. The five factor groupings were “Accessibility and Price,”
“Entertainment and Relaxation,” “Accommodation, Beaches, and Islands,” “Outdoor
Activities and Historic Attractions,” and “Safety and Security.” Another exploratory
factor analysis was performed to identify the dimensions of attributes perceived as
important by tourists visiting Phuket after the Tsunami. The five factors represented
57.02% of the total variance. These five factors were “Outdoor Activities and
Attractions,” “Accessibility and Infrastructure,” “Safety and Security,” “Entertainment
and Relaxation,” and “Price and Value.”

135
Implications
The salient attribute that first comes to the minds of foreign tourists is still
beautiful scenery (beaches and seas), which restrains tourist spending in value-added
areas and limits a significant multiplier effect on local businesses. It is important for the
Tourism Authority of Thailand (TAT) to take the necessary steps to reposition Phuket’s
image as a popular destination for night entertainment, shopping, and festivals and
events. Understanding the change in tourists’ images of Phuket as a travel destination
after a natural disaster will aid destination marketers in implementing effective
promotional strategies that will eventually lead to a dramatic increase in tourist
expenditures and thus contribute to the local economy through the Inflow of foreign
currency.
After the Tsunami, tourists were concerned more about “safety and security” and
“disaster protection and warning system” than they were before the Tsunami. These
results suggest that operators and managers of TAT give their best efforts to improve the
safety and security system and the disaster protection and warning system, both of which
will enhance Phuket’s image as a safe destination. In order to bring tourists back to
Phuket following a catastrophic disaster like the Tsunami, destination marketers should
be aware of the changes in tourist destination selection attributes.
One of the challenges of tourism disaster management in Phuket is to ensure that
the destination has substantially enhanced the attributes that concern tourists’ most–safety
and security issues, as well as disaster protection and warning system, thus fully restoring
tourism business activities to the pre-disaster level. Without significant improvement in a
disaster protection and warning system, many tourists may not return to Phuket.

136
Achieving the goal of returning Phuket to its former level of success is a very difficult
task, regardless of broad marketing campaigns that highlight the natural and scenic
beauty and other attractions and entertainments. After a crisis, all stakeholders, at both
local and national levels, should commit to adopting up-to-date technology to establish a
Tsunami warning system and to develop disaster risk mitigation strategies by improving
the physical structure of existing or new tourist facilities within a direct impact area of
another Tsunami.
Travel Motivations
“Motivation to travel” refers to a set of needs that cause a person to participate in
a tourist activity (Pizam, Neumann, & Reichel, 1979). Travel motivation should be
investigated because it helps identify the attributes that should be promoted to match the
motivations of potential tourists. In this study, a set of thirty-three motivation items was
initially developed based on the aforementioned literature review. Some attributes were
transformed into more concrete term that suited the Phuket situation. Responses to these
items were factor-analyzed using the principle component method and the varimax
rotation procedure in order to delineate underlying dimensions of motivation. Six factor
groupings emerged: “Cultural, Event and Place Exploration,” “Socialization,”
“Relaxation,” “Excitement,” “Leisure and Romance,” and “Escape.” In general, the
factor structure that was extracted was consistent with previous motivation studies.
Travel motivation differences by number of visits were investigated. The results
revealed that repeat travelers were less motivated than first-time travelers to explore new
places, and do exciting things, whereas repeat travelers were more motivated than first-

137
time travelers by “Socialization,” which included visiting friends and relatives, doing
something with the family, spending time with someone special, having time for
romance, sharing a familiar place with others, and relax. Most of the findings indicate
that fear and anxiety of an unknown place make tourists revisit a proven destination with
which they were satisfied. Returning to a previous destination avoids the risk that an
unfamiliar alternative may not be as satisfactory as a previously experienced destination
(Crompton, 1979; Engel, Kollat, & Blackwell, 1973). Tourists who return to a previously
visited destination may be motivated primarily by socio-psychological, rather than
cultural, motives (Crompton, 1979).
Implications
Travel motivations may be used as a basis for market segmentation, a technique
that enables marketers to identify groups of tourists with similar needs or characteristics.
Such a strategy helps marketers evaluate new product opportunities and improve
advertising strategies by better understanding tourists (Swason & Horridge, 2005).
Therefore, TAT and marketers at tourist destinations may be able to closely match
available tourism products with the needs of diverse tourists and their differentiated travel
motivations. For example, as the number of family vacations has increased, the travel and
tourism industry has developed products and services such as family suites, grand travel
activities, and vacation packages for family reunions and weddings to target this
particular segment (Blum, 1996; Feder, 1996; Wong, Ap, & Li, 2001). National hotel
chains currently offer extra-large rooms equipped with bedding options (such as day beds
and pullout sofas) to accommodate family vacationers (Gardyn, 2001). Marketers must
comprehend the market trend and develop tourism products and services in response.

138
Destination promotions targeted at the family vacation or social interaction motive may
emphasize programs that enhance relationships. Such a program might include long
drives in an automobile around Phuket Island or to nearby provinces such as Pangna or
Krabi. During such drives, family members are forced to interact with one another.
These trips are people-oriented rather than place-oriented and may be useful for
promoting family pleasure vacations. However, if a destination seeks to cater to the
relaxation motive, it might stress familiarity and the availability of facilities to enjoy
preferred activities such as spas and special food tour packages rather than to promote
different environments or new activities. Rather than attempting to be all things to all
tourists, the marketer may elect to meet the special needs of selected tourists based on
their travel motivations.
The study also found a difference between first-time travelers and repeat travelers.
First-time travelers and repeat travelers may have different demands and requirements
regarding tourism products and services offered by a destination. Marketing strategies to
entice new travelers to a destination may be inappropriate for encouraging repeat
travelers to return. Therefore, destinations should develop multiple promotional
campaigns and tourism packages that appeal effectively to specific segments of potential
tourists.

139
Destination Choice Intention Model after Crisis
Although a number of empirical studies have shown that the theory of planned
behavior (TPB) is successful in explaining human behavior in the tourism and hospitality
areas, the theoretical and conceptual foundations for predicting the intention for choosing
a travel destination after a major disaster have not been fully examined. Hence, the
purpose of this analysis was to empirically test the applicability of the extended TPB
model in the tourism context. The hypothesized structural model was tested by the
structural equation model (SEM), which included a test of the overall model and
individual tests of the relationships among the latent constructs.
SEM was performed to examine the relationships between the criterion variable
of behavior intention and the respective predictor variables of attitude, subjective norm,
perceived behavior control, and past behavior. The significant, positive signs of all
structural paths supported all four hypotheses (H1, H2, H3, and H4). Therefore, it can be
said that selecting Phuket as a travel destination after a crisis was determined by positive
attitude toward destination, subjective norm, tourists’ perceived behavior control, and
past behavior.
Consistent with the finding of Lam & Tsu (2005), subjective norm has the largest
impact on tourist behavioral intention among the four antecedents. Overall, international
tourists’ behavioral intention to visit Phuket is strongly influenced by the opinion of
reference groups. Perceived behavioral control showed the second highest effect on
tourists’ behavioral intention to visit Phuket. This result concurs with the finding of Oh &
Hsu (2001). It is important to notice that tourists’ behavioral control over their decision to
140
visit Phuket, even in a crisis such as the bird flu or a natural disaster like the Tsunami, has
a strong influence on their revisit intention.
Implications
The destination selection model studied, which applied the TPB model, may
advance the understanding of determinants of tourist behavior intention, especially in the
context of a recovery process after a debilitating natural disaster.
A number of salient implications can be derived from the results of the study.
Positive attitude positively affects tourist intention in choosing Phuket as a travel
destination. Therefore, TAT and the Phuket government should make their best effort to
develop and maintain a positive attitude toward international tourists. They should focus
on advertising Phuket as a safe place with much more to offer visitors than just Phuket’s
natural heritage, which includes the sun, sea, sand, sky, beach, and world-renowned
diving sites. The results of this study demonstrated that subjective norm has the largest
impact on tourist behavioral intention among the four antecedents. Therefore, social
influence from referent groups is an important factor influencing travel intention. All
stakeholders at both the local and national levels should take a serious approach to ensure
tourist satisfaction. If tourists are satisfied with their travel experiences, they are more
willing to revisit destinations and to spread positive comments to friends and family
members. To achieve a high overall level of satisfaction, it is essential for all stakeholders
to be aware of delivering quality services and products, as well as monitoring the service
quality.
On the other hand, results of this study indicated that international tourists are
influenced by non-volitional factors, too. The findings showed that past behavior
141
positively affects tourist behavior intention, even if the relative magnitude of the impact
is the lowest among the antecedents. The past behavior of traveling to Phuket was
measured by the frequency of visits, too, and travelers who visited more often in the past
were more likely to revisit if they had a good experience and had good memories.
Travelers who had good experiences are more likely to encourage potential tourists to
travel to a destination through positive conversation. One way to increase the number of
frequent travelers is to provide incentives for frequent travel. TAT might wish to offer
travel packages to Phuket at a special promotional rate. During their stays at Phuket,
visitors could also take advantage of discount offers that had been extended by
participating travel, hotel, airline, and tourism operators. In addition to shopping and
dining offers, discounts could include tour programs and special interest activities such as
yachting and diving.
The results of the study also showed that perceived behavioral control had a
significant impact on tourist behavior intention. Thus, a certain number of constraints
should diminish. These constraints were related primarily to perceptions of safety and
security. In a move to restore traveler confidence and encourage the resumption of travel,
TAT should launch a natural disaster early warning system to enhance Phuket’s image as
a safe destination and conduct media briefings in overseas markets to keep all targeted
tourists well informed of the precise situation in affected areas.

142
Moderation Tests
Another theoretical contribution of this study is the test of whether the
relationship between subjective norm and tourist behavior intention varies depending on
a tourist’s country of origin (Asian vs. Western countries). Traditionally, Asian people
have intended to perform an act based on the opinions of family members (Yang &
Rosenbatt, 2000). An Asian person is expected to respond to the needs of the group,
while a Western person tends to emphasize the privacy and individual rights within the
community (Kim & Markus, 1999). Therefore, the positive influence of subjective norm
on tourist behavior intention was expected to be greater among tourists from Asian
countries than among those from Western countries. Interestingly, the findings in this
study disclosed that the positive influence of subjective norm on tourist behavior
intention was greater among tourists from Western countries than among those from
Asian countries. These unexpected findings may be attributed to the fact that most
Western tourists were independent travelers and therefore were more likely to have had a
high involvement level during their travel planning process. Many aspects of traveler
decisions are affected by level of involvement (the importance and intensity of interest in
a trip in a particular situation). The traveler’s level of involvement determines why he or
she is motivated to plan the trip. On the other hand, a majority of the Asians were
package tourists, who tend to take advantage of reasonably priced package deals and have
a low level of involvement. Tourists with a low level of involvement are less likely to
rely on reference group opinion when they make a travel destination choice. Therefore,
additional studies are needed to test the hypothesis for the two groups, Asian and Western
143
tourists. Future researchers may be able to confirm the hypothesis when groups of Asian
and Western tourists who have the same level of involvement are compared.
Implications
Due to the distinctiveness of the positive influence of subjective norm on tourist
behavior intention among tourists from Western and Asian countries, these two groups
may have different demands and requirements in selecting a destination. Therefore, it is
necessary to develop different marketing strategies in Western and in Asian countries.
Western tourists who responded were independent travelers who are more likely
to have had a high involvement level in their travel planning process. Jamrozy, Backman,
& Backman (1996) found that highly involved tourists tend to pay more attention to
searching for information and are more likely to be opinion leaders by delivering that
information to other individuals in a preferred manner. Miguel, Caplliure, & Aldas-
Manzano (2002) also found that tourists with a high level of involvement tend to show a
greater level of product knowledge by realizing the strengths and weaknesses of various
alternatives. Tourists may need to evaluate several sources of information in assessing the
situation or in understanding the current situation at the destination.
The Internet provides great opportunity for customizing destination offerings.
Therefore, destination websites should be created that allow visitors to search for
information about attractions, activities, and special events, or even to purchase airline
tickets and make hotel reservations. Such sites might offer bulletin boards with tips from
people who have traveled to the destination recently; they might also offer the
opportunity to chat with travel experts, residents of the destination, and TAT staff.

144
Because the majority of Asian travelers are package tourists, these individuals
tend to take advantage of reasonably priced package deals and may have a low level of
involvement. For package tourists, tour operators play a very important role in creating
the images of the destinations. After a crisis, tour operators analyze all possible aspects of
safety and security risk and make a decision on the destination. After this process, tour
operators can significantly influence tourist flow toward the destination. Therefore, it is
necessary to coordinate all post-crisis activities with foreign tour operators to give
accurate information. Rebuilding destination images can be accomplished with the help
of foreign tour operators. In addition, TAT should inform the media about the steps taken
at a destination to solve problems and invite journalists to the destination to show them
the real situation. In cooperation with tour operators, the private sector, and airlines
operating in Phuket, TAT should launch a series of marketing and publicity campaigns
designed to show that Phuket has fully recovered from the Tsunami.

145
Sources of Travel Information and Activities
The following section discusses research findings and theoretical and practical
implications of the data gathered on sources of travel information and activities.
Source of Travel Information
This study found that travelers used both “informative” and “persuasive”
information to select Phuket as a travel destination. Respondents indicated that the main
sources of information they had used in planning a trip to a destination were word-of-
mouth, previous trips, the Internet, and travel agents; word-of-mouth was the most
important source. These results are consistent with the findings of Mok & Armstrong
(1996), which indicated that word-of-mouth from friends and relatives is an informative
and credible source of information. Mok & Armstrong (1996) found that Taiwanese and
Hong Kong travelers considered word-of-mouth from friends and relatives as the most
important source of travel information.
A previous trip was also perceived as an important source of information. This
result is consistent with the findings of Um & Crompton (1990), indicating that previous
experience is one of the factors affecting destination awareness and traveler destination
preference. Familiarity with a destination may produce a tendency for tourists to quickly
select or reject that destination. Returning to a familiar and satisfying destination may
reduce the risk of fear or anxiety that an unknown destination may not be as satisfactory
as those previously experienced. Therefore, if tourists are satisfied with a previous
destination, they may not even look for information on other destinations for their next
destination choice (Mayo & Jarvis, 1981; Woodside & Lysonski, 1989).

146
This study found that the Internet was widely used among travelers in planning
travel destinations. In addition, travel agents were perceived as important, persuasive
sources of information, which confirms the findings of Worrall (1990) that travel agents
are considered to be an important source of information. Mok & Armstrong (1996)
indicated that travelers who join all-inclusive package tours depend on travel agencies as
their main source of information, whereas independent travelers gather information
mainly from friends and relatives. Many tourists heavily rely upon travel agencies to help
them make the final choice of a travel package (Kent, Meyer, & Reddam, 1987). Travel
agencies and tour operators have played a critical role as travel intermediaries in
satisfying the travel demand and expanding the market. They give advice on destinations
and tourist attractions, and make arrangements for transportation, hotel accommodations,
car rentals, tours, and recreation. They also give information on customs regulations,
required papers (passports, visas, and certificates of vaccination), and currency exchange
rates.
This study found that brochures, travel guidebooks, advertising, and information
at welcome centers were not major sources of travel information. This result is consistent
with the findings of Mok & Armstrong (1996), which indicated that Taiwanese and Hong
Kong tourists ranked brochures and TV/radio advertising as unimportant sources of travel
information.
Implications
It can be concluded that international tourists rely heavily on recommendations
from friends, family, and relatives and on experience from previous trips as their major
sources of travel information. This finding is consistent with the study of Bateson (1995),

147
which showed that word-of-mouth has a more significant impact on tourists’ perceptions
than do other forms of mass communication. In addition, word-of-mouth is perceived as
more credible and less biased (Lovelock, 1991), and it can reach more potential
customers than other promotional techniques because it has a multiplying effect.
Therefore, stakeholders at both the local and national levels should improve
tourism products and services in a destination to increase the quality of tourist
experiences, because satisfied tourists leaving Phuket will spread positive word-of-mouth
communications. Quality is an important factor that can make visiting a destination more
attractive (Stevens, 1992). Quality perceptions can be generated from encounters with the
service infrastructure including shopping services, recreation and attraction services, food
services, travel services, transportation services, and accommodation services (Cai &
Woods, 1993; O’Neill & McKenna, 1994; Murphy, Pritchard, & Smith, 2000). Gotlieb,
Grewal, & Brown (1994) mentioned that both the focal (service) and the contextual
(environment) dimensions of tourism products play important roles in determining
quality. For this reason, destination managers should consider the role of quality in
developing destination loyalty. Destinations that do not meet tourist quality expectations
are less likely to be revisited than those that satisfy tourists (Murphy, Pritchard, & Smith,
2000). If tourists are satisfied with their travel experiences, they are more willing to
return to a destination, as well as to spread positive comments to others. The results of
this study suggest that TAT should focus on meeting or exceeding tourist satisfaction
levels. However, many elements are involved in the formation of tourist satisfaction:
local residents, providers of accommodations and transportation, tourism information

148
offices, natural resources, etc. Therefore, in order to achieve a high overall level of
satisfaction, all stakeholders should work closely to minimize dissatisfied tourists.
As mentioned earlier, this study found the sources of information tourists used
most in planning travel destinations were informative and persuasive information to form
the organic and induced image of destination. The organic images were derived primarily
from word-of-mouth and travel agencies, while the induced images were derived
primarily from travel brochures and the Internet. The Internet is, therefore, gaining in
importance as an information distribution channel for the tourism and hospitality
industry. The Internet is an economical and efficient marketing channel for promoting a
destination, so tourism marketers need to do more promotion on the Internet. The
potential benefits of an online business are also important for the travel industry, given
that current trends have demonstrated the importance and implications of an online
business in the tourism industry (Wang & Fesenmaire, 2004). An increasing number of
travelers make extensive use of the Internet for information (Jang, 2004).
Due to flourishing tourism resources, such as beautiful sandy beaches and crystal
clear and calm ocean waters with colorful coral reefs, Phuket became one of the well-
known “sun, sand, and sea” tourist destinations in the Far East. Phuket’s magnificent
natural resources are the main attractions and reasons for tourists to visit. However, “sun,
sand, and sea” tourist destinations have also been developed in nearby regions such as
Bali in Indonesia, New Zealand, and Australia. Therefore, it is important for TAT to take
the necessary steps to promote Phuket as a destination with a variety of shops, festivals
and events, and night entertainment to differentiate its destination image from
149
competitive destinations. Doing so will result in more value-added tourism, which will
have a significant multiplier effect on local businesses.
Limitations and Future Research Avenues
Some study limitations need to be acknowledged. First, a cross-sectional survey
sampling from the target population during a limited time of the year was used to
determine perceptual differences in attributes affecting tourist travel behavior intention
before and after the Tsunami. The respondents may have had difficulty in recollecting
previous experiences, resulting in problems with accuracy. In addition, this study was
conducted in the peak season, so the results were limited to travelers who travel during
this period of time. Tourists who travel in different seasons may have different points of
view toward destinations. To overcome this limitation, a similar survey in a different
season could be administered in future research to gain a more general understanding of
tourist behavior changes across time. The two sets of survey findings could be compared
to identify similarities and differences across seasons.
Another possible limitation is that this study collected the data at Phuket
International Airport. Administering the survey at this location may have introduced bias
in the sample because only international tourists who were visiting Phuket were included
and those who visited Thailand via other international airports such as Bangkok and
Changmai were excluded. It is also possible that only tourists with favorable feelings
toward Phuket were visiting, which would result in sample bias. To overcome these
limitations, future studies may include a more representative sample by conducting data
collection in other airports, such as Bangkok International Airport and Changmai

150
International Airport. Therefore, the results of this study should be interpreted with
caution.
This study was not longitudinal; therefore the results should be interpreted with
some caution. Ideally, the research would have been started before the Tsunami and
followed both tourists who returned to Phuket after the Tsunami and tourists who did not.
In reality, only tourists who returned to Phuket after the Tsunami and during the survey
period were able to participate. Individuals, who chose not to return to Phuket, or at least
not during the survey period, may have formed different opinions regarding the
destination following the Tsunami.
The use of a self-report measure of tourist behavior intention may be limited in
terms of reliability, another limitation to consider as self-evaluation may have inflated
some parts of the hypotheses tested. The respondents may have had different points of
view, and it is possible that tourists with favorable feelings toward their destination may
have been over reported, whereas those with unfavorable feelings toward their destination
may have been under reported. In addition, respondents had to interpret questions with
regard to their own personal experience and understanding. Another consideration is that
behavior intention may change after it has been measured (Young & Kent, 1985). To
overcome this limitation, actual behavior data should be utilized in future research and
longitudinal research design should be adopted to collect actual behavior data. However,
many TPB studies have found a strong and significant causal link between behavior
intention and actual behavior (Ajen, 2002). Therefore, the choice of intention over actual
behavior as a dependent variable does not seem to pose a serious problem for analyzing
the results of this study.

151
The survey instrument used in this study was originally designed in English
because English is the language most commonly understood among international tourists.
Conducting surveys with different languages could cause back-translation biases. To
eliminate the potential back-translations an error, this study was designed only in English.
However, for practical reasons, some international tourists who are not familiar with the
English language chose not to complete the survey, which could have resulted in
response biases. Future researchers should provide the survey instrument in other
languages such as Japanese, Mandarin, Korean, Swedish, German, and French to
overcome this limitation. Furthermore, the questionnaire should be back-translated in
other languages such as Japanese, Mandarin, Korean, Swedish, German, and French to
overcome this limitation. Care must be taken, however, to insure that the meaning and
content of the questionnaire is consistent among all languages in which it is presented.
Lastly, “attitude,” “subjective norm,” “perceived behavior control,” and “past
behavior” were studied as antecedents to tourist behavior intention in this study.
Additional antecedents of tourist behavior intention should be investigated in future
research.

152
REFERENCES
Aarts, I. (1998). Predicting behavior from actions in the past. Journal of Applied Social
Psychology, 28(15), 1355-1374.
Ahmed, Z.U. (1991). The influence of the components of a state's tourist image on
product positioning strategy. Tourism Management, 12, 331–340.
Ahmed, Z.U. (1996). The need for the identification of the constituents of a destination's
tourist image: A promotional segmentation perspective. Revue du Tourisme, 15(2),
44-57.
Alhemoud, A.M., & Armstrong, E.G (1996). Image of tourism attractions in Kuwait.
Journal of Travel Research, 34 (4), 76-80.
Ajzen, I. (1985). From intentions to actions: A theory of planned behavior. In J. Kuhl &
J. Beskmann (Eds.), Action control: From cognition to behavior. New York:
Springer, 11-39.
Ajzen, I. (2002). Perceived behavioral control, self-efficacy, locus of control, and the
theory of planned behavior. Journal of Applied Social Psychology, 32(4), 665-683.
Ajzen, I. (1991). The theory of planned behavior. Organizational Behavior and Human
Decision Process, 50(2), 179–211.
Ajzen, I. (2001). Nature and operation of attitudes. Annual Review of Psychology, 52,
27-58.
153
Ajzen, I., & Driver, B. E. (1992). Applied of the theory of planned behavior to leisure
choice. Journal of Leisure Research, 24(3), 207–224.
Ajzen, I., & Driver, B. E. (1992). Application of the theory of planned behavior to leisure
choice. Journal of Leisure Research, 13(8), 185-204.
Ajzen, I., & Driver, B. L. (1992). Contingent value measurement: On the nature and
meaning of willingness to pay. Journal of Consumer Psychology, 1, 297-316.
Ajzen, I., & Driver, B. (1991). Prediction of leisure participation from behavioral,
normative, and control beliefs: An application of the theory of planned behavior.
Leisure Sciences, 13(3), 185-204.
Ajzen, I., & Fishbein, M. (1980). Understanding attitudes and predicting social behavior.
Englewood Cliffs, NJ: Prentice-Hall.
Ajzen, I., & Fishbein, M. (1974). Factors influencing intentions and the intention-
behavior relation. Human Relations, 27, 1-15.
Ajzen, I., & Fishbein, M. (1973). Attitudes and normative beliefs as factors influencing
behavioral intentions. Journal of Personality and Social Psychology, 27, 41-57.
Ajzen, I., & Fishbein, M. (1972). Attitudes and normative beliefs as factors influencing
behavioral intentions. Journal of Personality and Social Psychology, 21, 1-9.
Ajzen, I., & Fishbein, M. (1970). The prediction of behavior from attitudinal and
normative variables. Journal of Experimental Social Psychology, 6, 466-487.
Ajzen, I., & Fishbein, M. (1969). The prediction of behavioral intentions in a choice
situation. Journal of Experimental Social Psychology, 5, 400-416.
154
Ajzen, I., & Madden, T. J. (1986). Prediction of goal-directed behavior: Attitudes,
intentions, and perceived behavioral control. Journal of Experimental and Social
Psychology, 22, 453-474.
Ajzen, I., Timko, C., & White, J. B. (1982). Self-monitoring and the attitude-behavior
relation. Journal of Personality and Social Psychology, 42, 426-435.
Alderighi, M., & Cento, A. (2004). Europe airlines conduct after September 11. Journal
of Air Transport Management, 10, 97-107.
Anderson. J., & Gerbing, D. (1982). Some methods of respecifying measurement models
to obtain unidimensional construct measurement. Journal of Marketing Research,
19, 453-460.
Anderson, J. C., & Gerbing, D. W. (1988). Structural modeling in practice: A review and
recommended two-step approach. Psychological Bulletin, 103(3), 411-423.
Arbel, A., & Bargur J. (1980). A planning model for crisis management in the tourism
industry. European Journal of Operational Research, 52, 77-85.
Arnold, W. (1980). Crisis Communication. Gorsuch Scarisbrook: Dubuque, Iowa.
Armitage, C. J., & Conner, M. (1999). Distinguishing perceptions of control from self-
efficacy: Predicting consumption of a low-fat diet using the theory of planned
behavior. Journal of Applied Social Psychology, 29, 72-90.
Armitage, C. J., & Conner, M. (2001). Efficacy of the theory of planned behavior: A
meta-analysis review. British Journal of Social Science, 40(4), 471-499.
Ashworth, G., & Goodall, B. (1988). Tourist image: marketing considerations. In:
Goodall, B. & Ashworth, G. (Eds.). Marketing in the tourism industry: The
promotion of destination regions, 213-238. London: Routhledge.
155
Assael, H. (1987). Consumer Behavior and Marketing Action (3rd ed.) Boston, MA: Kent
Publishing.
Assael, H. (1998). Consumer Behavior and Marketing Action (6th Ed.) Ohio: South
Western College Publishing.
Baloglu, S. (1997). The relationship between destination images and sociodemographic
and trip characteristics of international travelers’. Journal of Vacation Marketing, 3,
221-233.
Baloglu, S., & Brinberg, D (1997). Affective images of tourism destinations. Journal of
Travel Research, 35(4), 11-15.
Baloglu, S., & McCleary, K.W. (1999). A Model of destination image formation. Annals
of Tourism Research, 26, 808-89.
Baloglu, S., & McCleary, K.W (1999). US international pleasure travelers’ images of
four Mediterranean destinations: a comparison of visitors and nonvisitors. Journal
of Travel Research, 38(2), 44-52.
Bar-On, R. (1996). Measuring the effects on tourism of violence and of promotion
following violent acts. In A.Pizam and Y. Mansfield, (Eds.). Tourism, crime and
international security issues. New York: Wiley.
Bateson, J. (1995). Managing services marketing: Text and readings. Third Edition,
Orlando: Dryden.
Beale, D. A., & Manstead, A. S. R. (1991). Predicting mothers’ intentions to limit
frequency of infants’ sugar intake: Testing the theory of planned behavior. Journal
of Applied Social Psychology, 21, 40-31.

156
Beaty, S.E., Kahle, L.R., & Homer, P. (1988). The involvement commitment model:
Theory and implications. Journal of Business, 16(March), 149-167.
Beck, L., & Ajzen, I. (1991). Predicting dishonest actions using the theory of planned
behavior. Journal of Research in Personality, 25, 285-301.
Becker, Cherylynn (2000). Service recovery strategies: the impact of cultural differences.
Journal of Hospitality & Tourism Research, 24(4), 526-538.
Beerli, A., & martin, J.D. (2004). Factors influencing destination image. Annuals of
Tourism Research, 31(3), 657-681.
Bello, D.C., & M.J. Etzel (1985). The role of novelty in the pleasure travel experience.
Journal of Travel Research, 24(1), 20-26.
Bentler, P., & Speckart, G. (1979). Models of attitude–behavior relations. Psychological
Review, 86 (4), 452–464.
Bernstein, I.H (1988). Applied Multivariate Analysis. Springer Verlag, New York, NY
Bierbrauer, G., Meyer, H., & Wolfradt, U. (1994). Measurement of normative and
evaluative aspects in individualistic and collectivistic orientations: The cultural
orientation scale (COS). In U. Kim, H. C. Triandis, C. Kagitcibasi, S. C. Choi, & G.
Yoon (Eds.), Individualism and collectivism: Theory, method, and applications (pp.
189-199). Thousand Oaks, CA: Sage.
Bigne, J.E., Sanchez, M.I., & Sanchez, J. (2001). Tourism image, evaluation variables
and after-purchase behavior: inter-relationship. Tourism Management, 22(6), 607-
616.
Blake, Adam, & Sinclair, M. Thea. (2003). Tourism crisis management. Annals of
Tourism Research, 30(4), 813-832.
157
Bland, M. (1998). Communicating Out of a Crisis. Macmillan Business: London.
Blessum, K.A., Lord, C.G., & Sia, T.L. (1998). Cognitive load and positive mood reduce
typicality effects in attitude behavior consistency. Personality and Social
Psychology Bulletin, 24, 496-504.
Blum, E. (1996, March). Catering to families. Travel Weekly, 126, 9-10.
Boldero, J., Sanitioso, R., & Brain, B. (1999). Gay Asian Australians’ safer-sex behavior
and behavioral skills: The predictive utility of the theory of planned behavior and
cultural factors. Journal of Applied Social Psychology, 29, 2143-63.
Booth, S. (1993). Crisis Management Strategy, Competition and Changes in Modern
Enterprises. Routledge: London.
Bramwell, B., & Rawding, L. (1996). Tourism marketing images of industrial cities.
Annuals of Tourism Research, 13, 201-221.
Broderick, A.J., & Muller, R. D. (1999). A theoretical and empirical exegesis of the
consumer involvement construct: The psychology of the food shopper. Journal of
Marketing Theory and Practice, 7(4), 97-108.
Buckley, R.A. (1994). Framework for ecotourism. Annual of Tourism Research, 21(3),
661-669.
Burling, W.K., & Hyle, A. (1997). Disaster preparedness planning policy and leadership
issues. Disaster Prevention and Management, 64: 234-244.
Burns, A. C., & Bush, R.F. (1995). Marketing research, New Jerse: Prentice Hall.
Burnett, J. (1998). A strategic approach to managing crises. Public Relations Review,
24(4), 475–488.
158
Buttle, F., & Bok, B. (1996). Hotel marketing strategy and the theory of reasoned action.
International Journal of Contemporary Hospitality Management, 8(3), 5-10.
Cai, L. A., & Woods, R. H. (1993). China’s tourism-service failure. Cornell Hotel and
Restaurant administration Quarterly, 43(4), 30-39.
Calantone, R.J., Di Benedetto, C.A., Hakam, A., & Bojanic, D.C. (19e89). Multiple
multinational tourism positioning using correspondence analysis. Journal of Travel
Research, 28(2), 25-32.
Carmichael, B. (1992). Using conjoint modeling to measure tourist image and analyze ski
resort choice. Journal of the Geological Society of London, 149, 487-490.
Canestrelli, E., & Costa, P. (1991). Tourist carrying capacity: A fuzzy approach. Annuals
of Tourism Research, 18(2), 295-335.
Carmichael, B. (1992). Using conjoint modelling to measure tourist image and analyse
ski resort choice, In Johnson, P. and Thomas, B., (Eds.) Choice and demand in
tourism (pp. 93–106). London: Mansell.
Cassedy, K. (1991). Crisis management Planning in The Travel and Tourism Industry: a
Study of Three Destinations and a Crisis Planning Manual. Pacific Asia Travel
Association (PATA): San Francisco.
Cavlek, N. (2002). Tour operators and destination safety. Annals of Tourism Research,
29(2), 478-496.
Celsi, R. L. & Olson, J. C. (1988). The role of involvement in attention and
comprehension process. Journal of Consumer Research, 15 (September), 210-224.
Chan, D. K. & Cheung, S. F. (1998). An examination of premarital sexual behavior
among college students in Hong Kong. Psychology and Health, 13(5), 805–821.
159
Chang, M. K. (1998). Predicting unethical behavior: A comparison of the theory of
reasoned action and the theory of planned behavior. Journal of Business Ethics, 17,
1825-1834.
Chen, J. S. (2001). A case study of Korean outbound travelers’ destination images by
using correspondence analysis. Tourism Management, 22(4), 345-350.
Chen, P., & Kerstetter, D.L. (1999). International students’ image of rural Pennsylvania
as a travel destination. Journal of Travel Research, 37 (3), 256-66.
Chi, C. (2005). A study on theoretical development of destination loyalty model.
Oklahoma State University (dissertation).
Chien, G.C.L., & Law, R. (2003). The impact of the Severe Acute Respiratory Syndrome
on hotels: a case study of Hong Kong. International Journal of Hospitality
Management, 22.327-332.
Chiou, J. S. (1998). The effects of attitude, subjective norm and perceived control on
consumers’ purchase intentions: The moderating effects of product knowledge and
attention to social comparison information. Proceedings of National Science
Council of ROC(C), 9(2), 298–308.
Chon, K. (1990). The role of destination image in tourism: A review and discussion.
Tourist Review, 45(2), 2-9.
Chon, K.S., Weaver, P.A., & Kim C.Y. (1991). Marketing your community: Image
analysis in Norfolk. Cornell Hotel and Restaurant Administration Quarterly, 31-37.
Chon, K.S. (1991). Tourism destination image modification process: Marketing
implications. Tourism Management, 12(1), 68-72.
160
Chon, K.S. (1992). The role of destination image in tourism: An extension. Revue du
Tourisme, 1, 2-8.
Choy, D. J. L. (1992). Life cycle models for pacific island destinations. Journal of Travel
Research, 30, 26-31.
Cohen, E. (1988). Authenticity and accommodation in tourism. Annuals of tourism
Research, 15(2), 371-386.
Conner, M., & Abraham, C. (2001). Conscientiousness and the theory of planned
behavior: Towards a more complete model of the antecedents of intentions and
behavior. Personality and Social Psychology Bulletin, 27(11), 1547–1561.
Conner, M., Black, K., & Stratton, P. (1998). Understanding drug compliance in a
psychiatric population: An application of the theory of planned behavior. Psychol
Health Med, 3, 337-44.
Conner, M., & McMillan, B. (1999). Interaction effects in the theory of planned
behavior: studying cannabis use. British Journal of Social Psychology, 38, 195-222.
Coombes, W.T. (1995). The development of guidelines for the selection of the
appropriate crisis response strategies. Management Communication Quaterly, 4,
447-476.
Cooper, C., Fletcher, J., Gilbert, D., and Wanhill S. (1998). Tourism: Principles and
practice. Longman: New York.
Conner, M., Warren, R., & Close, S. (1999). Alcohol consumption and the theory of
planned behavior: An examination of the cognitive mediation of past behavior.
Journal of Applied Social Psychology, 29(8), 1676–1704.

161
Courneya, K.S., Bobick, T.M., & Schinke, R.J. (1999). Does the theory of planned
behavior mediate the relation between personality and exercise behavior: An
examination of the cognitive mediation of past behavior. Journal of Applied Social
Psychology, 29, 1676-704.
Court B.C., & R.A. Lupton. (1997). Customer Portfolio development: Modeling
destination adopters, inactives, and rejecters. Journal of Travel Research, 36(1),
35-43.
Crano W.D. (1997a). Vested interest and symbolic politics-observations and
recommendations: reply to Sears (1997). Journal of Personality and Social
Psychology, 72, 497-500.
Crano W.D. (1997b). Vested interest and symbolic politics, and attitude-behavior
consistency. Journal of Personality and Social Psychology. 72, 497-500.
Crompton, J.L. (1979). An assessment of the image of Mexico as a vacation destination
and the influence of geographical location upon the image. Journal of Travel
Research, 18 (4), 18-23.
Crompton, J.L. (1979, Oct/Dec). Motivation for pleasure vacation. Annuals of Tourism
Research, 409-424.
Crompton, J.L. (1992). Structure of vacation destination choice sets. Annuals of Tourism
Research, 19, 420-434.
Crompton, J.L., Fakeye, P.C., & Lue, C.C. (1992). Positioning: The Example of the
Lower Rio Grande Valley in the winter-long stay destination market. Journal of
Travel Research, 31(2), 20-26.
162
Crompton, J.L., & Ankomah, P.K. (1993). Choice set propositions in destination
decisions. Annuals of Tourism Research, 20, 461-476.
Dadgostar, B., & Isotalo, R.M. (1995). Content of city destination image for near-home
tourists. Journal of Hospitality and Leisure Marketing, 32, 25–34.
Dann, M. S. (1977). Anomie, ego-enhancement and tourism. Annals of Tourism
Research, 4, 184-194.
Dann, G.M.S. (1996). Tourists’ images of a destination: An alternative analysis. Journal
of Travel and Tourism Marketing, 5(1/2), 41-55.
Darling, J. (1994). Crises management in international business. Leadership and
Organization Development Journal, 15 (8), 3-8.
Deng, J., King, B., and bauer, T. (2002). Evaluating natural attractions for tourism.
Annuals of Tourism Research, 29(2), 422-438.
De Vroome, E.M.M., Stroebe, W., Sandford, T.G.M., de Witt, J.B.F., & van Griensven,
G.J.P. (2000). Safe sex in social context: Individualistic and relational determinants
of AIDS preventive behavior among gay men. Journal of Applied Social
Psychology, 30, 2322-40.
Dieke, P.U.C. (1991). Policies for tourism development in Kenya. Annual for Tourism
Research, 18(2), 269-294.
Dimanche, F., & havitz, M.E. (1994). Consumer behavior and tourism: Review and
extension of four study areas. Journal of Travel and Tourism Marketing, 3(3),
37-58.
Dimanche, F., & Lepetic, A. (1999). New Orleans tourism and crime: A case study.
Journal of Travel Research, 38 (1), 19-23.
163
Doll, J., & Ajzen, I. (1990). The effects of direct experience on the attitude-behavior
relation: Stability versus accessibility. Unpublished manuscript, Psychologisches
Institut I, Universitat Hamburg, Hamburg, West Germany.
Doll, J., & Ajzen, I. (1992). Accessibility and stability of predictors in the theory of
planned behavior. Journal of Personality & Social Psychology, 63(5), 754-765.
Drabek, T.E. (1995). Disaster responses within the tourism industry. International
Journal of mass Emergencies and Disasters, 131, 7-23.
Driscoll, A., Lawson, R., & Niven, B. (1994). Measuring tourists' destination perceptions.
Annals of Tourism Research, 21, 499-511.
Dunn, R. E. L., & Iso-Ahola, S.E. (1991). Sightseeing tourists’ motivation and
satisfaction. Annual of Tourism Research, 18(2), 226-237.
Durocher, J. (1994). Recovery marketing: What to do after a natural disaster. Cornell
Hotel and Restaurant Administration Quarterly, 35(2), 66-71.
Dynes, R.R., & Aguirre, B.E., (1979). Organizational adaptation to crises: mechanisms of
coordination and structural change: Disaster, 31, 71-74.
Echtner, C.M., & Ritchie, J.R.B. (1991). The meaning and measurement of destination
image. Journal of Tourism Studies, 2(2), 2-12.
Echtner, C.M., & Ritchie, J.R.B. (1993). The measurement of destination image: An
empirical assessment. Journal of Travel Research, 31(4), 3-13.
Eizaguirre, A., & Laka, J.P. (1996). Competencia entre ciudades. Medición de la imagen
comparada de 7 metropolis españiolas. Boletin de Estudios Económicos, 51(157),
67-88.
164
Embacher, J., & Buttle, F. (1989). A repertory grid analysis of Austria’s image as a
summer vacation destination. Journal of Travel Research, 28(3), 3-23.
Enright, M. J., & Newton, J. (2004). Tourism destination competitiveness: A quantitative
approach. Tourism Management, 25 (6), 777-88.
Evan, N. & Stabler, M.J. (1995). A future for the package tour operator in the 21th
century? Tourism Economics, 13, 245-263.
Fakeye, P.C., and J.R. Crompton (1991). Image differences between prospective, first-
time, and repeat visitors to the lower Rio Grande valley. Journal of Traveler
Research, 30 (2): 10-15.
Faulkner, B. (2001). Towards a framework for tourism disaster management. Tourism
Management, 22(2), 135-147.
Feder, L.K. (1996). Hotel toy with family market. Hotel & Motel management, 21(3), 49.
Ferrario, F. F. (1979). The evaluation of tourist resources: An applied methodology.
Journal of Travel Research, 17(3), 18-22.
Fishbein, M. (1980). A theory of reasoned action: Some applications and implications. In
M. M. Page (Ed.), Lincoln: University of Nebraska Press.
Font, X. (1992). Managing the tourist destination’s image. Journal of Vacation
Marketing, 3(2), 123-131.
Fornell, C., & Larcker, D.F. (1981). Evaluating structural equation models with
unobservable variables and measurement error. Journal of Marketing Research, 18
(1) (February), 39-50.
Gallarza, M.G., Saura, I.G., & Garcia, H.C. (2002). Destination image: Towards a
conceptual framework. Annals of Tourism Research, 29(1), 57-58.

165
Gardyn, R. (2001). The new family vacation. American Demographics, 23(8), 43-46.
Gartner, W.C., & Hunt, J. (1987). An analysis of state image change over a twelve-year
period. Journal of Travel Research, 26(2), 15-19.
Gartner, W.C. (1996). Tourism development: Principles, processes, and policies. Van
nostrand Reinhold.
Gartner, W.C. (1986). Temporal influences on image change. Annual of Tourism
Research, 13, 635-644.
Gartner, W. C. (1989). Tourism Image: Attribute measurement of state tourism products
using multidimensional scaling techniques. Journal of Travel Research, 28(2),
16-20.
Gartner, W.C., & Shen, J. (1992). The impact of Tiananmen Square on China's tourism
image. Journal of Travel Research, 30(4), 47–52.
Gatch, C. L & Kendzierski, D. (1990). Predicting exercise intentions: The theory of
planned behavior. Research Quarterly For Exercise and Sport. 61 (1), 100-102.
Gillen, D., & lal, A. (2003). International transmission of shocks in the airline industry.
Journal of Air Transport management, 9, 37-49.
Gitelson, R.J., & J. L. Crompton (1984). Insights into the repeat vacation phenomenon.
Annals of Tourism Research, 11: 199-217.
Gitelson, R.J., & Kerstetter, D. L. (1990). The relationship between sociodemographic
variables, benefits sought and subsequent vacation behavior: A case study.
Journal of Travel Research. Winter, 24-29.
Glaesser, D. (2004). Crisis Management in the Tourism Industry. Butterworth-
Heinemann: Oxford.

166
Godin, G., Kok, G. (1996). The theory of planned behavior: A review of its applications
to health-related behaviors. American Journal of Health Promotion, 11(2), 87-98.
Godin, G., Valois, P., Jobin, J., & Ross, A. (1990). Prediction of intention to exercise of
individuals who have suffered from coronary heart disease. Unpublished
manuscript, School of Nursing, Laval University, Quebec, Canada.
Godin, G., Vezina, L., & Leclerc, O. (1989). Factors influencing intentions of pregnant
women to exercise after giving birth. Public Health Reports, 104, 188-195.
Goodrich, J.N. (1978). A new approach to image analysis through multidimensional
scaling. Journal of Travel Research, 17(2), 2-7.
Goodrich, J.N. (2002). September 11, 2001 attack on America: a record of the immediate
impacts and reactions in the USA travel and tourism industry. Tourism
Management, 23, 573-580.
Gotlieb, J. B., Grewal, D., & Brown, S.W. (1994). Consumer satisfaction and perceived
quality: Complementary or divergent constructs. Journal of Applied Psychology.
79(6), 875-885.
Greenwald, A. G. & Leavitt, C. (1984). Audience involvement in advertising, four levels,
Journal of Consumer Research, 9 (12), 132-140.
Gursoy, D., & McCleary, K.W. (2004). An integrative model of tourists’ information
search behavior, Annals of Tourism Research, 31 (2), 353-373.
Guthrie, J., & Gale, P. (1991). Positioning ski areas. New Horizons Conference
Proceedings, 551–569. Calgary: University of Calgary.
Gyte, D.M., & A. Phelps (1989). Patterns of destination repeat business: British tourists
in Mallorca, Spain. Journal of Travel Research, 28(1): 24-28.

167
Hair, J.F., Anderson, R.E., Tatham, R.L., & Black W.C. (1998). Multivariate data
analysis (5th ed.) Upper Saddle River, NJ: Prentice Hall.
Haahti, A.J. (1986). Finland’s competitive position as a destination, Annuals of Tourism
Research, 13, 11-35.
Hall, C.M. (1997). The politics of heritage tourism: Place, power and the representation
of values in the urban context. In P.E. Murphy, Quality management in urban
tourism. Chichester: Wiley, 91-101.
Harland, P., Staats, H., & Wilke, H. (1999). Explaining proenvironmental intention and
behavior by personal norms and the theory of planned behavior. Journal of Applied
Social Psychol, 29, 2505-28.
Heath, R. (1998). Crisis Management for Managers and Executives. Financial Times
Publishing: London.
Hee, S. P. (2000). Relationships among attitudes and subjective norm: Testing the theory
of reasoned action across cultures. Communication Studies, 51(2), 162–175.
Hofstede, G. (1980). Culture's consequences: International differences in work-related
values. Beverly Hills, CA: Sage.
Henderson, J. (2002). Managing a tourism crisis in South-East Asia: the role of national
tourism organizations. International Journal of Hospitality and Tourism
Administration, 31, 85-105.
Henderson, J. (2003). Communicating in a crisis: flight SQ006. Tourism Management,
243,279-287.

168
Houston, M J. & Rothschild, M.L. (1978). Conceptual and methodological perspectives
in involvement, in Research Frontiers in Marketing: Dialogues and Directions, ed.
S. Jain. Chicago: American Marketing Association, 184-187.
Hu, L., & Bentler, P.M. (1995). Evaluating model fit. In R. Hoyle (Ed.), Structural
equation modeling: Concepts, issues, and applications, 76-99. Thousand Oaks, CA:
Sage Publications.
Hu, L., & Bentler, P.M. (1999). Cut off criteria for fit indexes in covariance structure
analysis: Conventional criteria versus new alternatives. Structural Equation
Modeling, 6(1), 1-55.
Hu, Y., & J.R.B Ritchie(1993). Measuring destination attractiveness: A contextual
approach. Journal of Travel Research, 32(2), 25-34.
Huang, L., Tsai, & Hsien, T. (2003).The study of senior traveler behavior in Taiwan.
Tourism Management, 24, 561-574.
Hunt, J.D (1975). Image as a factor in tourism development. Journal of Travel Research,
13(3), 1-7.
Huxley, L. (2001). Crisis talks follow slump in booking. Travel Trade Gazette, 15(10), 3.
Israeli, A.A., & Reichal, A. (2003). Hospitality crisis management practices: the Israeli
case. International Journal of Hospitality management, 22, 353-372.
Iwasaki, Y., & Havitz, M.E. (1998). A path analytic model of the relationships between
involvement, psychological commitment, and loyalty. Journal of Leisure Research,
30(2), 256-280.
Jamrozy, U., Backman, S. J., & Backman, K.F. (1996). Involvement and opinion
leadership in tourism. Annals of Tourism Research, 23(4), 908-924.
169
Jang, S. (2004). The past, present, and future research of online information search.
Journal of Travel and Tourism Marketing, 17(2/3), 41-47.
Johnson, B. R., & Edwards, T. (1994). The commodification of mountaineering. Annual
Tourism Research, 21(3), 459-478.
Joreskog, K. G., & Sorbom, D. (1993). LISREL 8 [Computer software]. Chicago:
Scientific Software International.
Joreskog, K. G., & Sorbom, D. (1995). LISREL 8: User’s reference guide and LISREL 8:
The SIMPLIS command language and PRELIS 2: User’s reference guide.
Chicago, IL: Scientific Solfware International.
Juaneda, C. (1996). Estimating the probability of return visits using a survey of tourist
expenditure in the Balearic Islands. Tourism Economics, 2(4), 339-352.
Kaplan, D. (1989). Model modification in covariance structure analysis: Application of
the expected parameter change statistic. Multivariate Behavioral Research, 24,
285-305.
Kash, T., & Darling, J. (1988). Crises management: Prevention, diagnosis and
intervention. Leadership and Organization Development Journal, 19 (4), 179–186.
Kashima, Y., Gallois, C & McCamish, M. (1993). Theory of reasoned action and
cooperative behavior: It takes two to use a condom. British Journal of Social
Psychology, 32, 227-239.
Kent, W.E., Meyer, R.A., & Reddam, T.M. (1987). The relational behavior between
wholesaler and retailer travel agencies. Journal of Hospitality & Tourism Research,
30, 333-353.
170
Kerlinger, P. (1982). The migration of common loons through Eastern New York.
Journal Information for the Condor, 84(1), 97-100.
Kim, H., & Markus, H. R. (1999). Uniqueness or deviance, harmony or conformity: A
cultural analysis. Journal of Personality and Social Psychology, 77, 785-800.
Kimiecik, J. (1992). Predicting vigorous physical activity of corporate employees:
Comparing the theories of reasoned action and planned behavior. Journal of Sport
and Exercise Psychology, 14, 192-206.
Kline, P. (1994). An easy guide to factor analysis. New York: Routledge.
Kotler, P., Bowen, J., & Makens, J. (1999). Marketing for Hospitality and Tourism.
Second editor, Prentice Hall: USA.
Koufaris, M. (2002). Applying the technology acceptance model and flow theory to
online consumer behavior. Information Systems Research, 13(2), 205-223.
Kozak, M. (2001). Comparative assessment of tourist satisfaction with destinations
across two nationalities. Tourism Management, 22(4), 391-401.
Kozak. M. (2001). Repeaters’ behavior at two distinct destinations. Annuals of Tourism
Researc, 28(3), 784-807.
Kosak, M., & Rimmington, M. (1999). Measuring tourist destination competitiveness:
Conceptual considerations and empirical finding. International Journal of
Hospitality Management. 18(3), 273-283.
Kristiansen, C.M., & Hotte, A.M. (1996). Morality and the self: Implications for the
when and how of value-additude-behavior relations. See Seligman et al 1996,
77-105.

171
Lam, T., & Hsu, C. H.C. (2004). Theory of planned behavior: Potential travelers from
China. Journal of Hospitality and Tourism Research, 28(4), 463-482.
Lam, T., & Hsu, C. H.C. (2006). Predicting behavioral intention of choosing a travel
destination. Tourism Management, 27(4), 589-599.
Law, E. (1995). Tourist destination management: Issues, analysis, and policies.
Routledge: London.
Leaf, R. (1995). Presentation at the General Assembly of WTO in Cairo. Madrid: WTO.
Lee, C.K., Lee, Y.K., & Wicks, B.E. (2004). Segmentation of festival motivation by
nationality and satisfaction. Tourism Management, 25, 61-70.
Lee, M.J. (2005). Effects of attitude and destination image on association members'
meeting participation intentions: Development of meeting participation model.
Kansas State University (dissertation).
Lee, S.H., Phan, P.H & Tan, G. (2003). Impact of the Asian economic crisis on training
intentions and outcomes. Human Resource Management Review, 13(3), 467-486.
Leslie, D. (1999). Terrorism and tourism: the Northern Ireland situation—A look
behind the veil of certainty. Journal of Travel Research 38(1), 37–40.
Lindquist, J.D (1974). Meaning of image. Journal of Retailing, 50(4), 29-37
Loker, L.E., & Perdue, R.R. (1992). A Benefit-based segmentation of a nonresident
summer travel market. Journal of Travel Research. Summer, 30-35.
Lovelock, C. (1991). Service marketing, 2nd Edition. London: Pitman Publishing Ltd.
Machlis, G., & Burch, W. (1983). Relations among strangers: Cycles of structure and
meaning in the tourist system. Sociological Review, 31, 666-689.
172
MacInnis, D., & Price, L.L (1987). The role of imagery in information processing: a
review and extensions. Journal of Consumer Research, 13(4), 473-91.
Madden, T. J., Ellen, P. S., & Ajzen, I. (1992). A comparison of the theory of planned
behavior to the theory of reasoned action. Personality and Social Psychology
Bulletin, 18(1), 3-9.
Mansfeld, Y. (1992). From motivation to actual travel. Annuals of Tourism Research, 19,
399-419.
Mansfeld, Y. (1999). Cycles of war, terror, and peace: Determinants and management of
crisis and recovery of the Israeli tourism industry. Journal of Travel Research,
38(1), 30–36.
Manstead A.S.R. (2000). The role of normal norm in the attitude-behavior relationship.
In D. J. Terry & M.A. Hogg Eds.) Attitude, Behavior and Social Context: The role
of Norms and Group Membership. Mahwah, NJ: Erlbaum.
Maruyama, G.M. (1998). Basic of Structural Equation Modeling. Thousand Oaks, CA:
Sage Publications.
Mayo, E., & Jarvis, L. (1981). The psychology of leisure travel: Effective marketing and
selling of travel services. Boston: CBI Publishing.
Mazursky, D. (1989). Past experience and future tourism decisions. Annuals of Tourism
Research, 16, 333-344.
Mercer, D. (1981). The role of perception in the recreation experience: A review and
discussion. Journal of Leisure Research, 3(4), 261-176.
Middleton, V. (1989). Tourist Product. In S. F.Witt and L. Moutinho (Eds.), Tourism
marketing and management handbook (pp. 573-576.). London: Prentice-Hall.
173
Millar, M.G., & Millar, K.U. (1996). The effect of direct and indirect experience on
affective and cognitive responses and the attitude-behavior relation. J. Exp. Soc.
Psychol, 32, 561-579.
Millar, M.G., & Millar, K.U. (1996). The effects of prior experience and thought on the
attitude behavior relation. Soc. Behav. Pers. 26, 105-114.
Miller, G. A. (1956). The magical number seven plus or minus two: Some limits on our
capacity for processing information. Psychological Review, 63, 81-97.
Milman, A., & Abraham, P. (1995). The role of awareness and familiarity with a
destination: The Central Florida case. Journal of Travel Research, 33(3), 21-27.
Miquel, S., Caplliure, E.M., & Aldas-Manzano, J. (2002). The effect of personal
involvement on the decision to buy store brands. Journal of Product & Brand
Management, 11(1), 6-18.
Mitchell, A. A. (1980). Dimensions of advertising involvement, In K. B. Monroe (Ed.).
Advances in Consumer Research, 8, ed. Kent Monroe, Ann Arbor, MI: University
Microfilms International.
Mok, C., Armstrong, R. W., & Go, M.G. (1995). Taiwanese travelers’ perception of
leisure destination attributes. Australia Journal of Hospitality Management, 2(1),
17-22.
Morrison, D.M., Gillmore, M.R., Simpson, R.R., & Wells, E.A. (1996). Children’s
decisions about substance use: An application and extension of the theory of
reasoned action. Journal of Applied Social Psychol, 26, 1658-79.
Moutinho, L. (1987). Consumer behavior in tourism. Journal of Marketing, 21(10),
1–44.
174
Muller, T.E. (1995). How personal values govern the post-visit attitudes of international
tourists. Journal of Hospitality and Leisure Marketing, 3(2), 3-24.
Murphy, P., & Bailey, R. (1989). Tourism and disaster planning. Geographical Review,
791, 36-46.
Murphy, P., Pritchard, P.M., Smith, B. (2000). The destination product and its impact on
traveler perceptions. Tourism Management, 21, 43-52.
Mydans, S. (2005). After Tsunami, rebuilding paradise. The New York Times. April 24,
pp.5.1.
Mykiltun, R.J., Crotts, J.C., & Mykletun, A. (2001). Positioning and island destination in
the peripheral area of the Baltics: A Flexible approach to market segmentation.
Tourism Management, 22, 493-500.
Netemeyer, R. G., Andrews, J. C., & Durvasala, S. (1990). A comparison of three
behavioral intention models using within and across subjects designs. Manuscript,
Marketing Department, Louisiana State University.
Netemeyer, R. G., Burton, S., & Johnston, M. (1990). A comparison of two models for
the prediction of volitional and goal-directed behaviors: A confirmatory analysis
approach. Unpublished manuscript, Marketing Department, Louisiana State
University at Baton Rouge.
Norman, P., Conner, M., & Bell R. (1999). The theory of planned behavior and smoking
cessation. Health Psychol, 18, 89-94.
Nunnally, J.C., & Berstrin, I.H. (1994). Psychometric theory. New York: McGraw-Hill.
Oppermann, M. (1996a). Convention destination images analysis of association meeting
planners' perceptions. Tourism Management, 17,175-182.

175
Oppermann, M. (1996b). Convention cities—images and changing fortunes. Journal of
Tourism Studies, 7(1), 10-19.
Oppermann, M. (1997). First time and repeat visitors to New Zealand. Tourism
Management, 18, 177-181.
Oh, H., & Hsu, C. (2001). Volitional degrees of gambling behaviors. Annals of Tourism
Research, 28(3), 618-637.
O’Neill, M.A., & McKenna, K. A. (1994). Northern Ireland tourism: quality perspective.
Managing Service Quality, 4(2), 31-35.
Otis, J., Godin, G., & Lambert, J., Pronovost, R. (1990). AIDS prevention: The difference
between contraception and STD. International conference AIDS, 6, 106.
Ouellette, J. A., & Wood, W. (1998). Habit and intention in everyday life: The multiple
processes by which past behavior predicts future behavior. Psychological Bulletin,
124(1), 54-74.
Padgett, D., & Douglas, A. (1997). Communicating experiences: a narrative approach to
creating service brand image. Journal of Advertising, 26(4), 49-62.
Paisley, C.M., & Sparks, P. (1998). Expectations of reducing fat intake: The role of
perceived need within the theory of planned behavior. Psychol. Health, 13, 341-53.
Pallant, J. (2001). SPSS Survival Manual: A step by step guide to data analysis using
SPSS for window (version 10). Australia : Allen&Unwin
Park, C. W. & Mittal, B. (1985). A theory of involvement in consumer behavior: problem
and issues, in J.N. Sheth ed., Research in Consumer Behavior, I, JAI Press,
Greenwich, CT, 201-232.
176
Park, J. (2003). Understanding consumer intention to shop online Dissertation ed.
Columbia, MO: University of Missouri.
Parker, D., Manstead, A. S. R., Stradling, S. G., Reason, F. T., & Baxter, J. S. (1990).
Intention to commit driving violations: An application of the theory of planned
behavior. Unpublished manuscript, Department of Psychology. University of
Manchester, Manchester, England.
Park, M., Yang, X., Lee, B., Jang, H.C., & Stokowski, P.A. (2002). Segmenting casino
gamblers by involvement profiles: A Colorado example. Tourism Management, 23,
55-65.
Pearce, P. (1982). Perceived changes in holiday destinations. Annuals of Tourism
Research, 9, 145-164.
Petrick, J.D.M., & Norman, W. (2001). An examination of the determinants of
entertainment vacationers’ intentions to visit. Journal of Travel Research, 40,
41-48.
Phelps, A. (1986). Holiday destination image-the problem of assessment: an example
developed in Menorca. Tourism Management, 7993), 168-180.
Pike, S. (2002). Destination image analysis: A review of 142 papers from 1973 to 2000.
Tourism Management, 23(5), 541-549.
Pizam, A., Neumann, Y., & Reichel, A. (1979). Tourist satisfaction, Annals of Tourism
Research, 6, 195-197.
Posavac, S. S., Sanbonmatsu, D. M., & Fazio, R. H. (1997). Considering the best choice:
Effect of the salience and accessibility of alternatives on attitude-decision
consistency. J. Consum. Psychol, 6(67-76).
177
Prentice, R. (1993). Heritage consumers in the leisure market: an application of the
Manning-Haas demand hierarchy. Leisure Sciences, 273-290.
Prislin, R., & Quellette. J. (1996). When it is embedded, it is potent: effects of general
attitude embeddedness on formation of specific attitudes and behavioral intentions.
Pres. Soc. Psychol. Bull, 22, 845-61.
Pyo, S., Mihalik, B., Uysal, M. (1989), "Attraction attributes and motivations: a canonical
correlation analysis", Annals of Tourism Research, 16 (2), 277-82.
Quellette, J. A., & Wood, W. (1998) Habit and intention in everyday life: The multiple
processes by which past behavior predicts future behavior. Psychological Bulletin,
124 (1), 54–74.
Quester, P., & Lim, A. L. (2003). Product involvement/brand loyalty: Is there a link?
Journal of Product & Brand Management, 12(1), 22-38.
Quine, L., & Rubin, R. (1997). Attitude, subjective norm and perceived behavioral
control as predictors of women’s intentions to take hormone replacement therapy.
Br. J. Health Psychol, 2, 199-216.
Quine, L., Rutter, D., & Arnold, L. (1998). Predicting and understanding safety helmet
use among schoolboy cyclists: A comparison of theory of planned behavior and the
health belief model. Psychol. Health, 13, 251-69.
Ray, S.J. (1999). Strategic Communication in Crisis management: Lesson from the
Airline Industry. Quorum Books: Westport, CT.
Regester, M., & Larkin, J. (2002). Risk Issues and Crisis Management: a Casebook of
Best Practice, 2nd edn. Kogan Page: London.
178
Reid, I. S., & Crompton, J. L. (1993). A taxonomy of leisure purchase decision
paradigms based on level of involvement. Journal of Leisure Research, 25(2),
182-202.
Reinecke, J., Schmidt, P., & Ajzen, I. (1996). Application of the theory of planned
behavior to adolescents’ condom use: A panel study. Journal of Applied Social
Psychology, 26(5), 749–772.
Reisinger, Y., & Turner, L. (1999). Structural equation modeling with Lisrel: Application
in tourism. Tourism Management, 20:71-88.
Reisinger, Yvette., & Robert Waryszak (1995). Japanese Tourists’Perceptions of their
Tour Guides: Australian Experience. Journal of Vacation Marketing, 1(1), 28-40.
Reuland, R., Coudrey, J., & fagel A. (1985). Research in the field of hospitality.
International Journal of Hospitality management, 4($), 141-146.
Reynolds, T.J., & Gutman, J. (1984). Advertising is image management. Journal of
Advertising Research, 24 (1), 27-37.
Reynolds, W.H. (1965). The role of the consumer in image building. California
Management Review, 7, 69-76.
Richard, R., De Vries, N.K., & Van der Pligt, J. (1998). Anticipated regret and
precautionary sexual behavior. Journal of Applied Social Psychology, 28, 1411-28.
Richardson. B. (1994). Crisis management and the management strategy: time to “loop
the loop”. Disaster Prevention and Management, 33, 59-80.
Richter, L. (1989). The Politics of Tourism in Asia. Honolulu: University of Hawaii
Press.
179
Rigdon, E.E. (1996). CFI versus RMSEA: A comparison of two fit indices for structural
equation modeling. Structural Equation Modeling, 3(4), 369-379.
Rigdon, E.E. (1998). Structural equation modeling. In G. Marcoulides (ed.), Modern
Methods for Business Research. Mahwah, NJ: Lawrence Erlbaum Associates.
Rosenberg, M. J., & Hovland, C. I. (1960). Cognitive, affective, and behavioral
components of attitudes. In C.I. Hovland, & M.J. Rosenberg (Eds.), Attitude
Organization and Change (pp.1-14). New Haven, CT: Yale University Press.
Ross, G.F. (1993). Destination evaluation and vacation preference. Annuals of Tourism
Research, 20, 477-489.
Ross, L. D., & Iso-Ahola, S.E. (1991). Sightseeing tourists’ motivation and satisfaction.
Annuals of Tourism Research, 18(2), 226-237.
Rothschild, M.L. (1984). Perspective on involvement: Current problems and future
directions, Advances in Consumer Research, 11, 216-217.
Ryan, C., & Glewndon, I. (1998). Application of leisure motivation scale to tourism.
Annals of Tourism Research, 25, (1), 169-184.
Schifter, D. B., & Ajzen, I. (1985). Intention, perceived control, and weight loss: An
application of the theory of planned behavior. Journal of Personality and Social
Psychology, 49, 843-851.
Schlegel, R. P., D’Avema, J. R., Zanna, M. P., DeCourville, N. H., &
Manske, S. R.(1990). Problem drinking: A problem for the theory of reasoned
action? Unpublished manuscript. Department of Health Studies, University of
Waterloo, Waterloo, Canada.
180
Schroeder, T. (1996). The relationship of residents' image of their state as a tourist
destination and their support for tourism. Journal of Travel Research, 34(4), 71-73.
Schultz, P.W., & Oskamp, S. (1996). Effort as a moderator of attitude-behavior
relationship: General environment concern. Soc. Psychol. Q, 59, 375-83.
Seaton, A.V. & Benett, M.M. (1996). Marketing tourism products: Concepts, issues,
cases. London: International Thomson Business Press.
Selby, M., & Morgan, N.J. (1996). Reconstruction place image: A case study of its role in
destination market research, Tourism Management, 17(4), 287-294.
Sheeran, P. & Orbell, S. (1999). Augmenting the theory of planned behavior: roles for
anticipated, Journal of Applied Social Psychology, 29(10), 2107.
Sheppard, B. H., Hartwick, J., & Warshaw, P. R. (1988). The theory of reasoned action:
A meta analysis of past research with recommendations for modifications and
future research. Journal of Consumer Research, 15(3), 325-343.
Sirgy, J.M., & Su, C. (2000). Destination image, self-congruity and travel behavior:
toward an integrative model. Journal of Travel Research, 38(4), 340-352.
Smith, D. (1990). Beyond contingency planning: towards a model of crisis management.
Industrial Crisis Quarterly, 4, 263-275.
Smith, S.L. (1994). The Tourism product. Annuals of Tourism research, 21, 582-595.
Sonmez, S. F. (1998). Tourism, terrorism and political instability. Annals of Tourism
Research, 25, 416–55.
Sonmez, S.F., Apostolopoulos, Y., & Tarlow, P. (1999). Tourism in crisis: Managing the
effects of terrorism. Journal of Travel Research, 38(1), 13-18.

181
Sonmez, S.F., Backman, S.J., & Allen, L.R. (1994). Managing tourism crisis: A
guidebook. Clemson, SC: Clemson University.
Sonmez, S.F., & Graefe, A.R. (1998). Determining future travel behavior from past travel
experience and perceptions of risk and safety. Journal of Travel Research, 37(2),
171–177.
Sparks, P., & Guthrie, C. A. (1998). Self-identify and the theory of planned behavior: A
useful addition or an unhelpful artifice? Journal of Applied Social Psychol.
28:1393-410.
SPSS (1999). SPSS Regression Models 9.0. New Jersey: Prentice Hall.
SPSS (1999). SPSS Base 9.0: Application Guide. New Jersey: Prentice Hall.
Stabler, M.J. (1988). The image of destination regions: Theoretical and empirical aspects.
In; Goodall, B. and Ashworth, G. (Eds.). 131-161. Marketing in the Tourism
Industry: The Promotional of Destination Regions. London: Routledge.
Stabler, M.J. (1990). The image of destination regions: theoretical and empirical aspects.
In: G. Ashworth and B. Goodall (Eds.). Marketing tourism places, 23-41. New
York: Routledge.
Steene, A. (1999). Risk management within tourism and travel. Turizum 47(1), 13-18.
Stern, E., & Krakover, S. 91993). The formation of composite urban image.
Geographical Analysis, 25(2), 130-146.
Sternquist, W. B (1985). Attitudes about resort area: A comparison of tourists and local
retailers. Journal of Travel Research, 24(1), 14-19.
Stevens, B. F. (1992). Price value perceptions of travelers. Journal of Travel Research,
31, 44-48.
182
Steven, J. (1996). Applied multivariate statistics for social science, New Jersey:
Lawrence Erlbaum.
Sungsoo, P., Mihalik, B. J., & Uysal, M. (1989). Attraction attributes and motivations: A
canonical correlation analysis. Research Notes and Reports. Clemson University
Swanson, K. K. & Horridge, P. E. (2004). A structural model for souvenir consumption,
travel activities and tourist demographics, Journal of Travel Research, 42(1),
372-80.
Swanson, K. K., & Horridge, P. E. (2005). Travel motivations as souvenir purchase
indicators. Tourism Management, 3 (1), 1-25.
Tabachnick, B. G., & Fidell, L. S. (1996). Using multivariate statistics. Northridge, [add
the state because the city is not well known]: Harper Collins College.
Tang, C.S., & Rochananond . (2001). Attractiveness as a tourist destination: A
comparative study of Thailand and selected countries. Socio-Econ Plan.Sci, 24(3),
229-236.
Taylor, S., & Todd, P. (1995). Assessing IT usage: The role of prior experience. MIS
Quarterly, 19, 561-568.
Telisman-Kosuta, N. 91989). Tourism destination image. In: Witt, S.F. and Moutinho, L.
(Ed.). Tourism Marketing and management Handbook, 557-561. Cambridge:
Prentice Hall.
Teye, V.B. (1988). Coup d’etal and Africa tourism: A study of Ghana. Annual of Tourism
Research, 15(3), 429-356.

183
Truong, T.H., & Foster, D. (2005). Using HOLSAT to evaluate tourist satisfaction at
destinations: The case of Australian holidaymaker in Vietnam. Tourism
Management, 5(8), 1-25.
Tinsley, H. E. A., & Eldredge, B. D. (1995). Psychological benefits of leisure
participation: A taxonomy of leisure activities based on their need-gratifying
properties. Journal of Counseling Psychology, 42(2), 123–132.
Tourism Authority of Thailand (1997). Annual Statistic 1996. Phuket.
Tourism Authority of Thailand (1998). Annual Statistic 1997. Phuket.
Tourism Authority of Thailand (1999). Annual Statistic 1998. Phuket.
Tourism Authority of Thailand (2000). Annual Statistic 1999. Phuket.
Tourism Authority of Thailand (2001). Annual Statistic 2000. Phuket.
Tourism Authority of Thailand (2002). Annual Statistic 2001. Phuket.
Tourism Authority of Thailand (2003). Annual Statistic 2002. Phuket.
Tourism Authority of Thailand (2004). Annual Statistic 2003. Phuket.
Tourism Authority of Thailand (2005). Annual Statistic 2004. Phuket.
Tourism Authority of Thailand (2006). Annual Statistic 2005. Phuket.
Tourism Authority of Thailand (2005a) “Phuket”. Retrieved Oct 28, 2005 from
www.tat.or.th.
Tourism Authority of Thailand (2005b). Statistic of Phuket tourism. Retrived Oct 28,
2005 from www.phukettourism.org/contact .
Trafimow, D., & Finlay, K. A. (1996). The importance of subjective norms for a minority
of people: Between-subjects and within-subjects analyses. Pres. Soc. Psychol. Bull,
22, 820-28.
184
Trafimow, D., & Trafimow, J. H. (1998). Predicting back pain sufferers’ intentions to
exercise. J. Psychol, 132, 581-92.
Triandis, H. C. (1994). Theoretical and methodological approaches to the study of
collectivism and individualism. In U. Kim, H. C. Triandis, C. Kagitcibasi, S. C.
Choi, & G. Yoon (Eds.), Individualism and collectivism: Theory, method, and
applications, 41-51. Thousand Oaks, CA: Sage.
Triandis, H. (1988). Collectivism v. individualism: a reconceptualisation of a basic
concept in cross-cultural social psychology. In: Verma GK, Bagley C, editors.
Cross-Cultural Studies of Personality, Attitudes and Cognition, 60-65. London,
MacMillan.
Thalif, D. (2005). Asia: Tsunami recovery hampered by negligence, corruption. Global
Information Network. New York: Oct 19.
Uba, L. (1994). Asian Americans: Personality patterns, identity, and mental health. New
York: Guiford Press.
Um, S., & Crompton, J. L. (1990). Attitude determinations in tourism destination choice.
Annals of Tourism Research, 17, 432-448.
Uysal, M., & Hagan, L. (1993). Motivations for pleasure travel and tourism. In M. Khan,
M. Olsen, & T. Var (Eds.), Encyclopedia of hospitality and tourism (pp. 798–810).
New York: Van Nostrand Reinhold.
Uysal, M., & Jurowski, C. (1993). An empirical testing of the push and pull factors of
tourist motivations. Annals of Tourism Research, 21(4), 844–846.
Van de Pligt, J., & de Vries N.K. (1998). Belief importance in expancy-value models of
attitudes. Journal of Applied Social Psychol, 28, 1339-54.

185
Van Ryn, M., & Vinokur, A. D. (1990). The role of experimentally manipulated self-
efficacy in determining job-search behavior among the unemployed. Unpublished
manuscript, Institute for Social Research, University of Michigan at Ann Arbor.
Vanucci, C. L., & Kerstetter, D. L. (2001). Meeting planners' use of the Internet to plan
group meetings. Journal of Convention and Exhibition Management, 2(4), 23-36.
Vecchio, D. (2001).Consumer perceptions of private label quality: The role of product
category characteristics and consumer use of heuristics. Journal of Retailing and
Consumer Services, 8, 239-49.
Veen, W. M., & Verhallen W.M. (1986). Vacation market segmentation: A domain
specific value approach. Annuals of Tourism Research, 13.37-58.
Vincent, P. C., Peplau, L. A., & Hill CT (1998). A longitudinal application of the theory
of reasoned action to women’s career behavior. Journal of Applied Social Psychol,
28, 761.
Wahab, S. (1996). Tourism and terrorism: Synthesis of the problem with emphasis on
Egypt. In A. Pizam, & Y. Mansfield, Y. (Eds.), Tourism, crime and international
security issues, (pp. 175–186). New York: Wiley.
Walmsley, D., & Jenkins, J. (1993). Appraisive images of tourist areas: Application of
personal construct. Australian Geographer, 24(2), 1-3.
Walmsley, D. J. & Young, M. (1998). Evaluative images and tourism: The use of
personal constructs to describe the structure of destination image, Journal of Travel
Research, 36(3), 65-69.

186
Wang, Y., & Fesenmaier, D.R. (2004). Toward understanding members’ general
participation in and active contribution to an online travel community. Tourism
Management, 25(6), 709-722.
Warrington, P., & Shim, S. (2000). An empirical investigation of the relationship
between product involvement and brand commitment. Psychology & Marketing,
17(9), 761-782.
Watters, A. E. (1989). Reasoned intuitive action: An individual difference moderator of
the attitude-behavior relationship in the 1988 U.S. presidential election.
Unpublished master’s thesis, Department of Psychology, University of
Massachusetts at Amherst.
Weber, K. E. (2005). Tsunami 2004: “NAM CHAI THAI”. National Identity Board,
Royal Thai Government.
Westbrook, Robert A., (1987). Product/Consumption-Based Affective responses and
Postpurchase Process. Journal of Marketing Research, 14(August), 258-270.
Whipple, T.W., & Thach, S.V. 91988). Group tour management: Does good service
produce satisfied customer? Journal of Travel Research, 28(2), 16-21.
Wikipedia (2005). “Tsunami” Retrived Oct 15, 2005 from
http://en.wikipedia.org/wiki/Main_Page.
Wong, A., Ap, J., & Li, L. (2001). Family travel and perceptions on loading facilities,
InC. F. Gatchalian, V.C.S. Heung, & R.G. Cruz (Eds.), Proceedings of Asia Pacofic
Tourism Association 7th Annual Conference, Philippines, 7, 317-312.
Woodside, A.G. & Lysonski, S., (1989). A general model of traveler destination choice,
Journal of Travel Research, 27 (4), 8-14.
187
Worrall (1990). A comparison of information usage between business and leisure
travelers. Journal of Hospitality and Leisure Marketing, 7(2), 65-76.
Yang, S., & Rosenblatt, P. C. (2000). Shame in Korean families: An ethnographic
approach. Family and Culture, 11(2), 151-167.
Yau, O. H. M., & Chan, C.F. (1990). Hong Kong as a travel destination in Southest Asia:
A multidimensional approach. Tourism Management, 11(2), 123-132.
Yoo, E. (2004). Factors affecting middle-aged women's health information seeking on the
Web Dissertation ed.. Madison, WI: University of Wisconsin.
Young R .A., & Kent, A. T. (1985). Using the theory of reasoned action to improve the
understanding of recreation behavior. Journal of Leisure Research, 17 (2), 90-106.
Young, W.B., & Montgomery, R.J. (1998). Crisis management and its impact on
destination marketing: a guide to convention and visitors bureaus. Journal of
Convention and Exhibition and Management, 11, 3-18.
Zaichkowsky, J.L. (1987). The emotional aspect of product involvement. Advances in
Consumer Research, 14, 32-35. M. Wallendorf and P. Anderson Ed. Toronto,
October.
Zaichkowsky, J. L. (1986). Conceptualizing involvement. Journal of Advertising, 15(2),
4-14.
Zaichkowsky, J. L. (1985). Measuring the involvement construct. Journal of Consumer
Research, 12(3), 341-352.
Zhang, H.Q., Qu, H., & Tang, V. M. Y. (2004). A case study of Hong Kong residents’
outbound leisure travel. Tourism Management, 25 (2), 267-273.

188
APPENDICES

189
APPENDIX A
INSTITUTIONAL REVIEW BOARD (IRB) APPROVAL

190

191
APPENDIX B
SURVEY QUESTIONNAIRES
192
Dear Participants,
I am Kullada Phetvaroon, a Ph.D. student in the College of Human EnvironmentalSciences at Oklahoma State University, majoring in Hospitality Administration, locatedin the State of Oklahoma, United States of America. This survey is designed to evaluatetourists’ attitudes and opinions about Phuket as a tourist destination. This survey willenable the researcher to make suggestions to the tourism bodies at both local and nationallevels to improve tourism products and services in this province. Thus, the quality of yourexperience could possibly increase in the future because of information obtained throughthis research and the actions taken as a result of this study.
Please take a few moments to answer the following questions. There will be no riskinvolved with participating in this survey, and your responses will be anonymous. Yourvoluntary participation in this survey is greatly appreciated. Your opinions and commentswill be kept confidential, and will be of great value. The completion of this surveyimplies consent to consolidate your data with others and to publish results in reportswithout identifying any respondents.
The survey instrument has been approved by the Institutional Review Board (IRB) atOklahoma State University and has met all the human subjects and ethical requirements.If you have any questions regarding this research, please contact me or the IRB office.My contact information is provided below.
Thank you for your consideration, and participation in this research project.
Yours Sincerely,
Kullada Phetvaroon Woody Kim, Ph.D.Ph.D. Student Associate ProfessorOklahoma State University Oklahoma State UniversityCollege of Human Environmental Sciences College of Human Environmental SciencesSchool of Hotel & Restaurant Administration School of Hotel & Restaurant AdministrationE-mail: [email protected] E-mail: [email protected]: 405-332-0482 Phone: 405-744-8483
Dr. Sue C. JacobsUniversity Research Compliance415 WhitehurstOklahoma State UniversityStillwater, Ok 74078E-mail: [email protected]: (405) 744-1676

193
I. About your perception and motivation
1. Below is a list of Phuket’s features and activities. Using the following scale, please circle only
ONE appropriate number that indicates how important each attribute was in attracting you to visit
Phuket. If this is your first trip, fill out the “This trip” only column.
If this is a return visit, was your last visit before 26 December 2004. If so, answer both
columns.
Before 26 December 2004
Importance
This trip
Importance
Attributes
Very unimportant Very important Very unimportant Very important
Variety of accommodation options 1 2 3 4 5 6 7 1 2 3 4 5 6 7
Security and safety ataccommodation
1 2 3 4 5 6 7 1 2 3 4 5 6 7
Location of accommodation ( nearbeach, sea view, in town )
1 2 3 4 5 6 7 1 2 3 4 5 6 7
Reasonable price of accommodation 1 2 3 4 5 6 7 1 2 3 4 5 6 7
Variety of beaches and islands 1 2 3 4 5 6 7 1 2 3 4 5 6 7
Historical and cultural sites ofPhuket
1 2 3 4 5 6 7 1 2 3 4 5 6 7
Variety of entertainment &amusements
1 2 3 4 5 6 7 1 2 3 4 5 6 7
View Points 1 2 3 4 5 6 7 1 2 3 4 5 6 7
Park and nature in Phuket 1 2 3 4 5 6 7 1 2 3 4 5 6 7
Visit Tsunami site _________________________________
1 2 3 4 5 6 7
Reasonable price for sightseeing 1 2 3 4 5 6 7 1 2 3 4 5 6 7
Variety of marine sports andactivities
1 2 3 4 5 6 7 1 2 3 4 5 6 7
Variety of golf courses 1 2 3 4 5 6 7 1 2 3 4 5 6 7
Phuket festival and events 1 2 3 4 5 6 7 1 2 3 4 5 6 7
Variety of outdoor recreation 1 2 3 4 5 6 7 1 2 3 4 5 6 7
Variety of spa/massage/healingoptions
1 2 3 4 5 6 7 1 2 3 4 5 6 7
Variety of evening entertainment 1 2 3 4 5 6 7 1 2 3 4 5 6 7
Availability of daily tour services toother destinations and attractions
1 2 3 4 5 6 7 1 2 3 4 5 6 7

194
Reasonable price for activities andevents
1 2 3 4 5 6 7 1 2 3 4 5 6 7
Safety and security 1 2 3 4 5 6 7 1 2 3 4 5 6 7
Beautiful scenery ( sun, sand, sea) 1 2 3 4 5 6 7 1 2 3 4 5 6 7
Disaster protection and warningsystem
1 2 3 4 5 6 7 1 2 3 4 5 6 7
Cleanliness of beaches and sea 1 2 3 4 5 6 7 1 2 3 4 5 6 7
Availability of space on beaches 1 2 3 4 5 6 7 1 2 3 4 5 6 7
Availability of facilities on beaches 1 2 3 4 5 6 7 1 2 3 4 5 6 7
Ease of access 1 2 3 4 5 6 7 1 2 3 4 5 6 7
Convenience of local transportationsystem
1 2 3 4 5 6 7 1 2 3 4 5 6 7
Availability of travel information 1 2 3 4 5 6 7 1 2 3 4 5 6 7
Variety of shops 1 2 3 4 5 6 7 1 2 3 4 5 6 7
Reasonable price of merchandise 1 2 3 4 5 6 7 1 2 3 4 5 6 7
Variety of cuisine 1 2 3 4 5 6 7 1 2 3 4 5 6 7
Reasonable price of meals 1 2 3 4 5 6 7 1 2 3 4 5 6 7
2). Below is a list of statements assessing your motivation for travel to Phuket. Please circle only ONE
appropriate number that indicates how important each attribute is in motivating you to visit Phuket.
ImportanceAttributes
Very unimportant Very importantRelaxation 1 2 3 4 5 6 7Get recharged 1 2 3 4 5 6 7Be able to do nothing 1 2 3 4 5 6 7Release tension 1 2 3 4 5 6 7Have privacy 1 2 3 4 5 6 7Do exciting things 1 2 3 4 5 6 7Be entertained 1 2 3 4 5 6 7Do a specific activity 1 2 3 4 5 6 7Get away from crowds 1 2 3 4 5 6 7Experience unpolluted/natural surrounding 1 2 3 4 5 6 7Get away from pressures and responsibilities 1 2 3 4 5 6 7Visit friends and relatives 1 2 3 4 5 6 7Share a familiar place with other 1 2 3 4 5 6 7Return to favorite vacation site 1 2 3 4 5 6 7Do something with family 1 2 3 4 5 6 7Eat good food 1 2 3 4 5 6 7Go shopping 1 2 3 4 5 6 7

195
Have lots of different things to see and do 1 2 3 4 5 6 7Experience new/ different places 1 2 3 4 5 6 7Visit new and exciting place 1 2 3 4 5 6 7Spend time with someone special 1 2 3 4 5 6 7Have time for romance 1 2 3 4 5 6 7Spend time with family and friend 1 2 3 4 5 6 7Build friendship with other 1 2 3 4 5 6 7Mix with other fellow tourists 1 2 3 4 5 6 7Engage in sports 1 2 3 4 5 6 7Visit festivals and or special events 1 2 3 4 5 6 7Engage in special activities 1 2 3 4 5 6 7Experience different cultures 1 2 3 4 5 6 7To enjoy culture in its cultural/historical setting 1 2 3 4 5 6 7To know about culture events 1 2 3 4 5 6 7Take advantage of reduced fares and specialpackage
1 2 3 4 5 6 7
Visit places important in history (eg.Tsunami site ) 1 2 3 4 5 6 7
II. About your attitude and intention
1) Below is a list of statements assessing your perception of Phuket as a travel destination. Please
circle only ONE appropriate number that best represents your agreement with the statements on scale
of 1-7.
AgreementYour perception of Phuket
Strongly disagree Strongly agree
Most people I know choose Phuket as a travel destination 1 2 3 4 5 6 7
Members of my family think that it is a good idea to choose Phuket asa travel destination
1 2 3 4 5 6 7
Members of my family approve of my visiting Phuket 1 2 3 4 5 6 7
Most of my friends and acquaintances think that choosing Phuket as atravel destination is a good idea
1 2 3 4 5 6 7
If I want, I could easily visit Phuket from now on (after crisisrecovery)
1 2 3 4 5 6 7
It is mostly up to me whether or not I select Phuket as my traveldestination. (after crisis recovery)
1 2 3 4 5 6 7
Visiting Phuket is totally under my control even in case of crisis(Tsunami, bird flu, SARS-Severe Acute Respiratory Syndrome, andterrorist in Southern Thailand)
1 2 3 4 5 6 7
Recovery campaign (reduced fares and special packages) factored inselecting Phuket as my travel destination
1 2 3 4 5 6 7
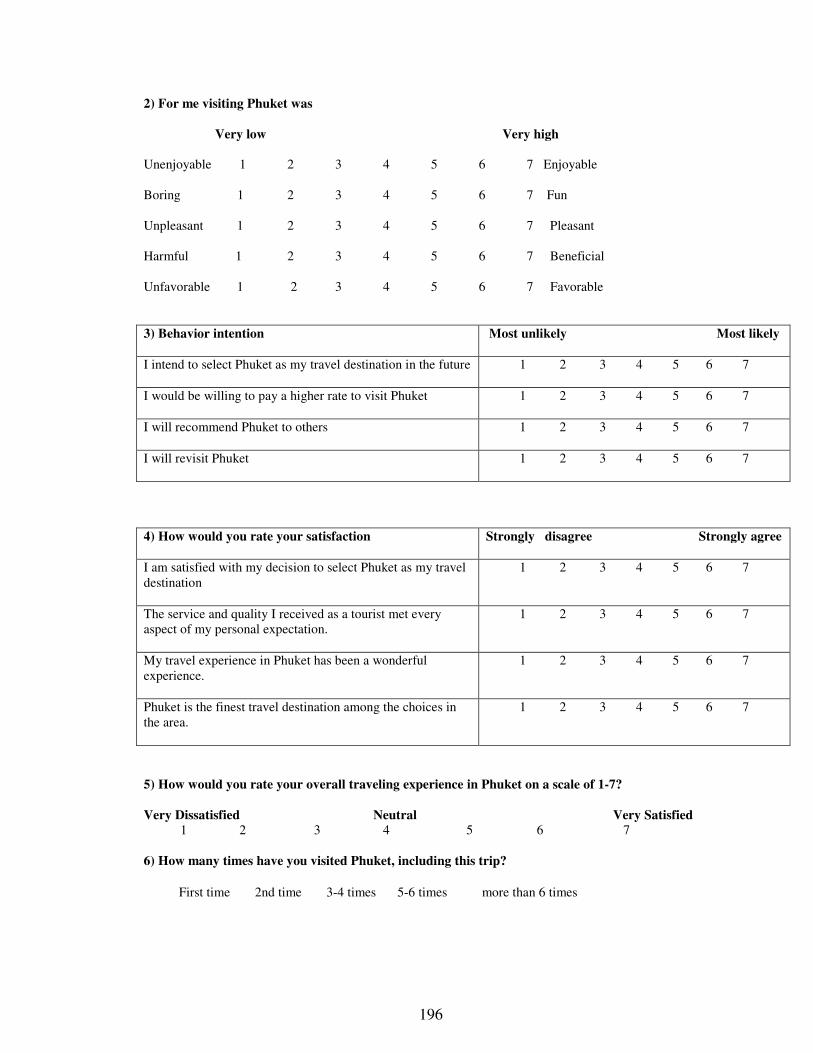
196
2) For me visiting Phuket was
Very low Very high
Unenjoyable 1 2 3 4 5 6 7 Enjoyable
Boring 1 2 3 4 5 6 7 Fun
Unpleasant 1 2 3 4 5 6 7 Pleasant
Harmful 1 2 3 4 5 6 7 Beneficial
Unfavorable 1 2 3 4 5 6 7 Favorable
3) Behavior intention Most unlikely Most likely
I intend to select Phuket as my travel destination in the future 1 2 3 4 5 6 7
I would be willing to pay a higher rate to visit Phuket 1 2 3 4 5 6 7
I will recommend Phuket to others 1 2 3 4 5 6 7
I will revisit Phuket 1 2 3 4 5 6 7
4) How would you rate your satisfaction Strongly disagree Strongly agree
I am satisfied with my decision to select Phuket as my traveldestination
1 2 3 4 5 6 7
The service and quality I received as a tourist met everyaspect of my personal expectation.
1 2 3 4 5 6 7
My travel experience in Phuket has been a wonderfulexperience.
1 2 3 4 5 6 7
Phuket is the finest travel destination among the choices inthe area.
1 2 3 4 5 6 7
5) How would you rate your overall traveling experience in Phuket on a scale of 1-7?
Very Dissatisfied Neutral Very Satisfied1 2 3 4 5 6 7
6) How many times have you visited Phuket, including this trip?
� First time � 2nd time � 3-4 times � 5-6 times � more than 6 times

197
7) If this was the first time you were visiting Phuket, please go to question number eight. If it is not
the first time, when was your last trip to Phuket prior to this trip?
� Before year 2002 � Between year 2002-2004 � After January 2005
8) What was the primary purpose of your trip to Phuket?
� Vacation/pleasure � Leisure � Business/professional � Visit
friends/relatives � Convention/exhibition � Wedding/honeymoon � Shopping
� En route to somewhere else
� Attend special events (family occasions, concert, etc.)
� Other (please specify) _________________
ΙΙΙ. About yourself
1. Your gender : Male Female
2. Your age group: Under 21 years old 22-35 years old 36-50 years old
51-65years old Over 65 years old
3. Your Nationality: ____________________________________
4. Your highest level of education
Elementary School (Grade1-8) High school/vocational school 2-year college
4-year college Master’s degree Doctorate degree
5. Your current occupation
Management Administrative support Government/military
Professional related (doctor, attorney, etc.) Sales Construction
Production Service Student Self-employed
Housewife Retired/not in the workforce
Other (please specific) _____________________
6. Your total annual household income (please provide your best estimate)
Under $25,000 $25,000-$49,999 $50,000-$74,999
$75,000-$99,999 $100,000 and above

198
ΙV. About your trip to Phuket
1. How long did you stay in Phuket?
� Less than one day � 1-2 days � 3-5 days � a week � more than a week.
2. How did you travel to Phuket?
� Car � Plane � Tour bus
� Other (please specify) ______________
3. You are traveling
� By yourself � With your spouse � With your family & children
� With friends/relatives � With business associates � With tour group
4. Including you, how many persons are in your travel group ______________
5. Where did you learn about Phuket? (Check all that apply)
� Previous trip(s) �Travel agent � Advertising
� Internet � Word-of-mouth � Brochures/travel guidebooks
� Tourist information/welcome center � Other (please specific) ______
V. About your accommodations and activities
1. Where did you stay during your trip in Phuket?
� Hotel in Phuket Town � Hotel near beach � Home of friends/relatives � Bed and
Breakfast
� Time share/vacation hotel/condo � Camping ground/tent sites � Commercial
cottage/cabin/suite
2. Where did you learn about the hotel you stayed in? ( check all that apply)
� Previous trip(s) � Internet � Brochures/travel guidebooks � Travel agent
� Word of mouth � Advertisements � Tourist information/welcome center � Other _________

199
3. What tourist attractions did you visit in Phuket during this trip? (Check all that apply)
� Beach and island � Tsunami site � Natural wonder (etc. Mangrove forest)
� View point (etc. Leam Phromthep, Kata view point) � Historic site (etc. Wat Chalong, Saphan Hin)
� Other (please specify) _________
4. What beaches did you visit during this trip? (Check all that apply)
� Southern beach (Naihan beach, Kata beach, Karon beach, Patong beach, Kalim beach, Larm Ka
beach)
� Middle beach (Kamala beach, Laem Sing beach, Pansea beach, Bang Tao beach)
� Northern beach (Nai Thon beach, Naiyang beach, Mai Khao beach)
5. What outdoor activities did you participate in during this trip? (Check all that apply)
� Activities at sea (scuba diving, water skiing) � Activities on land (horse-riding, elephant trekking)
� Golfing � Spa � Other (please specify) _____________________
6. What special events did you attend in Phuket during this trip? (Check all that apply)
� Chao Le (Sea Gypsy) Boat Floating Festival � Laguna Phuket Triathlon
� Tourist Season Opening Festival � Phuket King’s Cup Regatta � Phuket Travel Fair
� Seafood Festival � Turtle Releasing Fair � Vegetarian Festival
� Annual Gay Festival � Other (please specify) _______________________
7. Approximately how much have you spent for this trip? ( in your own currency)
Accommodation (total) ______________________
Dinning (total) ___________________________
Shopping (total) __________________________
Attraction, activities, and festival (total) ___________________________
Transportation to Phuket ___________________

VITA
Kullada Phetvaroon
Candidate for the Degree of
Doctor of Philosophy
Thesis: APPLICATION OF THE THEORY OF PLANNED BEHAVIOR TO SELECT ADESTINATION AFTER A CRISIS: A CASE STUDY OF PHUKET, THAILAND
Major Field: Human Environmental Sciences
Biographical:
Personal Data: Born in Phuket, Thailand, the daughter of Prakit and JariyaPhetvaroon
Education: Graduated from Triamudaomsuksa School, Bangkok, Thailand inJune1990; received Bachelor of Science in Economics from KasetsartUniversity, Bangkok, Thailand in October 1993; Received Master ofBusiness Administration in Finance from University of Tennessee, USAin December 1996; Completed the requirements for the Doctor ofPhilosophy degree with the concentration in Hospitality and TourismAdministration at Oklahoma State University, USA in December, 2006.
Experience: Management trainee in marketing section at Ando AtlantaTransportation Co., Ltd., Atlanta, Georgia, USA, in summer 1994;Management trainee in financial section at Ando Atlanta TransportationCo., Ltd, Atlanta, Georgia, USA, in summer 1995; Assistant FinancialAnalyst, Merrill Lynch, USA, 1996-1997; Credit Controller, HachetteFilipacchi Post Co., Ltd, Bangkok, Thailand, 1997-1998; Vice President,Kiatsin Co., Ltd., Phuket, Thailand, 1999 to present; Managing Director,K.D. Trading, Phuket, Thailand, 1999 to present; Lecturer forundergraduate student in Principle of Economics and MathematicsIntensive Course, and for Post Graduate student (MBA) in Foundation ofEconomics, Faculty of Service Industries, Prince of Songkla University,Phuket Campus; 2000-present.
Professional Memberships: The International Association of Lion Club.Thai Stationeries and Office Supplies Association.
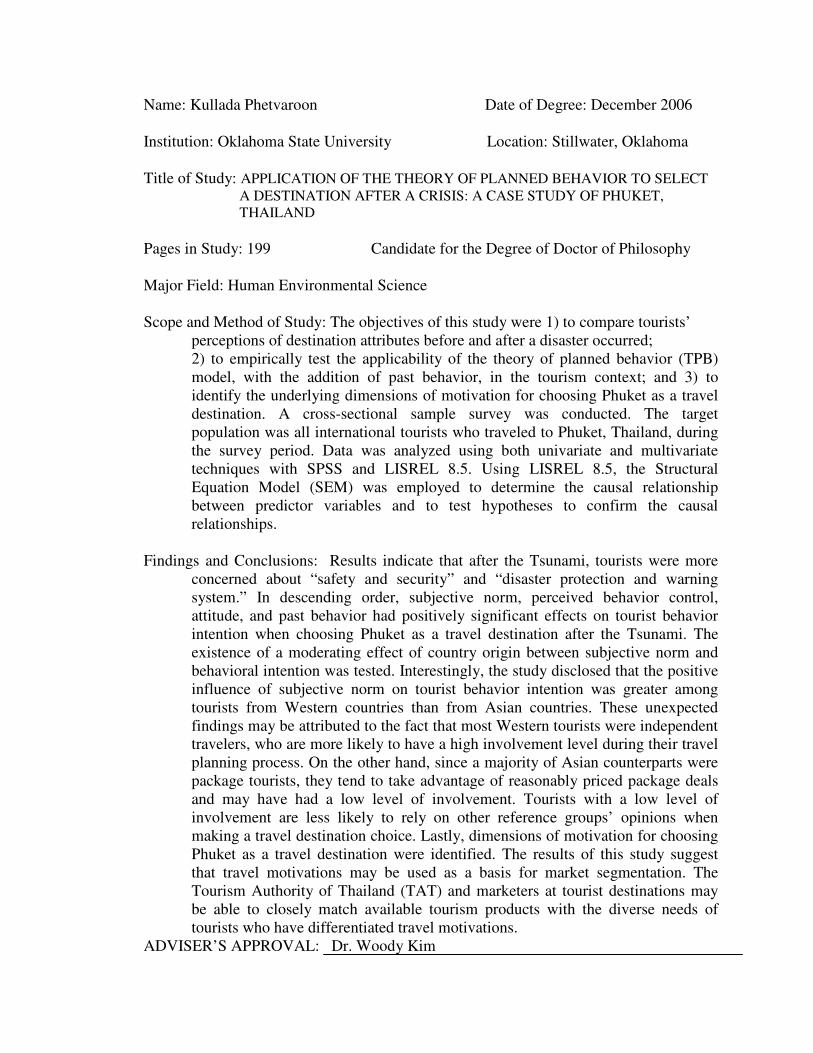
Name: Kullada Phetvaroon Date of Degree: December 2006
Institution: Oklahoma State University Location: Stillwater, Oklahoma
Title of Study: APPLICATION OF THE THEORY OF PLANNED BEHAVIOR TO SELECTA DESTINATION AFTER A CRISIS: A CASE STUDY OF PHUKET,THAILAND
Pages in Study: 199 Candidate for the Degree of Doctor of Philosophy
Major Field: Human Environmental Science
Scope and Method of Study: The objectives of this study were 1) to compare tourists’perceptions of destination attributes before and after a disaster occurred;2) to empirically test the applicability of the theory of planned behavior (TPB)model, with the addition of past behavior, in the tourism context; and 3) toidentify the underlying dimensions of motivation for choosing Phuket as a traveldestination. A cross-sectional sample survey was conducted. The targetpopulation was all international tourists who traveled to Phuket, Thailand, duringthe survey period. Data was analyzed using both univariate and multivariatetechniques with SPSS and LISREL 8.5. Using LISREL 8.5, the StructuralEquation Model (SEM) was employed to determine the causal relationshipbetween predictor variables and to test hypotheses to confirm the causalrelationships.
Findings and Conclusions: Results indicate that after the Tsunami, tourists were moreconcerned about “safety and security” and “disaster protection and warningsystem.” In descending order, subjective norm, perceived behavior control,attitude, and past behavior had positively significant effects on tourist behaviorintention when choosing Phuket as a travel destination after the Tsunami. Theexistence of a moderating effect of country origin between subjective norm andbehavioral intention was tested. Interestingly, the study disclosed that the positiveinfluence of subjective norm on tourist behavior intention was greater amongtourists from Western countries than from Asian countries. These unexpectedfindings may be attributed to the fact that most Western tourists were independenttravelers, who are more likely to have a high involvement level during their travelplanning process. On the other hand, since a majority of Asian counterparts werepackage tourists, they tend to take advantage of reasonably priced package dealsand may have had a low level of involvement. Tourists with a low level ofinvolvement are less likely to rely on other reference groups’ opinions whenmaking a travel destination choice. Lastly, dimensions of motivation for choosingPhuket as a travel destination were identified. The results of this study suggestthat travel motivations may be used as a basis for market segmentation. TheTourism Authority of Thailand (TAT) and marketers at tourist destinations maybe able to closely match available tourism products with the diverse needs oftourists who have differentiated travel motivations.
ADVISER’S APPROVAL: Dr. Woody Kim