application of systematic review in tsca risk evaluations · 3.4 data integration and summary of...
TRANSCRIPT

EPA Document# 740-P1-8001 United States Office of Chemical Safety and Environmental Protection Agency Pollution Prevention
APPLICATION OF SYSTEMATIC REVIEW
IN TSCA RISK EVALUATIONS
MAY 2018
2
TABLE OF CONTENTS
TABLE OF CONTENTS .......................................................................................................................................... 2
LIST OF TABLES ................................................................................................................................................... 4
LIST OF FIGURES ................................................................................................................................................. 7
ACKNOWLEDGEMENTS ...................................................................................................................................... 8
1 PURPOSE OF THE DOCUMENT .................................................................................................................... 9
2 SCOPING AND PROBLEM FORMULATION: ANALYTICAL FRAMEWORK GUIDING SYSTEMATIC REVIEW IN TSCA RISK EVALUATIONS ................................................................................................................................... 12
3 INTEGRATION OF SYSTEMATIC REVIEW PRINCIPLES INTO TSCA RISK EVALUATIONS ................................... 13
3.1 PROTOCOL DEVELOPMENT ................................................................................................................................ 19 3.2 DATA COLLECTION .......................................................................................................................................... 19
3.2.1 Data Search ............................................................................................................................................ 19 Summary of the Literature Search Strategy for the First Ten TSCA Risk Evaluations .................................... 21
3.2.2 Data Screening ....................................................................................................................................... 22 Title/Abstract Screening ................................................................................................................................ 23
3.2.2.1.1 Summary of the Title/Abstract Screening Conducted for the First Ten TSCA Risk Evaluations ................ 24 Full Text Screening ........................................................................................................................................ 24
3.2.2.2.1 Summary of the Full Text Screening Conducted for the First Ten TSCA Risk Evaluations ........................ 25 Data Extraction ............................................................................................................................................. 25
3.3 DATA EVALUATION .......................................................................................................................................... 26 3.4 DATA INTEGRATION AND SUMMARY OF FINDINGS ................................................................................................. 26
4 UPDATES TO THE DATA SEARCH AND SCREENING RESULTS FOR THE FIRST TEN RISK EVALUATIONS ........... 27
4.1 INITIAL DATA SEARCH ...................................................................................................................................... 27 4.2 INITIAL TITLE/ABSTRACT SCREENING ................................................................................................................... 28
5 REFERENCES ............................................................................................................................................. 29
APPENDIX A: STRATEGY FOR ASSESSING THE QUALITY OF DATA/INFORMATION SUPPORTING TSCA RISK EVALUATIONS ................................................................................................................................................... 30
A.1 EVALUATION METHOD .......................................................................................................................................... 33 A.2 DOCUMENTATION AND INSTRUCTIONS FOR REVIEWERS ............................................................................................... 34 A.3 IMPORTANT CAVEATS ........................................................................................................................................... 35 A.4 REFERENCES ........................................................................................................................................................ 36
APPENDIX B: DATA QUALITY CRITERIA FOR PHYSICAL/CHEMICAL PROPERTY DATA ........................................... 40
APPENDIX C: DATA QUALITY CRITERIA FOR FATE DATA ..................................................................................... 42
C.1 TYPES OF FATE DATA SOURCES ............................................................................................................................... 42 C.2 DATA QUALITY EVALUATION DOMAINS .................................................................................................................... 42 C.3 DATA QUALITY EVALUATION METRICS ...................................................................................................................... 43 C.4 SCORING METHOD AND DETERMINATION OF OVERALL DATA QUALITY LEVEL .................................................................. 44
C.4.1 Weighting Factors .................................................................................................................................. 45 C.4.2 Calculation of Overall Study Score ......................................................................................................... 46
C.5 DATA QUALITY CRITERIA ........................................................................................................................................ 51 C.6 REFERENCES ........................................................................................................................................................ 64
APPENDIX D: DATA QUALITY CRITERIA FOR OCCUPATIONAL EXPOSURE AND RELEASE DATA ............................ 65
D.1 TYPES OF ENVIRONMENTAL RELEASE AND OCCUPATIONAL EXPOSURE DATA SOURCES ....................................................... 65

3
D.2 DATA QUALITY EVALUATION DOMAINS .................................................................................................................... 66 D.3 DATA QUALITY EVALUATION METRICS ..................................................................................................................... 66 D.4 SCORING METHOD AND DETERMINATION OF OVERALL DATA QUALITY LEVEL .................................................................. 67
D.4.1 Weighting Factors ................................................................................................................................... 67 D.4.2 Calculation of Overall Study Score .......................................................................................................... 68
D.5 DATA SOURCES FREQUENTLY USED IN OCCUPATIONAL EXPOSURE AND RELEASE ASSESSMENTS ........................................... 69 D.6 DATA EXTRACTION TEMPLATES TO ASSIST THE DATA QUALITY EVALUATION .................................................................... 71 D.7 DATA QUALITY CRITERIA ....................................................................................................................................... 75
D.7.1 Monitoring Data .................................................................................................................................... 75 D.7.2 Environmental Release Data .................................................................................................................. 79 D.7.3 Published Models for Environmental Releases or Occupational Exposures ........................................... 83 D.7.4 Data/Information from Completed Exposure or Risk Assessments ........................................................ 86 D.7.5 Data/Information from Reports Containing Other than Exposure or Release Data .............................. 89
D.8 REFERENCES ........................................................................................................................................................ 92
APPENDIX E: DATA QUALITY CRITERIA FOR STUDIES ON CONSUMER, GENERAL POPULATION AND ENVIRONMENTAL EXPOSURE ............................................................................................................................ 93
E.1 TYPES OF CONSUMER, GENERAL POPULATION AND ENVIRONMENTAL EXPOSURE DATA SOURCES ........................................ 93 E.2 DATA QUALITY EVALUATION DOMAINS .................................................................................................................... 94 E.3 DATA QUALITY EVALUATION METRICS ...................................................................................................................... 95 E.4 SCORING METHOD AND DETERMINATION OF OVERALL DATA QUALITY LEVEL ................................................................... 96
E.4.1 Weighting Factors .................................................................................................................................. 96 E.4.2 Calculation of Overall Study Score ......................................................................................................... 96
E.5 DATA SOURCES FREQUENTLY USED IN CONSUMER, GENERAL POPULATION AND ENVIRONMENTAL EXPOSURE ASSESSMENTS .... 97 E.6 DATA QUALITY CRITERIA ........................................................................................................................................ 99
E.6.1 Monitoring Data ..................................................................................................................................... 99 E.6.2 Modeling Data ...................................................................................................................................... 108 E.6.3 Survey Data .......................................................................................................................................... 113 E.6.4 Epidemiology Data to Support Exposure Assessment .......................................................................... 119 E.6.5 Experimental Data ................................................................................................................................ 130 E.6.6 Database Data ...................................................................................................................................... 138 E.6.7 Completed Exposure Assessments and Risk Characterizations ............................................................ 143
E.7 REFERENCES ...................................................................................................................................................... 146
APPENDIX F: DATA QUALITY CRITERIA FOR ECOLOGICAL HAZARD STUDIES ..................................................... 147
F.1 TYPES OF DATA SOURCES ..................................................................................................................................... 147 F.2 DATA QUALITY EVALUATION DOMAINS ................................................................................................................... 147 F.3 DATA QUALITY EVALUATION METRICS .................................................................................................................... 148 F.4 SCORING METHOD AND DETERMINATION OF OVERALL DATA QUALITY LEVEL ................................................................. 150
F.4.1 Weighting Factors ................................................................................................................................. 150 F.4.2 Calculation of Overall Study Score ......................................................................................................... 150
F.5 DATA QUALITY CRITERIA ...................................................................................................................................... 156 F.6 REFERENCES ...................................................................................................................................................... 171
APPENDIX G: DATA QUALITY CRITERIA FOR STUDIES ON ANIMAL AND IN VITRO TOXICITY .............................. 172
G.1 TYPES OF DATA SOURCES .................................................................................................................................... 172 G.2 DATA QUALITY EVALUATION DOMAINS .................................................................................................................. 173 G.3 DATA QUALITY EVALUATION METRICS ................................................................................................................... 174 G.4 SCORING METHOD AND DETERMINATION OF OVERALL DATA QUALITY LEVEL ................................................................ 176
G.4.1 Weighting Factors ................................................................................................................................. 177 G.4.2 Calculation of Overall Study Score ........................................................................................................ 179
G.5 DATA QUALITY CRITERIA..................................................................................................................................... 186

4
G.5.1 Animal Toxicity Studies ......................................................................................................................... 186 G.5.2 In Vitro Toxicity Studies ......................................................................................................................... 205
G.6 REFERENCES ..................................................................................................................................................... 221
APPENDIX H: DATA QUALITY CRITERIA FOR EPIDEMIOLOGICAL STUDIES ......................................................... 223
H.1 TYPES OF DATA SOURCES .................................................................................................................................... 223 H.2 DATA QUALITY EVALUATION DOMAINS .................................................................................................................. 223 H.3 DATA QUALITY EVALUATION METRICS ................................................................................................................... 224 H.4 SCORING METHOD AND DETERMINATION OF OVERALL DATA QUALITY LEVEL ................................................................ 225
H.4.1 Weighting Factors ................................................................................................................................. 225 H.4.2 Calculation of Overall Study Score ........................................................................................................ 226
H.5 DATA QUALITY CRITERIA ..................................................................................................................................... 231 H.6 REFERENCES ..................................................................................................................................................... 247
LIST OF TABLES
Table A-1. Definition of Overall Quality Levels and Corresponding Quality Scores .................................................... 34
Table A-2. Documentation Template for Reviewer and Data/Information Source .................................................... 34
Table B-1. Evaluation Metrics and Ratings for Physical-Chemical Property Data ....................................................... 40
Table C-1. Types of Fate Data ...................................................................................................................................... 42
Table C-2. Data Evaluation Domains and Definitions for Fate Data ............................................................................ 43
Table C-3. Summary of Metrics for the Fate Data Evaluation Domains ...................................................................... 44
Table C-4. Fate Metrics with Greater Importance in the Evaluation and Rationale for Selection .............................. 45
Table C-6. Scoring Example for Abiotic Fate Data (i.e., hydrolysis data) with All Applicable Metrics Scored .................................................................................................................................................... 48
Table C-7. Scoring Example for Abiotic Fate Data (i.e., hydrolysis data) with Some Metrics Not Rated/Not Applicable ............................................................................................................................. 49
Table C-8. Scoring Example for QSAR Data .................................................................................................................. 50
Table C-9. Serious Flaws that Would Make Fate Data Unacceptable for Use in the Fate Assessment ....................... 51
Table C-10. Data Quality Criteria for Fate Data ........................................................................................................... 52
Table D-1. Types of Occupational Exposure and Environmental Release Data Sources ............................................. 65
Table D-2. Data Evaluation Domains and Definitions .................................................................................................. 66
Table D-3. Summary of Quality Metrics for the Five Types of Data Sources ............................................................... 66
Table D-4. Metric Weighting Factors and Range of Weighted Metric Scores for Scoring the Quality of Environmental Release and Occupational Data ..................................................................................... 68
Table D-5. Scoring Example for Published Models where Sample Size is Not Applicable ........................................... 69
Table D-6. Examples of Data Sources Frequently Used in Occupational Exposure and Release Data ........................ 70
Table D-7. Data Extraction and Evaluation Template for General Life Cycle and Facility Data ................................... 72
Table D-8. Data Extraction and Evaluation Template for Occupational Exposure Data .............................................. 73
Table D-9. Data Extraction and Evaluation Template for Environmental Release Data .............................................. 74
Table D-10. Serious Flaws that Would Make Monitoring Data Unacceptable for Use in the Environmental Release and Occupational Exposure Assessment .......................................................... 75

5
Table D-11. Evaluation Criteria for Monitoring Data .................................................................................................. 76
Table D-12. Serious Flaws that Would Make Environmental Release Data Unacceptable for Use in the Environmental Release Assessment ....................................................................................................... 79
Table D-13. Evaluation Criteria for Environmental Release Data ................................................................................ 80
Table D-14. Serious Flaws that Would Make Published Models Unacceptable for Use in the Environmental Release and Occupational Exposure Assessment .......................................................... 83
Table D-15. Evaluation Criteria for Published Models ................................................................................................. 84
Table D-16. Serious Flaws that Would Make Data/Information from Completed Exposure or Risk Assessments Unacceptable for Use in the Environmental Release and Occupational Exposure Assessment ............................................................................................................................. 86
Table D-17. Evaluation Criteria for Data/Information from Completed Exposure or Risk Assessments ..................... 87
Table D-18. Serious Flaws that Would Make Data / Information from Reports Containing Other than Exposure or Release Data Unacceptable for Use in the Environmental Release and Occupational Exposure Assessment ....................................................................................................... 89
Table D-19. Evaluation Criteria for Data /Information Reports Containing Other than Exposure or Release Data ........................................................................................................................................... 90
Table E-1. Types of Exposure Data Sources ................................................................................................................. 93
Table E-2. Data Evaluation Domains and Definitions .................................................................................................. 94
Table E-3. Summary of Metrics for the Seven Data Types .......................................................................................... 95
Table E-4.Scoring Example for Monitoring Data .......................................................................................................... 97
Table E-5. Examples of Data Sources Frequently Used for Consumer, General Population and Environmental Exposure Assessments ................................................................................................... 98
Table E-6. Serious Flaws that Would Make Sources of Monitoring Data Unacceptable for Use in the Exposure Assessment ............................................................................................................................. 99
Table E-7. Evaluation Criteria for Sources of Monitoring Data .................................................................................. 100
Table E-8. Serious Flaws that Would Make Sources of Modeling Data Unacceptable for Use in the Exposure Assessment ........................................................................................................................... 108
Table E-9. Evaluation Criteria for Sources of Modeling Data .................................................................................... 109
Table E-10. Serious Flaws that Would Make Sources of Survey Data Unacceptable for Use in the Exposure Assessment ........................................................................................................................... 113
Table E-11. Evaluation Criteria for Source of Survey Data ........................................................................................ 114
Table E-12. Serious Flaws that Would Make Sources of Epidemiology Data Unacceptable for Use in the Exposure Assessment .................................................................................................................... 119
Table E-13. Evaluation Criteria for Sources of Epidemiology Data to Support the Exposure Assessment ................ 120
Table E-14. Serious Flaws that Would Make Sources of Experimental Data Unacceptable for Use in the Exposure Assessment .................................................................................................................... 130
Table E-15. Evaluation Criteria for Sources of Experimental Data ............................................................................ 131
Table E-16. List of Serious Flaws that Would Make Completed Exposure Assessments and Risk Characterizations Unacceptable for Use in the Exposure Assessment ................................................ 143
Table E-17. Evaluation Criteria for Completed Exposure Assessments and Risk Characterizations .......................... 143
Table E-18. Serious Flaws that Would Make Sources of Database Data Unacceptable for Use in the Exposure Assessment ........................................................................................................................... 138
6
Table E-19. Evaluation Criteria for Sources of Database Data ................................................................................... 139
Table F-1. Study Types that Provide Ecological Hazard Data ..................................................................................... 147
Table F-2. Data Evaluation Domains and Definitions ................................................................................................ 148
Table F-3. Data Evaluation Domains and Metrics for Ecological Hazard Studies ...................................................... 149
Table F-4. Ecological Hazard Metrics with Greater Importance in the Evaluation and Rationale for Selection ............................................................................................................................................... 152
Table F-5. Metric Weighting Factors and Range of Weighted Metric Scores for Ecological Hazard Studies .................................................................................................................................................. 153
Table F-6. Scoring Example for an Ecological Hazard Study with all Metrics Scored ................................................ 154
Table F-7. Scoring Example for an Ecological Hazard with Some Metrics Not Rated/Not Applicable ...................... 155
Table F-8. Serious Flaws that Would Make Ecological Hazard Studies Unacceptable ............................................... 156
Table F-9. Data Quality Criteria for Ecological Hazard Studies ................................................................................. 159
Table G-1. Types of Animal and In Vitro Toxicity Data .............................................................................................. 172
Table G-2. Data Evaluation Domains and Definitions ................................................................................................ 173
Table G-3. Data Evaluation Domains and Metrics for Animal Toxicity Studies ......................................................... 175
Table G-4. Data Evaluation Domains and Metrics for In Vitro Toxicity Studies ......................................................... 176
Table G-5. Animal Toxicity Metrics with Greater Importance in the Evaluation and Rationale for Selection ............................................................................................................................................... 177
Table G-6. In Vitro Toxicity Metrics with Greater Importance in the Evaluation and Rationale for Selection ............................................................................................................................................... 178
Table G-7. Metric Weighting Factors and Range of Weighted Metric Scores for Animal Toxicity Studies ............... 180
Table G-8. Metric Weighting Factors and Range of Weighted Metric Scores for In Vitro Toxicity Studies ............... 181
Table G-9. Scoring Example for Animal Toxicity Study with all Metrics Scored........................................................ 182
Table G-10. Scoring Example for Animal Toxicity Study with Some Metrics Not Rated/Not Applicable .................. 183
Table G-11. Scoring Example for In Vitro Study with all Metrics Scored .................................................................. 184
Table G-12. Scoring Example for In Vitro Study with Some Metrics Not Rated/Not Applicable .............................. 185
Table G-13. Serious Flaws that Would Make Animal Toxicity Studies Unacceptable ................................................ 186
Table G-14. Data Quality Criteria for Animal Toxicity Studies ................................................................................... 190
Table G-15. Serious Flaws that Would Make In Vitro Toxicity Studies Unacceptable .............................................. 205
Table G-16. Data Quality Criteria for In Vitro Toxicity Studies .................................................................................. 208
Table H-1. Types of Epidemiological Studies ............................................................................................................. 223
Table H-2. Data Evaluation Domains and Definitions ................................................................................................ 223
Table H-3. Summary of Metrics for the Seven Data Types ........................................................................................ 224
Table H-4. Epidemiology Metrics with Greater Importance in the Evaluation and Rationale for Selection ............................................................................................................................................... 226
Table H-5. Summary of Domain, Metrics, and Weighting Approach with Biomarkers ............................................. 228
Table H-6. Summary of Domain, Metrics, and Weighting Approach for Studies without Biomarkers ...................... 229
Table H-7. Example of Scoring for Epidemiologic Studies where Sample Size is Not Applicable .............................. 230
Table H-8. Serious Flaws that Would Make Epidemiological Studies Unacceptable for Use in the

7
Hazard Assessment .............................................................................................................................. 231
Table H-9. Evaluation Criteria for Epidemiological Studies ....................................................................................... 234
LIST OF FIGURES
Figure 1-1. Road Map for Implementing Systematic Review for the First Ten TSCA Risk Evaluations ........................ 11
Figure 3-1. TSCA Systematic Review Process ............................................................................................................... 15

8
ACKNOWLEDGEMENTS
This document was developed by the United States Environmental Protection Agency (U.S. EPA), Office of Chemical Safety and Pollution Prevention (OCSPP), Office of Pollution Prevention and Toxics (OPPT). The OPPT Assessment Team gratefully acknowledges participation and/or input from Intra-agency reviewers that included multiple offices within EPA, Inter-agency reviewers that included multiple Federal agencies, and assistance from EPA contractors GDIT (Contract No. CIO-SP3, HHSN316201200013W), ERG (Contract No. EP-W-12-006), ICF (Contract No. EP-C-14-001) and SRC (Contract No. EP-W-12-003) and Versar (Contract No. EP-W-17-006). Docket This document can be found in EPA docket number EPA-HQ-OPPT-2018-0210. A copy of the document is also placed in the following dockets:
Chemical Substance Docket Number
Asbestos EPA-HQ-OPPT-2016-0736
1-Bromopropane (1-BP) EPA-HQ-OPPT-2016-0741
Carbon Tetrachloride (CCl4) EPA-HQ-OPPT-2016-0733
1,4-Dioxane EPA-HQ-OPPT-2016-0723
Cyclic Aliphatic Bromide Cluster (HBCD) EPA-HQ-OPPT-2016-0735
Methylene Chloride EPA-HQ-OPPT-2016-0742
N-Methylpyrolidone (NMP) EPA-HQ-OPPT-2016-0743
Perchloroethylene (PERC) EPA-HQ-OPPT-2016-0732
Pigment Violet 29 (Anthra[2,1,9-def:6,5,10-d’e’f’]diisoquinoline-1,3,8,10(2H,9H)-tetrone; PV29)
EPA-HQ-OPPT-2016-0725
Trichloroethylene (TCE) EPA-HQ-OPPT-2016-0737
9
1 PURPOSE OF THE DOCUMENT
The U.S. EPA’s Office of Pollution Prevention and Toxics (EPA/OPPT) generally intends to apply systematic review principles1 in the development of risk evaluations under the amended Toxic Substances Control Act (TSCA). This internal guidance sets out general principles to guide EPA’s application of systematic review in the risk evaluation process for the first ten chemicals (Table 3-2), which EPA/OPPT initiated on December 19, 2016, as well as future evaluations. Integrating systematic review principles into the TSCA risk evaluation process is critical to develop transparent, reproducible and scientifically credible risk evaluations. EPA/OPPT plans to implement a structured process of identifying, evaluating and integrating evidence for both the hazard and exposure assessments developed during the TSCA risk evaluation process. It is expected that new approaches and/or methods will be developed to address specific assessment needs for the relatively large and diverse chemical space under TSCA. Thus, EPA/OPPT expects to document the progress of implementing systematic review in the draft risk evaluations and through revisions of this document and publication of supplemental documents. EPA invites the public to provide input on this document at www.regulations.gov, docket# EPA-HQ-OPPT-2018-0210. The public can also contact EPA about questions about this document at [email protected]. Supplemental documents, released in June 2017, already document the data collection and screening activities for the first ten chemicals (Table 3-2). This document is the next supplemental publication containing details about the general principles that will guide EPA/OPPT in carrying out the systematic review process along with the strategy for assessing data quality that EPA/OPPT generally plans to use for the TSCA risk evaluations. This document only provides the general expectations for evidence synthesis and integration. Additional details on the approach for the evidence synthesis and integration will be included with the publication of the draft TSCA risk evaluations. Figure 1-1 displays a general roadmap for implementing systematic review in the TSCA risk evaluation process for the first ten chemicals. Ultimately, the goal is to establish an efficient systematic review process that generates high-quality, fit-for-purpose risk evaluations that rely on the best available science and the weight of the scientific evidence within the context of TSCA. The information and procedures set forth in this document are intended as a technical resource to those conducting TSCA risk evaluations for existing chemicals. This internal guidance does not constitute rulemaking by the U.S. EPA, and cannot be relied on to create a substantive or procedural right enforceable by any party in litigation with the United States. Non-mandatory language such as “should” provides recommendations and does not impose any legally binding requirements. Similarly, statements about what EPA expects or intends to do reflect general principles to guide EPA’s activities and not judgments or determinations as to what EPA will do
1 This document refers to “principle” as a key concept or element guiding the series of steps (or processes) to
achieve incorporation of systematic review approaches and/or methods in TSCA risk evaluations.

10
in any particular case. This document is not necessarily applicable to risk assessments developed to support other EPA’s statutes or programs. EPA expects to make changes to this living document at any time and therefore this document may be revised periodically. EPA welcomes public input on this document at any time. Reference herein to any specific commercial products, process, or service by trade name, trademark, manufacturer, or otherwise, does not necessarily constitute or imply its endorsement, recommendation, or favoring by the United States Government.

11
Figure 1-1. Road Map for Implementing Systematic Review for the First Ten TSCA Risk Evaluations
Notes for Figure 1-1:
Important milestones are numbered and depicted in upper case letters. Although dates would be different, milestones are also applicable for the future TSCA risk evaluations.
Star symbols are next to those activities or technical documents that are related to the implementation of systematic review.
Activities between milestones #3 and #6 show estimated timelines that are subject to change.
There are multiple points in the process for public input.
12
2 SCOPING AND PROBLEM FORMULATION: ANALYTICAL FRAMEWORK GUIDING SYSTEMATIC REVIEW IN TSCA RISK EVALUATIONS
Scoping and problem formulation are important steps in providing the analytical framework for the systematic review efforts supporting the TSCA risk evaluations. Scoping and problem formulation are the first stages of the TSCA risk evaluation process and are intended to convey EPA/OPPT’s expectations regarding the overall scope, level of detail, and approach for the risk evaluation. This initial planning effort is critical to developing clear objectives and assessment questions to support quantitative risk analyses, and to defining the steps that EPA/OPPT expects to take to conduct the different components of the risk evaluation. Scoping and problem formulation helps shape the systematic review approaches and/or methods that will be used to identify, evaluate, analyze, and integrate evidence. For example, the outcomes of scoping and problem formulation are used to tailor a data search and screening strategy (including eligibility criteria) to identify relevant data and information while winnowing out those that are irrelevant for the risk evaluation. TSCA requires EPA to publish the scope for any risk evaluation it will conduct. Further, TSCA requires the scope to include the hazards, exposures, conditions of use, and the potentially exposed or susceptible subpopulations2 that EPA expects to consider. To communicate and visually convey the relationships between these components, the final rule Procedures for Chemical Risk Evaluation Under the Amended Toxic Substances Control Act (40 CFR Part 702) requires including a conceptual model and an analysis plan for each risk evaluation. Under EPA’s risk assessment guidance, the conceptual model and the analysis plan are the outcomes of conducting problem formulation (U.S. EPA, 2014, 1998, 1992). Through the conceptual model and the analysis plan, problem formulation describes the exposure pathways, receptors and health endpoints that EPA/OPPT expects to consider in the risk evaluations (U.S. EPA, 2014, 1998, 1992). The conceptual model(s) illustrate the exposure pathways, receptor populations and effects that EPA expects to consider in the risk evaluation. An analysis plan presents the proposed approach for the risk evaluation. Hence, problem formulation has essentially the same function as scoping under the amended TSCA, thereby aligning the requirements of the scope for a TSCA risk evaluation with the components of a problem formulation in EPA guidance (U.S. EPA, 2014, 1998, 1992).
2 Potentially exposed or susceptible subpopulation means a group of individuals within the general population
identified by the Agency who, due to either greater susceptibility or greater exposure, may be at greater risk than the general population of adverse health effects from exposure to a chemical substance or mixture, such as infants, children, pregnant women, workers, or the elderly (15 U.S.C. 2602 or 40 CFR Part 702.33).

13
With this context in mind, the systematic review activities for the TSCA risk evaluations will be guided by the results of problem formulation, as documented in the TSCA scope documents3. It is expected that the systematic review principles and general processes remain relatively the same across risk evaluations. However, systematic review methods and/or approaches, including criteria, will be customized, as necessary, to meet the assessment needs of each risk evaluation. Details about the fit-for-purpose systematic review methods and/or approaches will be in the draft risk evaluation and its supporting documents. EPA/OPPT is currently implementing systematic review methods and/or approaches in a step-wise fashion in parallel with conducting the phases of the risk evaluation. The phased approach is necessary given the statutory timeframes imposed on EPA. Each of the steps of systematic review is being published in parallel, as supplemental documents, along with steps in the risk evaluation. EPA/OPPT may consolidate the information made available through the various supplemental documents in the future.
3 INTEGRATION OF SYSTEMATIC REVIEW PRINCIPLES INTO TSCA RISK EVALUATIONS
The Agency described systematic review in the preamble to the final rule Procedures for Chemical Risk Evaluation Under the Amended Toxic Substances Control Act, 82 FR 33726 (July 20, 2017), and in the preamble to the proposed rule, 82 FR 7562 (Jan. 19, 2017). The following two paragraphs are an excerpt from the final rule.
As defined by the Institute of Medicine, systematic review “is a scientific investigation that focuses on a specific question and uses explicit, pre-specified scientific methods to identify, select, assess, and summarize the findings of similar but separate studies” (National Academy of Sciences, 2017). The goal of systematic review methods is to ensure that the review is complete, unbiased, reproducible, and transparent (Bilotta et al., 2014). The principles of systematic review have been well developed in the context of evidence-based medicine (e.g., evaluating efficacy in clinical trials) (Higgins and Green, 2011) and are being adapted for use across a more diverse array of systematic review questions, through the use of a variety of computational tools. For instance, the National Academies’ National Research Council (NRC) has encouraged EPA to move towards systematic review processes to enhance the transparency of scientific literature review that support chemical-specific risk assessments to inform regulatory decision making (Process et al., 2014). Key elements of systematic review include:
A clearly stated set of objectives (defining the question)
Developing a protocol that describes the specific criteria and approaches that will
3 TSCA problem formulation documents were developed for the first ten chemicals undergoing risk evaluation and
refine the scope of the initial TSCA scope documents. They were published as an additional interim step prior to publication of the draft risk evaluations for the first ten chemicals.

14
be used throughout the process
Applying the search strategy in a literature search
Selecting the relevant papers using predefined criteria
Assessing the quality of the studies using predefined criteria
Analyzing and synthesizing the data using the predefined methodology
Interpreting the results and presenting a summary of findings TSCA requires that EPA use data and/or information (hereinafter referred to as data/information) in a manner consistent with the best available science and that EPA base decisions on the weight of the scientific evidence. To meet the TSCA science standards, EPA/OPPT will be guided by the systematic review process described in Figure 3-1. This process complements the risk evaluation process in that the data collection, data evaluation and data integration stages of the systematic review process are used to develop the exposure and hazard assessments. As risk is a function of exposure and hazard, the exposure and hazard assessments are combined to support the integrative risk characterization, which ultimately supports the risk determination. Although not shown in Figure 3-1, iteration is a natural component of the systematic review and risk evaluation processes. There could be different reasons triggering iteration such as the failure of retrieving relevant data and information after the initial search and screening activities, which would require repeating the data collection stage of the systematic review process, or refinements to the initial search, screening and extraction strategies. A short description of each stage of the systematic review process is provided in sections 3.1 through 3.4. Table 3-1 describes EPA’s general expectations for the planning, execution and assessment activities related to each stage of the systematic review process. The activities are general enough to be applied to multiple data/information streams supporting the TSCA risk evaluations.

15
Figure 3-1. TSCA Systematic Review Process4
4 Diagram depicts systematic review process to guide the first ten TSCA risk evaluations. It is anticipated that the same basic process will be used to guide
future risk evaluations with some potential refinements reflecting efficiencies and other adjustments adopted as EPA/OPPT gains experience in implementing systematic review methods and/or approaches to support risk evaluations within statutory deadlines (e.g., aspects of protocol development would be better defined prior to starting scoping/problem formulation).
16
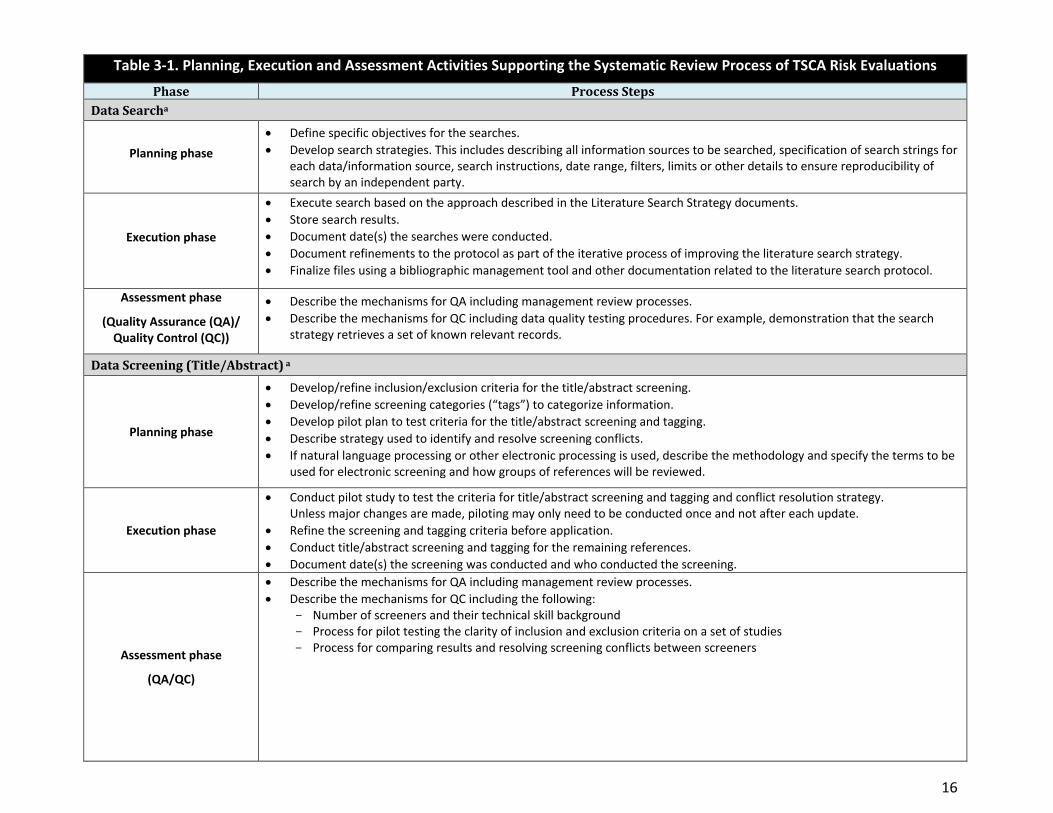
Table 3-1. Planning, Execution and Assessment Activities Supporting the Systematic Review Process of TSCA Risk Evaluations
Phase Process Steps
Data Searcha
Planning phase
Define specific objectives for the searches.
Develop search strategies. This includes describing all information sources to be searched, specification of search strings for each data/information source, search instructions, date range, filters, limits or other details to ensure reproducibility of search by an independent party.
Execution phase
Execute search based on the approach described in the Literature Search Strategy documents.
Store search results.
Document date(s) the searches were conducted.
Document refinements to the protocol as part of the iterative process of improving the literature search strategy.
Finalize files using a bibliographic management tool and other documentation related to the literature search protocol.
Assessment phase
(Quality Assurance (QA)/ Quality Control (QC))
Describe the mechanisms for QA including management review processes.
Describe the mechanisms for QC including data quality testing procedures. For example, demonstration that the search strategy retrieves a set of known relevant records.
Data Screening (Title/Abstract) a
Planning phase
Develop/refine inclusion/exclusion criteria for the title/abstract screening.
Develop/refine screening categories (“tags”) to categorize information.
Develop pilot plan to test criteria for the title/abstract screening and tagging.
Describe strategy used to identify and resolve screening conflicts.
If natural language processing or other electronic processing is used, describe the methodology and specify the terms to be used for electronic screening and how groups of references will be reviewed.
Execution phase
Conduct pilot study to test the criteria for title/abstract screening and tagging and conflict resolution strategy. Unless major changes are made, piloting may only need to be conducted once and not after each update.
Refine the screening and tagging criteria before application.
Conduct title/abstract screening and tagging for the remaining references.
Document date(s) the screening was conducted and who conducted the screening.
Assessment phase
(QA/QC)
Describe the mechanisms for QA including management review processes.
Describe the mechanisms for QC including the following: Number of screeners and their technical skill background Process for pilot testing the clarity of inclusion and exclusion criteria on a set of studies Process for comparing results and resolving screening conflicts between screeners

17
Table 3-1. Planning, Execution and Assessment Activities Supporting the Systematic Review Process of TSCA Risk Evaluations
Phase Process Steps Data Screening (Full Text) a
Planning phase
Develop/refine inclusion/exclusion criteria for the full text screening.
Develop/refine screening categories (“tags”) to categorize information.
Develop pilot plan to test criteria for the full text data screening and tagging.
Describe strategy used to identify and resolve screening conflicts.
If natural language processing or other electronic processing is used, describe the methodology and specify the terms to be used for electronic screening and how groups of references will be reviewed.
Execution phase
Conduct pilot study to test the criteria for full text screening and tagging and conflict resolution strategy. Unless major changes are made, piloting may only need to be conducted once and not after each update.
Refine the screening and tagging criteria before application.
Conduct full text screening and tagging for the remaining references.
Document date(s) the screening was conducted and who conducted the screening.
Assessment phase
(QA/QC)
Describe the mechanisms for QA including management review processes.
Describe the mechanisms for QC including the following: Number of screeners and their technical skill background Process for pilot testing the clarity of inclusion and exclusion criteria on a set of studies
Process for comparing results and resolving screening conflicts between screeners Data Extractiona
Planning Phase
Develop extraction templates preferably from existing examples (e.g., graphical or tabular displays) that capture specific attributes or data elements relevant for disciplines within the risk assessment. Templates should be designed to facilitate evaluation of the data and their synthesis with minimal reference to the original reference. Data/information will need to be tracked with unique identifies.
Use an extraction process that ensures access to the extracted information by EPA and the public.
Develop instructions and decision rules (e.g., what to extract/not extract under certain conditions) to be included in the template form to facilitate data extraction.
Specify number and expertise of reviewers involved in the data extraction process.
Select initial set of citations for training to promote data extraction in a consistent manner across reviewers.
Identify tool(s) for managing extracted data and decisions (e.g., spreadsheet, database).
Execution Phase
Conduct pilot study to test the extraction process and conflict resolution strategy. Unless major changes are made, piloting may only need to be conducted once and not after each update.
Extract data/information using pre-defined templates.
Assessment phase
(QA/QC)
Describe the mechanisms for QA for data extraction process including management review processes.
Describe the mechanisms for QC including the following: Number of data extraction staff and their technical skill background Process for pilot testing the data extraction and conflict resolution
18
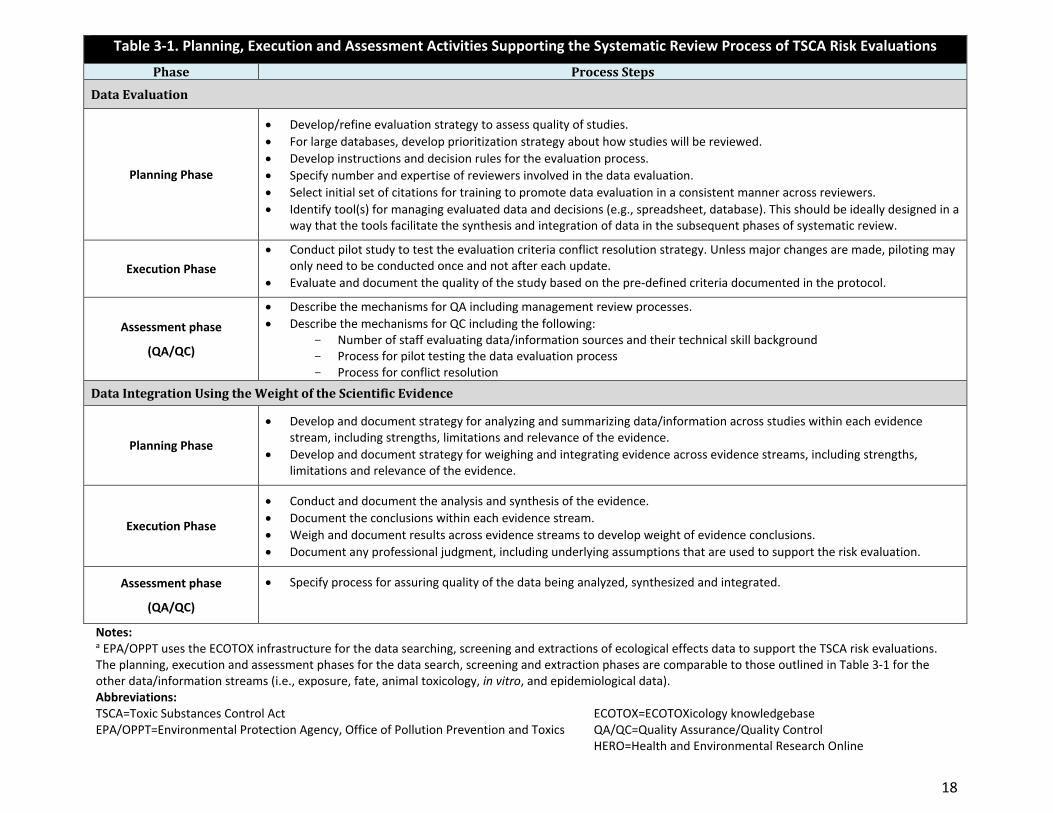
Table 3-1. Planning, Execution and Assessment Activities Supporting the Systematic Review Process of TSCA Risk Evaluations
Phase Process Steps
Data Evaluation
Planning Phase
Develop/refine evaluation strategy to assess quality of studies.
For large databases, develop prioritization strategy about how studies will be reviewed.
Develop instructions and decision rules for the evaluation process.
Specify number and expertise of reviewers involved in the data evaluation.
Select initial set of citations for training to promote data evaluation in a consistent manner across reviewers.
Identify tool(s) for managing evaluated data and decisions (e.g., spreadsheet, database). This should be ideally designed in a way that the tools facilitate the synthesis and integration of data in the subsequent phases of systematic review.
Execution Phase
Conduct pilot study to test the evaluation criteria conflict resolution strategy. Unless major changes are made, piloting may only need to be conducted once and not after each update.
Evaluate and document the quality of the study based on the pre-defined criteria documented in the protocol.
Assessment phase
(QA/QC)
Describe the mechanisms for QA including management review processes.
Describe the mechanisms for QC including the following: Number of staff evaluating data/information sources and their technical skill background Process for pilot testing the data evaluation process Process for conflict resolution
Data Integration Using the Weight of the Scientific Evidence
Planning Phase
Develop and document strategy for analyzing and summarizing data/information across studies within each evidence stream, including strengths, limitations and relevance of the evidence.
Develop and document strategy for weighing and integrating evidence across evidence streams, including strengths, limitations and relevance of the evidence.
Execution Phase
Conduct and document the analysis and synthesis of the evidence.
Document the conclusions within each evidence stream.
Weigh and document results across evidence streams to develop weight of evidence conclusions.
Document any professional judgment, including underlying assumptions that are used to support the risk evaluation.
Assessment phase
(QA/QC)
Specify process for assuring quality of the data being analyzed, synthesized and integrated.
Notes: a EPA/OPPT uses the ECOTOX infrastructure for the data searching, screening and extractions of ecological effects data to support the TSCA risk evaluations. The planning, execution and assessment phases for the data search, screening and extraction phases are comparable to those outlined in Table 3-1 for the other data/information streams (i.e., exposure, fate, animal toxicology, in vitro, and epidemiological data). Abbreviations: TSCA=Toxic Substances Control Act EPA/OPPT=Environmental Protection Agency, Office of Pollution Prevention and Toxics
ECOTOX=ECOTOXicology knowledgebase QA/QC=Quality Assurance/Quality Control HERO=Health and Environmental Research Online

19
3.1 Protocol Development
Protocol Development is intended to pre-specify the criteria, approaches and/or methods for data collection, data evaluation and data integration. It is important to plan the systematic review approaches and methods in advance to reduce the risk of introducing bias into the risk evaluation process. TSCA requirements and the results of scoping/problem formulation (i.e., conceptual model(s), analysis plan) frame the specific scientific risk assessment questions to be addressed in each TSCA risk evaluation. Likewise, the statutory requirements and scoping/problem formulation inform how the data are searched, evaluated and integrated in the assessment. The TSCA Scope and Problem Formulation documents for the first ten risk evaluations contain the analytical framework guiding the systematic review process and should be consulted to understand the context of this document. The timeframe for development of the TSCA Scope documents has been very compressed. The first ten chemical substances were not subject to prioritization, the process through which EPA expects to collect and screen much of the relevant information about chemical substances that will be subject to the risk evaluation process. As a result, EPA had limited ability to develop a protocol document detailing the systematic review approaches and/or methods prior to the initiation of the risk evaluation process for the first ten chemical substances. For these reasons, the protocol development is staged in phases while conducting the assessment work. Figure 1-1 and Table 3-2 provide information about those components of the systematic review process released to the public and those that are in the pipeline for development (e.g., data integration). Data integration activities for the first ten TSCA risk evaluation are anticipated to occur after the TSCA Problem Formulation documents are released (Figure 1-1). EPA/OPPT will provide further details about the data integration strategy along with the publication of the draft TSCA risk evaluations.
3.2 Data Collection
3.2.1 Data Search
Data are collected under a defined literature search strategy that is developed to fit the needs of the different disciplines supporting the risk evaluation (e.g., physical/chemical properties, environmental fate, engineering processes across the full life cycle of the chemical substance, exposure, human health hazard, environmental hazard). This step includes developing strategies for searching and identifying relevant data that are published in public databases (e.g., PubMed) and other sources containing unpublished or published data. The process steps are generally described in Table 3-1, which lists the planning, execution and assessment activities supporting the data search activities for the TSCA risk evaluation process.

20
Table 3-2 provides web links to the Strategy for Conducting Literature Searches and Bibliography documents published in June 2017 along with each of the first ten TSCA Scope documents. EPA/OPPT’s initial methods for identifying, compiling, and screening publicly available information are described in the Strategy for Conducting Literature Searches supporting each of the TSCA Scope documents for the first ten chemicals. The literature search and screening strategy already published will be used for future risk evaluations.
Table 3-2. Supplemental Documents on Systematic Review Activities Published with the TSCA Scope Documents on June 22, 2017
Chemical Name CASRN Docket Number
Web link to TSCA Scope, Literature
Search Strategy and Bibliography Documents
Asbestos 1332-21-4 EPA-HQ-OPPT-2016-0736 Link
1-Bromopropane (1-BP)
106-94-5 EPA-HQ-OPPT-2016-0741 Link
Carbon Tetrachloride (CCl4)
56-23-5 EPA-HQ-OPPT-2016-0733 Link
1,4-Dioxane 123-91-1 EPA-HQ-OPPT-2016-0723 Link
Cyclic Aliphatic Bromide Cluster
(HBCD)
25637-99-4; 3194-55-6; and 3194-57-8
EPA-HQ-OPPT-2016-0735 Link
Methylene Chloride 75-09-2 EPA-HQ-OPPT-2016-0742 Link
N-Methylpyrolidone (NMP)
872-50-4 EPA-HQ-OPPT-2016-0743 Link
Perchloroethylene (PERC)
127-18-4 EPA-HQ-OPPT-2016-0732 Link
Pigment Violet 29 (Anthra[2,1,9-
def:6,5,10-d’e’f’]diisoquinoline-
1,3,8,10(2H,9H)-tetrone; PV29)
81-33-4 EPA-HQ-OPPT-2016-0725 Link
Trichloroethylene (TCE)
79-01-6 EPA-HQ-OPPT-2016-0737 Link
EPA/OPPT uses the infrastructure of the ECOTOXicology knowledgebase (U.S. EPA, 2018a) to identify single chemical toxicity data for aquatic life and terrestrial life. It uses a comprehensive chemical-specific literature search of the open literature that is conducted according to Standard Operating Procedures (SOPs)5, including specific SOPs to fit the needs of the TSCA risk
5 The ECOTOX SOPs can be found at https://cfpub.epa.gov/ecotox/help.cfm?helptabs=tab4.
21
evaluations6. The search strategy is revised on a regular basis to ensure that high quality ecological effects data are retrieved to support the risk assessment needs of various EPA programs. Due to its well-established methods to gather high quality data, ECOTOX processes and data are widely accepted and used by a variety of domestic and international organizations and researchers. The ECOTOX literature search strategy is documented in the Strategy for Conducting Literature Searches documents for each of the ten TSCA risk evaluations (Table 3-2). EPA/OPPT also plans to search its internal databases for data and information submitted under TSCA (e.g., unpublished industry data). EPA will consider these data in the risk evaluations where relevant and whether or not they are claimed as confidential business information (CBI). If data/information are CBI, EPA/OPPT plans to use it in a manner that protects the confidentiality of the information from public disclosure. The results of the literature search are entered into the EPA’s Health Environmental Research Online (HERO) database7 where the literature results are stored in chemical-specific pages. HERO also allows categorizing and sorting references by pre-defined topic areas. EPA/OPPT anticipates that the HERO project pages will be accessible to the public by the publication date of the draft risk evaluations. EPA/OPPT plans to consider relevant data/information that are submitted by the public or peer reviewers. EPA/OPPT may conduct targeted supplemental searches to support the analytical approaches and/or methods in the TSCA risk evaluation (e.g., to locate specific information for exposure modeling) or identify new data/information published after the date limits of the initial search. In addition, retracted studies may be also identified during the process of developing the risk evaluations. EPA/OPPT does not plan to use retracted studies in the TSCA risk evaluations.
Summary of the Literature Search Strategy for the First Ten TSCA Risk Evaluations
EPA/OPPT conducted chemical-specific searches for data and information on: physical and chemical properties; environmental fate and transport; conditions of use information; environmental and human exposures, including potentially exposed or susceptible subpopulations; ecological and human health hazard, including potentially exposed or susceptible subpopulations. EPA/OPPT designed its initial data search to be broad enough to capture a comprehensive set of sources containing data/information potentially relevant to the risk evaluation process. Generally, the search was conducted on a wide range of data/information sources, including
6 The ECOTOX SOPs for TSCA work can be found at
https://cfpub.epa.gov/ecotox/blackbox/help/OPPTRADCodingGuidelinesSOP.pdf and https://cfpub.epa.gov/ecotox/blackbox/help/OPPTRADReportsSOP.pdf.
7 HERO=Health and Environmental Research Online, https://hero.epa.gov/hero/index.cfm/content/home

22
but not limited to peer-reviewed and grey literature8. When available, EPA/OPPT relied on the search strategies from recent assessments (e.g., EPA Integrated Risk Information System (IRIS) assessments) as a starting point to identify relevant references and supplemented these searches to identify relevant information published after the end date of the previous search to capture more recent literature. For human health hazards, the literature search strategy was designed to identify relevant data/information in favor (e.g., positive study) or against (e.g., negative study) a given hypothesis within the context of the assessment question(s) being evaluated in the risk evaluation. Following the initial search of data for the first ten risk evaluations, EPA/OPPT searched for data submitted to EPA under TSCA sections 4, 5, 8(e), and 8(d), as well as for your information (FYI) submissions, to find additional data relevant to human health and environmental hazard, exposure, fate, engineering, physical-chemical properties, and TSCA conditions of use. Searches were conducted of CBI and non-CBI databases followed by a duplicate identification step. Many of the non-CBI data submissions were captured in the initial search published on June 22, 2017, but some were found and added to the pool of new references to undergo data screening.
3.2.2 Data Screening
EPA/OPPT develops and applies inclusion and exclusion criteria during title/abstract and full text screening to identify information potentially relevant for the risk evaluation process. This step also classifies the references into useful categories (e.g., on-topic versus off-topic, human versus animal hazard) to facilitate the sorting of information through the systematic review process. Below are examples of data characteristics, generally chemical-specific, that are used as indicators of relevance based on the scope of the assessments. These data characteristics are the basis for the development of inclusion and exclusion criteria for the title/abstract and full text screening.
Data on environmental fate, transport, partitioning and degradation behavior across environmental media of interest.
Data on environmental exposure of ecological receptors (i.e., aquatic and terrestrial
organisms) to the chemical substance of interest and/or its degradation products and
metabolites.
Data on environmental exposure of human receptors (general population, consumers),
including any potentially exposed or susceptible subpopulations, to the substance of
interest and/or its degradation products and metabolites.
Data on any setting or scenario resulting in releases of the chemical substance of interest
into the natural or built environment (e.g., buildings including homes or workplaces) that
8 Grey literature refers to sources of scientific information that are not formally published and distributed in peer-
reviewed journal articles. These references are still valuable and consulted in the TSCA risk evaluation process. Examples of grey literature are theses and dissertations, technical reports, guideline studies, conference proceedings, publicly-available industry reports, unpublished industry data, trade association resources, and government reports.
23
would expose ecological (i.e., aquatic and terrestrial organisms) or human receptors (i.e.,
general population, and potentially exposed or susceptible subpopulation)
Quantitative estimates of worker exposures and of environmental releases from occupational settings for the chemical of interest
Data on human health and environmental hazards that meet minimum reporting elements (i.e., test chemical, species/organisms, effect(s), dose(s) or concentration(s), and duration).
Data on human health hazards for potentially exposed or susceptible subpopulations.
Title/Abstract Screening
Titles and abstracts of the retrieved literature are reviewed for relevance according to inclusion and exclusion criteria. Table 3-1 describes the planning, execution and assessment activities supporting the title/abstract screening activities for the TSCA risk evaluation process. These activities are consistent with those conducted and described in the Strategy for Conducting Literature Searches documents (Table 3-2). Systematic reviews typically describe the study eligibility criteria in the form of PECO statements or a modified framework. PECO stands for Population, Exposure, Comparator and Outcome. The approach is used to formulate explicit and detailed criteria about those characteristics in the publication that should be present in order to be eligible for inclusion in the review (e.g., inclusion of studies reporting on the effects of chemical exposure to potentially exposed or susceptible subpopulations). Each article is generally screened by two independent reviewers using specialized web-based software (i.e., DistillerSR)9. Screeners are assigned batches of references after conducing pilot testing. Screening forms are typically used to facilitate the screening process by asking a series of questions based on pre-determined inclusion and exclusion criteria. The screeners resolve conflicts by consensus, or consultation with an independent individual(s). Ecological hazard references undergo a similar screening process following the ECOTOX SOPs. Search results, screening decisions and respective tags are stored electronically in the ECOTOX Knowledgebase. Please also refer to the ECOTOX SOPs10 and the Strategy for Conducting Literature Searches (Table 3-2) documents to understand the screening process and criteria that are applied for the ecological hazard literature.
9 In addition to using DistillerSR, EPA/OPPT is exploring automation and machine learning tools for data screening and prioritization activities (e.g., SWIFT-Review, SWIFT-Active Screener, Dragon, DocTER). SWIFT is an acronym for “Sciome Workbench for Interactive Computer-Facilitated Text-mining”.
10 See footnote 3.
24
3.2.2.1.1 Summary of the Title/Abstract Screening Conducted for the First Ten TSCA Risk Evaluations
One screener11 conducted the screening and categorization of titles and abstracts. Relevant studies were identified according to inclusion and exclusion criteria as described in the Strategy for Conducting Literature Searches documents (Table 3-2). The categorization scheme (or tagging structure) varied by scientific discipline (i.e., physical and chemical properties; environmental fate and transport; chemical use/conditions of use information; environmental exposures; human exposures, including potentially exposed or susceptible subpopulations identified by virtue of greater exposure; human health hazard, including potentially exposed or susceptible subpopulations identified by virtue of greater susceptibility; and ecological hazard). Within each data set, there were two broad categories or data tags: (1) on-topic references or (2) off-topic references. On-topic references are those that may contain data/information relevant to the risk evaluation. Off-topic references are those that do not appear to contain data or information relevant to the risk evaluation. Additional sub-categories (or sub-tags) were performed to facilitate further sorting of data/information - for example, identifying references by source type (e.g., published peer- reviewed journal article, government report); data type (e.g., primary data, review article); human health hazard (e.g., liver toxicity, cancer, reproductive toxicity); or chemical-specific and use-specific data or information. The ECOTOX process and methodologies were used to screen the ecological hazard references. The ECOTOX literature screening strategy is discussed in the Strategy for Conducting Literature Searches documents for each of the ten TSCA risk evaluations (Table 3-2). Search results, screening decisions and respective tags were stored electronically in the ECOTOX Knowledgebase.
Full Text Screening
The references identified during title/abstract screening are checked for relevance at the full-text level against specific eligibility criteria (e.g., PECO statements). Since EPA/OPPT is implementing systematic review methods and/or approaches in phases, the PECO approach was adopted during full text screening for the first ten TSCA risk evaluation. Future assessments will use PECOs from the start of the screening process (i.e., title/abstract screening). The number of screeners, the process of reference assignment and conflict resolution are similar to those used for title/abstract screening. Table 3-1 describes the planning, execution and assessment activities supporting the full text screening activities for TSCA risk evaluations.
11 Systematic review guidelines typically recommend at least two screeners to review each article to minimize bias.
EPA had less than 6 months to conduct data collection and screening activities for 10 chemical substances; thus, one screener was used for the title/abstract screening to meet the statutory deadline in June 2017. However, full text screening generally used two independent screeners (see Section 3.2.2.2).
25
Like the title/abstract screening, the ECOTOX SOPs guide the title/abstract and full text screening of ecological hazard references. Please refer to the ECOTOX SOPs12 to understand the screening process and criteria that are applied for the ecological hazard literature.
3.2.2.2.1 Summary of the Full Text Screening Conducted for the First Ten TSCA Risk Evaluations
The full text screening was conducted while EPA/OPPT refined the scope of the TSCA risk evaluations during problem formulation for the first ten chemical substances. PECO statements or a modified framework were used to describe the full-text inclusion and exclusion criteria for selecting relevant references. These criteria have been placed in each of the TSCA Problem Formulation documents as some criteria reflect chemical-specific issues that are better discussed in each chemical assessment. Refinements to the criteria may occur as EPA/OPPT delves into the analysis of relevant information. Each article was generally screened by two independent reviewers using specialized web-based software (i.e., DistillerSR)13. Screeners were assigned batches of references after conducing pilot testing. Screening forms facilitated the reference review process by asking a series of questions based on pre-determined eligibility criteria. DistillerSR was used to manage the work flow of the screening process and document the eligibility decisions for each reference. The screeners resolved conflicts by consensus, or consultation with an independent individual(s). As indicated in section 3.2.2.1, ecological hazard references underwent a similar screening process using the ECOTOX SOPs.
Data Extraction
Data extraction is the process in which quantitative and qualitative data/information are identified from each relevant data/information source and extracted using structured forms or templates. Table 3-1 describes the planning, execution and assessment activities supporting the data extraction activities for TSCA risk evaluations. When possible, the same reviewers used for the full-text screening will be used for data extraction, as these reviewers are already familiar with the references. EPA/OPPT will use various extraction tools to meet the needs of each chemical assessment. These may include specialized web-based software (e.g., DistillerSR, HAWC14). Irrespective of whether data/information are extracted before or after evaluation, the general principle is that the extraction will occur for those sources containing relevant data/information
12 See footnote 3. 13 In addition to using DistillerSR, EPA/OPPT is exploring automation and machine learning tools for data screening and prioritization activities (e.g., SWIFT-Review, SWIFT-Active Screener, Dragon, DocTER). SWIFT is an acronym for “Sciome Workbench for Interactive computer-Facilitated Text-mining” [this is the same as footnote 6 above].
14 EPA/OPPT is exploring HAWC for extracting data supporting TSCA risk evaluations. HAWC stands for Health Assessment Workspace Collaborative.

26
for the risk evaluation. EPA/OPPT is not planning to extract data/information from sources that exhibit serious flaws that would make the data unacceptable for use in the risk evaluation. When applicable and feasible, EPA/OPPT will reach out to the authors of the data/information source to obtain raw data or missing elements that would be important to support the data evaluation and data integration steps. In such cases, the request(s) for additional data/information, number of contact attempts, and responses from the authors will be documented. Data extraction activities for the first ten TSCA risk evaluation are anticipated to occur after the TSCA Problem Formulation documents are released Figure 1-1).
3.3 Data Evaluation
Data evaluation is the stage where the study quality of individual studies is assessed. Table 3-1 describes the planning, execution and assessment activities supporting the data evaluation activities for TSCA risk evaluations. EPA/OPPT will use the evaluation strategies, including pre-determined criteria, documented in Appendices A through I. Refinements to the evaluation strategies are likely to occur and, in such case, any adjustments will be documented. Ideally, each data/information source will be screened by two reviewers but one reviewer may be used. The reviewers will resolve conflicts by consensus, or consultation with an independent individual(s). Data evaluation activities for the first ten TSCA risk evaluation are anticipated to occur after the TSCA Problem Formulation documents are released in March 2018 (Figure 1-1).
3.4 Data Integration and Summary of Findings
Data integration is the stage where the analysis, synthesis and integration of data/information takes place by considering quality, consistency, relevancy, coherence and biological plausibility. It is in this stage where the weight of the scientific evidence approach is applied to evaluate and synthetize multiple evidence streams in order to support the chemical risk evaluation. EPA/OPPT is required by TSCA to use the weight of the scientific evidence in TSCA risk evaluations. Application of weight of evidence analysis is an integrative and interpretive process that considers both data/information in favor (e.g., positive study) or against (e.g., negative study) a given hypothesis within the context of the assessment question(s) being evaluated in the risk evaluation. Table 3-1 describes the planning, execution and assessment activities supporting the data integration for TSCA risk evaluations. Within the TSCA context, the weight of the scientific evidence is defined as “a systematic review method, applied in a manner suited to the nature of the evidence or decision, that uses a pre-established protocol to comprehensively, objectively, transparently, and consistently identify and evaluate each stream of evidence, including strengths, limitations, and relevance of each

27
study and to integrate evidence as necessary and appropriate based upon strengths, limitations, and relevance”. 40 C.F.R. 702.33. In other words, it will involve assembling the relevant data and evaluating the data for quality and relevance, followed by synthesis and integration of the evidence to support conclusions (U.S. EPA, 2016). The significant issues, strengths, and limitations of the data and the uncertainties that require consideration will be presented, and the major points of interpretation will be highlighted. Professional judgment will be used at every step of the process and will be applied transparently, clearly documented, and to the extent possible, follow principles and procedures that are articulated prior to conducting the assessment (U.S. EPA, 2016). The last step of the systematic review process is the summary of findings in which the evidence is summarized, the approaches or methods used to weigh the evidence are discussed, and the basis for the conclusion(s), recommendation(s), and any uncertainties are fully described. This step occurs in each of the components of the risk assessment (i.e., exposure assessment and hazard assessment) and is summarized in the risk characterization section of the TSCA risk evaluation. Data integration activities for the first ten TSCA risk evaluation are anticipated to occur after the TSCA Problem Formulation documents are released (Figure 1-1). EPA/OPPT will provide further details about the data integration strategy along with the publication of the draft TSCA risk evaluations.
4 UPDATES TO THE DATA SEARCH AND SCREENING RESULTS FOR THE FIRST TEN RISK EVALUATIONS
4.1 Initial Data Search
EPA/OPPT identified additional environmental fate and exposure references that were not captured in the initial categorization of the on-topic references for the first ten risk evaluations published on June 22, 2017. Specifically, assessors identified references by checking the list of references of data sources frequently used to support EPA/OPPT’s risk assessments (e.g., previous assessments cited in Table 1-1 of the TSCA Scope documents). This method, called backward reference searching (or snowballing), was not part of the initial literature search strategy. The inclusion of these additional on-topic references is not expected to change the information presented in the TSCA Scope and Problem Formulation documents. Also, EPA/OPPT anticipates targeted supplemental searches during the analysis phase (e.g., to locate specific information for exposure modeling). Backward reference searching will be included in the literature search strategy for supplemental searches.
Since the gathering of the initial literature search results, EPA/OPPT identified a list of on-topic and off-topic references that have been retracted from the scientific literature. Retracted references will not be considered in the development of TSCA risk evaluations. These references are listed in the pertinent TSCA Problem Formulation documents.

28
4.2 Initial Title/Abstract Screening
During the problem formulation phase, EPA/OPPT evaluated the performance of the initial title/abstract screening and tagging for the first ten risk evaluations to identify potentially misclassified on-topic and off-topic references. Misclassification was generally assessed by reviewing a small subset of references in the engineering/occupational exposure, exposure (e.g., general population, consumer exposure), environmental fate and human health hazard peer-reviewed literature. Once a misclassification was identified, EPA/OPPT initiated the process of updating the tags of the reference in HERO. There were many on-topic references identified without readily available full text through the EPA library subscriptions or open sources. EPA/OPPT conducted a second title/abstract screening to confirm relevance of the data source and prioritize the decision of purchasing the full text in the case that the data source remained relevant after making refinements to the TSCA scope as the result from problem formulation. This ensured that EPA/OPPT would purchase the most relevant references for the risk evaluations. Also, assessors questioned the usefulness of some on-topic references after closer inspection of the bibliographic citations. For instance, EPA/OPPT initially included a small subset of references reporting on the therapeutic or ameliorative properties of different drugs in carbon tetrachloride-treated animals. The references were re-classified as off-topic after updating the eligibility criteria and conducting a second title/abstract screening with the assistance of machine learning for literature prioritization (i.e., DocTER). An exploratory exercise was conducted to identify on-topic references that were mischaracterized as off-topic references within the peer-reviewed human health hazard literature. Some on-topic references were identified using SWIFT-Review, but additional work is needed to further optimize the method. The second title/abstract screening for some of the references (see paragraph above) helped identify additional off-topic references that were originally tagged as on-topic. Based on performance checks, it is anticipated that very few on-topic references were misclassified as off-topic.

29
5 REFERENCES
Note: This list contains the references cited in sections 1 through 3. References supporting the various evaluation strategies are listed in their respective appendices.
1. Bilotta, GSM, A. M. Boyd, I.,an. (2014). On the use of systematic reviews to inform environmental policies. Environ Sci Pol. 42: 67-77. http://dx.doi.org/10.1016/j.envsci.2014.05.010 https://www.sciencedirect.com/science/article/pii/S1462901114001142?via%3Dihub.
2. Council, CtRtIPBoESTDoELSNR. (2014). Review of EPA's integrated risk information system (IRIS) process. Washington, D.C.: National Academies Press (US). http://dx.doi.org/10.17226/18764.
3. Higgins, JG, S. (2011). Cochrane handbook for systematic reviews of interventions. Version 5.1.0: The Cochrane Collaboration, 2011. http://handbook.cochrane.org.
4. National Academy of Sciences, National Academy of Engineering,, Institute of Medicine, . (2017). Application of systematic review methods in an overall strategy for evaluating low-dose toxicity from endocrine active chemicals. In Consensus Study Report. Washington, D.C.: The National Academies Press. http://dx.doi.org/10.17226/24758 https://www.nap.edu/catalog/24758/application-of-systematic-review-methods-in-an-overall-strategy-for-evaluating-low-dose-toxicity-from-endocrine-active-chemicals.
5. U.S. EPA (U.S. Environmental Protection Agency). (1992). Guidelines for exposure assessment. (EPA/600/Z-92/001). Washington, DC: U.S. Environmental Protection Agency, Risk Assessment Forum. http://cfpub.epa.gov/ncea/cfm/recordisplay.cfm?deid=15263.
6. U.S. EPA. (1998). Guidelines for neurotoxicity risk assessment [EPA Report] (pp. 1-89). (EPA/630/R-95/001F). Washington, DC: U.S. Environmental Protection Agency, Risk Assessment Forum. http://www.epa.gov/risk/guidelines-neurotoxicity-risk-assessment.
7. U.S. EPA. (2014). Framework for human health risk assessment to inform decision making. Final [EPA Report]. (EPA/100/R-14/001). Washington, DC: U.S. Environmental Protection, Risk Assessment Forum. https://www.epa.gov/risk/framework-human-health-risk-assessment-inform-decision-making.
8. U.S. EPA. (2016). Weight of evidence in ecological assessment [EPA Report]. (EPA100R16001). Washington, DC: Office of the Science Advisor. https://cfpub.epa.gov/si/si_public_record_report.cfm?dirEntryId=335523.
9. U.S. EPA. (2018). ECOTOX Knowledgebase. https://hero.epa.gov/heronet/index.cfm/reference/download/reference_id/4263024.

30
APPENDIX A: STRATEGY FOR ASSESSING THE QUALITY OF DATA/INFORMATION SUPPORTING TSCA RISK EVALUATIONS
The strategies for assessing the quality of data/information sources15 use a structured framework with predefined criteria for each type of data/information source. EPA/OPPT developed a numerical scoring system to inform the characterization of the data/information sources during the data integration phase. The goal is to provide transparency and consistency to the evaluation process along with creating evaluation strategies that meet the TSCA science standards for various data/information streams. Further details about the data integration strategy will be provided with the publication of the draft TSCA risk evaluations, including how the scores will be considered. In this document, the term data/information source is used in a broad way to capture the heterogeneity of data/information sources that are used in the TSCA risk evaluations. The data/information are intended to understand the hazards, exposures, conditions of use, and the potentially exposed or susceptible subpopulations as required by the amended TSCA. Thus, EPA/OPPT has developed evaluation strategies for various data/information streams:
Physical-chemical properties (Appendix B);
Environmental fate (Appendix C);
Occupational exposure and release data (Appendix D)
Exposures to general population and consumers as well as environmental exposures (Appendix E);
Ecological hazard studies (Appendix F);
Animal toxicity and in vitro toxicity (Appendix G);
Epidemiological studies (Appendix H) The process of developing the strategies involved reviewing various evaluation tools/frameworks and documents as well as getting input from scientists based on their expert knowledge about evaluating various data/information sources for risk assessment purposes. Criteria and/or evaluation tools/frameworks that were consulted during the development phase of the evaluation strategies were the following:
Biomonitoring, Environmental Epidemiology, and Short-lived Chemicals (BEES-C) instrument (Lakind et al., 2014)
Criteria used in EPA’s ECOTOXicology knowledgebase (U.S. EPA, 2018a)
Criteria for reporting and evaluating ecotoxicity data(CRED) (Moermond et al., 2016b)
Systematic review practices in EPA’s Integrated Risk Information System (IRIS) (U.S. EPA, 2018b)
EPA’s Guidelines for Exposure Assessment (U.S. EPA, 1992)
15 The term data/information source is used in this document in a broad way to capture the heterogeneity of
data/information in TSCA risk evaluations (e.g., experimental studies, data sets, published models, completed assessments, release data).

31
EPA’s Summary of General Assessment Factors for Evaluating the Quality of Scientific and technical information (U.S. EPA, 2003b)
EPA’s Exposure Factors Handbook (U.S. EPA, 2011b)
Handbook for Conducting a Literature-based Health Assessment Using OHAT Approach for Systematic Review and Evidence Integration (NTP, 2015a)
NAS report on Human Biomonitoring for Environmental Chemicals (NRC, 2006)
Strengthening the Reporting of Observational Studies in Epidemiology (STROBE) statement (Von Elm et al., 2008)
ToxRTool (Toxicological data Reliability Assessment Tool) developed by the European Commission (EC, 2018)
Various OECD guidance document on exposure, environmental fate and modeling data (see appendices more information) (EC, 2018; OECD, 2017; Cooper et al., 2016; ECHA, 2016; Lynch et al., 2016; Moermond et al., 2016a; Moermond et al., 2016b; Samuel et al., 2016; NTP, 2015a, b; Hooijmans et al., 2014; Koustas et al., 2014; Lakind et al., 2014; NRC, 2014; OECD, 2014; Kushman et al., 2013; Hartling et al., 2012; ECHA, 2011a, c; U.S. EPA, 2011a, b; Hooijmans et al., 2010; U.S. EPA, 2009; Von Elm et al., 2008; OECD, 2007; Barr et al., 2006; FTC, 2006; NRC, 2006; U.S. EPA, 2006; ATSDR, 2005; OECD, 2004, 2003; U.S. EPA, 2003a, b, c; Bower, 1999; OECD, 1998, 1997, 1995; U.S. EPA, 1992; NRC, 1991)
The general structure of the TSCA evaluation strategies is composed of evaluation domains, metrics and criteria. Evaluation domains represent general categories of attributes that are evaluated in each data/information source (e.g., test substance, test conditions, reliability, representativeness). Each domain contains a unique set of metrics, or sub-categories of attributes, intended to assess an aspect of the methodological conduct of the data/information source. Each metric specifies criteria expressing the relevant elements or conditions for assessing confidence that, along with professional judgement, will guide the identification of study strengths and limitations/deficiencies. EPA/OPPT plans to pilot the evaluation strategies for optimization purposes. Reporting quality is an important aspect of a study that needs to be considered in the evaluation process. The challenge, in many cases, is to distinguish a deficit in reporting from a problem in the underlying methodological quality of the data/information source. The TSCA evaluation strategies incorporate reporting criteria within the existing domains rather than adding a separate reporting domain as recommended in some evaluation tools/frameworks. Since reporting contributes to the evaluation of each facet of the data source, EPA/OPPT assesses reporting and methodological quality simultaneously with the idea of untangling reporting from study conduct while the reviewer is assessing a particular metric for each domain. Developing a reporting checklist, guidance document or a separate reporting quality domain may be possible in the near future as EPA/OPPT uses and optimizes the evaluation strategies. Data/information sources should also be evaluated for their relevance or appropriateness to support the risk evaluation. Specifically, data/information sources should support the

32
assessment questions, analytical approaches, methods, models and considerations that are laid out in the analysis plan of the TSCA Scope documents16. EPA/OPPT uses a tiered approach to check for relevance starting at the data search stage and continuing during the title/abstract and full text screening and evaluation and integration stages. By design, the TSCA systematic review process uses a fit-for-purpose literature search and relevance-driven eligibility criteria to end up evaluating the most relevant data/information sources for the TSCA risk evaluation. The reviewers also check for relevance while assessing the quality of the data/information source and are asked to document17 any relevancy issues during the evaluation process. Refer to section 3.2.2 for data attributes that are included in the eligibility criteria to check for relevance. The TSCA evaluation strategies in some cases refer to study guidelines along with professional judgement as a helpful guidance in determining the adequacy or appropriateness of certain study designs or analytical methods. This should not be construed to imply that non-guideline studies have lower confidence than guideline or Good Laboratory Practice (GLP) studies. EPA/OPPT will consider any and all available, relevant data and information that conform to the TSCA science standards when developing the risk evaluations irrespective of whether they were conducted in accordance with standardized methods (e.g., OECD test guidelines or GLP standards). Some data sources may be evaluated under different evaluation strategies. For instance, exposure assessors may evaluate an epidemiological study for estimating exposure via direct measurements or modeling. In addition, a human health hazard assessor may evaluate the same study for hazards and effects in the human population related to the exposure of a particular chemical substance. Although this may be cumbersome, EPA/OPPT’s approach is justifiable since the data source is supporting different assessment questions. EPA/OPPT recognizes that this approach may be refined in the future to adopt efficiencies, if lessons learned indicate that it needs to be changed. EPA/OPPT will consider data and information from alternative test methods and strategies (or new approach methodologies or NAMs), as applicable and available, to support TSCA risk evaluations. This is consistent with EPA/OPPT’s Strategic Plan to Promote the Development and Implementation of Alternative Test Methods (Draft) to reduce, refine or replace vertebrate animal testing (U.S. EPA, 2018c). Since these NAMs may support the analyses for the exposure and hazard assessments, the data/information quality criteria may need to be optimized or new criteria may need to be developed as part of evaluating and integrating NAMs in the TSCA risk evaluation process.
16 Refer to the TSCA Problem Formulation documents to obtain refined analysis plans for the first ten chemical
assessments. 17 Relevancy issues will be documented in the reviewer’s comments.

33
A.1 Evaluation Method
Based on the strengths, limitations, and deficiencies of each data/information source, the reviewer assigns a confidence level score of 1 (high confidence), 2 (medium confidence), 3 (low confidence) or 4 (unacceptable) for each individual metric that is evaluating a particular aspect of the methodological conduct of the data/information source. Although many metrics have criteria for all four bins (i.e., High, Medium, Low, and Unacceptable), there are some metrics with dichotomous or trichotomous criteria to fit better the nature of the criteria. The confidence levels and corresponding scores at the metric level are defined as follows:
High: No notable deficiencies or concerns are identified in the domain metric that are likely to influence results [score of 1].
Medium: Minor uncertainties or limitations are noted in the domain metric that are unlikely to have a substantial impact on results [score of 2].
Low: Deficiencies or concerns are noted in the domain metric that are likely to have a substantial impact on results [score of 3].
Unacceptable: Serious flaws are noted in the domain metric that consequently make the data/information source unusable. [score of 4].
Not rated/applicable: Rating of this metric is not applicable to the data/information source being evaluated [no score]. Not rated/applicable will also be used in cases in which studies cite a literature source for their test methodology instead of providing detailed descriptions. In these circumstances, EPA will score the metric as Not rated/not applicable and capture it in the reviewer’s notes. If the data/information source is not classified as “unacceptable” in the initial review, the cited literature source will be reviewed during a subsequent evaluation step and the metric will be rated at that time.
A numerical scoring method is used to convert the confidence level for each metric into the overall quality level for the data/information source. The overall study score is equated to an overall quality level (High, Medium, or Low) using the level definitions and scoring scale shown in Table A-1. The scoring scale was obtained by calculating the difference between the highest possible score of 3 and the lowest possible score of 1 (i.e., 3-1= 2) and dividing into three equal parts (2 ÷ 3 = 0.67). This results in a range of approximately 0.7 for each overall data quality level, which was used to estimate the transition points (cut-off values) in the scale between High and Medium scores, and Medium and Low scores. These transition points between the ranges of 1 and 3 were calculated as follows:
Cut-off values between High and Medium: 1 + 0.67= 1.67, rounded up to 1.7 (scores lower than 1.7 will be assigned an overall quality level of High)
Cut-off values between Medium and Low: 1.67 + 0.67= 2.34, rounded up to 2.3 (scores between 1.7 and lower than 2.3 will be assigned an overall quality level of Medium)
A study is disqualified from further consideration if the confidence level of one or more metrics is rated as Unacceptable [score of 4]. EPA/OPPT plans to use data with an overall quality level of High, Medium, or Low confidence to quantitatively or qualitatively support the risk evaluations, but does not plan to use data rated as Unacceptable. Data or information from Unacceptable
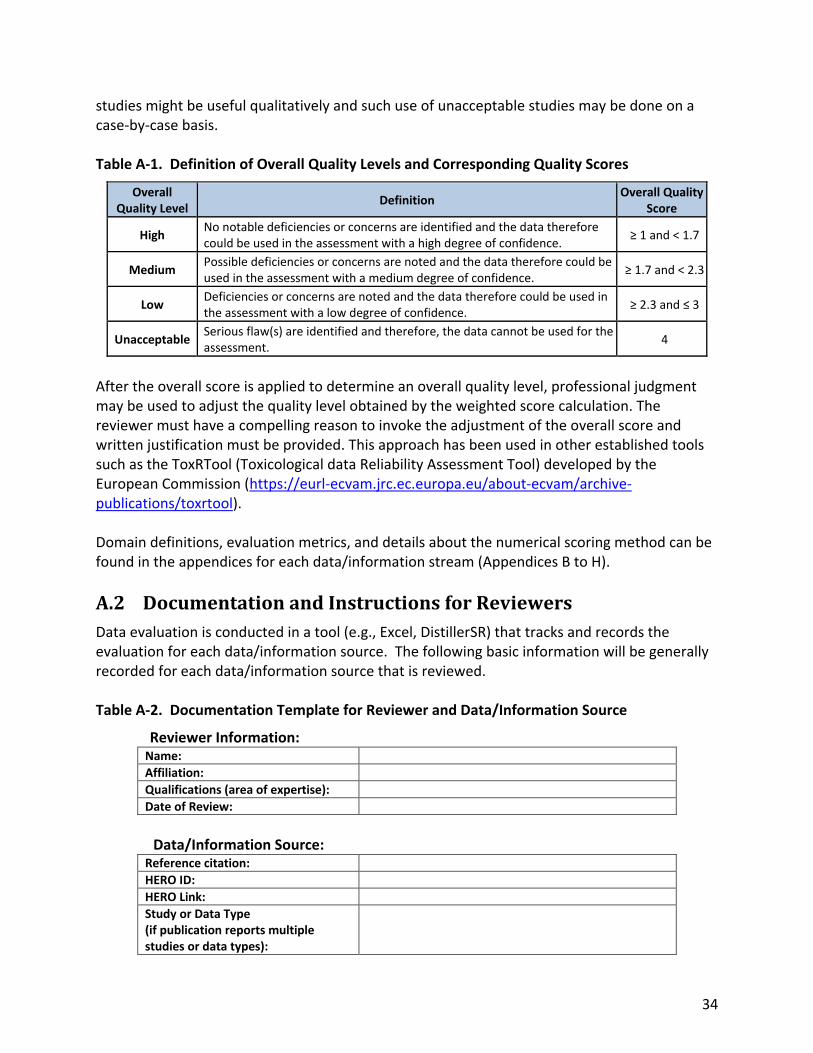
34
studies might be useful qualitatively and such use of unacceptable studies may be done on a case-by-case basis. Table A-1. Definition of Overall Quality Levels and Corresponding Quality Scores
Overall Quality Level
Definition Overall Quality
Score
High No notable deficiencies or concerns are identified and the data therefore could be used in the assessment with a high degree of confidence.
≥ 1 and < 1.7
Medium Possible deficiencies or concerns are noted and the data therefore could be used in the assessment with a medium degree of confidence.
≥ 1.7 and < 2.3
Low Deficiencies or concerns are noted and the data therefore could be used in the assessment with a low degree of confidence.
≥ 2.3 and ≤ 3
Unacceptable Serious flaw(s) are identified and therefore, the data cannot be used for the assessment.
4
After the overall score is applied to determine an overall quality level, professional judgment may be used to adjust the quality level obtained by the weighted score calculation. The reviewer must have a compelling reason to invoke the adjustment of the overall score and written justification must be provided. This approach has been used in other established tools such as the ToxRTool (Toxicological data Reliability Assessment Tool) developed by the European Commission (https://eurl-ecvam.jrc.ec.europa.eu/about-ecvam/archive-publications/toxrtool). Domain definitions, evaluation metrics, and details about the numerical scoring method can be found in the appendices for each data/information stream (Appendices B to H).
A.2 Documentation and Instructions for Reviewers
Data evaluation is conducted in a tool (e.g., Excel, DistillerSR) that tracks and records the evaluation for each data/information source. The following basic information will be generally recorded for each data/information source that is reviewed. Table A-2. Documentation Template for Reviewer and Data/Information Source
Reviewer Information: Name:
Affiliation:
Qualifications (area of expertise):
Date of Review:
Data/Information Source:
Reference citation:
HERO ID:
HERO Link:
Study or Data Type (if publication reports multiple studies or data types):

35
A confidence level is assigned for each relevant metric within each domain by following the confidence level specifications provided in section A.1, along with professional judgment, to identify study strengths and limitations. The assigned confidence level is indicated by placing a score between 1 and 4 in the column labeled Selected Score. In some cases, reference to study guidelines (in addition to professional judgement) may be helpful in determining the adequacy or appropriateness of certain study designs or analytical methods. This should not be construed to imply that non-guideline studies necessarily have lower confidence than guideline studies. If a publication reports more than one study or endpoint, each study and, as needed, each endpoint will be evaluated separately. Some metrics may not be applicable to all study types. If a metric is not applicable to the study under review, NR (not rated) will be placed in the Selected Score column for this metric. After scoring of the individual metrics within each domain, the overall study score is calculated and assigned to the corresponding bin (High, Medium, Low, or Unacceptable). In the Reviewer’s Comments field, the reviewer documents concerns, uncertainties, strengths, limitations, deficiencies and any additional comments observed for each metric, when necessary. For instance, EPA may not always provide a comment for a metric that has been categorized as High. However, a reviewer is strongly encouraged to provide a comment for metrics categorized as Medium or Low to improve transparency. The reviewer also records any relevance issues with the data/information source (e.g., study is not useful to answer assessment questions).
A.3 Important Caveats
The following is a discussion of important caveats for the data quality evaluation method that EPA/OPPT intends to use in the TSCA risk evaluations:
Although specifications for the data quality evaluation metrics have been developed, professional judgment is required to assess the metrics.
Data evaluation is a qualitative assessment of confidence in a study or data set. A scoring system is being applied to ascertain a qualitative rating in order to provide consistency and transparency to the evaluation process. Scores will be used for the purpose of assigning the confidence level rating of High, Medium, Low, or Unacceptable, and inform the characterization of data/information sources during the data integration phase. The system is not intended to imply precision and/or accuracy of the scoring results.
Every study or data set is unique and therefore the individual metrics and domains may have various degrees of importance (e.g., more or less important). The weighting approach for some of the strategies may need to be adjusted as EPA/OPPT tests the evaluation method with different types of studies.
The metrics developed are intended to be indicators of data quality. They were selected because they are generally considered common and important for a broad range of
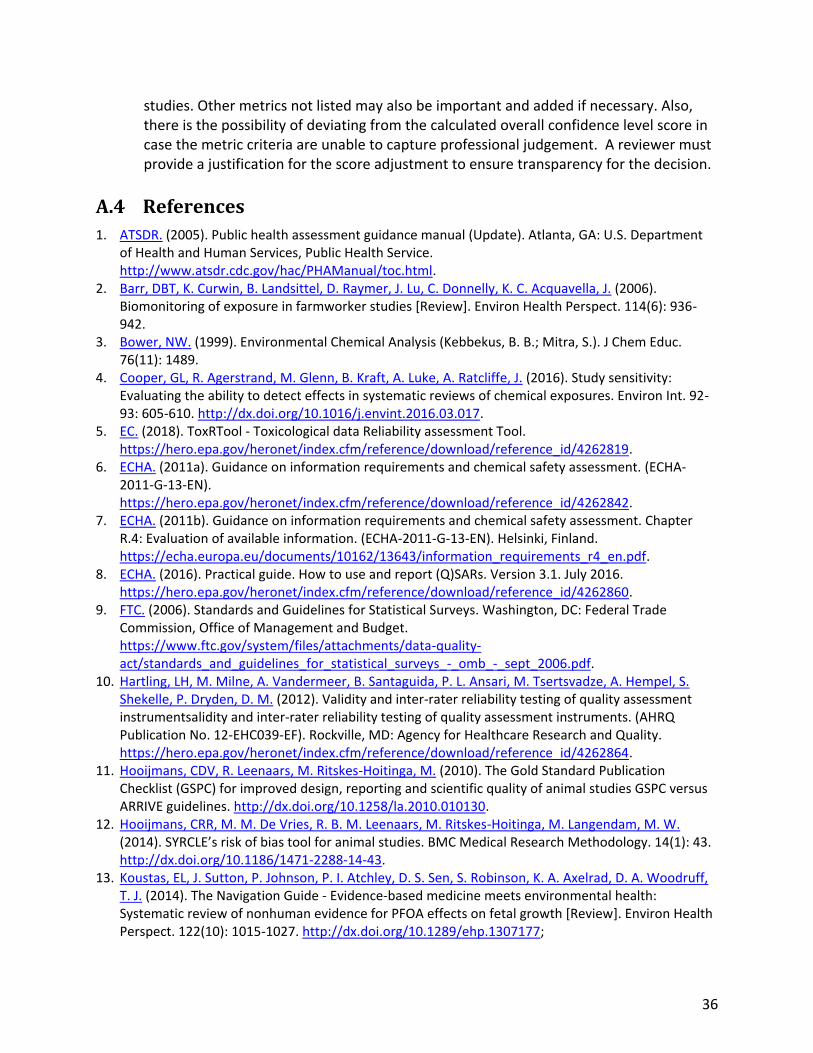
36
studies. Other metrics not listed may also be important and added if necessary. Also, there is the possibility of deviating from the calculated overall confidence level score in case the metric criteria are unable to capture professional judgement. A reviewer must provide a justification for the score adjustment to ensure transparency for the decision.
A.4 References
1. ATSDR. (2005). Public health assessment guidance manual (Update). Atlanta, GA: U.S. Department of Health and Human Services, Public Health Service. http://www.atsdr.cdc.gov/hac/PHAManual/toc.html.
2. Barr, DBT, K. Curwin, B. Landsittel, D. Raymer, J. Lu, C. Donnelly, K. C. Acquavella, J. (2006). Biomonitoring of exposure in farmworker studies [Review]. Environ Health Perspect. 114(6): 936-942.
3. Bower, NW. (1999). Environmental Chemical Analysis (Kebbekus, B. B.; Mitra, S.). J Chem Educ. 76(11): 1489.
4. Cooper, GL, R. Agerstrand, M. Glenn, B. Kraft, A. Luke, A. Ratcliffe, J. (2016). Study sensitivity: Evaluating the ability to detect effects in systematic reviews of chemical exposures. Environ Int. 92-93: 605-610. http://dx.doi.org/10.1016/j.envint.2016.03.017.
5. EC. (2018). ToxRTool - Toxicological data Reliability assessment Tool. https://hero.epa.gov/heronet/index.cfm/reference/download/reference_id/4262819.
6. ECHA. (2011a). Guidance on information requirements and chemical safety assessment. (ECHA-2011-G-13-EN). https://hero.epa.gov/heronet/index.cfm/reference/download/reference_id/4262842.
7. ECHA. (2011b). Guidance on information requirements and chemical safety assessment. Chapter R.4: Evaluation of available information. (ECHA-2011-G-13-EN). Helsinki, Finland. https://echa.europa.eu/documents/10162/13643/information_requirements_r4_en.pdf.
8. ECHA. (2016). Practical guide. How to use and report (Q)SARs. Version 3.1. July 2016. https://hero.epa.gov/heronet/index.cfm/reference/download/reference_id/4262860.
9. FTC. (2006). Standards and Guidelines for Statistical Surveys. Washington, DC: Federal Trade Commission, Office of Management and Budget. https://www.ftc.gov/system/files/attachments/data-quality-act/standards_and_guidelines_for_statistical_surveys_-_omb_-_sept_2006.pdf.
10. Hartling, LH, M. Milne, A. Vandermeer, B. Santaguida, P. L. Ansari, M. Tsertsvadze, A. Hempel, S. Shekelle, P. Dryden, D. M. (2012). Validity and inter-rater reliability testing of quality assessment instrumentsalidity and inter-rater reliability testing of quality assessment instruments. (AHRQ Publication No. 12-EHC039-EF). Rockville, MD: Agency for Healthcare Research and Quality. https://hero.epa.gov/heronet/index.cfm/reference/download/reference_id/4262864.
11. Hooijmans, CDV, R. Leenaars, M. Ritskes-Hoitinga, M. (2010). The Gold Standard Publication Checklist (GSPC) for improved design, reporting and scientific quality of animal studies GSPC versus ARRIVE guidelines. http://dx.doi.org/10.1258/la.2010.010130.
12. Hooijmans, CRR, M. M. De Vries, R. B. M. Leenaars, M. Ritskes-Hoitinga, M. Langendam, M. W. (2014). SYRCLE’s risk of bias tool for animal studies. BMC Medical Research Methodology. 14(1): 43. http://dx.doi.org/10.1186/1471-2288-14-43.
13. Koustas, EL, J. Sutton, P. Johnson, P. I. Atchley, D. S. Sen, S. Robinson, K. A. Axelrad, D. A. Woodruff, T. J. (2014). The Navigation Guide - Evidence-based medicine meets environmental health: Systematic review of nonhuman evidence for PFOA effects on fetal growth [Review]. Environ Health Perspect. 122(10): 1015-1027. http://dx.doi.org/10.1289/ehp.1307177;

37
https://www.ncbi.nlm.nih.gov/pmc/articles/PMC4181920/pdf/ehp.1307177.pdf. 14. Kushman, MEK, A. D. Guyton, K. Z. Chiu, W. A. Makris, S. L. Rusyn, I. (2013). A systematic approach
for identifying and presenting mechanistic evidence in human health assessments. Regul Toxicol Pharmacol. 67(2): 266-277. http://dx.doi.org/10.1016/j.yrtph.2013.08.005; https://www.ncbi.nlm.nih.gov/pmc/articles/PMC3818152/pdf/nihms516764.pdf.
15. Lakind, JSS, J. Goodman, M. Barr, D. B. Fuerst, P. Albertini, R. J. Arbuckle, T. Schoeters, G. Tan, Y. Teeguarden, J. Tornero-Velez, R. Weisel, C. P. (2014). A proposal for assessing study quality: Biomonitoring, Environmental Epidemiology, and Short-lived Chemicals (BEES-C) instrument. Environ Int. 73: 195-207. http://dx.doi.org/10.1016/j.envint.2014.07.011; https://www.ncbi.nlm.nih.gov/pmc/articles/PMC4310547/pdf/nihms-656623.pdf.
16. Lynch, HNG, J. E. Tabony, J. A. Rhomberg, L. R. (2016). Systematic comparison of study quality criteria. Regul Toxicol Pharmacol. 76: 187-198. https://hero.epa.gov/heronet/index.cfm/reference/download/reference_id/4262904.
17. Moermond, CB, A. Breton, R. Junghans, M. Laskowski, R. Solomon, K. Zahner, H. (2016a). Assessing the reliability of ecotoxicological studies: An overview of current needs and approaches. Integr Environ Assess Manag. 13: 1-12. http://dx.doi.org/10.1002/ieam.1870; http://onlinelibrary.wiley.com/store/10.1002/ieam.1870/asset/ieam1870.pdf?v=1&t=jerdoypz&s=ee96db9e589f470deb10651cdb1460d9ada93486.
18. Moermond, CTK, R. Korkaric, M. Ågerstrand, M. (2016b). CRED: Criteria for reporting and evaluating ecotoxicity data. Environ Toxicol Chem. 35(5): 1297-1309. http://dx.doi.org/10.1002/etc.3259.
19. NRC. (1991). Environmental Epidemiology, Volume 1: Public Health and Hazardous Wastes. Washington, DC: The National Academies Press. https://hero.epa.gov/heronet/index.cfm/reference/download/reference_id/4262908.
20. NRC. (2006). Human biomonitoring for environmental chemicals. Washington, D.C.: The National Academies Press. http://www.nap.edu/catalog.php?record_id=11700.
21. NRC. (2014). Review of EPA's Integrated Risk Information System (IRIS) process. Washington, DC: The National Academies Press. http://www.nap.edu/catalog.php?record_id=18764.
22. NTP. (2015a). Handbook for conducting a literature-based health assessment using OHAT approach for systematic review and evidence integration. U.S. Dept. of Health and Human Services, National Toxicology Program. http://ntp.niehs.nih.gov/pubhealth/hat/noms/index-2.html.
23. NTP. (2015b). OHAT risk of bias rating tool for human and animal studies. U.S. Dept. of Health and Human Services, National Toxicology Program. https://ntp.niehs.nih.gov/ntp/ohat/pubs/riskofbiastool_508.pdf.
24. OECD. (1995). Detailed review paper on biodegradability testing . Environment monograph No 98. OECD series on the Test Guidelines Programme. Number 2. (OCDE/GD(95)43). Paris, France: OECD Publishing. https://www.oecd-ilibrary.org/docserver/9789264078529-en.pdf.
25. OECD. (1997). Guidance document on direct phototransformation of chemical in water. OECD Environmental Health and Safety Publications Series on Testing and Assessment. No. 7. (OCDE/GD(97)21). Paris, France: OECD Publishing. https://www.oecd-ilibrary.org/docserver/9789264078000-en.pdf.
26. OECD. (1998). Detailed review paper on aquatic testing methods for pesticides and industrial chemicals. Part 1: Report. OECD Series on testing and assessment. No. 11. (ENV/MC/CHEM(98)19/PART1). Paris, France: OECD Publishing. https://www.oecd-ilibrary.org/docserver/9789264078291-en.pdf.
27. OECD. (2003). Guidance document on reporting summary information on environmental, occupational and consumer exposure: OECD Environment, Health and Safety Publications Series on Testing and Assessment no. 42. (ENV/JM/MONO(2003)16). France: Environment Directorate; Joint Meeting of the Chemicals Committee and the Working Party on Chemicals, Pesticides and
38
Biotechnology. http://www.oecd-ilibrary.org/docserver/download/9750421e.pdf?expires=1511217696&id=id&accname=guest&checksum=F6F9CD530DBACF1FA06C5A627E00177C.
28. OECD. (2004). Guidance document on the use of multimedia models for estimating overall environmental persistance and long-range transport. OECD series on testing and assessment No. 45. (ENV/JM/MONO(2004)5). Joint meeting of the chemicals committee and the working party on chemicals, pesticides and biotechnology. https://www.oecd-ilibrary.org/docserver/9789264079137-en.pdf.
29. OECD. (2007). Guidance Document on the Validation of (Quantitative) Structure-Activity Relationship [(Q)SAR] Models. OECD Environment Health and Safety Publications. Series on Testing and Assessment No. 69. (ENV/JM/MONO(2007)2). Paris, France: OECD Publishing. https://www.oecd-ilibrary.org/docserver/9789264085442-en.pdf?expires=1525456995&id=id&accname=guest&checksum=75D4C7E1434FB7B79201CB055DD772FE.
30. OECD. (2014). Guidance Document for Describing Non-Guideline In Vitro Test Methods. In OECD Series on Testing and Assessment. (No. 211). http://www.oecd.org/officialdocuments/publicdisplaydocumentpdf/?cote=ENV/JM/MONO(2014)35&doclanguage=en.
31. OECD. (2017). Guidance on Grouping of Chemicals, Second Edition: OECD Publishing. http://dx.doi.org/10.1787/9789264274679-en.
32. Samuel, GOH, S. Wright, R. A. Lalu, M. M. Patlewicz, G. Becker, R. A. Degeorge, G. L. Fergusson, D. Hartung, T. Lewis, R. J. Stephens, M. L. (2016). Guidance on assessing the methodological and reporting quality of toxicologically relevant studies: A scoping review. Environ Int. 92-93: 630-646. https://hero.epa.gov/heronet/index.cfm/reference/download/reference_id/4262966.
33. U.S. EPA (U.S. Environmental Protection Agency). (1992). Guidelines for exposure assessment. (EPA/600/Z-92/001). Washington, DC: U.S. Environmental Protection Agency, Risk Assessment Forum. http://cfpub.epa.gov/ncea/cfm/recordisplay.cfm?deid=15263.
34. U.S. EPA. (2003a). Occurrence estimation methodology and occurrence findings report of the six-year review of existing national primary drinking water regulations [EPA Report]. (EPA-815/R-03-006). Washington, DC. http://water.epa.gov/lawsregs/rulesregs/regulatingcontaminants/sixyearreview/first_review/upload/support_6yr_occurancemethods_final.pdf.
35. U.S. EPA. (2003b). A summary of general assessment factors for evaluating the quality of scientific and technical information [EPA Report]. (EPA/100/B-03/001). Washington, DC: U.S. Environmental Protection Agency, Office of Research and Development. http://www2.epa.gov/osa/summary-general-assessment-factors-evaluating-quality-scientific-and-technical-information.
36. U.S. EPA. (2003c). Survey Management Handbook. (EPA 260-B-03-003). Washington, DC: Office of Information Analysis and Access, U.S. EPA. https://nepis.epa.gov/Exe/tiff2png.cgi/P1005GNB.PNG?-r+75+-g+7+D%3A%5CZYFILES%5CINDEX%20DATA%5C00THRU05%5CTIFF%5C00001406%5CP1005GNB.TIF.
37. U.S. EPA. (2006). Approaches for the application of physiologically based pharmacokinetic (PBPK) models and supporting data in risk assessment (Final Report) [EPA Report] (pp. 1-123). (EPA/600/R-05/043F). Washington, DC: U.S. Environmental Protection Agency, Office of Research and Development, National Center for Environmental Assessment. http://cfpub.epa.gov/ncea/cfm/recordisplay.cfm?deid=157668.
38. U.S. EPA. (2009). Guidance on the Development, Evaluation, and Application of Environmental Models. (EPA/100/K-09/003). Washington, DC: Office of the Science Advisor. https://hero.epa.gov/heronet/index.cfm/reference/download/reference_id/4262976.

39
39. U.S. EPA. (2011a). Exposure Factors Handbook. (EPA/600R-090052F). Washington, DC: U.S. Environmental Protection Agency, National Center for Environmental Assessment, Office of Research and Development. http://cfpub.epa.gov/ncea/risk/recordisplay.cfm?deid=236252.
40. U.S. EPA. (2011b). Exposure factors handbook: 2011 edition (final) [EPA Report]. (EPA/600/R-090/052F). Washington, DC: U.S. Environmental Protection Agency, Office of Research and Development, National Center for Environmental Assessment. http://cfpub.epa.gov/ncea/cfm/recordisplay.cfm?deid=236252.
41. U.S. EPA. (2018a). ECOTOX Knowledgebase. https://hero.epa.gov/heronet/index.cfm/reference/download/reference_id/4263024.
42. U.S. EPA. (2018b). Integrated risk information system (IRIS) [Database]. Washington, DC: U.S. Environmental Protection Agency, Integrated Risk Information System. Retrieved from http://www.epa.gov/iris/
43. U.S. EPA. (2018c). Strategic plan to promote the development and implementation of alternative test methods (Draft). Washington, D.C.: Office of Chemical Safety and Pollution Prevention. https://www.regulations.gov/document?D=EPA-HQ-OPPT-2017-0559-0584.
44. Von Elm, EA, D. G. Egger, M. Pocock, S. J. Gøtzsche, P. C. Vandenbroucke, J. P. (2008). The Strengthening the Reporting of Observational Studies in Epidemiology (STROBE) statement: guidelines for reporting observational studies. J Clin Epidemiol. 61(4): 344-349. https://hero.epa.gov/heronet/index.cfm/reference/download/reference_id/4263036.

40
APPENDIX B: DATA QUALITY CRITERIA FOR PHYSICAL/CHEMICAL PROPERTY DATA
Table B-1 describes the general approach that EPA/OPPT uses to assess the quality of physical-chemical property data. Table B-1. Evaluation Metrics and Ratings for Physical-Chemical Property Data
Domain/Metric Description/ Definition
Ratings and Criteria
Representativeness
The information or data reflects the data and chemical substance type.
High: Data are measured for the subject chemical substance.
Medium: Data are measured for a structural analog of the subject chemical substance.
Low: Data are estimated (modeled) for the subject chemical substance.
Not rated: Rating of this factor is not applicable to this kind of information.
Appropriateness
The information or data reflects anticipated results based on chemical structural features or behaviors.
High: Measured data are consistent with the subject chemical substance structural features (e.g., presence of certain functional groups). Medium: Data measured for a structural analog of the subject chemical substance or estimated (modeled) for the subject chemical substance are consistent with what is expected for the subject chemical substance structural features or behaviors. Low: Data measured for a structural analog of the subject chemical substance or estimated (modeled) for the subject chemical substance are not consistent with the subject chemical substance structural features or behaviors, or the structural features or behaviors of the subject chemical substance are uncertain. Unacceptable: Measured data for a structural analog of the subject chemical substance are not appropriate because the analog is not appropriate (e.g., analog is a neutral molecule and the subject chemical substance is a salt). Estimated (modeled) data for the subject chemical substance are not appropriate because the estimation tool is not appropriate (e.g., estimation tool is not able to estimate class 2 and polymeric substances). Not rated: Rating of this factor is not applicable to this kind of information.

41
Domain/Metric Description/ Definition
Ratings and Criteria
Evaluation/Review
The information or data reported has reliable review.
High: The information or data is from a recognized data collection/repository where data are peer-reviewed by experts in the field, are broadly available to the public for review and use, and include references to the original sources. Medium: From a source that is not described as High above but is known.
Low: From a source that is uncertain (unknown primary source).
Not rated: Rating of this factor is not applicable to this kind of information.
Reliability/Unbiased (Method Objectivity)
The method for producing the data/information is not biased towards a particular product or outcome.
High: Methodology for producing the information is designed to answer a specific question, and the methodology’s objective is clear. Medium: Method bias appears unlikely.
Low: Method bias appears likely or is highly uncertain.
Unacceptable: Method bias is so severe as to be unacceptable.
Not rated: Rating of this factor is not applicable to this kind of information.
Reliability/Analytic Method
The information or data reported is from a reliable method.
High: Data are obtained by accepted standard analytic methods. Medium: Analytic method is non-standard but is expected to be appropriate. Low: From a source that is uncertain. Analytic method is not known.
Unacceptable: Analytic method is not appropriate.
Not rated: Rating of this factor is not applicable to this kind of information.

42
APPENDIX C: DATA QUALITY CRITERIA FOR FATE DATA
C.1 Types of Fate Data Sources
The quality of fate data, which includes mass transport, chemical partitioning, and chemical or biological transformations in soil, surface waters, groundwater, and air (e.g., biodegradation, hydrolysis, photolysis), will be evaluated for four different data sources: experimental data, field studies, modeling data, and monitoring data. Generally experimental fate data is preferred over modeled data; however, fate data from all data sources will be evaluated using the data criteria in this section. Definitions for these data types are shown in Table C-1. Since the availability of information varies considerably for different chemicals, it is anticipated that some study types will not be available while others may be identified beyond those listed in Table C-1. Table C-1. Types of Fate Data
Type of Data Source Definition
Experimental Data
Data obtained from experimental studies conducted in a controlled environment with pre-defined testing conditions. Examples include data from laboratory tests such as those conducted for ready biodegradation (e.g., MITI test) or hydrolysis (i.e., following OECD TG 111), among others.
Field Studies Data collected from incidental sampling of environmental media, especially to provide information on partitioning, bioconcentration, or long-term environmental fate.
Modeling Data Calculated values derived from computational models for estimating environmental fate and property data including degradation, bioconcentration, and partitioning.
Monitoring Data
Measured chemical concentration(s) obtained from systematic sampling of environmental media (e.g., air, water, soil, and biota) to observe and study the effect of environment conditions on the fate of chemicals. Monitoring data may include studies of chemical(s) after a known exposure/release of test substance as well as measured chemical concentrations over a period of time to provide direct evidence about fate in environment.
Notes: MITI = Ministry of International Trade and Industry OECD TG = Organisation for Economic Co-operation and Development (OECD) Testing Guideline (TG)
C.2 Data Quality Evaluation Domains
The quality of fate data sources will be evaluated against metrics and criteria grouped into eight evaluation domains: Test Substance; Test Design; Test Conditions; Test Organisms (does not apply to abiotic studies); Outcome Assessment; Confounding/Variable Control; Data Presentation and Analysis; and Other. These domains, as defined in Table C-2, address elements of the TSCA Science Standards 26(h)(1) through 26(h)(5). The evaluation strategies are intended to apply to all fate data, although certain domains, metrics, and criteria may not apply to all studies. For example, there are evaluation strategy considerations for organisms in biodegradation, bioconcentration, or bioaccumulation studies that do not apply to abiotic studies.

43
Table C-2. Data Evaluation Domains and Definitions for Fate Data
Evaluation Domain Definition
Test Substance
Metrics in this domain evaluate whether the information provided in the study provides a reliable18 confirmation that the test substance used in a study has the same (or sufficiently similar) identity, purity, and properties as the test substance of interest.
Test Design Metrics in this domain evaluate whether the experimental design enables the study to distinguish the behavior of the test substance from other factors. This domain includes metrics related to the use of control groups.
Test Conditions
Metrics in this domain assess the reliability of methods used to measure or characterize test substance behavior. These metrics evaluate whether presence of the test substance was characterized using method(s) that provide reliable results over the duration of the experiment.
Test Organisms Metrics in this domain pertain to some fate studies19. These metrics assess the appropriateness of the population or organism(s) to assess the outcome of interest.
Outcome Assessment Metrics in this domain assess the reliability of methods, including sensitivity, that are used to measure or otherwise characterize outcomes. Outcomes may include physical/chemical properties or fate parameters.
Confounding/ Variable Control
Metrics in this domain assess the potential impact of factors other than presence of test substance that may affect the risk of outcome. The metrics evaluate whether studies identify and account for factors that are related to presence of the test substance and independently related to outcome (confounding factors) and whether appropriate experimental or analytical (statistical) methods are used to control for factors unrelated to the presence of test substance that may affect the risk of outcome (variable control).
Data Presentation and Analysis
Metrics in this domain assess whether appropriate experimental or analytical methods were used and if all outcomes are presented.
Other Metrics in this domain are added as needed to incorporate chemical- or study-specific evaluations (i.e., QSAR models).
C.3 Data Quality Evaluation Metrics
Table C-3 lists the data evaluation domains and metrics for fate studies. Each domain has between two and four metrics; however, some metrics may not apply to all fate data. A general domain for other considerations is available for metrics that are specific to a given test substance or study type (i.e., QSAR models). As with all evaluation criteria, EPA may modify the metrics used for fate data as more experience is acquired with the evaluation tools, to support fit-for-purpose TSCA risk evaluations. Any modifications will be documented.
18 Reliability is defined as “the inherent property of a study or data, which includes the use of well-founded
scientific approaches, the avoidance of bias within the study or data collection design and faithful study or data collection conduct and documentation” (ECHA, 2011b).
19 This domain does not apply to abiotic studies.

44
Table C-3. Summary of Metrics for the Fate Data Evaluation Domains
Evaluation Domain
Number of Metrics Overall
Metrics (Metric Number and Description)
Test Substance 2 Metric 1: Test Substance Identity
Metric 2: Test Substance Purity
Test Design 2 Metric 3: Study Controls
Metric 4: Test Substance Stability
Test Conditions 4
Metric 5: Test Method Suitability
Metric 6: Testing Conditions
Metric 7: Testing Consistency
Metric 8: System Type and Design
Test Organisms20 2 Metric 9: Test Organism – Degradation
Metric 10: Test Organism – Partitioning
Outcome Assessment
2 Metric 11: Outcome Assessment Methodology
Metric 12: Sampling Methods
Confounding/ Variable Control
2 Metric 13: Confounding Variables
Metric 14: Outcomes Unrelated to Exposure
Data Presentation and
Analysis 2
Metric 15: Data Presentation
Metric 16: Statistical Methods & Kinetic Calculations
Other 2 Metric 17: Verification or Plausibility of Results
Metric 18: QSAR Models
C.4 Scoring Method and Determination of Overall Data Quality Level
Appendix A provides information about the evaluation method that will be applied across the various data/information sources being assessed to support TSCA risk evaluations. This section provides details about the scoring system that will be applied to fate data/information, including the weighting factors assigned to each metric score of each domain. Some metrics may be given greater weights than others, if they are regarded as key or critical metrics based on expert judgment (Moermond et al., 2016a). Thus, EPA will use a weighting approach to reflect that some metrics are more important than others when assessing the overall quality of the data.
20 This domain does not apply to abiotic studies.
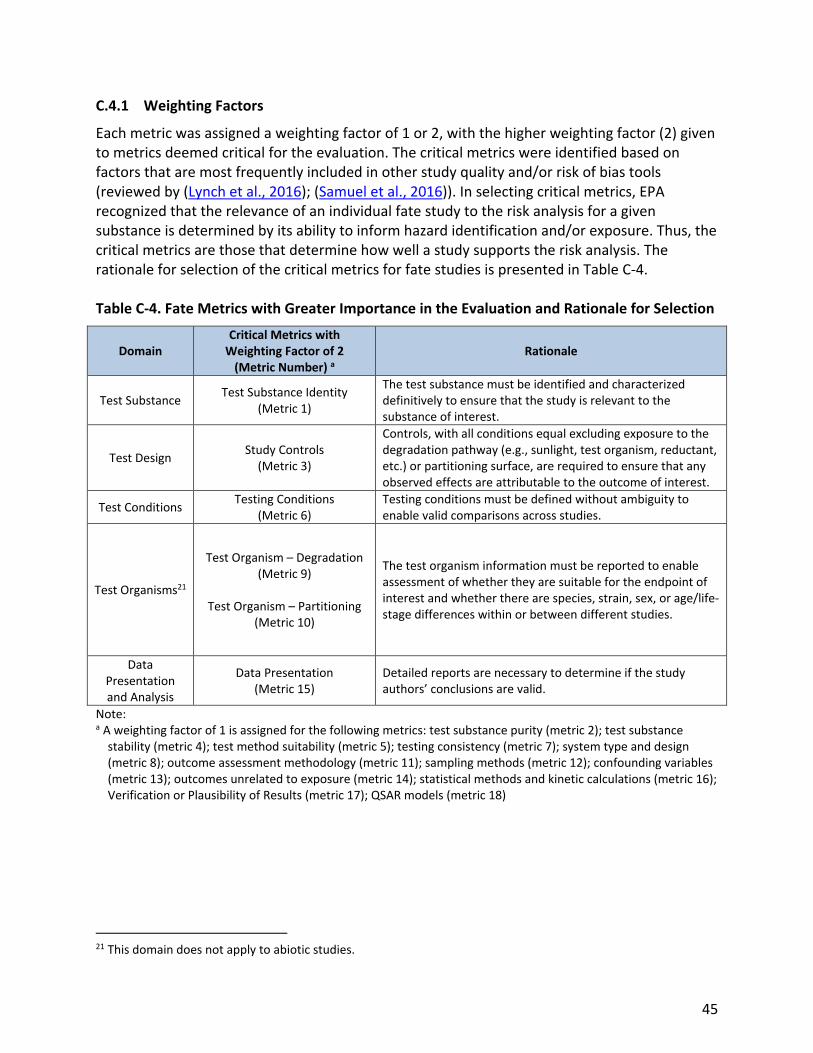
45
C.4.1 Weighting Factors
Each metric was assigned a weighting factor of 1 or 2, with the higher weighting factor (2) given to metrics deemed critical for the evaluation. The critical metrics were identified based on factors that are most frequently included in other study quality and/or risk of bias tools (reviewed by (Lynch et al., 2016); (Samuel et al., 2016)). In selecting critical metrics, EPA recognized that the relevance of an individual fate study to the risk analysis for a given substance is determined by its ability to inform hazard identification and/or exposure. Thus, the critical metrics are those that determine how well a study supports the risk analysis. The rationale for selection of the critical metrics for fate studies is presented in Table C-4. Table C-4. Fate Metrics with Greater Importance in the Evaluation and Rationale for Selection
Domain Critical Metrics with
Weighting Factor of 2 (Metric Number) a
Rationale
Test Substance Test Substance Identity
(Metric 1)
The test substance must be identified and characterized definitively to ensure that the study is relevant to the substance of interest.
Test Design Study Controls
(Metric 3)
Controls, with all conditions equal excluding exposure to the degradation pathway (e.g., sunlight, test organism, reductant, etc.) or partitioning surface, are required to ensure that any observed effects are attributable to the outcome of interest.
Test Conditions Testing Conditions
(Metric 6) Testing conditions must be defined without ambiguity to enable valid comparisons across studies.
Test Organisms21
Test Organism – Degradation (Metric 9)
Test Organism – Partitioning
(Metric 10)
The test organism information must be reported to enable assessment of whether they are suitable for the endpoint of interest and whether there are species, strain, sex, or age/life-stage differences within or between different studies.
Data Presentation and Analysis
Data Presentation (Metric 15)
Detailed reports are necessary to determine if the study authors’ conclusions are valid.
Note: a A weighting factor of 1 is assigned for the following metrics: test substance purity (metric 2); test substance
stability (metric 4); test method suitability (metric 5); testing consistency (metric 7); system type and design (metric 8); outcome assessment methodology (metric 11); sampling methods (metric 12); confounding variables (metric 13); outcomes unrelated to exposure (metric 14); statistical methods and kinetic calculations (metric 16); Verification or Plausibility of Results (metric 17); QSAR models (metric 18)
21 This domain does not apply to abiotic studies.

46
C.4.2 Calculation of Overall Study Score
To determine the overall study score, the first step is to multiply the score for each metric (1, 2, or 3 for high, medium, or low confidence, respectively) by the appropriate weighting factor, as shown in Table C-5, to obtain a weighted metric score. The weighted metric scores are then summed and divided by the sum of the weighting factors (for all metrics that are scored) to obtain an overall study score between 1 and 3. The equation for calculating the overall score is shown below:
Overall Score (range of 1 to 3) = ∑ (Metric Score × Weighting Factor)/∑ (Weighting Factors) Scoring examples for fate studies are given in Tables C-6 to C-8. Studies with any single metric scored as unacceptable (score = 4) will be automatically assigned an overall quality score of 4 (unacceptable) and further evaluation of the remaining metrics is not necessary. An unacceptable score means that serious flaws are noted in the domain metric that consequently make the data unusable (or invalid). EPA/OPPT plans to use data with an overall quality level of High, Medium, or Low confidence to quantitatively or qualitatively support the risk evaluations, but does not plan to use data rated as Unacceptable. Any metrics that are not rated/not applicable to the study under evaluation will not be considered in the numerator or calculation of the study’s overall quality score. These metrics will not be included in the nominator or denominator of the overall score equation. The overall score will be calculated using only those metrics that receive a numerical score. In addition, if a publication reports more than one study or endpoint, each study and, as needed, each endpoint will be evaluated separately. Detailed tables showing quality criteria for the metrics are provided in Tables C-9 through C-10, including a table that summarizes the serious flaws that would make the data unacceptable for use in the environmental fate assessment.

47
Table C-5. Metric Weighting Factors and Range of Weighted Metric Scores for Scoring the
Quality of Environmental Fate Data
Domain Number/ Description
Metric Number/Description Range of
Metric Scoresa
Metric Weighting
Factor
Range of Weighted
Metric Scoresb
1. Test Substance 1. Test Substance Identity 1 to 3 2 2 to 6
2. Test Substance Purity 1 to 3 1 1 to 3
2. Test Design 3. Study Controls 1 to 3 2 2 to 6
4. Test Substance Stability 1 to 3 1 1 to 3
3. Test Conditions
5. Test Method Suitability 1 to 3 1 1 to 3
6. Testing Conditions 1 to 3 2 2 to 6
7. Testing Consistency 1 to 2 1 1 to 3
8. System Type and Design 1 to 2 1 1 to 3
4. Test Organisms22 9. Test Organism - Degradation 1 to 3 2 2 to 6
10. Test Organism - Partitioning 1 to 3 2 2 to 6
5. Outcome Assessment
11. Outcome Assessment Methodology 1 to 3 1 1 to 3
12. Sampling Methods 1 to 3 1 1 to 3
6. Confounding/ Variable Control
13. Confounding Variables 1 to 3 1 1 to 3
14. Outcomes Unrelated to Exposure23 1 to 2 1 1 to 3
7. Data Presentation and Analysis
15. Data Reporting 1 to 3 2 2 to 6
16. Statistical Methods & Kinetic Calculations
1 to 3 1 1 to 3
8. Other 17. Verification or Plausibility of Results 1 to 3 1 1 to 3
18. QSAR Models 1 1 1 to 3
Sum= 24 Sum= 24 to 72
Range of Overall Scores after using equation Overall Score = ∑ (Metric Score × Metric Weighting Factor)/∑ (Metric Weighting Factors)
24/24= 1; 72/24=3
Range of overall
score = 1 to 3d
Notes: a For the purposes of calculating an overall study score, the range of possible metric scores is 1 to 3 for each metric,
corresponding to high and low confidence. No calculations will be conducted if a study receives an “unacceptable” rating (score of “4”) for any metric.
b The range of weighted scores for each metric is calculated by multiplying the range of metric scores (1 to 3) by the weighting factor for that metric.
c The sum of weighting factors and the sum of the weighted scores will differ if some metrics are not scored (not applicable).
d The range of possible overall scores is 1 to 3. If a study receives a score of 1 for every metric, then the overall study score will be 1. If a study receives a score of 3 for every metric, then the overall study score will be 3.
22 This domain does not apply to abiotic studies. 23 This metric does not apply to abiotic studies.

48
Table C-6. Scoring Example for Abiotic Fate Data (i.e., hydrolysis data) with All Applicable Metrics Scored
Domain Metric Metric Score Metric Weighting
Factor
Weighted Metric Score
1. Test Substance 1. Test Substance Identity 1 2 2
2. Test Substance Purity 2 1 2
2. Test Design 3. Study Controls 1 2 2
4. Test Substance Stability 3 1 3
3. Test Conditions 5. Test Method Suitability 1 1 1
6. Testing Conditions 1 2 2
7. Testing Consistency 1 1 1
8. System Type and Design 1 1 1
4. Test Organisms 9. Test Organism - Degradation N/A
10. Test Organism - Partitioning N/A
5. Outcome Assessment 11. Outcome Assessment Methodology 2 1 2
12. Sampling Methods 1 1 1
6. Confounding/ Variable Control
13. Confounding Variables 1 1 1
14. Outcomes Unrelated to Exposure N/A
7. Data Presentation and Analysis
15. Data Reporting 2 2 4
16. Statistical Methods & Kinetic Calculations 1 1 1
8. Other 17. Verification or Plausibility of Results 1 1 1
18. QSAR Models N/A
Sum
18 24
N/A = not applicable to abiotic data Overall Study Score 1.3333 = High
Overall Score = Sum of Weighted Scores/Sum of Metric Weighting Factor
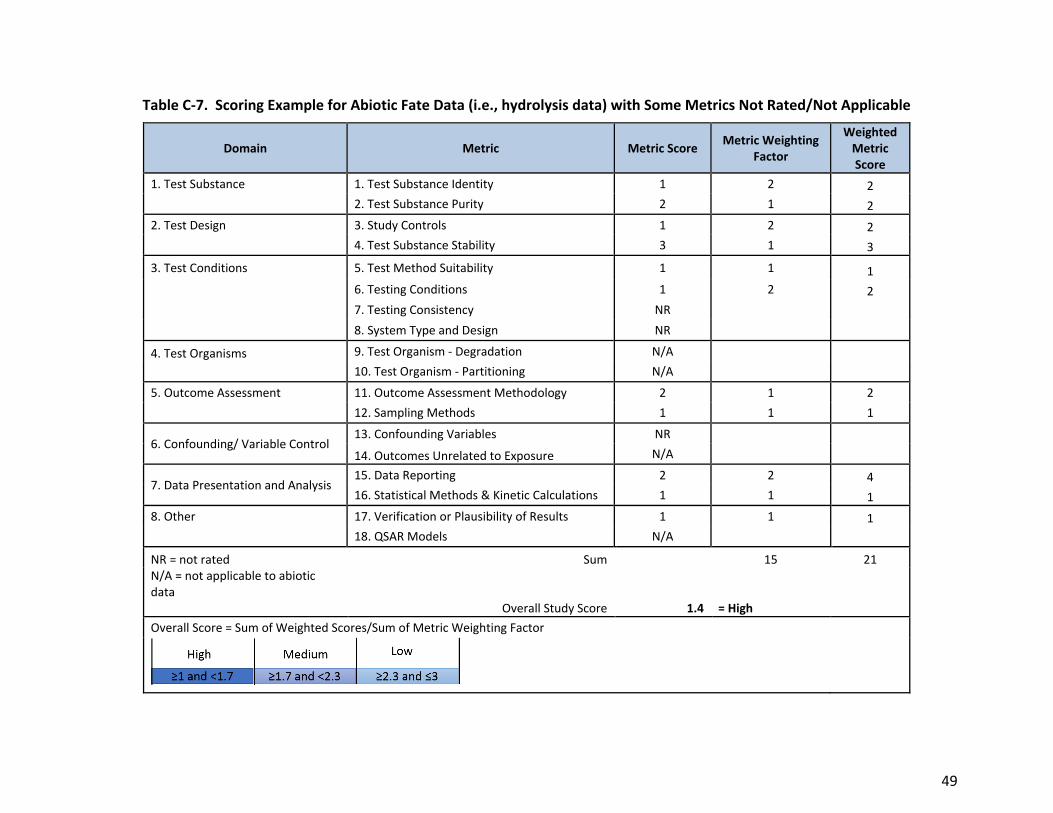
49
Table C-7. Scoring Example for Abiotic Fate Data (i.e., hydrolysis data) with Some Metrics Not Rated/Not Applicable
Domain Metric Metric Score Metric Weighting
Factor
Weighted Metric Score
1. Test Substance 1. Test Substance Identity 1 2 2
2. Test Substance Purity 2 1 2
2. Test Design 3. Study Controls 1 2 2
4. Test Substance Stability 3 1 3
3. Test Conditions 5. Test Method Suitability 1 1 1
6. Testing Conditions 1 2 2
7. Testing Consistency NR
8. System Type and Design NR
4. Test Organisms 9. Test Organism - Degradation N/A
10. Test Organism - Partitioning N/A
5. Outcome Assessment 11. Outcome Assessment Methodology 2 1 2
12. Sampling Methods 1 1 1
6. Confounding/ Variable Control 13. Confounding Variables NR
14. Outcomes Unrelated to Exposure N/A
7. Data Presentation and Analysis 15. Data Reporting 2 2 4
16. Statistical Methods & Kinetic Calculations 1 1 1
8. Other 17. Verification or Plausibility of Results 1 1 1
18. QSAR Models N/A
NR = not rated Sum
15 21
N/A = not applicable to abiotic data Overall Study Score 1.4 = High
Overall Score = Sum of Weighted Scores/Sum of Metric Weighting Factor

50
Table C-8. Scoring Example for QSAR Data
Domain Number/ Description
Metric Number/Description Metric Score a
Metric Weighting
Factor
Weighted Metric Score b
1. Test Substance 1. Test Substance Identity NR N/A N/A
2. Test Substance Purity NR N/A N/A
2. Test Design 3. Study Controls NR N/A N/A
4. Test Substance Stability NR N/A N/A
3. Test Conditions
5. Test Method Suitability NR N/A N/A
6. Testing Conditions NR N/A N/A
7. Testing Consistency NR N/A N/A
8. System Type and Design NR N/A N/A
4. Test Organisms24 9. Test Organism - Degradation NR N/A N/A
10. Test Organism - Partitioning NR N/A N/A
5. Outcome Assessment
11. Outcome Assessment Methodology NR N/A N/A
12. Sampling Methods NR N/A N/A
6. Confounding/ Variable Control
13. Confounding Variables NR N/A N/A
14. Outcomes Unrelated to Exposure25 NR N/A N/A
7. Data Presentation and Analysis
15. Data Reporting NR N/A N/A
16. Statistical Methods & Kinetic Calculations
NR N/A N/A
8. Other 17. Verification or Plausibility of Results 2 1 2
18. QSAR Models 1 1 1
Sum (of all metrics scored)b 2 3
Range of Overall Scores after using equation Overall Score = ∑ (Metric Score × Metric Weighting Factor)/∑ (Metric Weighting Factors)
3/2=1.5
1.5 (High)
Notes: a For the purposes of calculating an overall study score, the range of possible metric scores is 1 to 3 for each metric, corresponding to high and low confidence. No calculations will be conducted if a study receives an unacceptable rating (score of “4”) for any metric. b The sum of weighting factors and the sum of the weighted scores will differ if some metrics are not scored (not rated/ applicable). NR: Not rated N/A: Not applicable
24 This domain does not apply to abiotic studies. 25 This metric does not apply to abiotic studies.

51
C.5 Data Quality Criteria
Table C-9. Serious Flaws that Would Make Fate Data Unacceptable for Use in the Fate Assessment
Optimization of the list of serious flaws may occur after pilot calibration exercises.
Domain Number/
Description
Metric Number
Description of Serious Flaw(s) in Data Source
1. Test Substance
1 The test substance identity could not be determined from the information provided.
2 The nature and quantity of reported impurities were such that study results were unduly influenced by one or more of the impurities.
2. Test Design
3
The study did not include or report control groups that consequently made the study unusable (e.g., no positive control data for a non-guideline biodegradation study with a novel media and/or inoculum, reporting 0% removal).
The vehicle (e.g., oil or carrier solvent) used in the study was likely to unduly influence the study results.
4 There were problems with test substance stability, homogeneity, preparation, or storage conditions that had an impact on concentration or dose estimates and interfered with interpretation of study results.
3. Test Conditions
5 The test method was not reported or not suitable for the test substance.
6
The testing conditions were not reported and sufficient data were not provided to interpret results.
Testing conditions were not appropriate for the method (e.g., a biodegradation study at temperatures that inhibit the microorganisms) resulting in serious flaws that make the study unusable.
7 Critical exposure details across samples or study groups were not reported and these omissions resulted in serious flaws that had a substantial impact on the overall confidence, consequently making the study unusable.
8
Equilibrium was not established or reported preventing meaningful interpretation of study results OR The system type and design (i.e., static, semi-static, and flow-through; sealed, open) were not capable of appropriately maintaining substance concentrations preventing meaningful interpretation of study results. These are serious flaws that make the study unusable.
4. Test Organisms
9 The test organism, species, or inoculum source was not reported.
10 The test organism was not reported.
5. Outcome Assessment
11 The assessment methodology did not address or report the outcome(s) of interest.
12 Serious uncertainties or limitations were identified in sampling methods of the outcome(s) of interest and these were likely to have a substantial impact on the results, resulting in serious flaws which make the study unusable.
6. Confounding/ Variable Control
13 There were sources of variability and uncertainty in the measurements and statistical techniques or between study groups resulting in serious flaws that make the study unusable.
14
Attrition or health outcomes were not reported and this omission was likely to have a substantial impact on study results.
One or more study groups experienced disproportionate organism attrition or health outcomes that influenced the outcome assessment.

52
Domain Number/
Description
Metric Number
Description of Serious Flaw(s) in Data Source
7. Data Presentation and Analysis
15 The analytical method used was not suitable for detection of the test substance.
16 Statistical methods or kinetic calculations used were likely to provide biased results.
8. Other
17 Reported value was completely inconsistent with reference substance data, related physical chemical properties, or analog data, or was otherwise implausible, suggesting that an unidentified serious study deficiency exists.
18 The QSAR model did not have a defined endpoint, unambiguous endpoint
The model performance was not known or r2 < 0.7, q2 < 0.5 or SE > 0.3 (ECHA, 2016).
Table C-10. Data Quality Criteria for Fate Data
Confidence Level (Score)
Description Selected
Score
Domain 1. Test Substance
Metric 1: Test substance identity Was the test substance identified definitively?
High (score = 1)
The test substance was identified definitively (i.e., established nomenclature, CASRN, or structure reported, including information on the specific form tested [particle characteristics for solid-state materials, salt or base, valence state, isomer, etc.] for materials that may vary in form, or submitting company’s code name with supporting confirmatory documentation) and the specific form characterized, where applicable.
Medium (score = 2)
The test substance was identified by trade name or other internal designation, but characterization details were omitted that could affect interpretation of study results; however, the omission was not likely to have a substantial impact on the study results.
Low (score = 3)
The test substance was identified; however, it lacked specific characteristics such as stereochemistry or valence state OR there were some uncertainties or conflicting information regarding test substance identification or characterization that were likely to have a substantial impact on the study results.
Unacceptable (score = 4)
The test substance identity could not be determined from the information provided (e.g., nomenclature was unclear and CASRN or structure was not reported). This is a serious flaw that makes the study unusable.
Not rated/applicable
Reviewer’s comments
[Document concerns, uncertainties, limitations, and deficiencies and any additional comments that may highlight study strengths or important elements such as relevance]

53
Confidence Level (Score)
Description Selected
Score
Metric 2: Test substance purity Was the source of the test substance reported? If the test substance was synthesized or extracted (as part of the synthesis or from a substrate), was the test substance identity verified by analytical methods? Were the purity, grade or hydration state (e.g., analytical, technical) of the test substance reported? If the test substance was tested as part of a finished or formulated product, was the full chemical composition of the formulation reported?
High (score = 1)
The source or purity of the test substance was reported or the test substance identity and purity were verified by analytical means (chemical analysis, etc.) OR if the test substance was tested as part of a finished or formulated product, the full chemical composition of the formulation was reported AND any observed effects were likely due to the nominal test substance itself (e.g., pure, analytical grade, technical grade test substance, or other substances in the formulation were inert, or the other components were inert under the test conditions).
Medium (score = 2)
The test substance source was not reported AND/OR the test substance purity was low or not reported (e.g., lack of information on hydration state of a compound introduces uncertainty into concentration calculations); however, the omissions or identified impurities were not likely to have a substantial impact on the study results.
Low (score = 3)
The source and purity of the test substance were not reported or verified by analytical means OR The test substance was synthesized or extracted and its identity was not verified by analytical means (i.e., chemical analysis, etc.) OR identified impurities were likely to have a substantial impact on study results.
Unacceptable (score = 4)
The nature and quantity of reported impurities were such that study results were unduly influenced by one or more of the impurities. These are serious flaws that make the study unusable.
Not rated/applicable
Reviewer’s comments
[Document concerns, uncertainties, limitations, and deficiencies and any additional comments that may highlight study strengths or important elements such as relevance]

54
Confidence Level (Score)
Description Selected
Score
Domain 2. Test Design
Metric 3: Study controls Was a concurrent negative control or blank group included? Were positive and toxicity controls included? If a vehicle was used, was the control group exposed to the vehicle? Is the selected vehicle unlikely to influence the study results, stability, bioavailability or/toxicity of the test substance?
High (score = 1)
A concurrent negative control, or blank group, toxicity control, and positive control were included (where applicable) AND results from controls were within the ranges specified for test validity (or validity criteria for equivalent or similar tests, if not a guideline test) AND a concurrent blank with vehicle (e.g., oil or carrier solvent) was included and the vehicle was not likely to influence the study results (where applicable).
Medium (score = 2)
Some concurrent control group details were not included; however, the lack of data was not likely to have a substantial impact on study results AND the vehicle was not likely to influence the study results (where applicable).
Low (score = 3)
Reported results from control group(s) were outside the ranges specified for test validity (or validity criteria for equivalent or similar tests, if not a guideline test) OR the vehicle was likely to have a substantial impact on study results.
Unacceptable (score = 4)
The study did not include or report crucial control groups that consequently made the study unusable (e.g., no positive control for a biodegradation study reporting 0% removal) OR the vehicle used in the study was likely to unduly influence the study results. These are serious flaws that make the study unusable.
Not rated/applicable
The study did not require concurrent control groups.
Reviewer’s comments
[Document concerns, uncertainties, limitations, and deficiencies and any additional comments that may highlight study strengths or important elements such as relevance]
Metric 4: Test substance stability Did the study characterize and accommodate the test substance stability, homogeneity, preparation, and storage conditions? Were the frequency of preparation and storage conditions appropriate to the test substance stability?
High (score = 1)
The test substance stability, homogeneity, preparation, and storage conditions were reported (e.g., mixing temperature, stock concentration, stirring methods, centrifugation or filtration), and were appropriate for the study (e.g., a test substance known to degrade in light was stored in dark or amber bottles).
Medium (score = 2)
The test substance stability, homogeneity, preparation or storage conditions were not reported; however, these factors were not likely to influence the test substance or were not likely to have a substantial impact on study results.
Low (score = 3)
The test substance stability, homogeneity, preparation, and storage conditions were not reported and these factors likely influenced the test substance or are likely to have a substantial impact on the study results.
Unacceptable (score = 4)
There were problems with test substance stability, homogeneity, preparation, or storage conditions that had an impact on concentration or dose estimates and interfered with interpretation of study results. These are serious flaws that make the study unusable.

55
Confidence Level (Score)
Description Selected
Score
Not rated/applicable
Reviewer’s comments
[Document concerns, uncertainties, limitations, and deficiencies and any additional comments that may highlight study strengths or important elements such as relevance]
Domain 3. Test Conditions
Metric 5: Test method suitability Was the test method reported and suitable for the test material? Was the target chemical tested at concentrations below its aqueous solubility?
High (score = 1)
The test method was suitable for the test substance AND the target chemical was tested at concentrations below its aqueous solubility (when applicable).
Medium (score = 2)
The test method was suitable for the test substance with minor deviations AND/OR nominal estimates of media concentrations were provided, but, the levels were not measured or suitable to the study type or outcome(s) of interest AND these deviations or omissions were not likely to have a substantial impact on study results.
Low (score = 3)
Applied target chemical concentrations were greater than the aqueous solubility AND the deviations were likely to have a substantial impact on the results.
Unacceptable (score = 4)
The test method was not reported or not suitable for the test substance. These deviations or lack of information resulted in serious flaws that make the study unusable.
Not rated/applicable
Reviewer’s comments
[Document concerns, uncertainties, limitations, and deficiencies and any additional comments that may highlight study strengths or important elements such as relevance]
Metric 6: Testing conditions Were the test conditions monitored, reported, and appropriate for the study method (e.g., the temperature range reported, dissolved organic matter, aeration, total organic matter, pH or water hardness reported and maintained throughout the test)?
High (score = 1)
Testing conditions were monitored, reported, and appropriate for the method. For example, depending on the study, the following conditions were reported:
aerobic/anaerobic conditions reported
dissolved oxygen (DO) measured
redox/electron activity (pE) parameters listed and/or anaerobic conditions otherwise identified (e.g., sulfate reducing, methanogenic, etc.)
pH buffer for studies on the fate of a substance that may exist in ionized form(s) in the pH range of environmental relevance
For studies in aquatic environments, conditions reported separately for both the water and sediment column
For studies in soil, soil type (location if available), moisture level, soil particle size distribution, background SOM (soil organic matter) or OC (organic carbon) content, CEC (cation exchange capacity) or soil pH, soil name (e.g., USDA series)

56
Confidence Level (Score)
Description Selected
Score
Medium (score = 2)
There were reported deviations or omissions in testing conditions (e.g., temperature was not constant or was not in a standard range for the test but, results can be extrapolated to approximate appropriate temperatures); however, sufficient data were reported to determine that the deviations and omissions were not likely to have a substantial impact on study results.
Low (score = 3)
Inappropriate test conditions for the study method (e.g., temperature fluctuations) and the deviations were likely to have a substantial impact on the results.
Unacceptable (score = 4)
Testing conditions were not reported and data provided were insufficient to interpret results OR testing conditions were not appropriate for the method (e.g., a biodegradation study at temperatures that inhibit the microorganisms) resulting in serious flaws that make the study unusable.
Not rated/applicable
Reviewer’s comments
[Document concerns, uncertainties, limitations, and deficiencies and any additional comments that may highlight study strengths or important elements such as relevance]
Metric 7: Testing consistency Were test conditions established to be consistent across samples or study groups? Were multiple exposures evaluated, where applicable?
High (score = 1)
Test conditions were consistent across samples or study groups (i.e., same exposure method and timing, comparable particle size characteristics). The conditions of the exposure were documented.
Medium (score = 2)
There were minor inconsistencies in test conditions across samples or study groups OR some test conditions across samples or study groups were not reported, but these discrepancies were not likely to have a substantial impact on study results.
Low (score = 3)
There were inconsistencies in test conditions across samples or study groups that are likely to have a substantial impact on results.
Unacceptable (score = 4)
Critical exposure details across samples or study groups were not reported and these omissions resulted in serious flaws that had a substantial impact on the overall confidence, consequently making the study unusable.
Not rated/applicable
Reviewer’s comments
[Document concerns, uncertainties, limitations, and deficiencies and any additional comments that may highlight study strengths or important elements such as relevance]
Metric 8: System type and design* Was equilibrium established? Were the system type and design capable of appropriately maintaining substance concentrations for experimental studies? * For studies of partitioning
High (score = 1)
Equilibrium was established. The system type and design (i.e., static, semi-static, and flow-through; sealed, open) were capable of appropriately maintaining substance concentrations.
Medium (score = 2)
Equilibrium was not established or reported but this was not likely to have a substantial impact on study results OR
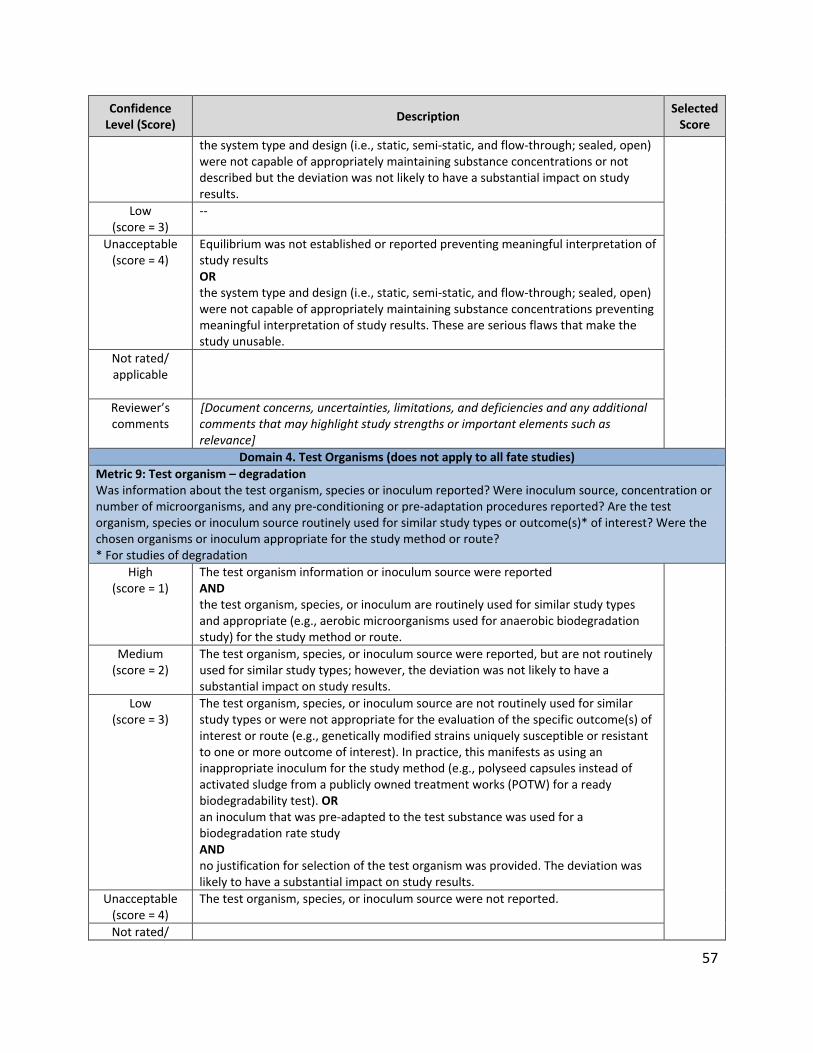
57
Confidence Level (Score)
Description Selected
Score
the system type and design (i.e., static, semi-static, and flow-through; sealed, open) were not capable of appropriately maintaining substance concentrations or not described but the deviation was not likely to have a substantial impact on study results.
Low (score = 3)
--
Unacceptable (score = 4)
Equilibrium was not established or reported preventing meaningful interpretation of study results OR the system type and design (i.e., static, semi-static, and flow-through; sealed, open) were not capable of appropriately maintaining substance concentrations preventing meaningful interpretation of study results. These are serious flaws that make the study unusable.
Not rated/applicable
Reviewer’s comments
[Document concerns, uncertainties, limitations, and deficiencies and any additional comments that may highlight study strengths or important elements such as relevance]
Domain 4. Test Organisms (does not apply to all fate studies)
Metric 9: Test organism – degradation Was information about the test organism, species or inoculum reported? Were inoculum source, concentration or number of microorganisms, and any pre-conditioning or pre-adaptation procedures reported? Are the test organism, species or inoculum source routinely used for similar study types or outcome(s)* of interest? Were the chosen organisms or inoculum appropriate for the study method or route? * For studies of degradation
High (score = 1)
The test organism information or inoculum source were reported AND the test organism, species, or inoculum are routinely used for similar study types and appropriate (e.g., aerobic microorganisms used for anaerobic biodegradation study) for the study method or route.
Medium (score = 2)
The test organism, species, or inoculum source were reported, but are not routinely used for similar study types; however, the deviation was not likely to have a substantial impact on study results.
Low (score = 3)
The test organism, species, or inoculum source are not routinely used for similar study types or were not appropriate for the evaluation of the specific outcome(s) of interest or route (e.g., genetically modified strains uniquely susceptible or resistant to one or more outcome of interest). In practice, this manifests as using an inappropriate inoculum for the study method (e.g., polyseed capsules instead of activated sludge from a publicly owned treatment works (POTW) for a ready biodegradability test). OR an inoculum that was pre-adapted to the test substance was used for a biodegradation rate study AND no justification for selection of the test organism was provided. The deviation was likely to have a substantial impact on study results.
Unacceptable (score = 4)
The test organism, species, or inoculum source were not reported.
Not rated/

58
Confidence Level (Score)
Description Selected
Score
applicable
Reviewer’s comments
[Document concerns, uncertainties, limitations, and deficiencies and any additional comments that may highlight study strengths or important elements such as relevance]
Metric 10: Test organism – partitioning Was information about the test organism reported? Was the test organism source known? Is the test organism or species routinely used for similar study types or outcome(s)* of interest? * For studies of partitioning
High (score = 1)
Test organism information was reported, including species or sex, age, and starting body weight (where applicable) OR the test organism was obtained from a reliable or commercial source AND the test organism or species is routinely used for similar study types.
Medium (score = 2)
The test organism was obtained from a reliable or commercial source OR the test organism or species is routinely used for similar study types; however, one or more additional characteristics of the organisms were not reported (i.e., sex, health status, age, or starting body weight), but these omissions were not likely to have a substantial impact on study results.
Low (score = 3)
The test organism was not obtained from a reliable or commercial source OR the test organism or species is not routinely used for similar study types or was not appropriate (i.e., species, life-stage) for the evaluation of the specific outcome(s) of interest (e.g., genetically modified organisms, strain was uniquely susceptible or resistant to one or more outcome of interest) AND no justification for selection of the test organism was provided. The deviations were likely to have a substantial impact on study results.
Unacceptable (score = 4)
The test organism information was not reported.
Not rated/applicable
Reviewer’s comments
[Document concerns, uncertainties, limitations, and deficiencies and any additional comments that may highlight study strengths or important elements such as relevance]
Domain 5. Outcome Assessment
Metric 11: Outcome* assessment methodology Did the outcome* assessment methodology address and report the outcome(s)* of interest? * For all fate studies (i.e., degradation, partitioning, etc.)
High (score = 1)
The outcome assessment methodology addressed or reported the intended outcome(s) of interest.
Medium (score = 2)
There were minor differences between the assessment methodology and the intended outcome assessment (i.e. biodegradation rate not reported; however, degradation products and a degradation pathway were determined) OR there was incomplete reporting of outcome assessment methods; however, such differences or absence of details were not likely to be severe or have a substantial impact on the study results.
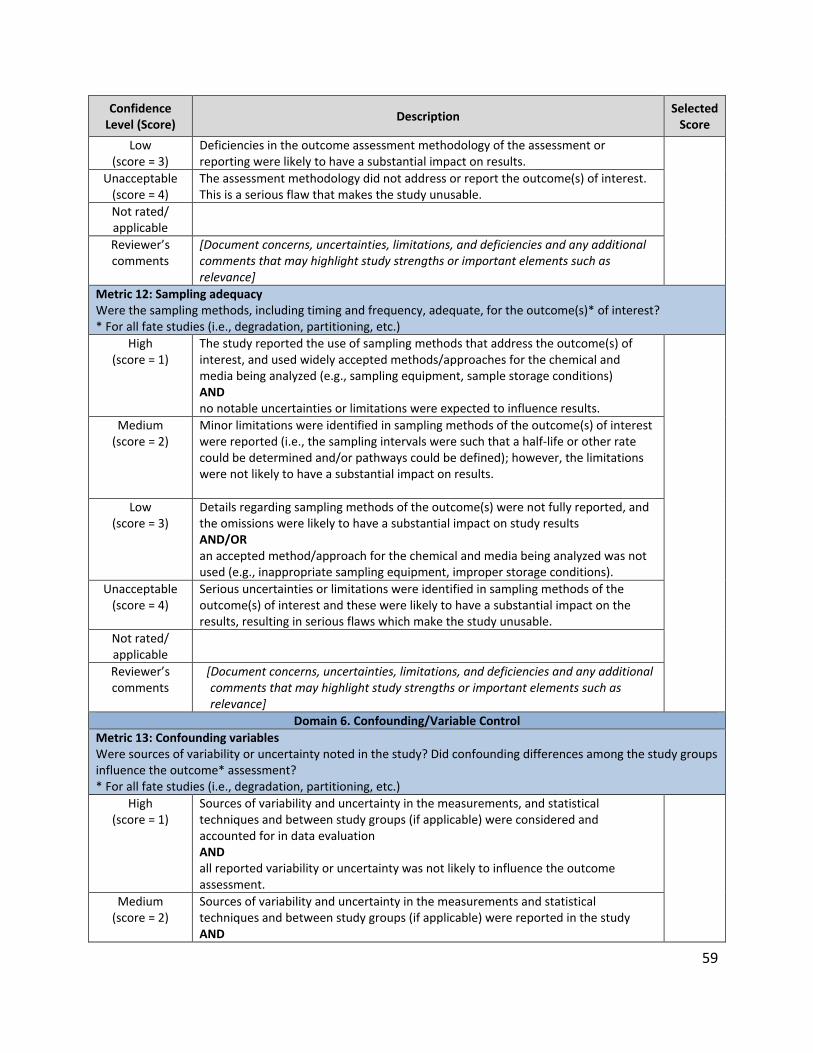
59
Confidence Level (Score)
Description Selected
Score
Low (score = 3)
Deficiencies in the outcome assessment methodology of the assessment or reporting were likely to have a substantial impact on results.
Unacceptable (score = 4)
The assessment methodology did not address or report the outcome(s) of interest. This is a serious flaw that makes the study unusable.
Not rated/applicable
Reviewer’s comments
[Document concerns, uncertainties, limitations, and deficiencies and any additional comments that may highlight study strengths or important elements such as relevance]
Metric 12: Sampling adequacy Were the sampling methods, including timing and frequency, adequate, for the outcome(s)* of interest? * For all fate studies (i.e., degradation, partitioning, etc.)
High (score = 1)
The study reported the use of sampling methods that address the outcome(s) of interest, and used widely accepted methods/approaches for the chemical and media being analyzed (e.g., sampling equipment, sample storage conditions) AND no notable uncertainties or limitations were expected to influence results.
Medium (score = 2)
Minor limitations were identified in sampling methods of the outcome(s) of interest were reported (i.e., the sampling intervals were such that a half-life or other rate could be determined and/or pathways could be defined); however, the limitations were not likely to have a substantial impact on results.
Low (score = 3)
Details regarding sampling methods of the outcome(s) were not fully reported, and the omissions were likely to have a substantial impact on study results AND/OR an accepted method/approach for the chemical and media being analyzed was not used (e.g., inappropriate sampling equipment, improper storage conditions).
Unacceptable (score = 4)
Serious uncertainties or limitations were identified in sampling methods of the outcome(s) of interest and these were likely to have a substantial impact on the results, resulting in serious flaws which make the study unusable.
Not rated/applicable
Reviewer’s comments
[Document concerns, uncertainties, limitations, and deficiencies and any additional comments that may highlight study strengths or important elements such as relevance]
Domain 6. Confounding/Variable Control
Metric 13: Confounding variables Were sources of variability or uncertainty noted in the study? Did confounding differences among the study groups influence the outcome* assessment? * For all fate studies (i.e., degradation, partitioning, etc.)
High (score = 1)
Sources of variability and uncertainty in the measurements, and statistical techniques and between study groups (if applicable) were considered and accounted for in data evaluation AND all reported variability or uncertainty was not likely to influence the outcome assessment.
Medium (score = 2)
Sources of variability and uncertainty in the measurements and statistical techniques and between study groups (if applicable) were reported in the study AND

60
Confidence Level (Score)
Description Selected
Score
the differences in the measurements and statistical techniques and between study groups were considered or accounted for in data evaluation with minor deviations or omissions AND the minor deviations or omissions were not likely to have a substantial impact on study results.
Low (score = 3)
Sources of variability and uncertainty in the measurements and statistical techniques and between study groups (if applicable) were not considered or accounted for in data evaluation resulting in some uncertainty AND there is concern that variability or uncertainty was likely to have a substantial impact on the results.
Unacceptable (score = 4)
There were sources of variability and uncertainty in the measurements and statistical techniques or between study groups resulting in serious flaws that make the study unusable.
Not rated/applicable
Reviewer’s comments
[Document concerns, uncertainties, limitations, and deficiencies and any additional comments that may highlight study strengths or important elements such as relevance]
Metric 14: Outcomes unrelated to exposure Were there differences among the study groups in organism attrition or health outcomes unrelated to exposure to the test substance that influenced the outcome* assessment? * For studies of partitioning in organisms
High (score = 1)
There were multiple study groups, and there were no differences among the study groups in organism attrition or health outcomes (i.e., unexplained mortality) that influenced the outcome assessment.
Medium (score = 2)
Attrition or health outcomes were not reported; however, this omission was not likely to have a substantial impact on study results.
Low (score = 3)
--
Unacceptable (score = 4)
Attrition or health outcomes were not reported and this omission was likely to have a substantial impact on study results OR one or more study groups experienced disproportionate organism attrition or health outcomes that influenced the outcome assessment (e.g., pH drastically decreased for one treatment and resulted in pH effects versus effects from the chemical being tested). This is a serious flaw that makes the study unusable.
Not rated/applicable
Reviewer’s comments
[Document concerns, uncertainties, limitations, and deficiencies and any additional comments that may highlight study strengths or important elements such as relevance]
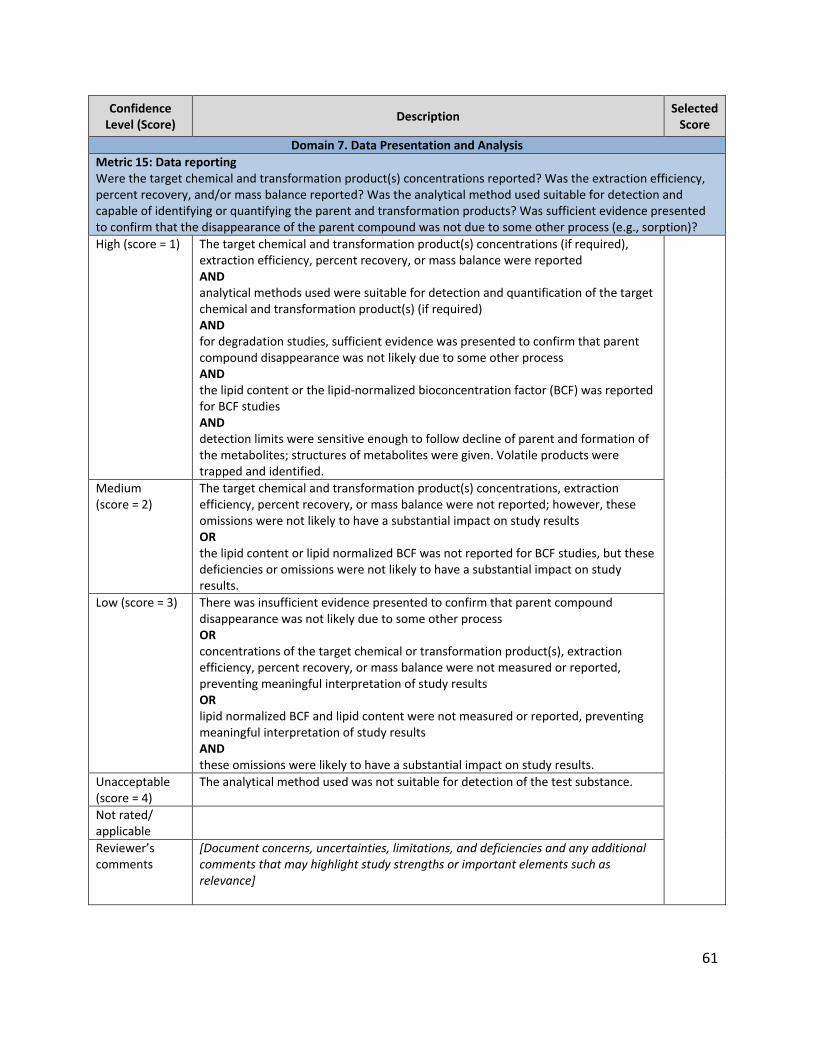
61
Confidence Level (Score)
Description Selected
Score
Domain 7. Data Presentation and Analysis
Metric 15: Data reporting Were the target chemical and transformation product(s) concentrations reported? Was the extraction efficiency, percent recovery, and/or mass balance reported? Was the analytical method used suitable for detection and capable of identifying or quantifying the parent and transformation products? Was sufficient evidence presented to confirm that the disappearance of the parent compound was not due to some other process (e.g., sorption)?
High (score = 1) The target chemical and transformation product(s) concentrations (if required), extraction efficiency, percent recovery, or mass balance were reported AND analytical methods used were suitable for detection and quantification of the target chemical and transformation product(s) (if required) AND for degradation studies, sufficient evidence was presented to confirm that parent compound disappearance was not likely due to some other process AND the lipid content or the lipid-normalized bioconcentration factor (BCF) was reported for BCF studies AND detection limits were sensitive enough to follow decline of parent and formation of the metabolites; structures of metabolites were given. Volatile products were trapped and identified.
Medium (score = 2)
The target chemical and transformation product(s) concentrations, extraction efficiency, percent recovery, or mass balance were not reported; however, these omissions were not likely to have a substantial impact on study results OR the lipid content or lipid normalized BCF was not reported for BCF studies, but these deficiencies or omissions were not likely to have a substantial impact on study results.
Low (score = 3) There was insufficient evidence presented to confirm that parent compound disappearance was not likely due to some other process OR concentrations of the target chemical or transformation product(s), extraction efficiency, percent recovery, or mass balance were not measured or reported, preventing meaningful interpretation of study results OR lipid normalized BCF and lipid content were not measured or reported, preventing meaningful interpretation of study results AND these omissions were likely to have a substantial impact on study results.
Unacceptable (score = 4)
The analytical method used was not suitable for detection of the test substance.
Not rated/applicable
Reviewer’s comments
[Document concerns, uncertainties, limitations, and deficiencies and any additional comments that may highlight study strengths or important elements such as relevance]

62
Confidence Level (Score)
Description Selected
Score
Metric 16. Statistical methods & kinetic calculations Were statistical methods or kinetic calculations clearly described and consistent?
High (score = 1) Statistical methods or kinetic calculations were clearly described and address the dataset(s).
Medium (score = 2)
Statistical analysis used an outdated, unusual, or non-robust method; however, the study results were likely to be similar to those obtained using a current/ more robust method OR kinetic calculations were not clearly described AND these differences were not likely to have a substantial impact on study results. OR No statistical analyses were conducted; however, sufficient data were provided to conduct an independent statistical analysis.
Low (score = 3) Statistical analysis or kinetic calculations were not conducted or were not described clearly AND the lack of information was likely to have a substantial impact on study results.
Unacceptable (score = 4)
Statistical methods or kinetic calculations used were likely to provide biased results. These are serious flaws that make the study unusable.
Not rated/applicable
Reviewer’s comments
[Document concerns, uncertainties, limitations, and deficiencies and any additional comments that may highlight study strengths or important elements such as relevance]
Domain 8. Other
Metric 17. Verification or Plausibility of Results Were the study results reasonable? Was anything not covered in the evaluation questions?
High (score = 1) Reported values were within expected range as defined by reference substance(s) OR reported values were consistent with related physical chemical properties (e.g., considering KOW, pKa, vapor pressure, etc.).
Medium (score = 2)
The study results were reasonable AND the reported value was outside expected range, as defined by reference substance(s) or in relation to related physical chemical properties (e.g., considering KOW, vapor pressure, etc.); however, no serious study deficiencies were identified, and the value was plausible.
Low (score = 3) Due to limited information, evaluation of the reasonableness of the study results was not possible (i.e., reference substance(s) not used or physical-chemical properties unknown and unable to be estimated).
Unacceptable (score = 4)
Reported value was completely inconsistent with reference substance data, related physical chemical properties, analog data, or otherwise implausible, suggesting that an unidentified serious study deficiency exists. These are serious flaws that make the study unusable.
Not rated/applicable
Reviewer’s comments
[Document concerns, uncertainties, limitations, and deficiencies and any additional comments that may highlight study strengths or important elements such as

63
Confidence Level (Score)
Description Selected
Score
relevance]
Metric 18. QSAR Models Did the QSAR model have a defined, unambiguous endpoint and appropriate measures of goodness-of-fit, robustness and predictivity, defined by r2 > 0.7, q2 > 0.5 and SE < 0.3, where r2 is the correlation coefficient, q2 is the cross-validated correlation coefficient and SE is the standard error (ECHA, 2016)?
High (score = 1) The QSAR model had a defined, unambiguous endpoint AND the model performance was known and r2 > 0.7, q2 > 0.5, and SE < 0.3 (ECHA, 2016).
Medium (score = 2)
Model endpoint is broad (i.e., overall persistence) AND/OR non-transparent and difficult to reproduce methods were used to build the (Q)SAR model (e.g. artificial neural networks using many structural descriptors).
Low (score = 3) Algorithm is not publicly available to verify or reproduce the predictions AND/OR statistics on the external validation set are unavailable.
Unacceptable (score = 4)
The model performance was either not known or r2 < 0.7, q2 < 0.5 or SE > 0.3 (ECHA, 2016). These are serious flaws that make the study unusable.
Not rated/applicable
A QSAR model was not reported.
Reviewer’s comments
[Document concerns, uncertainties, limitations, and deficiencies and any additional comments that may highlight study strengths or important elements such as relevance]

64
C.6 References
1. ECHA. (2011). Guidance on information requirements and chemical safety assessment. Chapter R.3: Information gathering. https://hero.epa.gov/heronet/index.cfm/reference/download/reference_id/4262857.
2. ECHA. (2016). Practical guide. How to use and report (Q)SARs. Version 3.1. July 2016. https://hero.epa.gov/heronet/index.cfm/reference/download/reference_id/4262860.
3. Lynch, HNG, J. E. Tabony, J. A. Rhomberg, L. R. (2016). Systematic comparison of study quality criteria. Regul Toxicol Pharmacol. 76: 187-198. https://hero.epa.gov/heronet/index.cfm/reference/download/reference_id/4262904.
4. Moermond, CB, A. Breton, R. Junghans, M. Laskowski, R. Solomon, K. Zahner, H. (2016). Assessing the reliability of ecotoxicological studies: An overview of current needs and approaches. Integr Environ Assess Manag. 13: 1-12. http://dx.doi.org/10.1002/ieam.1870; http://onlinelibrary.wiley.com/store/10.1002/ieam.1870/asset/ieam1870.pdf?v=1&t=jerdoypz&s=ee96db9e589f470deb10651cdb1460d9ada93486.
5. Samuel, GOH, S. Wright, R. A. Lalu, M. M. Patlewicz, G. Becker, R. A. Degeorge, G. L. Fergusson, D. Hartung, T. Lewis, R. J. Stephens, M. L. (2016). Guidance on assessing the methodological and reporting quality of toxicologically relevant studies: A scoping review. Environ Int. 92-93: 630-646. https://hero.epa.gov/heronet/index.cfm/reference/download/reference_id/4262966.

65
APPENDIX D: DATA QUALITY CRITERIA FOR OCCUPATIONAL EXPOSURE AND RELEASE DATA
D.1 Types of Environmental Release and Occupational Exposure Data Sources
Environmental release and occupational exposure data and information may be found in a variety of sources, and most are not found in controlled studies. The evaluation of this data and information requires approaches that differ from evaluation of controlled studies. These differences are inherently covered by the tables for the different sources (e.g., all tables in section D.7). In these tables, some metrics are shown as not applicable and will not be scored. Other metrics may have criteria that reflect differences in the documentation of background information about the data or information, especially if the data or information are not collected from a controlled study that is fully documented. The data quality will be evaluated for five different types of data sources that contain environmental release and occupational exposure data: (1) monitoring data from various sources (e.g., journal articles, government reports, public databases); (2) release data from various sources; (3) published models for exposures or releases; (4) completed exposure or risk assessments; (5) and reports for data or information other than exposure or release data. Definitions for these data types are shown below in Table D-1; note that these data types do not include epidemiology sources that lack occupational exposure data. Table D-1. Types of Occupational Exposure and Environmental Release Data Sources
Type of Data Source Definition
Monitoring Data Measured occupational exposures, which include, but not limited to, personal inhalation exposure monitoring, area/stationary airborne concentration monitoring, and surface wipe sampling.
Environmental Release Data Measured or calculated quantities of chemical or chemical substance released across a facility fence line into an environmental media or waste management/disposal method.
Published Models for Exposures or Releases
Published models used to calculate occupational exposures or environmental releases.
Completed Exposure or Risk Assessments
Completed exposure or risk assessments containing a broad range of data types (i.e., exposure concentrations, doses, estimated values, exposure factors). Examples: ATSDR assessments, risk assessments completed by other countries.
Reports for Data or Information Other than Exposure or Release Data
Data sources used for data or information other than exposure or release data, such as process description information. Example: Kirk-Othmer Encyclopedia of Chemical Technology
Note: ATSDR = Agency for Toxic Substances and Disease Registry

66
D.2 Data Quality Evaluation Domains
The data sources will be evaluated against the following four data quality evaluation domains: (1) reliability; (2) representativeness; (3) accessibility/clarity; (4) and variability and uncertainty. These domains, as defined in Table D-2, address elements of TSCA Science Standards 26(h)(1) through 26(h)(5). Table D-2. Data Evaluation Domains and Definitions
Evaluation Domain Definition
Reliability The inherent property of a study or data, which includes the use of well-founded scientific approaches, the avoidance of bias within the study or data collection design and faithful study or data collection conduct and documentation (ECHA, 2011b).
Representativeness The data reported address exposure scenarios (e.g., sources, pathways, routes, receptors) that are relevant to the assessment.
Accessibility/Clarity The data and supporting information are accessible and clearly documented.
Variability and Uncertainty
The data describe variability and uncertainty (quantitative and qualitative) or the procedures, measures, methods, or models are evaluated and characterized.
D.3 Data Quality Evaluation Metrics
Table D-3 provides a summary of the quality metrics for each data type. EPA may adjust these quality metrics as more experience is acquired with the evaluation tools to support fit-for-purpose TSCA risk evaluations. If this happens, EPA will document the changes to the evaluation tool. Table D-3. Summary of Quality Metrics for the Five Types of Data Sources
Type of Data Source Overall Number
of Metrics Metric Names
Monitoring Data 7
Sampling and analytical methodology; Geographic Scope; Applicability; Temporal representativeness; Sample size; Metadata completeness informing the Accessibility and Clarity domain; Metadata completeness informing the Variability and Uncertainty domain
Environmental Release Data
7
Methodology; Geographic Scope; Applicability; Temporal representativeness; Sample size; Metadata completeness informing the Accessibility and Clarity domain; Metadata completeness informing the Variability and Uncertainty domain
Published Models for Exposures or
Releases Up to 6
Methodology; Geographic Scope; Applicability; Temporal representativeness; Metadata completeness informing the Accessibility and Clarity domain; Metadata completeness informing the Variability and Uncertainty domain
Completed Exposure or Risk
Assessments Up to 7
Methodology; Geographic Scope; Applicability; Temporal representativeness; Sample Size; Metadata completeness informing the Accessibility and Clarity domain; Metadata completeness informing the Variability and Uncertainty domain
Reports for Data or Information Other than Exposure or
Release Data
Up to 7
Methodology; Geographic Scope; Applicability; Temporal representativeness; Sample size; Metadata completeness informing the Accessibility and Clarity domain; Metadata completeness informing the Variability and Uncertainty domain
Notes:
Number of Metrics Overall indicates the number of metrics across evaluation domains.
Metadata are data that provide descriptive information about other data. Examples include the date of the data, the author and author’s affiliation of a report or study, and the type of exposure monitoring sample (e.g., personal breathing zone sample).

67
D.4 Scoring Method and Determination of Overall Data Quality Level
Appendix A provides information about the evaluation method that will be applied across the various data/information sources being assessed to support TSCA risk evaluations. This section provides details about the scoring system that will be applied to occupational exposure and release data/information, including the weighting factors assigned to each metric score of each domain. Some metrics may be given greater weights than others, if they are regarded as key or critical metrics, based on expert judgment (Moermond et al., 2016a). Thus, EPA will use a weighting approach to reflect that some metrics are more important that others when assessing the overall quality of the data.
D.4.1 Weighting Factors
EPA developed the weighting factors by beginning with an even weight for each metric. In other words, there are seven metrics for many data types; thus, each weighting factor began with a value of 1. Then, EPA used expert judgement to determine the importance of a particular metric relative to others. Following the prioritization of criteria, each metric was assigned a weighting factor of 1 or 2, with the higher weighting factor (2) given to metrics deemed critical for the evaluation. EPA judged applicability and temporal representativeness to be the most important towards overall confidence, and these two metrics were determined to be twice as important as other metrics (weighting factors assigned a value of 2).
Applicability is one of the most important metrics for occupational data because occupational settings have a diverse set of determinants of exposure and release. Therefore, when evaluating occupational data, it is important for EPA’s purposes that those data capture as many of the determinants of exposure and release that apply to the condition of use of interest as possible.
Representativeness of current workplace practices is the other most important metric for occupational data because industry and business practices are expected to change with time. Therefore, when evaluating occupational data, it is important for EPA’s purposes that those data represent current day practices.
Table D-4 summarizes the weighting factor for each metric, the range of possible scores for each metric, and the range of resulting weighted scores, which are the products of the weighting factor and the metric score, if all of the metrics are scored for a particular data type.
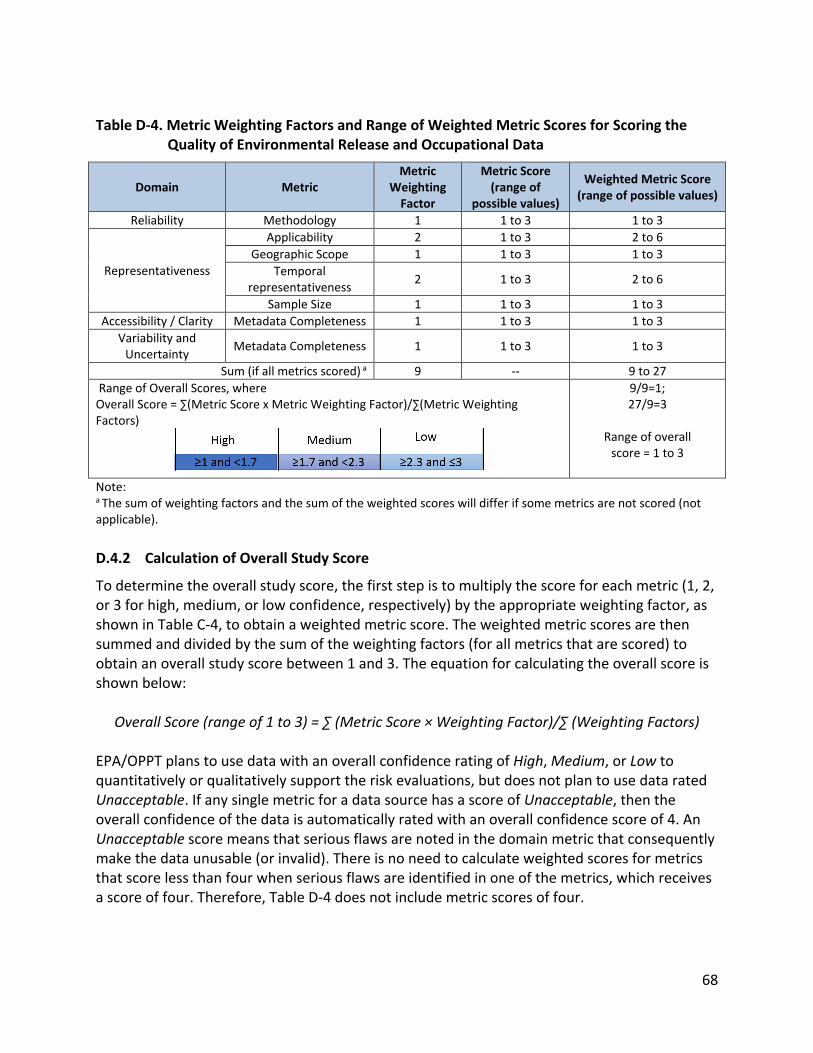
68
Table D-4. Metric Weighting Factors and Range of Weighted Metric Scores for Scoring the
Quality of Environmental Release and Occupational Data
Domain Metric Metric
Weighting Factor
Metric Score (range of
possible values)
Weighted Metric Score (range of possible values)
Reliability Methodology 1 1 to 3 1 to 3
Representativeness
Applicability 2 1 to 3 2 to 6
Geographic Scope 1 1 to 3 1 to 3
Temporal representativeness
2 1 to 3 2 to 6
Sample Size 1 1 to 3 1 to 3
Accessibility / Clarity Metadata Completeness 1 1 to 3 1 to 3
Variability and Uncertainty
Metadata Completeness 1 1 to 3 1 to 3
Sum (if all metrics scored) a 9 -- 9 to 27
Range of Overall Scores, where Overall Score = ∑(Metric Score x Metric Weighting Factor)/∑(Metric Weighting Factors)
9/9=1; 27/9=3
Range of overall
score = 1 to 3
Note: a The sum of weighting factors and the sum of the weighted scores will differ if some metrics are not scored (not applicable).
D.4.2 Calculation of Overall Study Score
To determine the overall study score, the first step is to multiply the score for each metric (1, 2, or 3 for high, medium, or low confidence, respectively) by the appropriate weighting factor, as shown in Table C-4, to obtain a weighted metric score. The weighted metric scores are then summed and divided by the sum of the weighting factors (for all metrics that are scored) to obtain an overall study score between 1 and 3. The equation for calculating the overall score is shown below:
Overall Score (range of 1 to 3) = ∑ (Metric Score × Weighting Factor)/∑ (Weighting Factors) EPA/OPPT plans to use data with an overall confidence rating of High, Medium, or Low to quantitatively or qualitatively support the risk evaluations, but does not plan to use data rated Unacceptable. If any single metric for a data source has a score of Unacceptable, then the overall confidence of the data is automatically rated with an overall confidence score of 4. An Unacceptable score means that serious flaws are noted in the domain metric that consequently make the data unusable (or invalid). There is no need to calculate weighted scores for metrics that score less than four when serious flaws are identified in one of the metrics, which receives a score of four. Therefore, Table D-4 does not include metric scores of four.
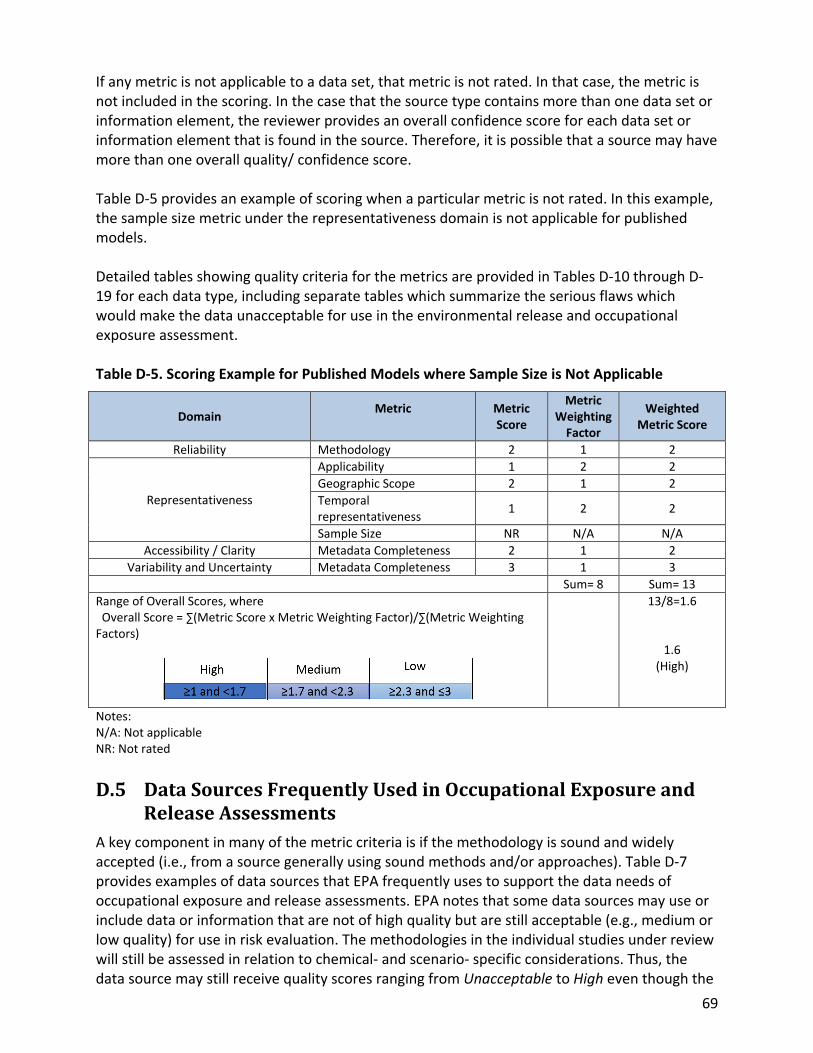
69
If any metric is not applicable to a data set, that metric is not rated. In that case, the metric is not included in the scoring. In the case that the source type contains more than one data set or information element, the reviewer provides an overall confidence score for each data set or information element that is found in the source. Therefore, it is possible that a source may have more than one overall quality/ confidence score. Table D-5 provides an example of scoring when a particular metric is not rated. In this example, the sample size metric under the representativeness domain is not applicable for published models. Detailed tables showing quality criteria for the metrics are provided in Tables D-10 through D-19 for each data type, including separate tables which summarize the serious flaws which would make the data unacceptable for use in the environmental release and occupational exposure assessment. Table D-5. Scoring Example for Published Models where Sample Size is Not Applicable
Domain Metric
Metric Score
Metric Weighting
Factor
Weighted Metric Score
Reliability Methodology 2 1 2
Representativeness
Applicability 1 2 2
Geographic Scope 2 1 2
Temporal representativeness
1 2 2
Sample Size NR N/A N/A
Accessibility / Clarity Metadata Completeness 2 1 2
Variability and Uncertainty Metadata Completeness 3 1 3
Sum= 8 Sum= 13
Range of Overall Scores, where Overall Score = ∑(Metric Score x Metric Weighting Factor)/∑(Metric Weighting Factors)
13/8=1.6
1.6 (High)
Notes: N/A: Not applicable NR: Not rated
D.5 Data Sources Frequently Used in Occupational Exposure and Release Assessments
A key component in many of the metric criteria is if the methodology is sound and widely accepted (i.e., from a source generally using sound methods and/or approaches). Table D-7 provides examples of data sources that EPA frequently uses to support the data needs of occupational exposure and release assessments. EPA notes that some data sources may use or include data or information that are not of high quality but are still acceptable (e.g., medium or low quality) for use in risk evaluation. The methodologies in the individual studies under review will still be assessed in relation to chemical- and scenario- specific considerations. Thus, the data source may still receive quality scores ranging from Unacceptable to High even though the
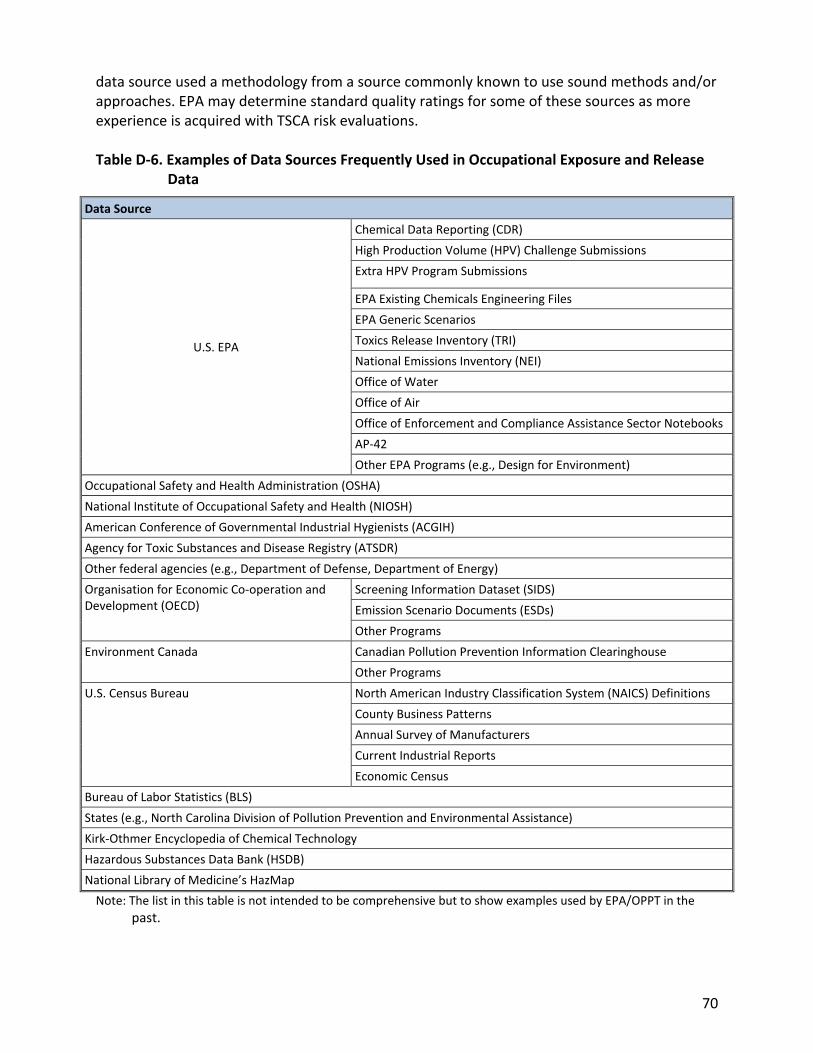
70
data source used a methodology from a source commonly known to use sound methods and/or approaches. EPA may determine standard quality ratings for some of these sources as more experience is acquired with TSCA risk evaluations. Table D-6. Examples of Data Sources Frequently Used in Occupational Exposure and Release
Data
Data Source
U.S. EPA
Chemical Data Reporting (CDR)
High Production Volume (HPV) Challenge Submissions
Extra HPV Program Submissions
EPA Existing Chemicals Engineering Files
EPA Generic Scenarios
Toxics Release Inventory (TRI)
National Emissions Inventory (NEI)
Office of Water
Office of Air
Office of Enforcement and Compliance Assistance Sector Notebooks
AP-42
Other EPA Programs (e.g., Design for Environment)
Occupational Safety and Health Administration (OSHA)
National Institute of Occupational Safety and Health (NIOSH)
American Conference of Governmental Industrial Hygienists (ACGIH)
Agency for Toxic Substances and Disease Registry (ATSDR)
Other federal agencies (e.g., Department of Defense, Department of Energy)
Organisation for Economic Co-operation and Development (OECD)
Screening Information Dataset (SIDS)
Emission Scenario Documents (ESDs)
Other Programs
Environment Canada Canadian Pollution Prevention Information Clearinghouse
Other Programs
U.S. Census Bureau North American Industry Classification System (NAICS) Definitions
County Business Patterns
Annual Survey of Manufacturers
Current Industrial Reports
Economic Census
Bureau of Labor Statistics (BLS)
States (e.g., North Carolina Division of Pollution Prevention and Environmental Assistance)
Kirk-Othmer Encyclopedia of Chemical Technology
Hazardous Substances Data Bank (HSDB)
National Library of Medicine’s HazMap
Note: The list in this table is not intended to be comprehensive but to show examples used by EPA/OPPT in the
past.

71
D.6 Data Extraction Templates to Assist the Data Quality Evaluation
The reviewer will extract the data or information element from the source into the data extraction table. Tables D-7, D-8, and D-9 are examples of data extraction and evaluation templates. The tables consist of the key data needs elements for occupational exposures and environmental releases, which accompany the inclusion criteria for full text screening as shown in the TSCA problem formulation documents, and also the evaluation elements described above. For each data quality evaluation metric, the reviewer will document relevant metadata in the metadata column and then provide a score, or a notation of not rated or not applicable, in the scoring column based on the quality criteria of the metrics provided in Tables D-11 through D-20. Metadata are data or information that describe the collected data and include, but are not limited to, the following:
Number of samples collected by authors in a monitoring study; Number of sites or workers included in a survey; Full bibliographic information of the data source; Date of the data source; and Date of the data within the data source (for example, an article published in 2015 may
cite data from 2000). After scorings are complete, the reviewer calculates the overall confidence score and provides the corresponding bin (High, Medium, Low, or Unacceptable). If the source contains more than one data or information element, the reviewer provides an overall confidence rating for each data or information element that is found in the source. Therefore, it is possible that a source may have more than one data or information set or type and associated overall confidence scores.

72
Table D-7. Data Extraction and Evaluation Template for General Life Cycle and Facility Data
Data Source (HERO ID)
General Life Cycle and Facility Data (note: these apply to both occupational exposures and environmental releases)
Life Cycle Stage
Life Cycle Description (Subcategory of Use)
Process Description
Total Annual U.S. Volume (and % of PV)
Number of Sites
Batch Size
Operating Days per Year and Batches per Day
Site Daily Throughput
Possible Physical Form
Chemical Concentration
Data Quality Evaluation Domain 1: Reliability
Methodology Score
Associated Meta Data and Rationale for Score
Domain 2: Representativeness
Geographic Scope Score
Associated Meta Data and Rationale for Score
Applicability Score
Associated Meta Data and Rationale for Score
Temporal representativeness Score
Associated Meta Data and Rationale for Score
Sample Size Score
Associated Meta Data and Rationale for Score
Domain 3. Accessibility / Clarity
Metadata Completeness Score
Associated Meta Data and Rationale for Score
Domain 4. Variability and Uncertainty
Metadata Completeness Score
Associated Meta Data and Rationale for Score
Overall Confidence Score

73
Table D-8. Data Extraction and Evaluation Template for Occupational Exposure Data
Data Source (HERO ID)
Occupational Exposure Data
Life Cycle Stage
Physical Form
Route of Exposure
Exposure Concentration (Unit)
Number of Samples
Number of Sites
Type of Measurement (e.g., TWA, STEL) or Method (e.g., modeling)
Worker Activity (or source of exposure if stationary sampling) or Job Description
Number of Workers
Type of Sampling (e.g., personal - pump/ passive, stationary)
Sampling Location/ Key Environmental Factors (e.g., temperature, humidity)
Exposure Duration
Exposure Frequency
Bulk and Dust Particle Size Distribution
Engineering Control & % Exposure Reduction
Personal Protective Equipment (PPE)
Analytic Method
Data Quality Evaluation Domain 1: Reliability
Methodology Score
Associated Meta Data and Rationale for Score
Domain 2: Representativeness
Geographic Scope Score
Associated Meta Data and Rationale for Score
Applicability Score
Associated Meta Data and Rationale for Score
Temporal representativeness Score
Associated Meta Data and Rationale for Score
Sample Size Score
Associated Meta Data and Rationale for Score
Domain 3. Accessibility / Clarity
Metadata Completeness Score
Associated Meta Data and Rationale for Score
Domain 4. Variability and Uncertainty
Metadata Completeness Score
Associated Meta Data and Rationale for Score
Overall Confidence Score

74
Table D-9. Data Extraction and Evaluation Template for Environmental Release Data
Data Source (HERO ID)
Environmental Release Data
Life Cycle Stage
Release Source (at the process- or unit-level with the type of waste)
Disposal / Treatment Method
Environmental Media
Release or Emission Factor
Release Estimation Method
Daily and Annual Release Quantity
(kg/day)
(kg/yr)
Release Days per Year
Number of Sites
Waste Treatment Method
Pollution Prevention / Control & %Efficiency
Data Quality Evaluation
Domain 1: Reliability
Methodology Score
Associated Meta Data and Rationale for Score
Domain 2: Representativeness
Geographic Scope Score
Associated Meta Data and Rationale for Score
Applicability Score
Associated Meta Data and Rationale for Score
Temporal representativeness Score
Associated Meta Data and Rationale for Score
Sample Size Score
Associated Meta Data and Rationale for Score
Domain 3. Accessibility / Clarity
Metadata Completeness Score
Associated Meta Data and Rationale for Score
Domain 4. Variability and Uncertainty
Metadata Completeness Score
Associated Meta Data and Rationale for Score
Overall Confidence Score

75
D.7 Data Quality Criteria
This section presents tables showing quality criteria for the metrics for each data type, including separate tables which summarize the serious flaws which would make the data unacceptable for use in the environmental release and occupational exposure assessment. The overall data confidence level is automatically rated as Unacceptable if any single metric for a data set has a score of 4, or serious flaws that would make the data unusable (or invalid) for the environmental release and occupational exposure assessment. If the source type contains more than one data set or information element, the review provides an overall confidence score for each data set or information element that is found in the source. Therefore, it is possible that a source may have more than one overall quality/ confidence score.
D.7.1 Monitoring Data
The general approach for setting the criteria for an unacceptable rating is to only assign an unacceptable rating when EPA can confirm that the data or information is unacceptable. If the data source lacks documentation of needed metadata, EPA will not rate the metric as unacceptable but will rate it as low. The reason for this approach is to avoid omitting potentially valid data or information since occupational exposure and release data are often sparse. EPA will not use data/information that exhibit serious flaws as described in Table D-10. Table D-10. Serious Flaws that Would Make Monitoring Data Unacceptable for Use in the Environmental Release and Occupational Exposure Assessment
Optimization of the list of serious flaws may occur after pilot calibration exercises.
Domain Metric Description of Serious Flaw(s) in Data
Reliability Sampling and
Analytical Methodology
Sampling or analytical methodology is specified and EPA has information that indicates the methodology is unacceptable.
Representativeness
Geographic Scope This metric does not have an unacceptable criterion since no geographic location is known to have unacceptable data.
Applicability The data are from an occupational or non-occupational scenario that does not apply to any occupational scenario within the scope of the risk evaluation.
Temporal representativeness
Known factors (e.g., new and completely different process or equipment) are so different as to make outdated information unacceptable.
Sample Size This metric does not have an unacceptable criterion.
Accessibility / Clarity Metadata
Completeness
Monitoring data do not include any needed metadata to understand what the data represent and are not usable in the risk evaluation.
Variability and Uncertainty
Metadata Completeness
This metric does not have an unacceptable criterion.

76
Table D-11. Evaluation Criteria for Monitoring Data
Confidence Level (Score)
Description Selected
Score
Domain 1. Reliability
Metric 1. Sampling and Analytical Methodology
High (score = 1)
Sampling or analytical methodology is an approved OSHA or NIOSH method or is well described and found to be equivalent to approved OSHA or NIOSH methods.
Medium (score = 2)
Sampling or analytical methodology is not equivalent to an approved OSHA or NIOSH method and EPA review of information indicates the methodology is acceptable. Differences in methods are not expected to lead to lower quality data.
Low (score = 3)
Sampling or analytical methodology is not specified.
Unacceptable (score = 4)
Sampling or analytical methodology is specified and EPA has information that indicates the methodology is unacceptable.
Reviewer’s comments
[Document concerns, uncertainties, limitations, and deficiencies and any additional comments that may highlight study strengths or important elements such as relevance]
Domain 2. Representative
Metric 2. Geographic Scope
High (score = 1)
The data are from the United States and are representative of the industry being evaluated.
Medium (score = 2)
The data are from an OECD country. other than the U.S., and locality-specific factors (e.g., potential differences in regulatory occupational exposure limits, industry/ process technologies) may impact exposures relative to the U.S.
Low (score = 3)
The data are from a non-OECD country, and locality-specific factors (e.g., potentially greater differences in regulatory occupational exposure limits, industry/ process technologies) may impact exposures relative to the U.S., or the country of origin is not specified.
Unacceptable (score = 4)
This metric does not have an unacceptable criterion since no geographic location is known to have unacceptable data.
Reviewer’s comments
[Document concerns, uncertainties, limitations, and deficiencies and any additional comments that may highlight study strengths or important elements such as relevance]
Metric 3. Applicability
High (score = 1)
The data are for an occupational scenario within the scope of the risk evaluation.
Medium (score = 2)
The data are for an occupational scenario that is similar to an occupational scenario within the scope of the risk evaluation, in terms of the type of industry, operations, and work activities.
Low (score = 3)
The data are for a non-occupational scenario that is similar to an occupational scenario within the scope of the risk evaluation, such as a consumer DIY scenario that is similar to a worker scenario.
Unacceptable (score = 4)
The data are from an occupational or non-occupational scenario that does not apply to any occupational scenario within the scope of the risk evaluation.
Reviewer’s comments
[Document concerns, uncertainties, limitations, and deficiencies and any additional comments that may highlight study strengths or important elements such as relevance]

77
Confidence Level (Score)
Description Selected
Score
Metric 4. Temporal representativeness
High (score = 1)
The operations, equipment, and worker activities associated with the data are expected to be representative of current operations, equipment, and activities. The monitoring data were collected after the most recent permissible exposure limit (PEL) establishment or update or are generally, no more than 10 years old, whichever is shorter. If no PEL is established, the data are no more than 10 years old. Metadata on the operations, equipment, and worker activities associated with the data show that the data should be representative of current operations, equipment, and activities.
Medium (score = 2)
Operations, equipment, and worker activities are expected to be reasonably representative of current conditions. The monitoring data were collected after the most recent PEL establishment or update but are generally more than 10 years old. If no PEL is established, the data are more than 10 years but generally, no more than 20 years old.
Low (score = 3)
Metadata on the operations, equipment, and worker activities associated with the data show that the data agree representative of outdated operations, equipment, and activities rather than current operations, equipment, and worker activities. The data were collected before the most recent PEL establishment or update or are more than 20 years old if no PEL is established.
Unacceptable (score = 4)
Known factors (e.g., new and completely different process or equipment) are so different as to make outdated information unacceptable.
Reviewer’s comments
[Document concerns, uncertainties, limitations, and deficiencies and any additional comments that may highlight study strengths or important elements such as relevance]
Metric 5. Sample Size
High (score = 1)
Statistical distribution of samples is fully characterized.
Medium (score = 2)
Distribution of samples is characterized by a range with uncertain statistics.
Low (score = 3)
Distribution of samples is qualitative or characterized by no statistics.
Unacceptable (score = 4)
This metric does not have an unacceptable criterion.
Reviewer’s comments
[Document concerns, uncertainties, limitations, and deficiencies and any additional comments that may highlight study strengths or important elements such as relevance]
Domain 3. Accessibility / Clarity
Metric 6. Metadata Completeness
High (score = 1)
Monitoring data include all associated metadata, including sample types, exposure types, sample durations, exposure durations worker activities, and exposure frequency.
Medium (score = 2)
Monitoring data include most critical metadata, such as sample type and exposure type, but lacks additional metadata, such as sample durations, exposure durations, exposure frequency, and/or worker activities.
Low (score = 3)
Monitoring data include sample type (e.g., personal breathing zone) but no other metadata.
Unacceptable (score = 4)
Monitoring data do not include any needed metadata to understand what the data represent and are not usable in the risk evaluation.
Reviewer’s comments
[Document concerns, uncertainties, limitations, and deficiencies and any additional comments that may highlight study strengths or important elements such as relevance]
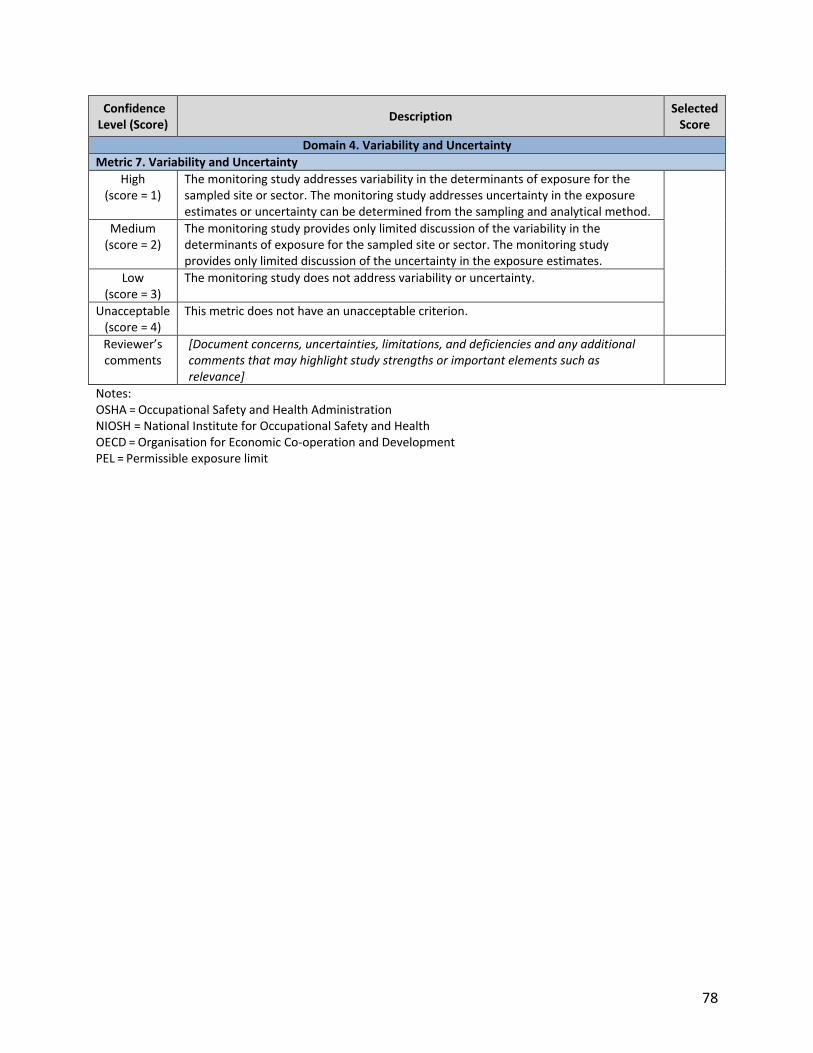
78
Confidence Level (Score)
Description Selected
Score
Domain 4. Variability and Uncertainty
Metric 7. Variability and Uncertainty
High (score = 1)
The monitoring study addresses variability in the determinants of exposure for the sampled site or sector. The monitoring study addresses uncertainty in the exposure estimates or uncertainty can be determined from the sampling and analytical method.
Medium (score = 2)
The monitoring study provides only limited discussion of the variability in the determinants of exposure for the sampled site or sector. The monitoring study provides only limited discussion of the uncertainty in the exposure estimates.
Low (score = 3)
The monitoring study does not address variability or uncertainty.
Unacceptable (score = 4)
This metric does not have an unacceptable criterion.
Reviewer’s comments
[Document concerns, uncertainties, limitations, and deficiencies and any additional comments that may highlight study strengths or important elements such as relevance]
Notes: OSHA = Occupational Safety and Health Administration NIOSH = National Institute for Occupational Safety and Health OECD = Organisation for Economic Co-operation and Development PEL = Permissible exposure limit
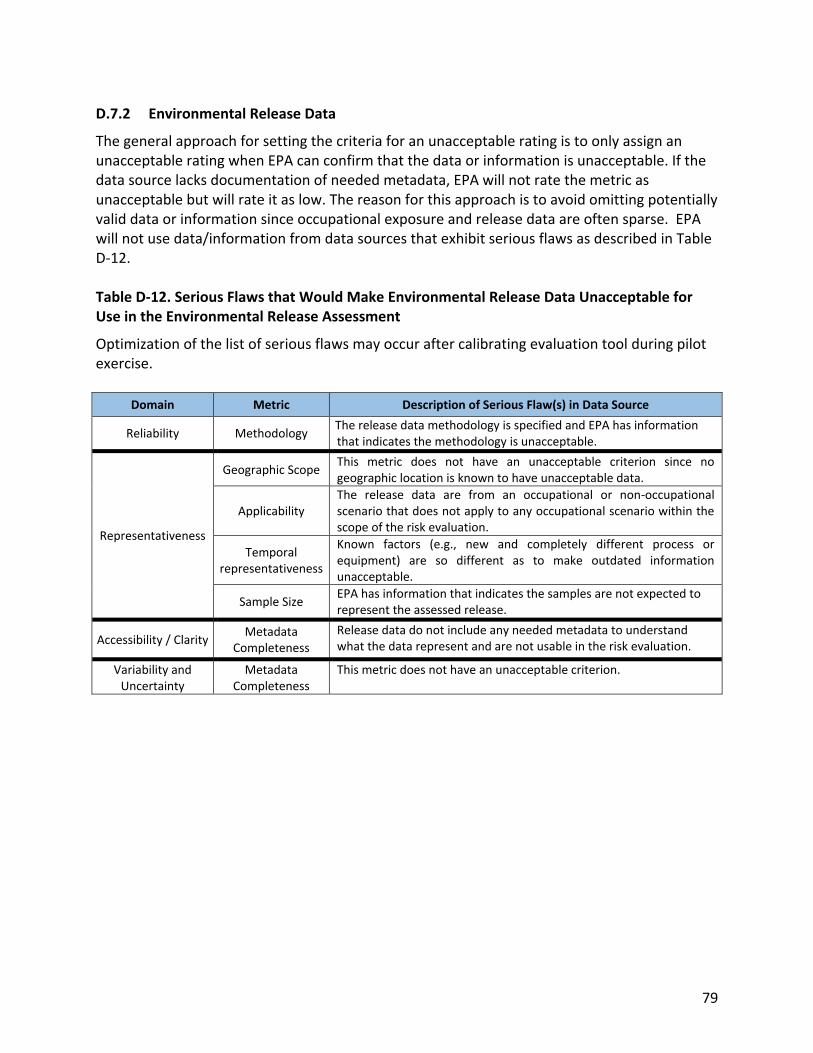
79
D.7.2 Environmental Release Data
The general approach for setting the criteria for an unacceptable rating is to only assign an unacceptable rating when EPA can confirm that the data or information is unacceptable. If the data source lacks documentation of needed metadata, EPA will not rate the metric as unacceptable but will rate it as low. The reason for this approach is to avoid omitting potentially valid data or information since occupational exposure and release data are often sparse. EPA will not use data/information from data sources that exhibit serious flaws as described in Table D-12. Table D-12. Serious Flaws that Would Make Environmental Release Data Unacceptable for Use in the Environmental Release Assessment
Optimization of the list of serious flaws may occur after calibrating evaluation tool during pilot exercise.
Domain Metric Description of Serious Flaw(s) in Data Source
Reliability Methodology The release data methodology is specified and EPA has information that indicates the methodology is unacceptable.
Representativeness
Geographic Scope This metric does not have an unacceptable criterion since no geographic location is known to have unacceptable data.
Applicability The release data are from an occupational or non-occupational scenario that does not apply to any occupational scenario within the scope of the risk evaluation.
Temporal representativeness
Known factors (e.g., new and completely different process or equipment) are so different as to make outdated information unacceptable.
Sample Size EPA has information that indicates the samples are not expected to represent the assessed release.
Accessibility / Clarity Metadata
Completeness
Release data do not include any needed metadata to understand what the data represent and are not usable in the risk evaluation.
Variability and Uncertainty
Metadata Completeness
This metric does not have an unacceptable criterion.

80
Table D-13. Evaluation Criteria for Environmental Release Data
Confidence Level (Score)
Description Selected
Score
Domain 1. Reliability
Metric 1. Methodology
High (score = 1)
The release data methodology is known or expected (see section D.5 and Table D-6) to be accurate and is known to cover all release sources at the site.
Medium (score = 2)
The release data methodology is known or expected to be accurate (e.g., see section D.5 and Table D-6) but may not cover all release sources at the site.
Low (score = 3)
The release data methodology is not specified.
Unacceptable (score = 4)
The release data methodology is specified and EPA has information that indicates the methodology is unacceptable.
Reviewer’s comments
[Document concerns, uncertainties, limitations, and deficiencies and any additional comments that may highlight study strengths or important elements such as relevance]
Domain 2. Representative
Metric 2. Geographic Scope
High (score = 1)
The data are from the United States and are representative of the industry being evaluated.
Medium (score = 2)
The data are from an OECD country other than the U.S., and locality-specific factors (e.g., potential differences in regulatory emission limits, industry/ process technologies) may impact releases relative to the U.S.
Low (score = 3)
The data are from a non-OECD country, and locality-specific factors may impact (e.g., potentially greater differences in regulatory emission limits, industry/ process technologies) releases relative to the U.S., or the country of origin is not specified.
Unacceptable (score = 4)
This metric does not have an unacceptable criterion since no geographic location is known to have unacceptable data.
Reviewer’s comments
[Document concerns, uncertainties, limitations, and deficiencies and any additional comments that may highlight study strengths or important elements such as relevance]
Metric 3. Applicability
High (score = 1)
The release data are for an occupational scenario within the scope of the risk evaluation.
Medium (score = 2)
The release data are for an occupational scenario that is similar to an occupational scenario within the scope of the risk evaluation, in terms of the type of industry, operations, and work activities.
Low (score = 3)
The release data are for a non-occupational scenario that is similar to an occupational scenario within the scope of the risk evaluation, such as a consumer DIY scenario that is similar to a worker scenario.
Unacceptable (score = 4)
The release data are from an occupational or non-occupational scenario that does not apply to any occupational scenario within the scope of the risk evaluation.
Reviewer’s comments
[Document concerns, uncertainties, limitations, and deficiencies and any additional comments that may highlight study strengths or important elements such as relevance]
Metric 4. Temporal representativeness
High (score = 1)
The operations, equipment, and worker activities associated with the data indicate that the data should to be representative of current operations, equipment, and activities. The release data were collected after the most recent federal regulatory action (e.g., NESHAP for air release or effluent limit guideline (ELG) for water release)

81
Confidence Level (Score)
Description Selected
Score
or update or are no more than 10 years old, whichever is shorter. If no federal regulation is established, the data are generally no more than 10 years old.
Medium (score = 2)
The release data were collected after the most recent federal regulatory action or update but are generally, more than 10 years old. If no federal regulation is established, the data are more than 10 years but no more than 20 years old. However, operations, equipment, and worker activities are expected to be reasonably representative of current conditions.
Low (score = 3)
The data were collected before the most recent federal regulatory action or update or are more than 20 years old if no federal regulation is established. The operations, equipment, and worker activities are not available or indicate that the associated data are expected to be outdated.
Unacceptable (score = 4)
Known factors (e.g., new and completely different process or equipment) are so different as to make outdated information unacceptable.
Reviewer’s comments
[Document concerns, uncertainties, limitations, and deficiencies and any additional comments that may highlight study strengths or important elements such as relevance]
Metric 5. Sample Size
High (score = 1)
Statistical distribution of samples is fully characterized. Sample size is sufficiently representative.
Medium (score = 2)
Distribution of samples is characterized by a range with uncertain statistics. It is unclear if analysis is representative.
Low (score = 3)
Distribution of samples is qualitative or characterized by no statistics.
Unacceptable (score = 4)
EPA has information that indicates the samples are not expected to represent the assessed release.
Reviewer’s comments
[Document concerns, uncertainties, limitations, and deficiencies and any additional comments that may highlight study strengths or important elements such as relevance]
Domain 3. Accessibility / Clarity
Metric 6. Metadata Completeness
High (score = 1)
Release data include all associated metadata, including release media; process, unit operation, or activity that is the source of the release; and release frequency.
Medium (score = 2)
Release data include most critical metadata, including release media and release frequency, but lacks additional metadata, such as process, unit operation, and/or activity that is the source of the release.
Low (score = 3)
Release data include release media but no other metadata.
Unacceptable (score = 4)
Release data do not include any needed metadata to understand what the data represent and are not usable in the risk evaluation.
Reviewer’s comments
[Document concerns, uncertainties, limitations, and deficiencies and any additional comments that may highlight study strengths or important elements such as relevance]
Domain 4. Variability and Uncertainty
Metric 7. Variability and Uncertainty
High (score = 1)
The release data study addresses variability in the determinants of release. The release data study addresses uncertainty in the release results.
Medium (score = 2)
The release data study provides only limited discussion of the variability in the determinants of release. The release data study provides only limited discussion of the uncertainty in the release results.
Low (score = 3)
The release data study does not address variability or uncertainty.

82
Confidence Level (Score)
Description Selected
Score
Unacceptable (score = 4)
This metric does not have an unacceptable criterion.
Reviewer’s comments
[Document concerns, uncertainties, limitations, and deficiencies and any additional comments that may highlight study strengths or important elements such as relevance]
Notes: DIY = Do it yourself ELG = Effluent limit guideline NESHAP = National Emissions Standards for Hazardous Air Pollutants OECD = Organisation for Economic Co-operation and Development

83
D.7.3 Published Models for Environmental Releases or Occupational Exposures
The general approach for setting the criteria for an unacceptable rating is to only assign an unacceptable rating when EPA can confirm that the data or information is unacceptable. If the data source lacks documentation of needed metadata, EPA will not rate the metric as unacceptable but will rate it as low. The reason for this approach is to avoid omitting potentially valid data or information since occupational exposure and release data are often sparse. EPA will not use data/information from data sources that exhibit serious flaws as described in Table D-14. Table D-14. Serious Flaws that Would Make Published Models Unacceptable for Use in the Environmental Release and Occupational Exposure Assessment
Optimization of the list of serious flaws may occur after pilot calibration exercises.
Domain Metric Description of Serious Flaw(s) in Data Source
Reliability Methodology Mathematical equations of the model have significant errors, parameters use erroneous values, or the model is based on flawed logic.
Representativeness
Geographic Scope This metric does not have an unacceptable criterion since no geographic location is known to have unacceptable data.
Applicability The model is not applicable and cannot be adapted to any occupational scenario within the scope of the risk evaluation.
Temporal representativeness
Known factors (e.g., new and completely different process or equipment) are so different as to make outdated information unacceptable.
Accessibility / Clarity Metadata
Completeness
The model is a “black box” and provides no documentation or clarity of its approaches, equations, and parameter values.
Variability and Uncertainty
Metadata Completeness
This metric does not have an unacceptable criterion.

84
Table D-15. Evaluation Criteria for Published Models
EPA will consult with the Guidance on the Development, Evaluation, and Application of Environmental Models (U.S. EPA, 2009) when evaluating models and modeling data types.
Confidence Level (Score)
Description Selected
Score
Domain 1. Reliability
Metric 1. Methodology
High (score = 1)
The model is free of mathematical errors and is based on scientifically sound approaches or methods. Equations and choice of parameter values are appropriate for the model’s application (note: peer review may address appropriate application).
Medium (score = 2)
The model is free of mathematical errors and is based on scientifically sound approaches or methods. However, equations and choice of parameter values are not fully described and some equations and/or parameter values may not be appropriate for the model’s application.
Low (score = 3)
The model is free of mathematical errors. However, the model makes assumptions or uses parameter values that lead to significant uncertainties.
Unacceptable (score = 4)
Mathematical equations of the model have significant errors, parameters use erroneous values, or the model is based on flawed logic.
Reviewer’s comments
[Document concerns, uncertainties, limitations, and deficiencies and any additional comments that may highlight study strengths or important elements such as relevance]
Domain 2. Representative
Metric 2. Geographic Scope
High (score = 1)
The data are from the United States and are representative of the industry being evaluated.
Medium (score = 2)
The data are from an OECD country other than the U.S., and locality-specific factors (e.g., potential differences in regulatory occupational exposure or emission limits, industry/ process technologies) may impact exposures or releases relative to the U.S.
Low (score = 3)
The data are from a non-OECD country, and locality-specific factors (e.g., potentially greater differences in regulatory occupational exposure or emission limits, industry/ process technologies) may impact exposures or releases relative to the U.S., or the country of origin is not specified.
Unacceptable (score = 4)
This metric does not have an unacceptable criterion since no geographic location is known to have unacceptable data.
Reviewer’s comments
[Document concerns, uncertainties, limitations, and deficiencies and any additional comments that may highlight study strengths or important elements such as relevance]
Metric 3. Applicability
High (score = 1)
The model can be appropriately applied to an occupational scenario within the scope of the risk evaluation.
Medium (score = 2)
Not applicable: this domain is dichotomous: applicable or not applicable.
Low (score = 3)
Not applicable: this domain is dichotomous: applicable or not applicable. Can a poor fit model be used?
Unacceptable (score = 4)
The model is not applicable and cannot be adapted to any occupational scenario within the scope of the risk evaluation.
Reviewer’s comments
[Document concerns, uncertainties, limitations, and deficiencies and any additional comments that may highlight study strengths or important elements such as relevance]

85
Confidence Level (Score)
Description Selected
Score
Metric 4. Temporal representativeness
High (score = 1)
The model is based on operations, equipment, and worker activities expected to be representative of current conditions. The model is based on data that are generally no more than 10 years old.
Medium (score = 2)
The model is based on data that are generally more than 10 years but no more than 20 years old. However, the model is based on operations, equipment, and worker activities are expected to be reasonably representative of current conditions.
Low (score = 3)
The model is based on data that are more than 20 years old. The model is based on operations, equipment, and worker activities that are expected to be outdated.
Unacceptable (score = 4)
Known factors (e.g., new and completely different process or equipment) are so different as to make outdated information unacceptable.
Reviewer’s comments
[Document concerns, uncertainties, limitations, and deficiencies and any additional comments that may highlight study strengths or important elements such as relevance]
Domain 3. Accessibility / Clarity
Metric 6. Metadata Completeness
High (score = 1)
Model approach, equations, and choice of parameter values are transparent and clear and can be evaluated. Rationale for selection of approach, equations, and parameter values is provided.
Medium (score = 2)
Model approach, equations, and choice of parameter values are transparent. However, rationale for selection of approach, equations, and parameter values is not provided.
Low (score = 3)
The model documentation describes the approach and parameters, but the equations and/or selection of parameter values are not provided. Rationale for modeling approach and parameter value selection is not provided.
Unacceptable (score = 4)
The model is a “black box” and provides no documentation or clarity of its approaches, equations, and parameter values.
Reviewer’s comments
[Document concerns, uncertainties, limitations, and deficiencies and any additional comments that may highlight study strengths or important elements such as relevance]
Domain 4. Variability and Uncertainty
Metric 7. Variability and Uncertainty
High (score = 1)
The model characterizes variability and uncertainty in the results.
Medium (score = 2)
The model has limited characterization of the variability of parameter values. The model has limited characterization of the uncertainty in the results.
Low (score = 3)
The model does not characterize variability or uncertainty.
Unacceptable (score = 4)
This metric does not have an unacceptable criterion.
Reviewer’s comments
[Document concerns, uncertainties, limitations, and deficiencies and any additional comments that may highlight study strengths or important elements such as relevance]
Note: OECD = Organisation for Economic Co-operation and Development
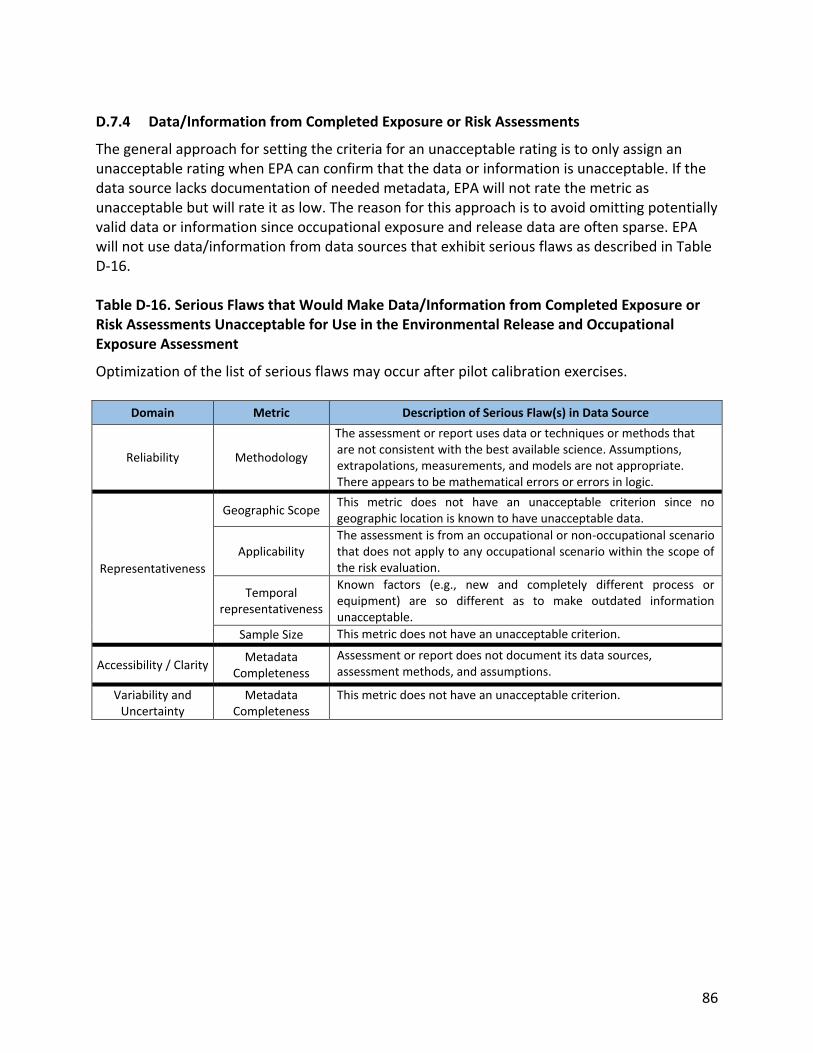
86
D.7.4 Data/Information from Completed Exposure or Risk Assessments
The general approach for setting the criteria for an unacceptable rating is to only assign an unacceptable rating when EPA can confirm that the data or information is unacceptable. If the data source lacks documentation of needed metadata, EPA will not rate the metric as unacceptable but will rate it as low. The reason for this approach is to avoid omitting potentially valid data or information since occupational exposure and release data are often sparse. EPA will not use data/information from data sources that exhibit serious flaws as described in Table D-16. Table D-16. Serious Flaws that Would Make Data/Information from Completed Exposure or Risk Assessments Unacceptable for Use in the Environmental Release and Occupational Exposure Assessment
Optimization of the list of serious flaws may occur after pilot calibration exercises.
Domain Metric Description of Serious Flaw(s) in Data Source
Reliability Methodology
The assessment or report uses data or techniques or methods that are not consistent with the best available science. Assumptions, extrapolations, measurements, and models are not appropriate. There appears to be mathematical errors or errors in logic.
Representativeness
Geographic Scope This metric does not have an unacceptable criterion since no geographic location is known to have unacceptable data.
Applicability The assessment is from an occupational or non-occupational scenario that does not apply to any occupational scenario within the scope of the risk evaluation.
Temporal representativeness
Known factors (e.g., new and completely different process or equipment) are so different as to make outdated information unacceptable.
Sample Size This metric does not have an unacceptable criterion.
Accessibility / Clarity Metadata
Completeness
Assessment or report does not document its data sources, assessment methods, and assumptions.
Variability and Uncertainty
Metadata Completeness
This metric does not have an unacceptable criterion.
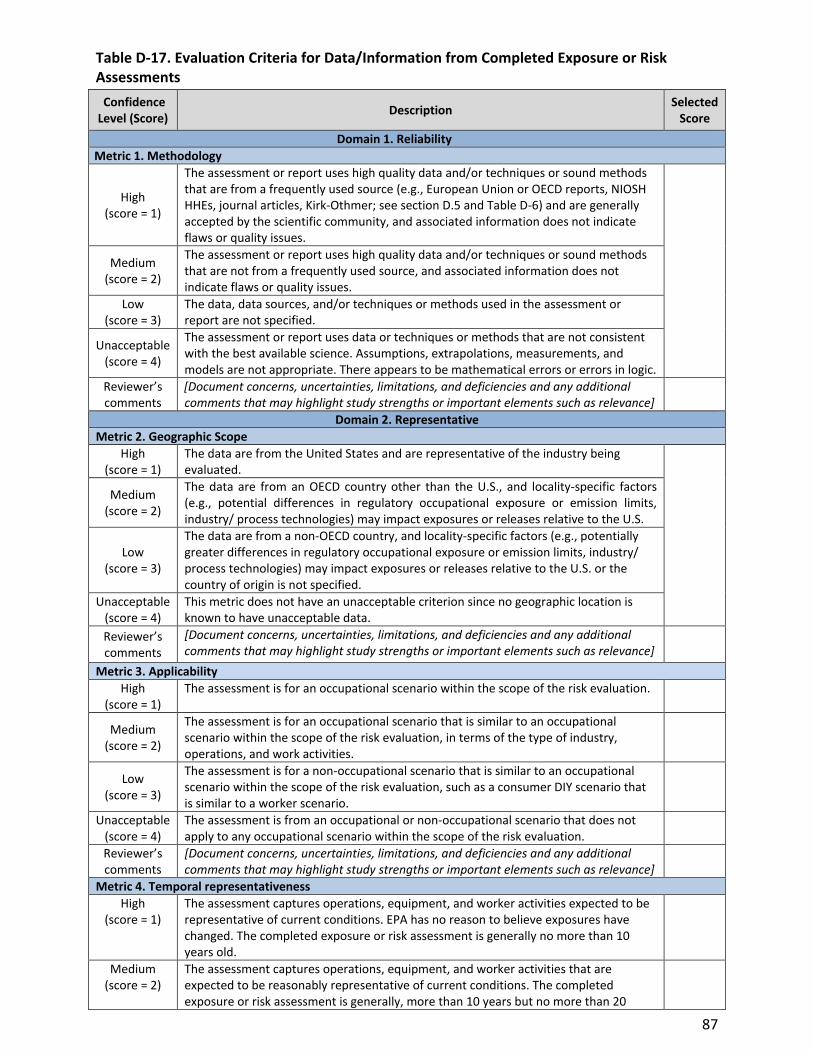
87
Table D-17. Evaluation Criteria for Data/Information from Completed Exposure or Risk Assessments
Confidence Level (Score)
Description Selected
Score
Domain 1. Reliability
Metric 1. Methodology
High (score = 1)
The assessment or report uses high quality data and/or techniques or sound methods that are from a frequently used source (e.g., European Union or OECD reports, NIOSH HHEs, journal articles, Kirk-Othmer; see section D.5 and Table D-6) and are generally accepted by the scientific community, and associated information does not indicate flaws or quality issues.
Medium (score = 2)
The assessment or report uses high quality data and/or techniques or sound methods that are not from a frequently used source, and associated information does not indicate flaws or quality issues.
Low (score = 3)
The data, data sources, and/or techniques or methods used in the assessment or report are not specified.
Unacceptable (score = 4)
The assessment or report uses data or techniques or methods that are not consistent with the best available science. Assumptions, extrapolations, measurements, and models are not appropriate. There appears to be mathematical errors or errors in logic.
Reviewer’s comments
[Document concerns, uncertainties, limitations, and deficiencies and any additional comments that may highlight study strengths or important elements such as relevance]
Domain 2. Representative
Metric 2. Geographic Scope
High (score = 1)
The data are from the United States and are representative of the industry being evaluated.
Medium (score = 2)
The data are from an OECD country other than the U.S., and locality-specific factors (e.g., potential differences in regulatory occupational exposure or emission limits, industry/ process technologies) may impact exposures or releases relative to the U.S.
Low (score = 3)
The data are from a non-OECD country, and locality-specific factors (e.g., potentially greater differences in regulatory occupational exposure or emission limits, industry/ process technologies) may impact exposures or releases relative to the U.S. or the country of origin is not specified.
Unacceptable (score = 4)
This metric does not have an unacceptable criterion since no geographic location is known to have unacceptable data.
Reviewer’s comments
[Document concerns, uncertainties, limitations, and deficiencies and any additional comments that may highlight study strengths or important elements such as relevance]
Metric 3. Applicability
High (score = 1)
The assessment is for an occupational scenario within the scope of the risk evaluation.
Medium (score = 2)
The assessment is for an occupational scenario that is similar to an occupational scenario within the scope of the risk evaluation, in terms of the type of industry, operations, and work activities.
Low (score = 3)
The assessment is for a non-occupational scenario that is similar to an occupational scenario within the scope of the risk evaluation, such as a consumer DIY scenario that is similar to a worker scenario.
Unacceptable (score = 4)
The assessment is from an occupational or non-occupational scenario that does not apply to any occupational scenario within the scope of the risk evaluation.
Reviewer’s comments
[Document concerns, uncertainties, limitations, and deficiencies and any additional comments that may highlight study strengths or important elements such as relevance]
Metric 4. Temporal representativeness
High (score = 1)
The assessment captures operations, equipment, and worker activities expected to be representative of current conditions. EPA has no reason to believe exposures have changed. The completed exposure or risk assessment is generally no more than 10 years old.
Medium (score = 2)
The assessment captures operations, equipment, and worker activities that are expected to be reasonably representative of current conditions. The completed exposure or risk assessment is generally, more than 10 years but no more than 20
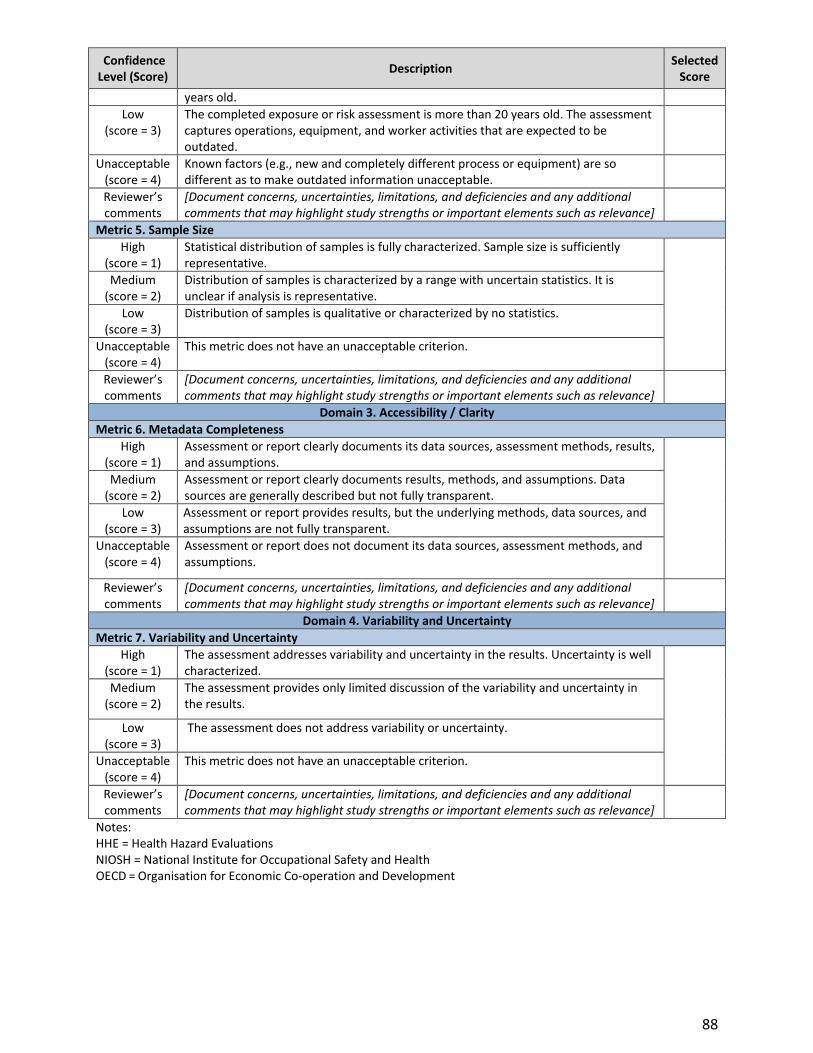
88
Confidence Level (Score)
Description Selected
Score
years old.
Low (score = 3)
The completed exposure or risk assessment is more than 20 years old. The assessment captures operations, equipment, and worker activities that are expected to be outdated.
Unacceptable (score = 4)
Known factors (e.g., new and completely different process or equipment) are so different as to make outdated information unacceptable.
Reviewer’s comments
[Document concerns, uncertainties, limitations, and deficiencies and any additional comments that may highlight study strengths or important elements such as relevance]
Metric 5. Sample Size
High (score = 1)
Statistical distribution of samples is fully characterized. Sample size is sufficiently representative.
Medium (score = 2)
Distribution of samples is characterized by a range with uncertain statistics. It is unclear if analysis is representative.
Low (score = 3)
Distribution of samples is qualitative or characterized by no statistics.
Unacceptable (score = 4)
This metric does not have an unacceptable criterion.
Reviewer’s comments
[Document concerns, uncertainties, limitations, and deficiencies and any additional comments that may highlight study strengths or important elements such as relevance]
Domain 3. Accessibility / Clarity
Metric 6. Metadata Completeness
High (score = 1)
Assessment or report clearly documents its data sources, assessment methods, results, and assumptions.
Medium (score = 2)
Assessment or report clearly documents results, methods, and assumptions. Data sources are generally described but not fully transparent.
Low (score = 3)
Assessment or report provides results, but the underlying methods, data sources, and assumptions are not fully transparent.
Unacceptable (score = 4)
Assessment or report does not document its data sources, assessment methods, and assumptions.
Reviewer’s comments
[Document concerns, uncertainties, limitations, and deficiencies and any additional comments that may highlight study strengths or important elements such as relevance]
Domain 4. Variability and Uncertainty
Metric 7. Variability and Uncertainty
High (score = 1)
The assessment addresses variability and uncertainty in the results. Uncertainty is well characterized.
Medium (score = 2)
The assessment provides only limited discussion of the variability and uncertainty in the results.
Low (score = 3)
The assessment does not address variability or uncertainty.
Unacceptable (score = 4)
This metric does not have an unacceptable criterion.
Reviewer’s comments
[Document concerns, uncertainties, limitations, and deficiencies and any additional comments that may highlight study strengths or important elements such as relevance]
Notes: HHE = Health Hazard Evaluations NIOSH = National Institute for Occupational Safety and Health OECD = Organisation for Economic Co-operation and Development

89
D.7.5 Data/Information from Reports Containing Other than Exposure or Release Data
The general approach for setting the criteria for an unacceptable rating is to only assign an unacceptable rating when EPA can confirm that the data or information is unacceptable. If the data source lacks documentation of needed metadata, EPA will not rate the metric as unacceptable but will rate it as low. The reason for this approach is to avoid omitting potentially valid data or information since occupational exposure and release data are often sparse. EPA will not use data/information from data sources that exhibit serious flaws as described in Table D-18. Table D-18. Serious Flaws that Would Make Data / Information from Reports Containing Other than Exposure or Release Data Unacceptable for Use in the Environmental Release and Occupational Exposure Assessment
Optimization of the list of serious flaws may occur after pilot calibration exercises.
Domain Metric Description of Serious Flaw(s) in Data Source
Reliability Methodology
The assessment or report uses data or techniques or methods that are not consistent with the best available science. Assumptions, extrapolations, measurements, and models are not appropriate. There appears to be mathematical errors or errors in logic.
Representativeness
Geographic Scope This metric does not have an unacceptable criterion since no geographic location is known to have unacceptable data.
Applicability The report is from an occupational or non-occupational scenario that does not apply to any occupational scenario within the scope of the risk evaluation
Temporal representativeness
Known factors (e.g., new and completely different process or equipment) are so different as to make outdated information unacceptable.
Sample Size This metric does not have an unacceptable criterion.
Accessibility / Clarity Metadata
Completeness
Assessment or report does not document its data sources, assessment methods, and assumptions.
Variability and Uncertainty
Metadata Completeness
This metric does not have an unacceptable criterion.
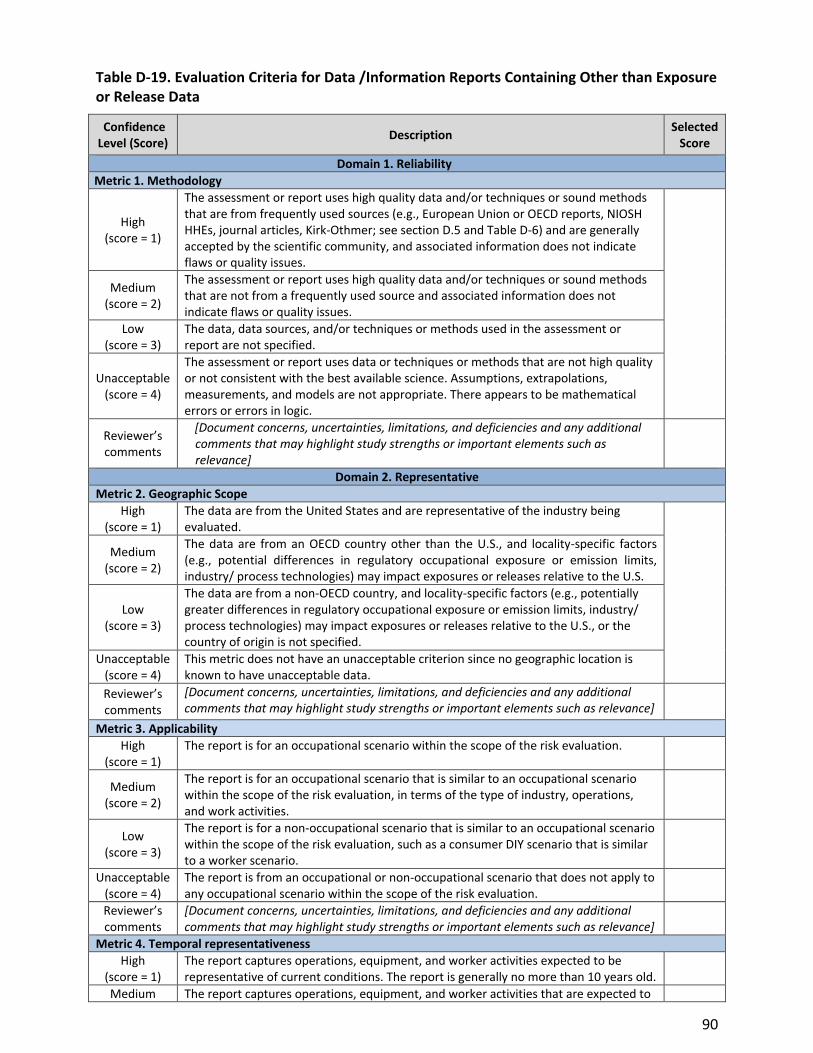
90
Table D-19. Evaluation Criteria for Data /Information Reports Containing Other than Exposure or Release Data
Confidence Level (Score)
Description Selected
Score
Domain 1. Reliability
Metric 1. Methodology
High (score = 1)
The assessment or report uses high quality data and/or techniques or sound methods that are from frequently used sources (e.g., European Union or OECD reports, NIOSH HHEs, journal articles, Kirk-Othmer; see section D.5 and Table D-6) and are generally accepted by the scientific community, and associated information does not indicate flaws or quality issues.
Medium (score = 2)
The assessment or report uses high quality data and/or techniques or sound methods that are not from a frequently used source and associated information does not indicate flaws or quality issues.
Low (score = 3)
The data, data sources, and/or techniques or methods used in the assessment or report are not specified.
Unacceptable (score = 4)
The assessment or report uses data or techniques or methods that are not high quality or not consistent with the best available science. Assumptions, extrapolations, measurements, and models are not appropriate. There appears to be mathematical errors or errors in logic.
Reviewer’s comments
[Document concerns, uncertainties, limitations, and deficiencies and any additional comments that may highlight study strengths or important elements such as relevance]
Domain 2. Representative
Metric 2. Geographic Scope
High (score = 1)
The data are from the United States and are representative of the industry being evaluated.
Medium (score = 2)
The data are from an OECD country other than the U.S., and locality-specific factors (e.g., potential differences in regulatory occupational exposure or emission limits, industry/ process technologies) may impact exposures or releases relative to the U.S.
Low (score = 3)
The data are from a non-OECD country, and locality-specific factors (e.g., potentially greater differences in regulatory occupational exposure or emission limits, industry/ process technologies) may impact exposures or releases relative to the U.S., or the country of origin is not specified.
Unacceptable (score = 4)
This metric does not have an unacceptable criterion since no geographic location is known to have unacceptable data.
Reviewer’s comments
[Document concerns, uncertainties, limitations, and deficiencies and any additional comments that may highlight study strengths or important elements such as relevance]
Metric 3. Applicability
High (score = 1)
The report is for an occupational scenario within the scope of the risk evaluation.
Medium (score = 2)
The report is for an occupational scenario that is similar to an occupational scenario within the scope of the risk evaluation, in terms of the type of industry, operations, and work activities.
Low (score = 3)
The report is for a non-occupational scenario that is similar to an occupational scenario within the scope of the risk evaluation, such as a consumer DIY scenario that is similar to a worker scenario.
Unacceptable (score = 4)
The report is from an occupational or non-occupational scenario that does not apply to any occupational scenario within the scope of the risk evaluation.
Reviewer’s comments
[Document concerns, uncertainties, limitations, and deficiencies and any additional comments that may highlight study strengths or important elements such as relevance]
Metric 4. Temporal representativeness
High (score = 1)
The report captures operations, equipment, and worker activities expected to be representative of current conditions. The report is generally no more than 10 years old.
Medium The report captures operations, equipment, and worker activities that are expected to

91
Confidence Level (Score)
Description Selected
Score
(score = 2) be reasonably representative of current conditions. The report is generally more than 10 years but no more than 20 years old.
Low (score = 3)
The report is more than 20 years old. The report captures operations, equipment, and worker activities that are expected to be outdated.
Unacceptable (score = 4)
Known factors (e.g., new and completely different process or equipment) are so different as to make outdated information unacceptable.
Reviewer’s comments
[Document concerns, uncertainties, limitations, and deficiencies and any additional comments that may highlight study strengths or important elements such as relevance]
Metric 5. Sample Size
High (score = 1)
Statistical distribution of samples is fully characterized. Sample size is sufficiently representative.
Medium (score = 2)
Distribution of samples is characterized by a range with uncertain statistics. It is unclear if analysis is representative.
Low (score = 3)
Distribution of samples is qualitative or characterized by no statistics.
Unacceptable (score = 4)
This metric does not have an unacceptable criterion.
Reviewer’s comments
[Document concerns, uncertainties, limitations, and deficiencies and any additional comments that may highlight study strengths or important elements such as relevance]
Domain 3. Accessibility / Clarity
Metric 6. Metadata Completeness
High (score = 1)
Assessment or report clearly documents its data sources, assessment methods, results, and assumptions.
Medium (score = 2)
Assessment or report clearly documents results, methods, and assumptions. Data sources are generally described but not fully transparent.
Low (score = 3)
Assessment or report provides results, but the underlying methods, data sources, and assumptions are not fully transparent.
Unacceptable (score = 4)
Assessment or report does not document its data sources, assessment methods, and assumptions.
Reviewer’s comments
[Document concerns, uncertainties, limitations, and deficiencies and any additional comments that may highlight study strengths or important elements such as relevance]
Domain 4. Variability and Uncertainty
Metric 7. Variability and Uncertainty
High (score = 1)
The report addresses variability and uncertainty in the results. Uncertainty is well characterized.
Medium (score = 2)
The report provides only limited discussion of the variability and uncertainty in the results.
Low (score = 3)
The report does not address variability or uncertainty.
Unacceptable (score = 4)
This metric does not have an unacceptable criterion.
Reviewer’s comments
[Document concerns, uncertainties, limitations, and deficiencies and any additional comments that may highlight study strengths or important elements such as relevance]
Notes: HHE = Health Hazard Evaluation NIOSH = National Institute for Occupational Safety and Health OECD = Organisation for Economic Co-operation and Development
92
D.8 References
1. ECHA. (2011). Guidance on information requirements and chemical safety assessment. Chapter R.3: Information gathering. https://hero.epa.gov/heronet/index.cfm/reference/download/reference_id/4262857.
2. Moermond, CB, A. Breton, R. Junghans, M. Laskowski, R. Solomon, K. Zahner, H. (2016). Assessing the reliability of ecotoxicological studies: An overview of current needs and approaches. Integr Environ Assess Manag. 13: 1-12. http://dx.doi.org/10.1002/ieam.1870; http://onlinelibrary.wiley.com/store/10.1002/ieam.1870/asset/ieam1870.pdf?v=1&t=jerdoypz&s=ee96db9e589f470deb10651cdb1460d9ada93486.
3. U.S. EPA. (2009). Guidance on the Development, Evaluation, and Application of Environmental Models. (EPA/100/K-09/003). Washington, DC: Office of the Science Advisor. https://hero.epa.gov/heronet/index.cfm/reference/download/reference_id/4262976.

93
APPENDIX E: DATA QUALITY CRITERIA FOR STUDIES ON CONSUMER, GENERAL POPULATION AND ENVIRONMENTAL EXPOSURE
E.1 Types of Consumer, General Population and Environmental Exposure Data Sources
The data quality of consumer, general population, and environmental exposure data sources will be evaluated for seven different types of data sources: monitoring data, modeling data, survey-based data, epidemiological based data, experimental data, completed exposure assessments and risk characterizations, and database sources not unique to a chemical. Definitions for these data types are shown below in Table E-1. Table E-1. Types of Exposure Data Sources
Type of Data Source Definition
Monitoring Data
Measured chemical concentration(s) obtained from sampling of environmental media (e.g., air, water, soil, and biota) to observe and study conditions of the environment. Monitoring data also include measured concentrations of chemicals or their metabolites in biological matrices (i.e., blood, urine, breastmilk, breath, hair, and organs) that provide direct evidence about exposure of environmental contaminants in humans and wildlife, as well as measured chemical concentrations obtained from personal exposure monitoring (i.e., breathing zone, skin patch samples).
Modeling Data
Calculated values derived from computational models for estimation of environmental concentrations (i.e., indoor, outdoor, microenvironments) and uptakes (e.g., ADD, LADD, Cmax, or AUC) associated with relevant exposure scenarios and routes (i.e., inhalation, oral, dermal).
Survey-based Data
Data collected from survey questionnaires about activity and use patterns (e.g., habits, practices, food intake) to evaluate exposure to an individual, a population segment or a population.
Epidemiological Data
Exposure data obtained from epidemiological studies collected as part of the examination of the association between chemical exposure and the occurrence and causes of health effects in human populations. The data may also come from case study reports which characterize exposures to one person.
Experimental Data
Data obtained from experimental studies conducted in a controlled environment with pre-defined testing conditions. Examples include data from laboratory/chamber tests such as those conducted for product testing, source characterization, emissions testing, and migration testing. Experimental data may also include chemical concentrations from personal exposure or biomonitoring studies conducted in laboratory/chamber test settings.
Completed Exposure
Assessments and Risk
Characterizations
Data reported in completed exposure assessments and risk characterizations containing a broad range of exposure data types (e.g., media concentrations, doses, estimated values, exposure factors). Examples: ATSDR assessments, risk assessments completed by other countries.
Database Sources Not Unique to a
Chemical
Data obtained from large databases which collate information for a wide variety of chemicals using methods that are reasonable and consistent with sound scientific theory and/or accepted approaches, and are from sources generally using sound methods and/or approaches (e.g., state or federal governments, academia). Example databases: NHANES, STORET.
Notes: ADD = Average daily dose ATSDR = Agency for Toxic Substances and Disease Registry AUC = Area under the curve Cmax = maximum concentration in plasma
LADD = Lifetime average daily dose NHANES = National Health and Nutrition Examination Survey STORET = Storage and Retrieval for Water Quality Data database

94
In general, the studies will inform the following basic data needs for exposures assessment (NRC, 1991):
measures or estimates of the chemical
the source of the chemical exposure
environmental media of exposure
specific populations exposed, including potentially exposed or susceptible subpopulations
intensity and frequency of contact
spatial and temporal concentration patterns
Some data sources identified as on-topic26 for consumer, general population, and environmental exposure will also be identified as on-topic for the other disciplines (Engineering, Fate, Human Health Hazard, Environmental Health Hazard) supporting the development of the TSCA risk evaluations. In these cases, each discipline will consider different aspects of the same study. This is the case for epidemiological studies which examine disease patterns among populations during a specific duration of time. While the human health assessors are primarily interested in the hazards and effects that exposure to pollutants have on key biological, chemical, and physical processes affecting human health, exposure assessors are primarily interested in estimating exposure via direct measurements (e.g., media concentrations coupled with uptake rates, biomonitoring concentrations) or modeling. EPA anticipates that many epidemiological studies will need to be assessed by both the exposure and the human health assessors.
E.2 Data Quality Evaluation Domains
The data sources will be evaluated against the following four data quality evaluation domains: reliability, representativeness, accessibility/clarity, and variability and uncertainty. These domains, as defined in Table E-2, address elements of TSCA Science Standards 26(h)(1) through 26(h)(5).
Table E-2. Data Evaluation Domains and Definitions
Evaluation Domain Definition
Reliability The inherent property of a study, which includes the use of well-founded scientific approaches, the avoidance of bias within the study design and faithful study conduct and documentation (ECHA, 2011a).
Representativeness The data reported address exposure scenarios (e.g., sources, pathways, routes, receptors) that are relevant to the assessment.
Accessibility/Clarity The data and supporting information are accessible and clearly documented.
Variability and Uncertainty
The data describe variability and uncertainty (quantitative and qualitative) or the procedures, measures, methods, or models are evaluated and characterized.
26 For the scoping phase, EPA/OPPT developed specific criteria to determine which references should be tagged as
“on-topic” (inclusion criteria) and “off-topic” (exclusion criteria). Refer to the literature search strategies and bibliographies developed for each of the 10 existing chemicals under evaluation. https://www.epa.gov/assessing-and-managing-chemicals-under-tsca/risk-evaluations-existing-chemicals-under-tsca
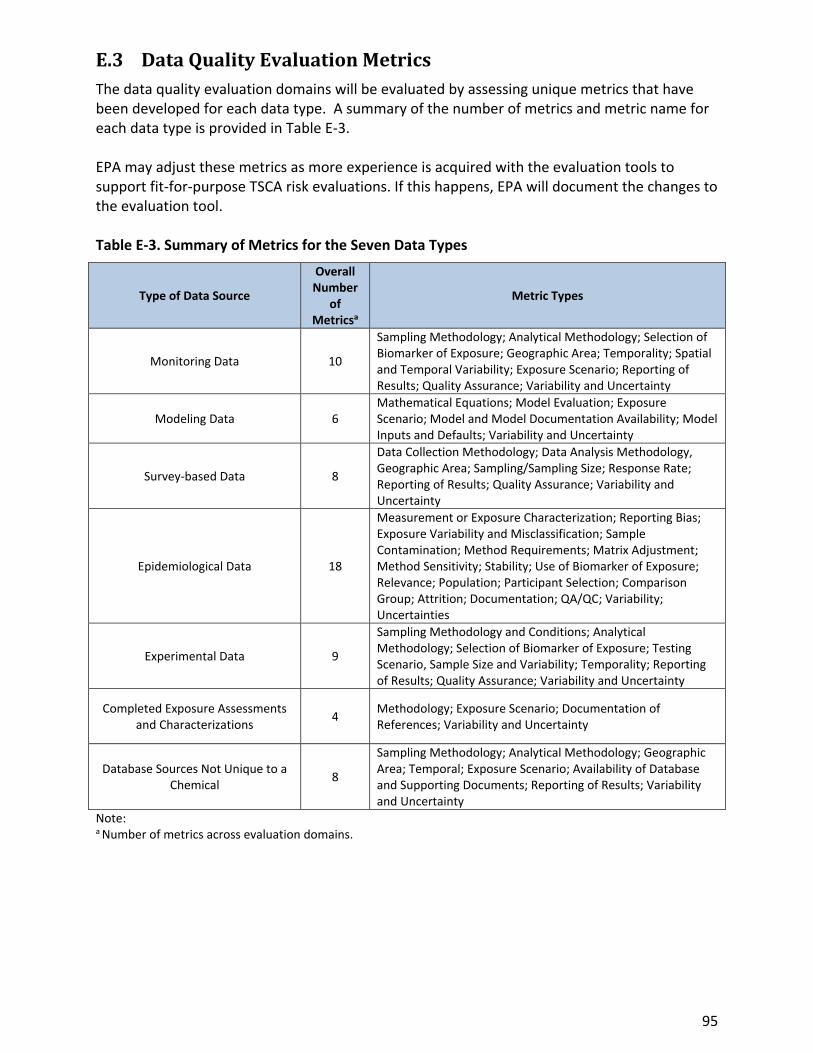
95
E.3 Data Quality Evaluation Metrics
The data quality evaluation domains will be evaluated by assessing unique metrics that have been developed for each data type. A summary of the number of metrics and metric name for each data type is provided in Table E-3. EPA may adjust these metrics as more experience is acquired with the evaluation tools to support fit-for-purpose TSCA risk evaluations. If this happens, EPA will document the changes to the evaluation tool. Table E-3. Summary of Metrics for the Seven Data Types
Type of Data Source
Overall Number
of Metricsa
Metric Types
Monitoring Data 10
Sampling Methodology; Analytical Methodology; Selection of Biomarker of Exposure; Geographic Area; Temporality; Spatial and Temporal Variability; Exposure Scenario; Reporting of Results; Quality Assurance; Variability and Uncertainty
Modeling Data 6 Mathematical Equations; Model Evaluation; Exposure Scenario; Model and Model Documentation Availability; Model Inputs and Defaults; Variability and Uncertainty
Survey-based Data 8
Data Collection Methodology; Data Analysis Methodology, Geographic Area; Sampling/Sampling Size; Response Rate; Reporting of Results; Quality Assurance; Variability and Uncertainty
Epidemiological Data 18
Measurement or Exposure Characterization; Reporting Bias; Exposure Variability and Misclassification; Sample Contamination; Method Requirements; Matrix Adjustment; Method Sensitivity; Stability; Use of Biomarker of Exposure; Relevance; Population; Participant Selection; Comparison Group; Attrition; Documentation; QA/QC; Variability; Uncertainties
Experimental Data 9
Sampling Methodology and Conditions; Analytical Methodology; Selection of Biomarker of Exposure; Testing Scenario, Sample Size and Variability; Temporality; Reporting of Results; Quality Assurance; Variability and Uncertainty
Completed Exposure Assessments and Characterizations
4 Methodology; Exposure Scenario; Documentation of References; Variability and Uncertainty
Database Sources Not Unique to a Chemical
8
Sampling Methodology; Analytical Methodology; Geographic Area; Temporal; Exposure Scenario; Availability of Database and Supporting Documents; Reporting of Results; Variability and Uncertainty
Note: a Number of metrics across evaluation domains.
96
E.4 Scoring Method and Determination of Overall Data Quality Level
A scoring system will be used to assign the overall quality of the data source, as discussed in Appendix A. E.4.1 Weighting Factors
EPA/OPPT is not applying weighting factors to the general population, consumer, and environmental exposure data types. In practice, it is equivalent to assigning a weighting factor of 1, which statistically assumes that each metric carries an equal amount of weight. This approach was adopted because of the wide range of objectives exhibited by the data sources across and within each data type and variations in their protocols, making it difficult to fairly apply a standard weighting scheme to all studies. Additionally, it is expected that weighting inherently occurs for most data types because more metrics are assigned to the reliability and representativeness domains (when combined) than the accessibility/clarity and variability/uncertainty domains. This is consistent with the logic that the reliability and representativeness domains are considered more important than other domains since these domains are considered fundamental aspects of the study.
E.4.2 Calculation of Overall Study Score
To determine the overall study score, the first step is to multiply the score for each metric (1, 2, or 3 for high, medium, or low confidence, respectively) by the appropriate weighting factor, as shown in Table E-4, to obtain a weighted metric score. The weighted metric scores are then summed and divided by the sum of the weighting factors (for all metrics that are scored) to obtain an overall study score between 1 and 3. The equation for calculating the overall score is shown below. Although weighting factors are not used, the equation is showing the term for Weighting Factor (equivalent to 1) to be transparent about the calculation and to provide a consistent equation among the disciplines:
Overall Score (range of 1 to 3) = ∑ (Metric Score × Weighting Factor)/∑ (Weighting Factors) Table E-4 provides an example scoring for monitoring data. Studies with any single metric scored as 4 will be automatically assigned an overall quality score of Unacceptable and further evaluation of the remaining metrics is not necessary. An Unacceptable score means that serious flaws are noted in the domain metric that consequently make the data unusable (or invalid). EPA/OPPT plans to use data with an overall quality level of High, Medium, or Low to quantitatively or qualitatively support the risk evaluations, but does not plan to use data rated as Unacceptable.
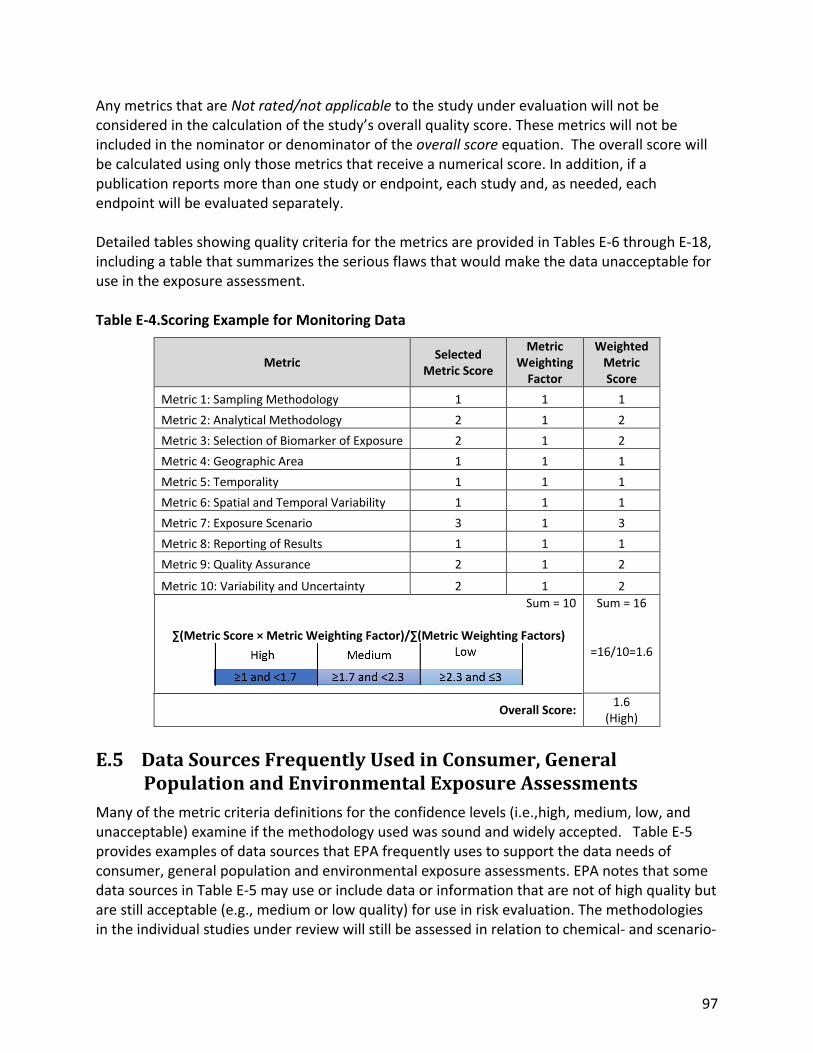
97
Any metrics that are Not rated/not applicable to the study under evaluation will not be considered in the calculation of the study’s overall quality score. These metrics will not be included in the nominator or denominator of the overall score equation. The overall score will be calculated using only those metrics that receive a numerical score. In addition, if a publication reports more than one study or endpoint, each study and, as needed, each endpoint will be evaluated separately. Detailed tables showing quality criteria for the metrics are provided in Tables E-6 through E-18, including a table that summarizes the serious flaws that would make the data unacceptable for use in the exposure assessment. Table E-4.Scoring Example for Monitoring Data
Metric Selected
Metric Score
Metric Weighting
Factor
Weighted Metric Score
Metric 1: Sampling Methodology 1 1 1
Metric 2: Analytical Methodology 2 1 2
Metric 3: Selection of Biomarker of Exposure 2 1 2
Metric 4: Geographic Area 1 1 1
Metric 5: Temporality 1 1 1
Metric 6: Spatial and Temporal Variability 1 1 1
Metric 7: Exposure Scenario 3 1 3
Metric 8: Reporting of Results 1 1 1
Metric 9: Quality Assurance 2 1 2
Metric 10: Variability and Uncertainty 2 1 2
Sum = 10
∑(Metric Score × Metric Weighting Factor)/∑(Metric Weighting Factors)
Sum = 16
=16/10=1.6
Overall Score: 1.6
(High)
E.5 Data Sources Frequently Used in Consumer, General Population and Environmental Exposure Assessments
Many of the metric criteria definitions for the confidence levels (i.e.,high, medium, low, and unacceptable) examine if the methodology used was sound and widely accepted. Table E-5 provides examples of data sources that EPA frequently uses to support the data needs of consumer, general population and environmental exposure assessments. EPA notes that some data sources in Table E-5 may use or include data or information that are not of high quality but are still acceptable (e.g., medium or low quality) for use in risk evaluation. The methodologies in the individual studies under review will still be assessed in relation to chemical- and scenario-

98
specific considerations, thus the study may still receive study quality scores ranging from unacceptable to high even though the study used a methodology from a source commonly known to use sound methods and/or approaches. EPA may determine standard quality ratings for some of these sources as more experience is acquired with TSCA risk evaluations. Table E-5. Examples of Data Sources Frequently Used for Consumer, General Population and
Environmental Exposure Assessments
Source
U.S. EPA Chemical Data Reporting (CDR)
High Production Volume (HPV) Challenge Submissions
Extra HPV Program Submissions
EPA Existing Chemicals Engineering Files
EPA Generic Scenarios
Toxics Release Inventory (TRI)
National Emissions Inventory (NEI)
Office of Water
Office of Air
Office of Enforcement and Compliance Assistance Sector Notebooks
AP-42
Other EPA Programs (e.g., Design for Environment)
Occupational Safety and Health Administration (OSHA)
National Institute of Occupational Safety and Health (NIOSH)
American Conference of Governmental Industrial Hygienists (ACGIH)
Agency for Toxic Substances and Disease Registry (ATSDR)
Organisation for Economic Co-operation and Development (OECD)
Screening Information Dataset (SIDS)
Emission Scenario Documents (ESDs)
Other Programs
Environment Canada Canadian Pollution Prevention Information Clearinghouse
Other Programs
U.S. Census Bureau North American Industry Classification System (NAICS) Definitions
County Business Patterns
Annual Survey of Manufacturers
Current Industrial Reports
Economic Census
Bureau of Labor Statistics (BLS)
North Carolina Division of Pollution Prevention and Environmental Assistance
Kirk-Othmer Encyclopedia of Chemical Technology
Hazardous Substances Data Bank (HSDB)
National Library of Medicine’s HazMap
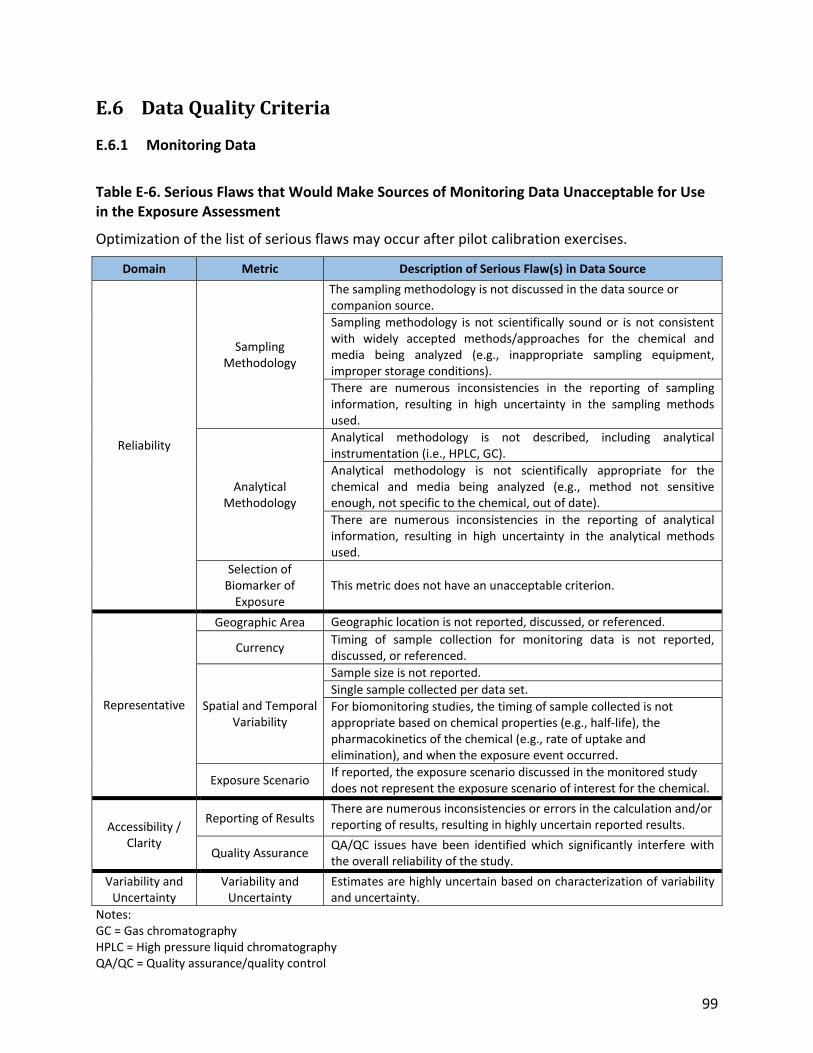
99
E.6 Data Quality Criteria
E.6.1 Monitoring Data
Table E-6. Serious Flaws that Would Make Sources of Monitoring Data Unacceptable for Use in the Exposure Assessment
Optimization of the list of serious flaws may occur after pilot calibration exercises.
Domain Metric Description of Serious Flaw(s) in Data Source
Reliability
Sampling Methodology
The sampling methodology is not discussed in the data source or companion source.
Sampling methodology is not scientifically sound or is not consistent with widely accepted methods/approaches for the chemical and media being analyzed (e.g., inappropriate sampling equipment, improper storage conditions).
There are numerous inconsistencies in the reporting of sampling information, resulting in high uncertainty in the sampling methods used.
Analytical Methodology
Analytical methodology is not described, including analytical instrumentation (i.e., HPLC, GC).
Analytical methodology is not scientifically appropriate for the chemical and media being analyzed (e.g., method not sensitive enough, not specific to the chemical, out of date).
There are numerous inconsistencies in the reporting of analytical information, resulting in high uncertainty in the analytical methods used.
Selection of Biomarker of
Exposure This metric does not have an unacceptable criterion.
Representative
Geographic Area Geographic location is not reported, discussed, or referenced.
Currency Timing of sample collection for monitoring data is not reported, discussed, or referenced.
Spatial and Temporal Variability
Sample size is not reported.
Single sample collected per data set.
For biomonitoring studies, the timing of sample collected is not appropriate based on chemical properties (e.g., half-life), the pharmacokinetics of the chemical (e.g., rate of uptake and elimination), and when the exposure event occurred.
Exposure Scenario If reported, the exposure scenario discussed in the monitored study does not represent the exposure scenario of interest for the chemical.
Accessibility / Clarity
Reporting of Results There are numerous inconsistencies or errors in the calculation and/or reporting of results, resulting in highly uncertain reported results.
Quality Assurance QA/QC issues have been identified which significantly interfere with the overall reliability of the study.
Variability and Uncertainty
Variability and Uncertainty
Estimates are highly uncertain based on characterization of variability and uncertainty.
Notes: GC = Gas chromatography HPLC = High pressure liquid chromatography QA/QC = Quality assurance/quality control

100
Table E-7. Evaluation Criteria for Sources of Monitoring Data
Confidence Level (Score)
Description Selected
Score
Domain 1. Reliability
Metric 1. Sampling Methodology
High (score = 1)
Samples were collected according to publicly available SOPs that are scientifically sound and widely accepted (i.e., from a source generally using sound methods and/or approaches) for the chemical and media of interest. Example SOPs include USGS’s “National Field Manual for the Collection of Water-Quality Data”, EPA’s “Ambient Air Sampling” (SESDPROC-303-R5), etc. OR
The sampling protocol used was not a publicly available SOP from a from a source generally using sound methods and/or approaches, but the sampling methodology is clear, appropriate (i.e., scientifically sound), and similar to widely accepted protocols for the chemical and media of interest. All pertinent sampling information is provided in the data source or companion source. Examples include: sampling equipment sampling procedures/regime sample storage conditions/duration performance/calibration of sampler study site characteristics matrix characteristics
Medium (score = 2)
Sampling methodology is discussed in the data source or companion source and is generally appropriate (i.e., scientifically sound) for the chemical and media of interest, however, one or more pieces of sampling information is not described. The missing information is unlikely to have a substantial impact on results. OR
Standards, methods, protocols, or test guidelines may not be widely accepted, but a successful validation study for the new/unconventional procedure was conducted prior to the sampling event and is consistent with sound scientific theory and/or accepted approaches. Or a review of information indicates the methodology is acceptable and differences in methods are not expected to lead to lower quality data.
Low (score = 3)
Sampling methodology is only briefly discussed; therefore, most sampling information is missing and likely to have a substantial impact on results. AND/OR
The sampling methodology does not represent best sampling methods, protocols, or guidelines for the chemical and media of interest (e.g., outdated (but still valid) sampling equipment or procedures, long storage durations). AND/OR
There are some inconsistencies in the reporting of sampling information (e.g., differences between text and tables in data source, differences between standard method and actual procedures reported to have been used, etc.) which lead to a low confidence in the sampling methodology used.
Unacceptable (score = 4)
The sampling methodology is not discussed in the data source or companion source. AND/OR
Sampling methodology is not scientifically sound or is not consistent with widely accepted methods/approaches for the chemical and media being analyzed (e.g., inappropriate sampling equipment, improper storage conditions).
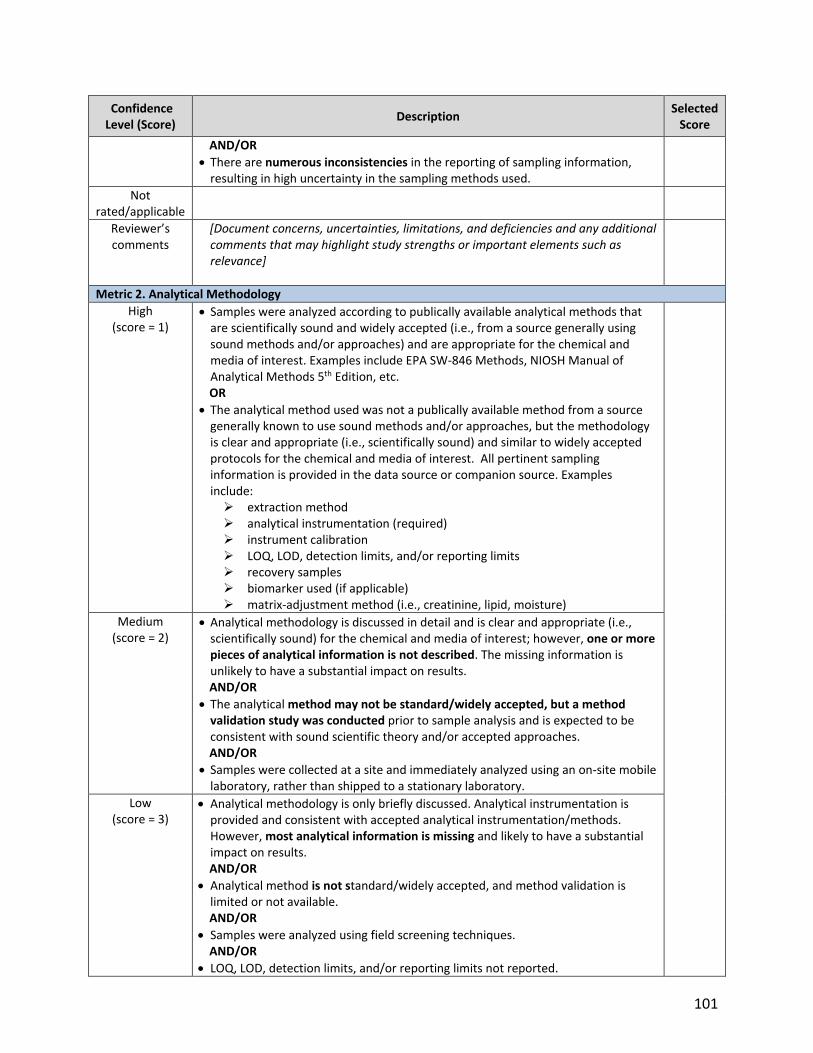
101
Confidence Level (Score)
Description Selected
Score
AND/OR
There are numerous inconsistencies in the reporting of sampling information, resulting in high uncertainty in the sampling methods used.
Not rated/applicable
Reviewer’s comments
[Document concerns, uncertainties, limitations, and deficiencies and any additional comments that may highlight study strengths or important elements such as relevance]
Metric 2. Analytical Methodology
High (score = 1)
Samples were analyzed according to publically available analytical methods that are scientifically sound and widely accepted (i.e., from a source generally using sound methods and/or approaches) and are appropriate for the chemical and media of interest. Examples include EPA SW-846 Methods, NIOSH Manual of Analytical Methods 5th Edition, etc. OR
The analytical method used was not a publically available method from a source generally known to use sound methods and/or approaches, but the methodology is clear and appropriate (i.e., scientifically sound) and similar to widely accepted protocols for the chemical and media of interest. All pertinent sampling information is provided in the data source or companion source. Examples include: extraction method analytical instrumentation (required) instrument calibration LOQ, LOD, detection limits, and/or reporting limits recovery samples biomarker used (if applicable) matrix-adjustment method (i.e., creatinine, lipid, moisture)
Medium (score = 2)
Analytical methodology is discussed in detail and is clear and appropriate (i.e., scientifically sound) for the chemical and media of interest; however, one or more pieces of analytical information is not described. The missing information is unlikely to have a substantial impact on results. AND/OR
The analytical method may not be standard/widely accepted, but a method validation study was conducted prior to sample analysis and is expected to be consistent with sound scientific theory and/or accepted approaches. AND/OR
Samples were collected at a site and immediately analyzed using an on-site mobile laboratory, rather than shipped to a stationary laboratory.
Low (score = 3)
Analytical methodology is only briefly discussed. Analytical instrumentation is provided and consistent with accepted analytical instrumentation/methods. However, most analytical information is missing and likely to have a substantial impact on results. AND/OR
Analytical method is not standard/widely accepted, and method validation is limited or not available. AND/OR
Samples were analyzed using field screening techniques. AND/OR
LOQ, LOD, detection limits, and/or reporting limits not reported.
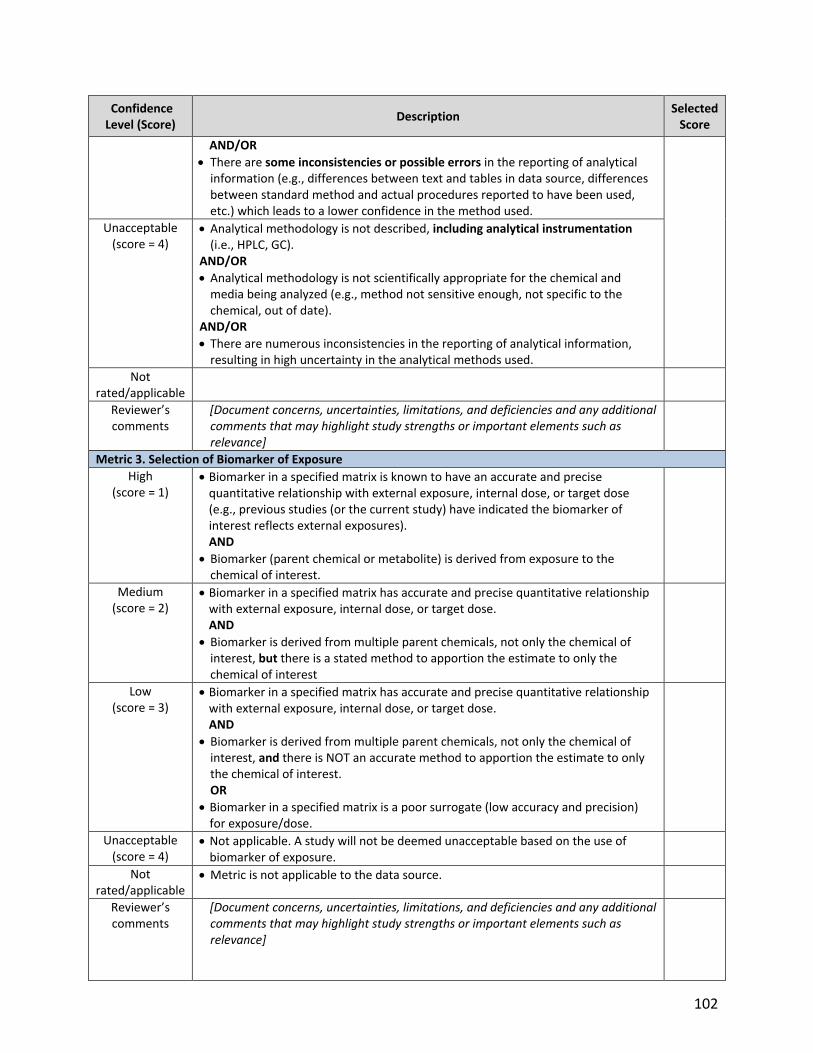
102
Confidence Level (Score)
Description Selected
Score
AND/OR
There are some inconsistencies or possible errors in the reporting of analytical information (e.g., differences between text and tables in data source, differences between standard method and actual procedures reported to have been used, etc.) which leads to a lower confidence in the method used.
Unacceptable (score = 4)
Analytical methodology is not described, including analytical instrumentation (i.e., HPLC, GC).
AND/OR
Analytical methodology is not scientifically appropriate for the chemical and media being analyzed (e.g., method not sensitive enough, not specific to the chemical, out of date).
AND/OR
There are numerous inconsistencies in the reporting of analytical information, resulting in high uncertainty in the analytical methods used.
Not rated/applicable
Reviewer’s comments
[Document concerns, uncertainties, limitations, and deficiencies and any additional comments that may highlight study strengths or important elements such as relevance]
Metric 3. Selection of Biomarker of Exposure
High (score = 1)
Biomarker in a specified matrix is known to have an accurate and precise quantitative relationship with external exposure, internal dose, or target dose (e.g., previous studies (or the current study) have indicated the biomarker of interest reflects external exposures). AND
Biomarker (parent chemical or metabolite) is derived from exposure to the chemical of interest.
Medium (score = 2)
Biomarker in a specified matrix has accurate and precise quantitative relationship with external exposure, internal dose, or target dose. AND
Biomarker is derived from multiple parent chemicals, not only the chemical of interest, but there is a stated method to apportion the estimate to only the chemical of interest
Low (score = 3)
Biomarker in a specified matrix has accurate and precise quantitative relationship with external exposure, internal dose, or target dose. AND
Biomarker is derived from multiple parent chemicals, not only the chemical of interest, and there is NOT an accurate method to apportion the estimate to only the chemical of interest. OR
Biomarker in a specified matrix is a poor surrogate (low accuracy and precision) for exposure/dose.
Unacceptable (score = 4)
Not applicable. A study will not be deemed unacceptable based on the use of biomarker of exposure.
Not rated/applicable
Metric is not applicable to the data source.
Reviewer’s comments
[Document concerns, uncertainties, limitations, and deficiencies and any additional comments that may highlight study strengths or important elements such as relevance]
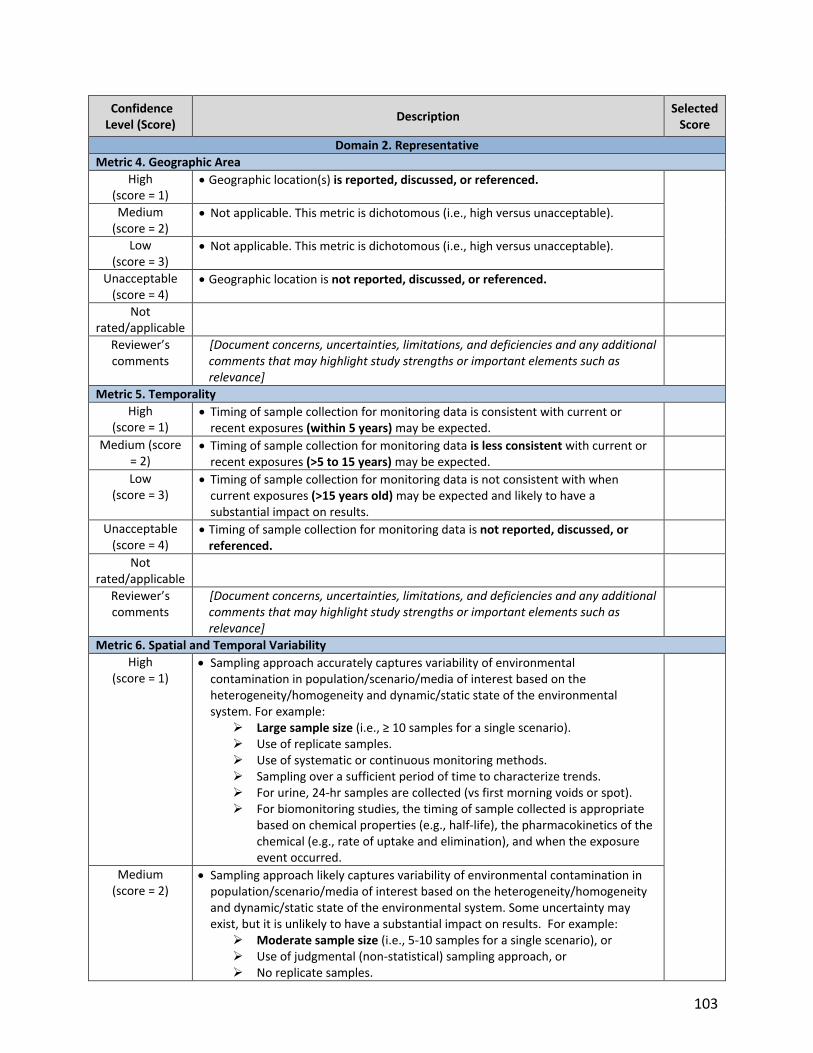
103
Confidence Level (Score)
Description Selected
Score
Domain 2. Representative
Metric 4. Geographic Area
High (score = 1)
Geographic location(s) is reported, discussed, or referenced.
Medium (score = 2)
Not applicable. This metric is dichotomous (i.e., high versus unacceptable).
Low (score = 3)
Not applicable. This metric is dichotomous (i.e., high versus unacceptable).
Unacceptable (score = 4)
Geographic location is not reported, discussed, or referenced.
Not rated/applicable
Reviewer’s comments
[Document concerns, uncertainties, limitations, and deficiencies and any additional comments that may highlight study strengths or important elements such as relevance]
Metric 5. Temporality
High (score = 1)
Timing of sample collection for monitoring data is consistent with current or recent exposures (within 5 years) may be expected.
Medium (score = 2)
Timing of sample collection for monitoring data is less consistent with current or recent exposures (>5 to 15 years) may be expected.
Low (score = 3)
Timing of sample collection for monitoring data is not consistent with when current exposures (>15 years old) may be expected and likely to have a substantial impact on results.
Unacceptable (score = 4)
Timing of sample collection for monitoring data is not reported, discussed, or referenced.
Not rated/applicable
Reviewer’s comments
[Document concerns, uncertainties, limitations, and deficiencies and any additional comments that may highlight study strengths or important elements such as relevance]
Metric 6. Spatial and Temporal Variability
High (score = 1)
Sampling approach accurately captures variability of environmental contamination in population/scenario/media of interest based on the heterogeneity/homogeneity and dynamic/static state of the environmental system. For example:
Large sample size (i.e., ≥ 10 samples for a single scenario). Use of replicate samples. Use of systematic or continuous monitoring methods. Sampling over a sufficient period of time to characterize trends. For urine, 24-hr samples are collected (vs first morning voids or spot). For biomonitoring studies, the timing of sample collected is appropriate
based on chemical properties (e.g., half-life), the pharmacokinetics of the chemical (e.g., rate of uptake and elimination), and when the exposure event occurred.
Medium (score = 2)
Sampling approach likely captures variability of environmental contamination in population/scenario/media of interest based on the heterogeneity/homogeneity and dynamic/static state of the environmental system. Some uncertainty may exist, but it is unlikely to have a substantial impact on results. For example:
Moderate sample size (i.e., 5-10 samples for a single scenario), or Use of judgmental (non-statistical) sampling approach, or No replicate samples.

104
Confidence Level (Score)
Description Selected
Score
For urine, first morning voids or pooled spot samples.
Low (score = 3)
Sampling approach poorly captures variability of environmental contamination in population/scenario/media of interest. For example:
Small sample size (i.e., <5 samples), or Use of haphazard sampling approach, or No replicate samples, or Grab or spot samples in single space or time, or Random sampling that doesn’t include all periods of time or locations, or For urine, un-pooled spot samples.
Unacceptable (score = 4)
Sample size is not reported.
Single sample collected per data set.
For biomonitoring studies, the timing of sample collected is not appropriate based on chemical properties (e.g., half-life), the pharmacokinetics of the chemical (e.g., rate of uptake and elimination), and when the exposure event occurred.
Not rated/applicable
Reviewer’s comments
[Document concerns, uncertainties, limitations, and deficiencies and any additional comments that may highlight study strengths or important elements such as relevance]
Metric 7. Exposure Scenario
High (score = 1)
The data closely represent relevant exposure scenario (i.e., the population/scenario/media of interest). Examples include: amount and type of chemical / product used source of exposure method of application or by-stander exposure use of exposure controls microenvironment (location, time, climate)
Medium (score = 2)
The data likely represent the relevant exposure scenario (i.e., population/scenario/media of interest). One or more key pieces of information may not be described but the deficiencies are unlikely to have a substantial impact on the characterization of the exposure scenario. AND/OR
If surrogate data, activities seem similar to the activities within scope.
Low (score = 3)
The data lack multiple key pieces of information and the deficiencies are likely to have a substantial impact on the characterization of the exposure scenario. AND/OR
There are some inconsistencies or possible errors in the reporting of scenario information (e.g., differences between text and tables in data source, differences between standard method and actual procedures reported to have been used, etc.) which leads to a lower confidence in the scenario assessed. AND/OR
If surrogate data, activities have lesser similarity but are still potentially applicable to the activities within scope.
Unacceptable (score = 4)
If reported, the exposure scenario discussed in the monitored study does not represent the exposure scenario of interest for the chemical.
Not rated/applicable
Reviewer’s comments
[Document concerns, uncertainties, limitations, and deficiencies and any additional comments that may highlight study strengths or important elements such as relevance]

105
Confidence Level (Score)
Description Selected
Score
Domain 3. Accessibility / Clarity
Metric 8. Reporting of Results
High (score = 1)
Supplementary or raw data (i.e., individual data points) are reported, allowing summary statistics to be calculated or reproduced. AND
Summary statistics are detailed and complete. Example parameters include: Description of data set summarized (i.e., location, population, dates, etc.) Range of concentrations or percentiles Number of samples in data set Frequency of detection Measure of variation (CV, standard deviation) Measure of central tendency (mean, geometric mean, median) Test for outliers (if applicable)
AND
Both adjusted and unadjusted results are provided (i.e., correction for void completeness in urine biomonitoring, whole-volume or lipid adjusted for blood biomonitoring, wet or dry weight for ecological tissue samples or soil samples) [only if applicable].
Medium (score = 2)
Supplementary or raw data (i.e., individual data points) are not reported, and therefore summary statistics cannot be reproduced. AND/OR
Summary statistics are reported but are missing one or more parameters (see description for high). AND/OR
Only adjusted or unadjusted results are provided, but not both [only if applicable].
Low (score = 3)
Supplementary data are not provided, and summary statistics are missing most parameters (see description for high). AND/OR
There are some inconsistencies or errors in the results reported, resulting in low confidence in the results reported (e.g., differences between text and tables in data source, less appropriate statistical methods).
Unacceptable (score = 4)
There are numerous inconsistencies or errors in the calculation and/or reporting of results, resulting in highly uncertain reported results.
Not rated/applicable
Reviewer’s comments
[Document concerns, uncertainties, limitations, and deficiencies and any additional comments that may highlight study strengths or important elements such as relevance]
Metric 9. Quality Assurance
High (score = 1)
The study applied quality assurance/quality control measures and all pertinent quality assurance information is provided in the data source or companion source. Examples include:
Field, laboratory, and/or storage recoveries. Field and laboratory control samples. Baseline (pre-exposure) samples. Biomarker stability Completeness of sample (i.e., creatinine, specific gravity, osmolality for
urine samples) AND
No quality control issues were identified or any identified issues were minor and adequately addressed (i.e., correction for low recoveries, correction for
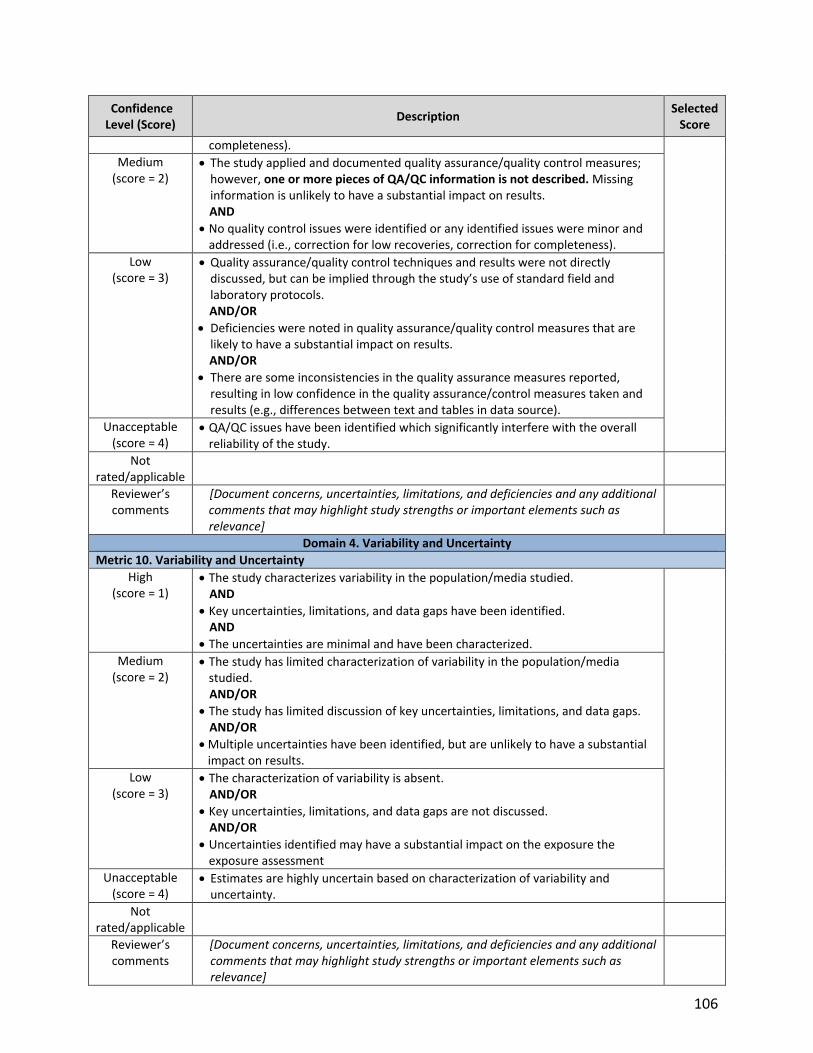
106
Confidence Level (Score)
Description Selected
Score
completeness).
Medium (score = 2)
The study applied and documented quality assurance/quality control measures; however, one or more pieces of QA/QC information is not described. Missing information is unlikely to have a substantial impact on results. AND
No quality control issues were identified or any identified issues were minor and addressed (i.e., correction for low recoveries, correction for completeness).
Low (score = 3)
Quality assurance/quality control techniques and results were not directly discussed, but can be implied through the study’s use of standard field and laboratory protocols. AND/OR
Deficiencies were noted in quality assurance/quality control measures that are likely to have a substantial impact on results. AND/OR
There are some inconsistencies in the quality assurance measures reported, resulting in low confidence in the quality assurance/control measures taken and results (e.g., differences between text and tables in data source).
Unacceptable (score = 4)
QA/QC issues have been identified which significantly interfere with the overall reliability of the study.
Not rated/applicable
Reviewer’s comments
[Document concerns, uncertainties, limitations, and deficiencies and any additional comments that may highlight study strengths or important elements such as relevance]
Domain 4. Variability and Uncertainty
Metric 10. Variability and Uncertainty
High (score = 1)
The study characterizes variability in the population/media studied. AND
Key uncertainties, limitations, and data gaps have been identified. AND
The uncertainties are minimal and have been characterized.
Medium (score = 2)
The study has limited characterization of variability in the population/media studied. AND/OR
The study has limited discussion of key uncertainties, limitations, and data gaps. AND/OR
Multiple uncertainties have been identified, but are unlikely to have a substantial impact on results.
Low (score = 3)
The characterization of variability is absent. AND/OR
Key uncertainties, limitations, and data gaps are not discussed. AND/OR
Uncertainties identified may have a substantial impact on the exposure the exposure assessment
Unacceptable (score = 4)
Estimates are highly uncertain based on characterization of variability and uncertainty.
Not rated/applicable
Reviewer’s comments
[Document concerns, uncertainties, limitations, and deficiencies and any additional comments that may highlight study strengths or important elements such as relevance]

107
Confidence Level (Score)
Description Selected
Score
Notes: ADME = Absorption, distribution, metabolism, and elimination CV = Coefficient of variation GC = Gas chromatography HPLC = High pressure liquid chromatography LOD = Limit of detection
LOQ = Limit of quantitation NIOSH = National Institute for Occupational Safety and Health QA/QC = Quality assurance/quality control SOPs = Standard operating procedures USGS = U.S. Geological Survey

108
E.6.2 Modeling Data27
Table E-8. Serious Flaws that Would Make Sources of Modeling Data Unacceptable for Use in the Exposure Assessment
Optimization of the list of serious flaws may occur after pilot calibration exercises.
Domain Metric Description of Serious Flaw(s) in Data Source
Reliability
Mathematical Equations
For widely accepted models from a source generally known to use sound methods and/or approaches, the module used is not germane to the scenario being assessed.
For other (non-public/non-authoritative) models, key mathematical equations and/or theory are not provided in the data source or in a companion reference.
Key mathematical equations are not based on scientifically sound approaches.
Key mathematical equations are incorrect.
Model Evaluation
The model used in the data source has not undergone evaluation.
It is unknown whether the model has undergone evaluation.
Evaluation efforts indicate that the model results do not correctly estimate concentrations or uptakes.
Model has no acceptance among the scientific or regulatory community.
Representative Exposure Scenario Model inputs do not reflect relevant conditions for the scenario of interest, or insufficient information is provided to make a determination.
Accessibility / Clarity
Model and Model Documentation
Availability This metric does not have an unacceptable criterion.
Model Inputs and Defaults
There is at most a very limited description of model inputs/defaults and their associated data sources.
Variability and Uncertainty
Variability and
Uncertainty
Estimates are highly uncertain based on characterization of uncertainty.
27 Evaluation of models and modeling data types will largely follow guidance from (U.S. EPA, 2009).

109
Table E-9. Evaluation Criteria for Sources of Modeling Data
EPA will consult with the Guidance on the Development, Evaluation, and Application of Environmental Models (U.S. EPA, 2009) when evaluating models and modeling data types.
Confidence Level (Score)
Description Selected
Score
Domain 1. Reliability
Metric 1. Mathematical Equations/Theory
High (score = 1)
The model is scientifically sound and widely accepted (i.e., from a source generally using sound methods and/or approaches) for the scenario being assessed. OR
For other (non-public/non-authoritative) models, key mathematical equations to calculate concentrations or uptakes are provided in the data source or in a companion reference. Equations are described in detail and correctness can be assessed.
Medium (score = 2)
For other (non-public/authoritative) models, key mathematical equations to calculate concentrations or uptakes are not available in the data source, but the scientific and mathematical theory (i.e., conceptual model) is described in detail.
Low (score = 3)
For other (non-public/authoritative) models, key mathematical equations or theory to calculate concentrations or uptakes are unclear or not detailed enough to thoroughly assess.
Unacceptable (score = 4)
For widely accepted models from a source generally known to use sound methods and/or approaches, the module used is not germane to the scenario being assessed. AND/OR
For other (non-public/non-authoritative) models, key mathematical equations and/or theory are not provided in the data source or in a companion reference. AND/OR
Key mathematical equations are not based on scientifically sound approaches. AND/OR
Key mathematical equations are incorrect.
Not rated/applicable
Reviewer’s comments
[Document concerns, uncertainties, limitations, and deficiencies and any additional comments that may highlight study strengths or important elements such as relevance]
Metric 2. Model Evaluation
High (score = 1)
The model used in the data source has undergone extensive evaluation. The evaluation methodology and results are either discussed in the data source or provided in a companion source. Example evaluation methods include: - formal peer review - quantitative corroboration of model results with monitoring data directly relevant for the scenario of interest - benchmarking against other models - quality assurance checks during model development.
Medium (score = 2)
The model used in the data source has undergone only targeted/limited evaluation. For example: - informal peer review - at most limited evaluation with monitoring data - qualitative corroboration of model results through expert elicitation
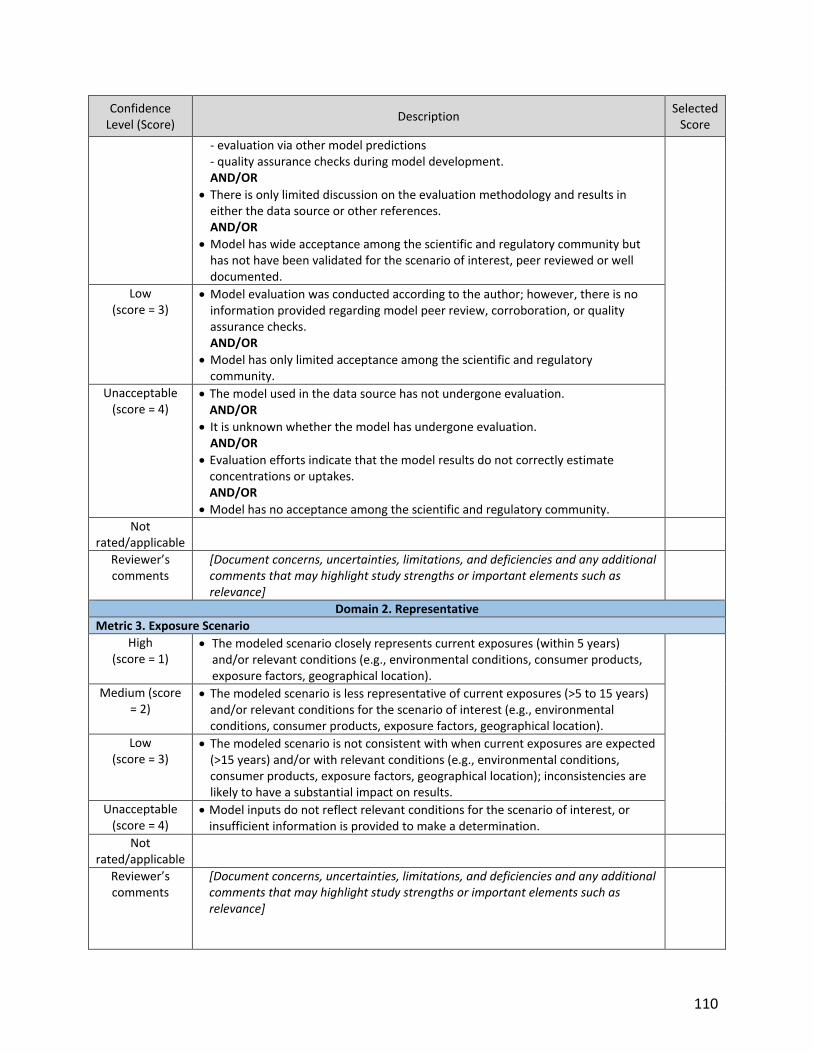
110
Confidence Level (Score)
Description Selected
Score
- evaluation via other model predictions - quality assurance checks during model development. AND/OR
There is only limited discussion on the evaluation methodology and results in either the data source or other references. AND/OR
Model has wide acceptance among the scientific and regulatory community but has not have been validated for the scenario of interest, peer reviewed or well documented.
Low (score = 3)
Model evaluation was conducted according to the author; however, there is no information provided regarding model peer review, corroboration, or quality assurance checks. AND/OR
Model has only limited acceptance among the scientific and regulatory community.
Unacceptable (score = 4)
The model used in the data source has not undergone evaluation. AND/OR
It is unknown whether the model has undergone evaluation. AND/OR
Evaluation efforts indicate that the model results do not correctly estimate concentrations or uptakes. AND/OR
Model has no acceptance among the scientific and regulatory community.
Not rated/applicable
Reviewer’s comments
[Document concerns, uncertainties, limitations, and deficiencies and any additional comments that may highlight study strengths or important elements such as relevance]
Domain 2. Representative
Metric 3. Exposure Scenario
High (score = 1)
The modeled scenario closely represents current exposures (within 5 years) and/or relevant conditions (e.g., environmental conditions, consumer products, exposure factors, geographical location).
Medium (score = 2)
The modeled scenario is less representative of current exposures (>5 to 15 years) and/or relevant conditions for the scenario of interest (e.g., environmental conditions, consumer products, exposure factors, geographical location).
Low (score = 3)
The modeled scenario is not consistent with when current exposures are expected (>15 years) and/or with relevant conditions (e.g., environmental conditions, consumer products, exposure factors, geographical location); inconsistencies are likely to have a substantial impact on results.
Unacceptable (score = 4)
Model inputs do not reflect relevant conditions for the scenario of interest, or insufficient information is provided to make a determination.
Not rated/applicable
Reviewer’s comments
[Document concerns, uncertainties, limitations, and deficiencies and any additional comments that may highlight study strengths or important elements such as relevance]

111
Confidence Level (Score)
Description Selected
Score
Domain 3. Accessibility / Clarity
Metric 4. Model and Model Documentation Availability
High (score = 1)
The model and documentation (user guide, documentation manual) are publicly available or there is sufficient documentation in the data source or in a companion reference.
Medium (score = 2)
Not applicable. This metric is dichotomous (i.e., high versus low).
Low (score = 3)
The model and documentation (user guide, documentation manual) are not available, or there is insufficient documentation in the data source or in a companion reference.
Unacceptable (score = 4)
Not applicable. This metric is dichotomous (i.e., high versus low).
Not rated/applicable
Reviewer’s comments
[Document concerns, uncertainties, limitations, and deficiencies and any additional comments that may highlight study strengths or important elements such as relevance]
Metric 5. Model Inputs and Defaults
High (score = 1)
Key model inputs (e.g., chemical mass released, release pattern over time, receptor uptake rates and locations over time) and defaults are identified, referenced and clearly described. AND
Model inputs meet data quality acceptance criteria specified by the authors or are standard or commonly accepted inputs (e.g., from Exposure Factors Handbook).
Medium (score = 2)
Key model inputs and defaults and associated data sources are generally identified, referenced and clearly described, but the descriptions are not detailed. AND/OR
Data quality acceptance criteria specified by the author are not discussed, but inputs appear appropriate.
Low (score = 3)
Numerous key model inputs and defaults and associated data sources are not identified, referenced or clearly described; AND/OR
There are some inconsistencies in the reporting of inputs and defaults and their associated data sources (e.g., differences between text and tables in data source, differences between standard method and actual procedures reported to have been used) that lead to a low confidence in the inputs and defaults used. AND/OR
Data quality acceptance criteria specified by the author are not discussed and some inputs appear inappropriate.
Unacceptable (score = 4)
There is at most a very limited description of model inputs/defaults and their associated data sources.
Not rated/applicable
Reviewer’s comments
[Document concerns, uncertainties, limitations, and deficiencies and any additional comments that may highlight study strengths or important elements such as relevance]

112
Confidence Level (Score)
Description Selected
Score
Domain 4. Variability and Uncertainty
Metric 6. Variability and Uncertainty
High (score = 1)
The study characterizes variability in the population/media studied. AND
Key uncertainties, limitations, and data gaps have been identified. AND
The uncertainties are minimal and have been characterized.
Medium (score = 2)
The study has limited characterization of variability in the population/media studied. AND/OR
The study has limited discussion of key uncertainties, limitations, and data gaps. AND/OR
Multiple uncertainties have been identified, but are unlikely to have a substantial impact on results.
Low (score = 3)
The characterization of variability is absent. AND/OR
Key uncertainties, limitations, and data gaps are not discussed. AND/OR
Uncertainties identified may have a substantial impact on the exposure the exposure assessment
Unacceptable (score = 4)
Estimates are highly uncertain based on characterization of variability and uncertainty.
Not rated/applicable
Reviewer’s comments
[Document concerns, uncertainties, limitations, and deficiencies and any additional comments that may highlight study strengths or important elements such as relevance]

113
E.6.3 Survey Data
Table E-10. Serious Flaws that Would Make Sources of Survey Data Unacceptable for Use in the Exposure Assessment
Optimization of the list of serious flaws may occur after pilot calibration exercises.
Domain Metric Description of Serious Flaw(s) in Data Source
Reliability
Data Collection Methodology
Data collection methods are not described.
Data collection methods used are not appropriate (i.e., scientifically sound) for the target population, the intended purpose, data requirements of the survey, or the target response rate.
There are numerous inconsistencies in the reporting of data collection information resulting in high uncertainty in the data collection methods used.
Data Analysis Methodology
Data analysis methodology is not described.
Data analysis methodology is not appropriate (i.e., scientifically sound) for the intended purpose of the survey and the data/information collected.
There are numerous inconsistencies in the reporting of analytical information resulting in high uncertainty in the data analysis methods used.
Representative
Geographic Area
Geographic location is not reported, discussed, or referenced.
Sampling/ Sampling Size
Sampling procedures (e.g., stratified sampling, cluster sampling, multi-stage sampling, non-probability sampling, etc.) are not documented in the data source or companion source.
Sample size is not reported.
Response Rate This metric does not have an unacceptable criterion..
Accessibility / Clarity
Reporting of Results
There are numerous inconsistencies or errors in the calculation and/or reporting of results, resulting in highly uncertain reported results.
Quality Assurance
QA/QC issues have been identified which significantly interfere with the overall reliability of the survey results.
Variability and Uncertainty
Variability and Uncertainty
Estimates are highly uncertain based on characterization of variability and uncertainty.
Note: QA/QC = Quality assurance/quality control

114
Table E-11. Evaluation Criteria for Source of Survey Data
Confidence Level (Score)
Description Selected
Score
Domain 1. Reliability
Metric 1. Data Collection Methodology
High (score = 1)
Survey data were collected using a standard or validated data collection methods (e.g., mail, phone, personal interview, online surveys, etc.) that are appropriate (i.e., scientifically sound) given the characteristics of the target population, the intended purpose, data requirements of the survey, and the target response rate. AND
All pertinent information regarding data collection methodology is provided in the data source or companion source. Examples include: data collection instrument (e.g., questionnaire, diaries, etc.) data collection protocols for field personnel date of data collection description of target population
Medium (score = 2)
Survey data were collected using standard or validated data collection methods appropriate given the characteristics of the target population, the intended purpose and data requirements of the survey, and the target response rate. However, one or more pieces of pertinent information regarding data collection is not described. The missing information is unlikely to have a substantial impact on results.
Low (score = 3)
Data collection methods are only briefly discussed, therefore most data collection information is missing and likely to have a substantial impact on results. AND/OR
There are some inconsistencies in the reporting of data collection information (e.g., differences between text and tables in data source) which lead to a low confidence in the data collection methodology used.
Unacceptable (score = 4)
Data collection methods are not described. AND/OR
Data collection methods used are not appropriate (i.e., scientifically sound) for the target population, the intended purpose, data requirements of the survey, or the target response rate. AND/OR
There are numerous inconsistencies in the reporting of data collection information resulting in high uncertainty in the data collection methods used.
Not rated/applicable
Reviewer’s comments
[Document concerns, uncertainties, limitations, and deficiencies and any additional comments that may highlight study strengths or important elements such as relevance]
Metric 2. Data Analysis Methodology
High (score = 1)
Data analysis methodology is discussed in detail and is clear and appropriate (i.e., scientifically sound) for the intended purpose of the survey and the data/information collected. Methods employed are standard/widely accepted. AND
All pertinent analytical methodology information is provided in the data source or companion source. Examples include: information on statistical and weighting methods (if applicable) discussion regarding treatment of missing data

115
Confidence Level (Score)
Description Selected
Score
Identification of sources of error, including coverage error, nonresponse error, measurement error, and data processing error (e.g., keying, coding, editing, and imputation error)
Methods for measuring sampling and nonsampling errors
Medium (score = 2)
Data analysis methodology is discussed and is clear and appropriate for the intended purpose of the survey and the data/information collected. Methods employed are standard/widely accepted; however, one or more pieces of analytical information is not described. The missing information is unlikely to have a substantial impact on results.
Low (score = 3)
Data analysis methodology is only briefly discussed in the data source or companion source, therefore most analytical information is missing and likely to have a substantial impact on results. AND/OR
Methods for data analysis are not standard/widely accepted. AND/OR
There are some inconsistencies in the reporting of analytical information which lead to a low confidence in the data analysis methodology used.
Unacceptable (score = 4)
Data analysis methodology is not described in the data source or companion source. OR
Data analysis methodology is not appropriate (i.e., scientifically sound) for the intended purpose of the survey and the data/information collected. OR
There are numerous inconsistencies in the reporting of analytical information resulting in high uncertainty in the data analysis methods used.
Not rated/applicable
Reviewer’s comments
[Document concerns, uncertainties, limitations, and deficiencies and any additional comments that may highlight study strengths or important elements such as relevance]
Domain 2. Representative
Metric 3. Geographic Area
High (score = 1)
Geographic location(s) is reported, discussed, or referenced.
Medium (score = 2)
Not applicable. This metric is dichotomous (i.e., high versus unacceptable).
Low (score = 3)
Not applicable. This metric is dichotomous (i.e., high versus unacceptable).
Unacceptable (score = 4)
Geographic location is not reported, discussed, or referenced.
Not rated/applicable
Reviewer’s comments
[Document concerns, uncertainties, limitations, and deficiencies and any additional comments that may highlight study strengths or important elements such as relevance]
Metric 4. Sampling/Sampling Size
High (score = 1)
Sampling procedures are documented (e.g., stratified sampling, cluster sampling, multi-stage sampling, non-probability sampling, etc.). AND

116
Confidence Level (Score)
Description Selected
Score
Sample size and method of calculation is reported. AND
Sample size is large enough to be reasonably assured that the samples represent the population of interest. For example, sample size has a margin of error of <10% and a confidence level of >90%.
Medium (score = 2)
Sampling procedures are documented (e.g., stratified sampling, cluster sampling, multi-stage sampling, non-probability sampling, etc.). AND
Sample size is reported, but the sample size calculation method is not reported. AND/OR
Sample size is small, indicating that the survey results are less likely to represent the target population. For example, sample size has a margin of error of >10% and a confidence level of <90%.
Low (score = 3)
Sampling procedures are documented (e.g., stratified sampling, cluster sampling, multi-stage sampling, non-probability sampling, etc.). AND
Sample size is reported, but the sample size calculation method is not reported. AND/OR
Adequacy of sample size is not discussed or cannot be determined from information in the study.
Unacceptable (score = 4)
Sampling procedures (e.g., stratified sampling, cluster sampling, multi-stage sampling, non-probability sampling, etc.) are not documented in the data source or companion source. AND/OR
Sample size is not reported.
Not rated/applicable
Reviewer’s comments
[Document concerns, uncertainties, limitations, and deficiencies and any additional comments that may highlight study strengths or important elements such as relevance]
Metric 5. Response Rate
High (score = 1)
The survey response rate is documented and is high enough (i.e., >70%) to reasonably ensure that the survey results are representative of the target population.
Medium (score = 2)
The survey response rate is documented and the response rate is >40-70%, indicating that the survey results will likely represent the target population.
Low (score = 3)
The survey response rate is documented and the response rate is <40%, indicating that the survey results are less likely to represent the target population. OR
The survey response rate is not documented in the data source or companion source.
Unacceptable (score = 4)
This metric does not have an unacceptable criterion.
Not rated/applicable
Reviewer’s comments
[Document concerns, uncertainties, limitations, and deficiencies and any additional comments that may highlight study strengths or important elements such as relevance]
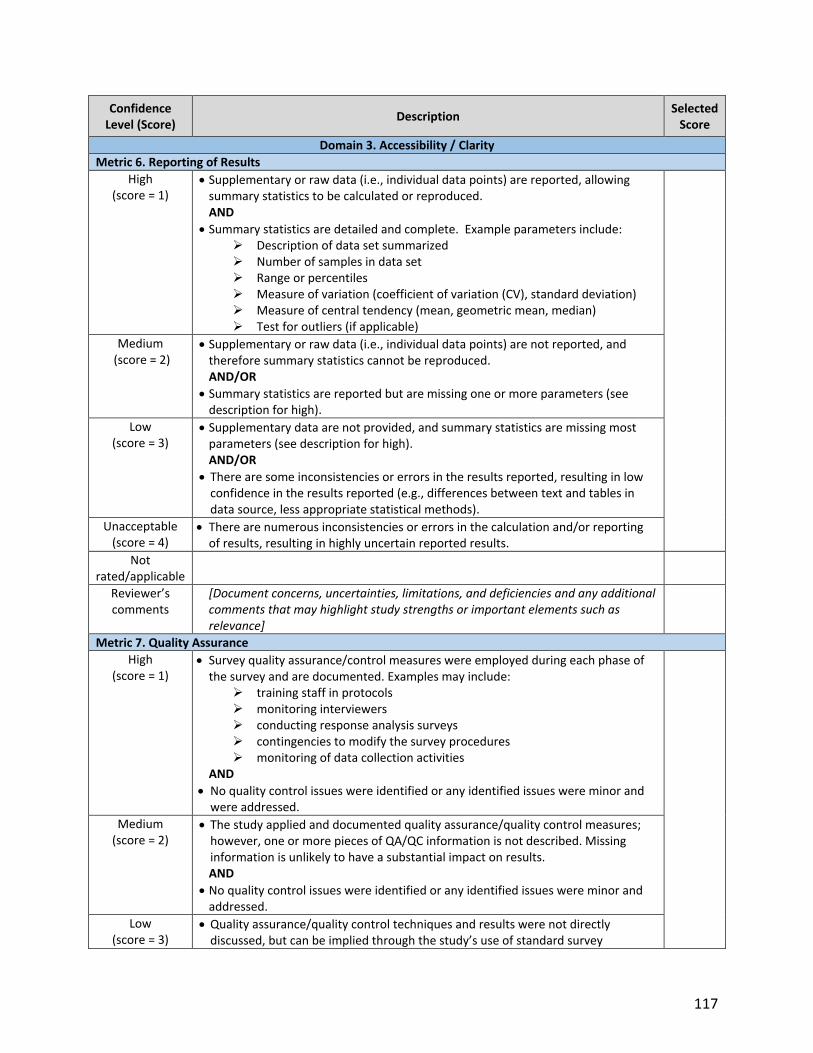
117
Confidence Level (Score)
Description Selected
Score
Domain 3. Accessibility / Clarity
Metric 6. Reporting of Results
High (score = 1)
Supplementary or raw data (i.e., individual data points) are reported, allowing summary statistics to be calculated or reproduced. AND
Summary statistics are detailed and complete. Example parameters include: Description of data set summarized Number of samples in data set Range or percentiles Measure of variation (coefficient of variation (CV), standard deviation) Measure of central tendency (mean, geometric mean, median) Test for outliers (if applicable)
Medium (score = 2)
Supplementary or raw data (i.e., individual data points) are not reported, and therefore summary statistics cannot be reproduced. AND/OR
Summary statistics are reported but are missing one or more parameters (see description for high).
Low (score = 3)
Supplementary data are not provided, and summary statistics are missing most parameters (see description for high). AND/OR
There are some inconsistencies or errors in the results reported, resulting in low confidence in the results reported (e.g., differences between text and tables in data source, less appropriate statistical methods).
Unacceptable (score = 4)
There are numerous inconsistencies or errors in the calculation and/or reporting of results, resulting in highly uncertain reported results.
Not rated/applicable
Reviewer’s comments
[Document concerns, uncertainties, limitations, and deficiencies and any additional comments that may highlight study strengths or important elements such as relevance]
Metric 7. Quality Assurance
High (score = 1)
Survey quality assurance/control measures were employed during each phase of the survey and are documented. Examples may include:
training staff in protocols monitoring interviewers conducting response analysis surveys contingencies to modify the survey procedures monitoring of data collection activities
AND
No quality control issues were identified or any identified issues were minor and were addressed.
Medium (score = 2)
The study applied and documented quality assurance/quality control measures; however, one or more pieces of QA/QC information is not described. Missing information is unlikely to have a substantial impact on results. AND
No quality control issues were identified or any identified issues were minor and addressed.
Low (score = 3)
Quality assurance/quality control techniques and results were not directly discussed, but can be implied through the study’s use of standard survey
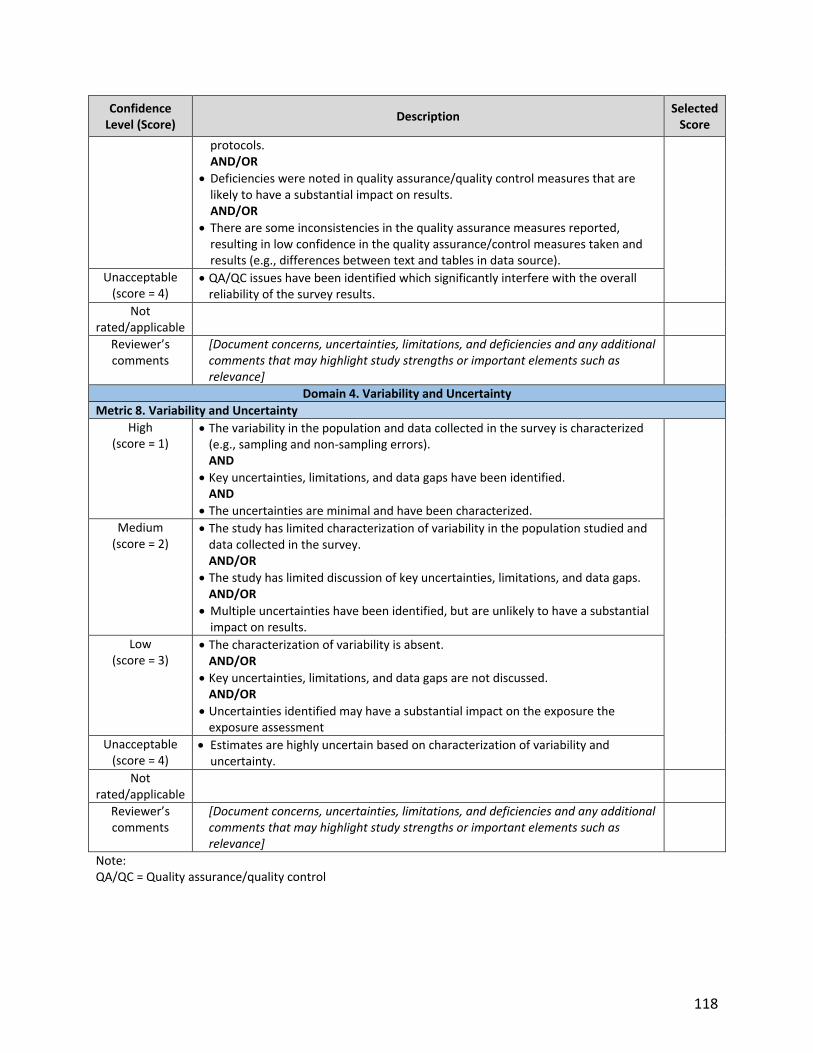
118
Confidence Level (Score)
Description Selected
Score
protocols. AND/OR
Deficiencies were noted in quality assurance/quality control measures that are likely to have a substantial impact on results. AND/OR
There are some inconsistencies in the quality assurance measures reported, resulting in low confidence in the quality assurance/control measures taken and results (e.g., differences between text and tables in data source).
Unacceptable (score = 4)
QA/QC issues have been identified which significantly interfere with the overall reliability of the survey results.
Not rated/applicable
Reviewer’s comments
[Document concerns, uncertainties, limitations, and deficiencies and any additional comments that may highlight study strengths or important elements such as relevance]
Domain 4. Variability and Uncertainty
Metric 8. Variability and Uncertainty
High (score = 1)
The variability in the population and data collected in the survey is characterized (e.g., sampling and non-sampling errors). AND
Key uncertainties, limitations, and data gaps have been identified. AND
The uncertainties are minimal and have been characterized.
Medium (score = 2)
The study has limited characterization of variability in the population studied and data collected in the survey. AND/OR
The study has limited discussion of key uncertainties, limitations, and data gaps. AND/OR
Multiple uncertainties have been identified, but are unlikely to have a substantial impact on results.
Low (score = 3)
The characterization of variability is absent. AND/OR
Key uncertainties, limitations, and data gaps are not discussed. AND/OR
Uncertainties identified may have a substantial impact on the exposure the exposure assessment
Unacceptable (score = 4)
Estimates are highly uncertain based on characterization of variability and uncertainty.
Not rated/applicable
Reviewer’s comments
[Document concerns, uncertainties, limitations, and deficiencies and any additional comments that may highlight study strengths or important elements such as relevance]
Note: QA/QC = Quality assurance/quality control

119
E.6.4 Epidemiology Data to Support Exposure Assessment
Table E-12. Serious Flaws that Would Make Sources of Epidemiology Data Unacceptable for Use in the Exposure Assessment
EPA will not use data/information from data sources that exhibit serious flaws as described in Table E-12. Optimization of the list of serious flaws may occur after pilot calibration exercises.
Domain Metric Description of Serious Flaw(s) in Data Source
Reliability
(All Study Types)
Measurement or
Exposure
Characterization
Exposure misclassification (e.g., differential recall of self-reported
exposure) is present, but no attempt is made to address it.
Reporting Bias This metric does not have an unacceptable criterion.
Reliability
(Applicable to Study
Types with Direct
Exposure
Measurements
Only)
Exposure Variability
and
Misclassification
Exposure based on a single sample and error is known to be so large
that the results are too uncertain to be useful.
Sample
Contamination
There are known contamination issues and the issues were not
addressed.
Method
Requirements The method used is known to produce unreliable or invalid results.
Matrix Adjustment This metric does not have an unacceptable criterion.
Method Sensitivity This metric does not have an unacceptable criterion.
Stability This metric does not have an unacceptable criterion.
Reliability
(Applicable to Study
Types with
Biomarker
Measurements
Only)
Use of Biomarker of
Exposure This metric does not have an unacceptable criterion.
Representativeness
Relevance This metric does not have an unacceptable criterion.
Geographic Area Geographic location is not reported, discussed, or referenced.
Participant
Selection This metric does not have an unacceptable criterion.
Attrition
For cohort studies: The loss of subjects (i.e., incomplete exposure
data) was both large and unacceptably handled (as described in the
low confidence category).
For case-control and cross-sectional studies: The exclusion of
subjects from analyses was both large and unacceptably handled (as
described in the low confidence category).
Comparison Group Subjects in all groups were not similar, recruited within very different
time frames, or had very different participation/ response rates.
Accessibility/
Clarity Documentation
There are numerous inconsistencies or errors in the calculation
and/or reporting of information and results, resulting in highly

120
Domain Metric Description of Serious Flaw(s) in Data Source
uncertain reported results.
QA/QC
QA/QC issues have been identified which significantly interfere with
the overall reliability of the study, and are not addressed.
Variability and
Uncertainty
Variability This metric does not have an unacceptable criterion.
Uncertainties This metric does not have an unacceptable criterion.
Table E-13. Evaluation Criteria for Sources of Epidemiology Data to Support the Exposure
Assessment
Confidence Level (Score)
Metric Description Selected
Score
Domain 1. Reliability
Metrics 1-2 = Applicable to All Study Types
Metric 1. Measurement or Exposure Characterization
High (score = 1)
Exposure was consistently assessed (i.e., under the same method and time-frame across cases, controls or the entire cohort) using well-established methods that directly measure exposure (e.g., measurement of the chemical in air or measurement of the chemical in blood, plasma, urine, etc.). OR
Exposure was consistently assessed using less-established methods that directly measure exposure and are validated against well-established methods.
Medium (score = 2)
Exposure was assessed using indirect measures (e.g., questionnaire or occupational exposure assessment by a certified industrial hygienist) that have been validated or empirically shown to be consistent with methods that directly measure exposure (i.e., inter-methods validation: one method vs. another)
Low (score = 3)
Exposure was assessed using direct or indirect measures that have not been validated or have poor validity. OR
If using indirect methods, they have not empirically shown to be consistent with methods that directly measure exposure (e.g., a job-exposure matrix or self-report without validation). OR
There is insufficient information provided about the exposure assessment, including validity and reliability, but no evidence for concern about the method used.
Unacceptable (score = 4)
Exposure misclassification (e.g., differential recall of self-reported exposure) is present and likely to impact results, but no attempt is made to address it.
Not rated/applicable
Reviewer’s Comments: [Document concerns, uncertainties, limitations, and deficiencies and any additional comments that may highlight study strengths or important elements such as relevance]
Metric 2. Reporting Bias
High (score = 1)
All of the study’s measured exposures outlined in the protocol, methods, abstract, and/or introduction (that are relevant for the evaluation) are reported.
Medium (score = 2)
Not applicable. This metric is dichotomous (i.e., high versus low)
Low All of the study’s measured exposures outlined in the protocol, methods,

121
Confidence Level (Score)
Metric Description Selected
Score
(score = 3) abstract, and/or introduction (that are relevant for the evaluation) have not been reported.
Unacceptable (score = 4)
Not applicable. This metric is dichotomous (i.e., high versus low).
Not rated/applicable
Reviewer’s Comments: [Document concerns, uncertainties, limitations, and deficiencies and any additional comments that may highlight study strengths or important elements such as relevance]
Metrics 3-8 = Applicable Only to Study Types with Direct Exposure Measurements (i.e., Measurement of Chemical in Specific Media or Biomarker Measurement)
Metric 3. Exposure Variability and Misclassification
High (score = 1)
There are a sufficient number of samples per individual to estimate exposure over the appropriate duration, or through the use of adequate long-term sampling data. A “sufficient” number is dependent upon the chemical and the research question.
AND
Error is considered by calculating measures of accuracy (e.g., sensitivity and specificity) and reliability (e.g., intra-class correlation coefficient (ICC)).
Medium (score = 2)
One sample is used per individual, and there is stated evidence that errors from a single measurement are negligible.
Low (score = 3)
More than one sample collected per individual, but without evaluation of error. OR
Exposure based on a single sample without consideration or recognition of error
Unacceptable (score = 4)
Exposure based on a single sample and error is known to be so large that the results are too uncertain to be useful.
Not rated/applicable
Reviewer’s Comments: [Document concerns, uncertainties, limitations, and deficiencies and any additional comments that may highlight study strengths or important elements such as relevance]
Metric 4. Sample Contamination
High (score = 1)
Samples are contamination-free from the time of collection to the time of measurement (e.g., by use of certified analyte free collection supplies and reference materials, and appropriate use of blanks both in the field and lab). AND
Documentation of the steps taken to provide the necessary assurance that the study data are reliable is included.
Medium (score = 2)
Samples are stated to be contamination-free from the time of collection to the time of measurement.
AND
There is incomplete documentation of the steps taken to provide the necessary assurance that the study data are reliable.
Low (score = 3)
Samples are known to have contamination issues, but steps have been taken to address and correct contamination issues.
OR
Samples are stated to be contamination-free from the time of collection to the time of measurement, but there is no use or documentation of the steps taken to provide the necessary assurance that the study data are reliable.

122
Confidence Level (Score)
Metric Description Selected
Score
Unacceptable (score = 4)
There are known contamination issues and the issues were not addressed.
Not rated/applicable
Reviewer’s Comments: [Document concerns, uncertainties, limitations, and deficiencies and any additional comments that may highlight study strengths or important elements such as relevance]
Metric 5. Method Requirements
High (score = 1)
Study uses instrumentation that provides unambiguous identification and quantitation of the biomarker or chemical in media at the required sensitivity (e.g., gas chromatography-high-resolution mass spectrometry (GC-HRMS), gas chromatography-tandem mass spectrometry (GC-MS/MS), liquid chromatography-tandem mass spectrometry (LC-MS/MS)).
Medium (score = 2)
Study uses instrumentation that allows for identification of the biomarker or chemical in media with confidence and the required sensitivity (e.g., gas chromatography-mass spectrometry (GC-MS), gas chromatography-electron capture detector (GC-ECD)).
Low (score = 3)
Study uses instrumentation that only allows for possible quantification of the biomarker or chemical in media but the method has known interferants (e.g., gas chromatography-flame ionization detector (GC-FID)). OR
• Study uses a semi-quantitative method to assess the biomarker or chemical in media (e.g., fluorescence).
Unacceptable (score = 4)
The method used is known to produce unreliable or invalid results.
Not rated/applicable
Reviewer’s Comments: [Document concerns, uncertainties, limitations, and deficiencies and any additional comments that may highlight study strengths or important elements such as relevance]
Metric 6. Matrix Adjustment
High (score = 1)
If applicable for the biomarker under consideration, study provides results, either in the main publication or as a supplement, for adjusted and unadjusted matrix concentrations (e.g., creatinine-adjusted or SG-adjusted and non-adjusted urine concentrations) and reasons are given for adjustment approach.
Medium (score = 2)
If adjustments are needed, study only provides results using one method (matrix adjusted or not).
Low (score = 3)
If applicable for the biomarker under consideration, no established method for matrix adjustment was conducted.
Unacceptable (score = 4)
Not applicable. A study will not be deemed unacceptable based on matrix adjustment.
Not rated/applicable
Reviewer’s Comments: [Document concerns, uncertainties, limitations, and deficiencies and any additional comments that may highlight study strengths or important elements such as relevance]

123
Confidence Level (Score)
Metric Description Selected
Score
Metric 7. Method Sensitivity
High (score = 1)
Limits of detection/quantification are reported and low enough to detect chemicals in a sufficient percentage of the samples to address the research questions (e.g., 50-60% detectable values if the research hypothesis requires estimates of both central tendencies and upper tails of the population concentrations). OR
All samples are above the LOD/LOQ.
Medium (score = 2)
Not applicable. This metric is dichotomous (i.e., high versus low).
Low (score = 3)
Frequency of detection too low to address the research question OR
There are samples below the LOD/LOQ, and LOD/LOQ are not stated.
Unacceptable (score = 4)
Not applicable. This metric is dichotomous (i.e., high versus low).
Not rated/applicable
Reviewer’s Comments: [Document concerns, uncertainties, limitations, and deficiencies and any additional comments that may highlight study strengths or important elements such as relevance]
Metric 8. Stability
High (score = 1)
Samples with a known history and documented stability data or those using real-time measurements.
Medium (score = 2)
Samples have known losses during storage but the difference between low and high exposures can be qualitatively assessed.
Low (score = 3)
Samples with either unknown history and/or no stability data for analytes of interest.
Unacceptable (score = 4)
Not applicable. A study will not be deemed unacceptable based on stability.
Not rated/applicable
Reviewer’s Comments: [Document concerns, uncertainties, limitations, and deficiencies and any additional comments that may highlight study strengths or important elements such as relevance]
Metric 9 = Only Applicable to Studies with Biomarker Measurements
Metric 9. Use of Biomarker of Exposure
High (score = 1)
Biomarker in a specified matrix is known to have an accurate and precise quantitative relationship with external exposure, internal dose, or target dose (e.g., previous studies (or the current study) have indicated the biomarker of interest reflects external exposures).
AND
Biomarker (parent chemical or metabolite) is derived from exposure to the chemical of interest.
Medium (score = 2)
Biomarker in a specified matrix has accurate and precise quantitative relationship with external exposure, internal dose, or target dose.
AND
Biomarker is derived from multiple parent chemicals, not only the chemical of interest, but there is a stated method to apportion the estimate to only the chemical of interest.
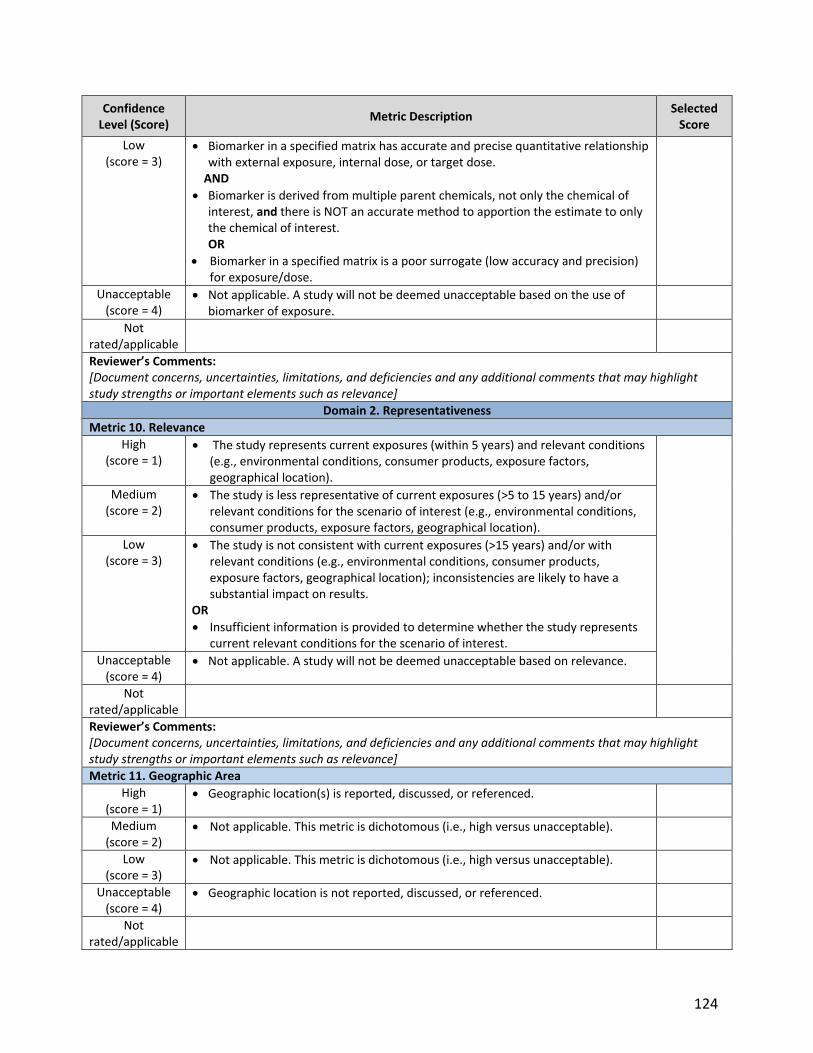
124
Confidence Level (Score)
Metric Description Selected
Score
Low (score = 3)
Biomarker in a specified matrix has accurate and precise quantitative relationship with external exposure, internal dose, or target dose.
AND
Biomarker is derived from multiple parent chemicals, not only the chemical of interest, and there is NOT an accurate method to apportion the estimate to only the chemical of interest. OR
Biomarker in a specified matrix is a poor surrogate (low accuracy and precision) for exposure/dose.
Unacceptable (score = 4)
Not applicable. A study will not be deemed unacceptable based on the use of biomarker of exposure.
Not rated/applicable
Reviewer’s Comments: [Document concerns, uncertainties, limitations, and deficiencies and any additional comments that may highlight study strengths or important elements such as relevance]
Domain 2. Representativeness
Metric 10. Relevance
High (score = 1)
The study represents current exposures (within 5 years) and relevant conditions (e.g., environmental conditions, consumer products, exposure factors, geographical location).
Medium (score = 2)
The study is less representative of current exposures (>5 to 15 years) and/or relevant conditions for the scenario of interest (e.g., environmental conditions, consumer products, exposure factors, geographical location).
Low (score = 3)
The study is not consistent with current exposures (>15 years) and/or with relevant conditions (e.g., environmental conditions, consumer products, exposure factors, geographical location); inconsistencies are likely to have a substantial impact on results.
OR
Insufficient information is provided to determine whether the study represents current relevant conditions for the scenario of interest.
Unacceptable (score = 4)
Not applicable. A study will not be deemed unacceptable based on relevance.
Not rated/applicable
Reviewer’s Comments: [Document concerns, uncertainties, limitations, and deficiencies and any additional comments that may highlight study strengths or important elements such as relevance]
Metric 11. Geographic Area
High (score = 1)
Geographic location(s) is reported, discussed, or referenced.
Medium (score = 2)
Not applicable. This metric is dichotomous (i.e., high versus unacceptable).
Low (score = 3)
Not applicable. This metric is dichotomous (i.e., high versus unacceptable).
Unacceptable (score = 4)
Geographic location is not reported, discussed, or referenced.
Not rated/applicable

125
Confidence Level (Score)
Metric Description Selected
Score
Reviewer’s Comments: [Document concerns, uncertainties, limitations, and deficiencies and any additional comments that may highlight study strengths or important elements such as relevance]
Metric 12. Participant Selection
High (score = 1)
The participants selected are representative of the larger population from which they were sampled. OR
Approaches (e.g., survey weights, inverse probability weighting) were applied to ensure representativeness.
Medium (score = 2)
Not applicable. This metric is dichotomous (i.e., high versus low).
Low (score = 3)
The participants selected do not appear to be representative of the larger population from which they were sampled. OR
There is insufficient information to determine whether participants selected are representative of the population from which they were sampled.
Unacceptable (score = 4)
Not applicable. This metric is dichotomous (i.e., high versus low).
Not rated/applicable
Reviewer’s Comments: [Document concerns, uncertainties, limitations, and deficiencies and any additional comments that may highlight study strengths or important elements such as relevance]
Metric 13. Attrition
High (score = 1)
For cohort studies: There was minimal subject attrition during the study (or exclusion from the analysis sample) and exposure data were largely complete. OR
Any loss of subjects (i.e., incomplete exposure data) was adequately* addressed (as described above) and reasons were documented when human subjects were removed from a study. OR
Missing data have been imputed using appropriate methods (e.g., random regression imputation), and characteristics of subjects lost to follow up or with unavailable records are described in identical way and are not significantly different from those of the study participants.
For case-control studies and cross-sectional studies: There was minimal subject withdrawal from the study (or exclusion from the analysis sample) and exposure data were largely complete.
OR
Any exclusion of subjects from analyses was adequately* addressed (as described above), and reasons were documented when subjects were removed from the study or excluded from analyses.
*NOTE for all study types: Adequate handling of subject attrition includes: very little missing exposure data; missing exposure data balanced in numbers across study groups, with similar reasons for missing data across groups.

126
Confidence Level (Score)
Metric Description Selected
Score
Medium (score = 2)
For cohort studies: There was moderate subject attrition during the study (or exclusion from the analysis sample). AND
Any loss or exclusion of subjects was adequately addressed (as described in the acceptable handling of subject attrition in the high confidence category) and reasons were documented when human subjects were removed from a study.
For case-control studies and cross-sectional studies: There was moderate subject withdrawal from the study (or exclusion from the analysis sample), but exposure data were largely complete.
AND
Any exclusion of subjects from analyses was adequately addressed (as described above), and reasons were documented when subjects were removed from the study or excluded from analyses.
Low (score = 3)
For cohort studies: There was large subject attrition during the study (or exclusion from the analysis sample), but it was adequately addressed (i.e., missing exposure data was balanced in numbers across groups and reasons for missing data were similar across groups). OR
Subject attrition was not large but it was inadequately addressed. Inadequate handling of subject attrition: reason for missing exposure data likely to be related to true exposure, with either imbalance in numbers or reasons for missing data across study groups; or potentially inappropriate application of imputation. OR
Numbers of individuals were not reported at each stage of study (e.g., numbers potentially eligible, examined for eligibility, confirmed eligible, included in the study or analysis sample, completing follow-up, and analyzed). Reasons were not provided for non-participation at each stage.
For case-control and cross-sectional studies: There was large subject withdrawal from the study (or exclusion from the analysis sample), but it was adequately addressed (i.e., missing exposure data was balanced in numbers across groups and reasons for missing data were similar across groups).
OR
Subject attrition was not large but it was inadequately addressed. Inadequate handling of subject attrition: reason for missing exposure data likely to be related to true exposure, with either imbalance in numbers or reasons for missing data across study groups; or potentially inappropriate application of imputation.
OR Numbers of individuals were not reported at each stage of study (e.g., numbers potentially eligible, examined for eligibility, confirmed eligible, included in the study or analysis sample, and analyzed). Reasons were not provided for non-participation at each stage.
Unacceptable (score = 4)
For cohort studies: The loss of subjects (i.e., incomplete exposure data) was both large and unacceptably handled (as described above in the low confidence category).
For case-control and cross-sectional studies: The exclusion of subjects from analyses was both large and unacceptably handled (as described above in the low confidence category).
Not rated/applicable

127
Confidence Level (Score)
Metric Description Selected
Score
Reviewer’s Comments: [Document concerns, uncertainties, limitations, and deficiencies and any additional comments that may highlight study strengths or important elements such as relevance]
Metric 14 = Only Applicable to Studies that Compare Exposure in Different Groups
Metric 14. Comparison Group
High (1) Key elements of the study design are reported (i.e., setting, inclusion and exclusion criteria, and methods of participant selection), and indicate that subjects (in all groups) were similar (e.g., recruited with the same method of ascertainment and within the same time frame using the same inclusion and exclusion criteria, and were of similar age and health status)
OR
Baseline characteristics of groups differed but these differences were considered as potential confounding or stratification variables, and were thereby controlled by statistical analysis.
Medium (2) There is indirect evidence (i.e., stated by the authors without providing a description of methods) that subjects (in all groups) were similar (as described above for the high confidence rating). AND
Baseline characteristics for subjects (in all groups) reported in the study were similar.
Low (3) There is indirect evidence (i.e., stated by the authors without providing a description of methods) that subjects (in all groups) were similar (as described above for the high confidence rating). AND
Baseline characteristics for subjects (in all groups) were not reported.
Unacceptable (4)
Subjects in all groups were not similar, recruited within very different time frames, or had very different participation/ response rates.
Not rated/applicable
Reviewer’s Comments: [Document concerns, uncertainties, limitations, and deficiencies and any additional comments that may highlight study strengths or important elements such as relevance]
Domain 3. Accessibility / Clarity
Metric 15. Documentation
High (score = 1)
Study clearly states aims, methods, assumptions and limitations. AND
Study clearly states the time frame over which exposures were estimated and what the exposure level represents (e.g., spot measurement, peak, or average over a specified time frame). AND
Discussion of sample collection requirements, relevant participant characteristics, and matrix treatment is provided. AND
Supplementary data is included, allowing summary statistics to be reproduced.
Medium (score = 2)
Study clearly states aims, methods, assumptions and limitations. AND
Study clearly states the time frame over which exposures were estimated and what the exposure level represents (e.g., spot measurement, peak, or average over a specified time frame).

128
Confidence Level (Score)
Metric Description Selected
Score
AND
Discussion of sample collection requirements, relevant participant characteristics, and matrix treatment is provided.
AND
Supplementary data is not included; summary statistics cannot be reproduced.
Low (score = 3)
Aims, methods, assumptions and limitations are not clear or not completely reported. OR
The time frame over which exposures were estimated and/or what the exposure level represents (e.g., peak, average over a specified time frame) are not clear (e.g., spot measurement, peak, average over a specified time frame).
OR
Discussion of sample collection requirements, relevant participant characteristics, and matrix treatment is not provided.
Unacceptable (score = 4)
There are numerous inconsistencies or errors in the calculation and/or reporting of information and results, resulting in highly uncertain reported results.
Not rated/applicable
Reviewer’s Comments: [Document concerns, uncertainties, limitations, and deficiencies and any additional comments that may highlight study strengths or important elements such as relevance]
Metric 16. Quality Assurance/Quality Control
High (score = 1)
The study applied quality assurance/quality control measures and all pertinent quality assurance information is provided in the data source or companion source. Examples include:
Field, laboratory, and/or storage recoveries Field and laboratory control samples Baseline (pre-exposure) samples Biomarker stability Completeness of sample (i.e., creatinine, specific gravity, osmolality for
urine samples) AND
No quality control issues were identified or, if they were identified, were appropriately addressed (i.e., correction for low recoveries, correction for completeness).
Medium (score = 2)
It is stated that quality assurance/quality control measures were used, but no details were provided. AND
No quality control issues were identified or any identified issues were minor and addressed (i.e., correction for low recoveries, correction for completeness).
Low (score = 3)
Information on quality assurance/quality control was absent. OR
Quality assurance/quality control measures were applied and documented; however, minor quality control issues have been identified but not addressed, or there may be some reporting inconsistencies.
Unacceptable (score = 4)
QA/QC issues have been identified which significantly interfere with the overall reliability of the study, and are not addressed.
Not rated/applicable

129
Confidence Level (Score)
Metric Description Selected
Score
Reviewer’s Comments: [Document concerns, uncertainties, limitations, and deficiencies and any additional comments that may highlight study strengths or important elements such as relevance]
Domain 4. Variability and Uncertainty
Metric 17. Variability
High (score = 1)
Study summarizes mean and variation in exposure levels for one or more groups. AND
Study presents discussion of sources of variability.
Medium (score = 2)
Not applicable. This metric is dichotomous (i.e., high versus low).
Low (score = 3)
Study does not summarize mean and variation in exposure levels for any groups. AND/OR
Study does not present discussion of sources of variability.
Unacceptable (score = 4)
Not applicable. This metric is dichotomous (i.e., high versus low).
Not rated/applicable
Reviewer’s Comments: [Document concerns, uncertainties, limitations, and deficiencies and any additional comments that may highlight study strengths or important elements such as relevance]
Metric 18. Uncertainties
High (score = 1)
Key uncertainties, limitations, and data gaps are recognized and discussed (e.g., those related to inherent variability in environmental and exposure-related parameters or possible measurement errors).
AND
The uncertainties are minimal.
Medium (score = 2)
Not applicable. This metric is dichotomous (i.e., high versus low).
Low (score = 3)
Key uncertainties, limitations, or data gaps are not recognized or discussed. AND/OR
Estimates are highly uncertain.
Unacceptable (score = 4)
Not applicable. This metric is dichotomous (i.e., high versus low).
Not rated/applicable
Reviewer’s Comments: [Document concerns, uncertainties, limitations, and deficiencies and any additional comments that may highlight study strengths or important elements such as relevance]

130
E.6.5 Experimental Data
Table E-14. Serious Flaws that Would Make Sources of Experimental Data Unacceptable for Use in the Exposure Assessment
Optimization of the list of serious flaws may occur after pilot calibration exercises.
Domain Metric Description of Serious Flaw(s) in Data Source
Reliability
Sampling Methodology
and Conditions
The sampling methodology is not discussed in the data source or companion source.
Sampling methodology is not scientifically sound or is not consistent with widely accepted methods/approaches for the chemical and media being analyzed (e.g., inappropriate sampling equipment, improper storage conditions).
There are numerous inconsistencies in the reporting of sampling information, resulting in high uncertainty in the sampling methods used.
Analytical Methodology
Analytical methodology is not described, including analytical instrumentation (i.e., HPLC, GC).
Analytical methodology is not scientifically appropriate for the chemical and media being analyzed (e.g., method not sensitive enough, not specific to the chemical, out of date).
There are numerous inconsistencies in the reporting of analytical information, resulting in high uncertainty in the analytical methods used.
Selection of Biomarker of
Exposure
Biomarker in a specified matrix is a poor surrogate (low accuracy and precision) for exposure/dose.
Representative
Testing Scenario Testing conditions are not relevant to the exposure scenario of interest for the chemical.
Sample Size and Variability
Sample size is not reported.
Single sample collected per data set.
For biomonitoring studies, the timing of sample collected is not appropriate based on chemical properties (e.g., half-life), the pharmacokinetics of the chemical (e.g., rate of uptake and elimination), and when the exposure event occurred.
Temporality Temporality of tested items is not reported, discussed, or referenced.
Accessibility / Clarity
Reporting of Results
There are numerous inconsistencies or errors in the calculation and/or reporting of results, resulting in highly uncertain reported results.
Quality Assurance
QA/QC issues have been identified which significantly interfere with the overall reliability of the study.
Variability and Uncertainty
Variability and Uncertainty
Estimates are highly uncertain based on characterization of variability and uncertainty.
Notes: GC = Gas chromatography HPLC = High pressure liquid chromatography QA/QC = Quality assurance/quality control

131
Table E-15. Evaluation Criteria for Sources of Experimental Data
Confidence Level (Score)
Metric Description Selected
Score
Domain 1. Reliability
Metric 1. Sampling Methodology and Conditions
High (score = 1)
Samples were collected according to publicly available SOPs, methods, protocols, or test guidelines that are scientifically sound and widely accepted from a source generally known to use sound methods and/or approaches such as EPA, NIST, ASTM, ISO, and ACGIH. OR
The sampling protocol used was not a publicly available SOP from a source generally known to use sound methods and/or approaches, but the sampling methodology is clear, appropriate (i.e., scientifically sound), and similar to widely accepted protocols for the chemical and media of interest. All pertinent sampling information is provided in the data source or companion source. Examples include: sampling conditions (e.g., temperature, humidity) sampling equipment and procedures sample storage conditions/duration performance/calibration of sampler
Medium (score = 2)
Sampling methodology is discussed in the data source or companion source and is generally appropriate (i.e., scientifically sound) for the chemical and media of interest, however, one or more pieces of sampling information is not described. The missing information is unlikely to have a substantial impact on results. OR
Standards, methods, protocols, or test guidelines may not be widely accepted, but a successful validation study for the new/unconventional procedure was conducted prior to the sampling event and is consistent with sound scientific theory and/or accepted approaches.
Low (score = 3)
Sampling methodology is only briefly discussed, therefore, most sampling information is missing and likely to have a substantial impact on results. AND/OR
The sampling methodology does not represent best sampling methods, protocols, or guidelines for the chemical and media of interest (e.g., outdated (but still valid) sampling equipment or procedures, long storage durations). AND/OR
There are some inconsistencies in the reporting of sampling information (e.g., differences between text and tables in data source, differences between standard method and actual procedures reported to have been used, etc.) which lead to a low confidence in the sampling methodology used.
Unacceptable (score = 4)
The sampling methodology is not discussed in the data source or companion source. AND/OR
Sampling methodology is not scientifically sound or is not consistent with widely accepted methods/approaches for the chemical and media being analyzed (e.g., inappropriate sampling equipment, improper storage conditions). AND/OR There are numerous inconsistencies in the reporting of sampling information, resulting in high uncertainty in the sampling methods used.
Not rated/applicable

132
Confidence Level (Score)
Metric Description Selected
Score
Reviewer’s comments
[Document concerns, uncertainties, limitations, and deficiencies and any additional comments that may highlight study strengths or important elements such as relevance]
Metric 2. Analytical Methodology
High (score = 1)
Samples were analyzed according to publically available analytical methods that are scientifically sound and widely accepted (i.e.,from a source generally using sound methods and/or approaches) and are appropriate for the chemical and media of interest. Examples include EPA SW-846 Methods, NIOSH Manual of Analytical Methods 5th Edition, etc. OR
The analytical method used was not a publically available method from a source generally known to use sound methods and/or approaches, but the methodology is clear and appropriate (i.e., scientifically sound) and similar to widely accepted protocols for the chemical and media of interest. All pertinent sampling information is provided in the data source or companion source. Examples include: extraction method analytical instrumentation (required) instrument calibration LOQ, LOD, detection limits, and/or reporting limits recovery samples biomarker used (if applicable) matrix-adjustment method (i.e., creatinine, lipid, moisture)
Medium (score = 2)
Analytical methodology is discussed in detail and is clear and appropriate (i.e., scientifically sound) for the chemical and media of interest; however, one or more pieces of analytical information is not described. The missing information is unlikely to have a substantial impact on results. AND/OR
The analytical method may not be standard/widely accepted, but a method validation study was conducted prior to sample analysis and is expected to be consistent with sound scientific theory and/or accepted approaches. AND/OR
Samples were collected at a site and immediately analyzed using an on-site mobile laboratory, rather than shipped to a stationary laboratory.
Low (score = 3)
Analytical methodology is only briefly discussed. Analytical instrumentation is provided and consistent with accepted analytical instrumentation/methods. However, most analytical information is missing and likely to have a substantial impact on results. AND/OR
Analytical method is not standard/widely accepted, and method validation is limited or not available. AND/OR
Samples were analyzed using field screening techniques. AND/OR
LOQ, LOD, detection limits, and/or reporting limits not reported. AND/OR
There are some inconsistencies or possible errors in the reporting of analytical information (e.g., differences between text and tables in data source, differences between standard method and actual procedures reported to have

133
Confidence Level (Score)
Metric Description Selected
Score
been used, etc.) which leads to a lower confidence in the method used.
Unacceptable (score = 4)
Analytical methodology is not described, including analytical instrumentation (i.e., HPLC, GC). AND/OR
Analytical methodology is not scientifically appropriate for the chemical and media being analyzed (e.g., method not sensitive enough, not specific to the chemical, out of date). AND/OR
There are numerous inconsistencies in the reporting of analytical information, resulting in high uncertainty in the analytical methods used.
Not rated/applicable
Reviewer’s comments
[Document concerns, uncertainties, limitations, and deficiencies and any additional comments that may highlight study strengths or important elements such as relevance]
Metric 3. Selection of Biomarker of Exposure
High (score = 1)
Biomarker in a specified matrix is known to have an accurate and precise quantitative relationship with external exposure, internal dose, or target dose (e.g., previous studies (or the current study) have indicated the biomarker of interest reflects external exposures). AND
Biomarker (parent chemical or metabolite) is derived from exposure to the chemical of interest.
Medium (score = 2)
Biomarker in a specified matrix has accurate and precise quantitative relationship with external exposure, internal dose, or target dose. AND
Biomarker is derived from multiple parent chemicals, not only the chemical of interest, but there is a stated method to apportion the estimate to only the chemical of interest
Low (score = 3)
Biomarker in a specified matrix has accurate and precise quantitative relationship with external exposure, internal dose, or target dose. AND
Biomarker is derived from multiple parent chemicals, not only the chemical of interest, and there is NOT a stated method to apportion the estimate to only the chemical of interest.
Unacceptable (score = 4)
Biomarker in a specified matrix is a poor surrogate (low accuracy and precision) for exposure/dose.
Not rated/applicable
Metric is not applicable to the data source.
Reviewer’s comments
[Document concerns, uncertainties, limitations, and deficiencies and any additional comments that may highlight study strengths or important elements such as relevance]
Domain 2. Representative
Metric 4. Testing Scenario
High (score = 1)
Testing conditions closely represent relevant exposure scenarios (i.e., population/scenario/media of interest). Examples include: amount and type of chemical / product used source of exposure/test substance

134
Confidence Level (Score)
Metric Description Selected
Score
method of application or by-stander exposure use of exposure controls microenvironment (location, time, climate, temperature, humidity,
pressure, airflow) AND
Testing conducted under a broad range of conditions for factors such as temperature, humidity, pressure, airflow, and chemical mass / weight fraction (if appropriate).
Medium (score = 2)
The data likely represent the relevant exposure scenario (i.e., population/scenario/media of interest). One or more key pieces of information may not be described but the deficiencies are unlikely to have a substantial impact on the characterization of the exposure scenario. AND/OR
If surrogate data, activities seem similar to the activities within scope.
Low (score = 3)
The data lack multiple key pieces of information and the deficiencies are likely to have a substantial impact on the characterization of the exposure scenario. AND/OR
There are some inconsistencies or possible errors in the reporting of scenario information (e.g., differences between text and tables in data source, differences between standard method and actual procedures reported to have been used, etc.) which leads to a lower confidence in the scenario assessed. AND/OR
If surrogate data, activities have lesser similarity but are still potentially applicable to the activities within scope. AND/OR
Testing conducted under a single set of conditions.
Unacceptable (score = 4)
Testing conditions are not relevant to the exposure scenario of interest for the chemical.
Not rated/applicable
Reviewer’s comments
[Document concerns, uncertainties, limitations, and deficiencies and any additional comments that may highlight study strengths or important elements such as relevance]
Metric 5. Sample Size and Variability
High (score = 1)
Sample size is reported and large enough (i.e., ≥ 10 samples) to be reasonably assured that the samples represent the scenario of interest. AND
Replicate tests performed and variability across tests is characterized (if appropriate).
Medium (score = 2)
Sample size is moderate (i.e., 5 to 10 samples), thus the data are likely to represent the scenario of interest. AND
Replicate tests performed and variability across tests is characterized (if appropriate).
Low (score = 3)
Sample size is small (i.e., <5 samples), thus the data are likely to poorly represent the scenario of interest. AND/OR
Replicate tests were not performed.
Unacceptable Sample size is not reported.
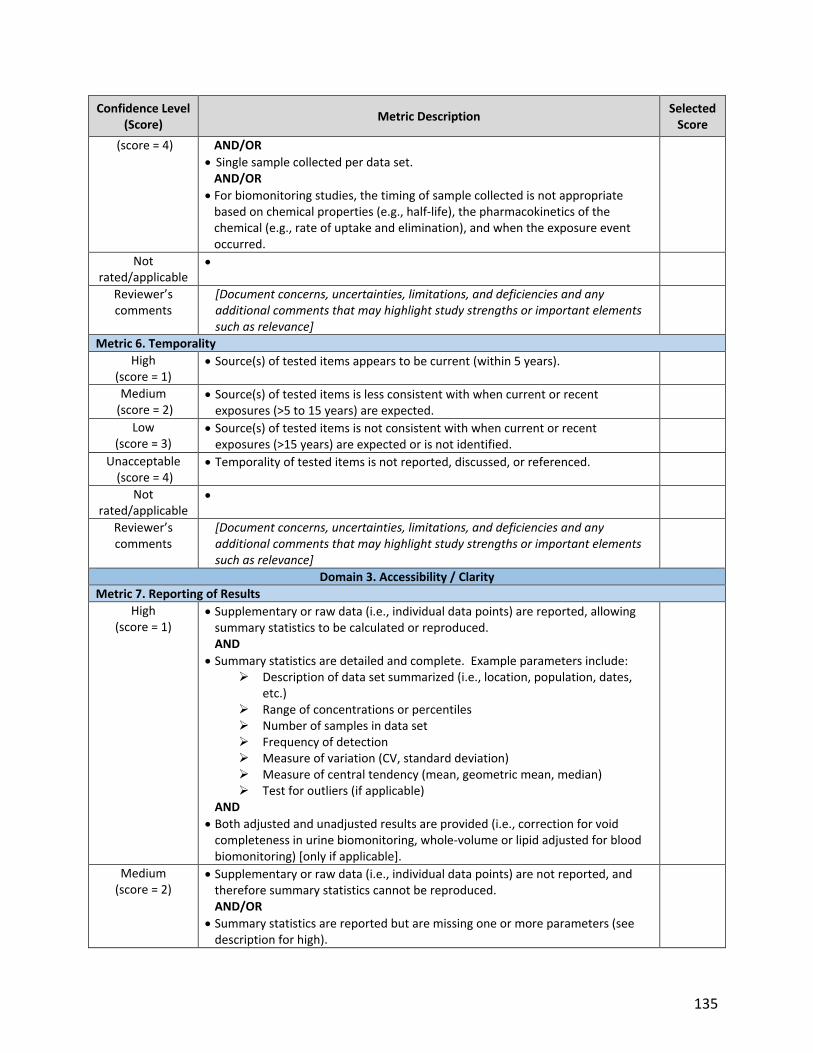
135
Confidence Level (Score)
Metric Description Selected
Score
(score = 4) AND/OR
Single sample collected per data set. AND/OR
For biomonitoring studies, the timing of sample collected is not appropriate based on chemical properties (e.g., half-life), the pharmacokinetics of the chemical (e.g., rate of uptake and elimination), and when the exposure event occurred.
Not rated/applicable
Reviewer’s comments
[Document concerns, uncertainties, limitations, and deficiencies and any additional comments that may highlight study strengths or important elements such as relevance]
Metric 6. Temporality
High (score = 1)
Source(s) of tested items appears to be current (within 5 years).
Medium (score = 2)
Source(s) of tested items is less consistent with when current or recent exposures (>5 to 15 years) are expected.
Low (score = 3)
Source(s) of tested items is not consistent with when current or recent exposures (>15 years) are expected or is not identified.
Unacceptable (score = 4)
Temporality of tested items is not reported, discussed, or referenced.
Not rated/applicable
Reviewer’s comments
[Document concerns, uncertainties, limitations, and deficiencies and any additional comments that may highlight study strengths or important elements such as relevance]
Domain 3. Accessibility / Clarity
Metric 7. Reporting of Results
High (score = 1)
Supplementary or raw data (i.e., individual data points) are reported, allowing summary statistics to be calculated or reproduced. AND
Summary statistics are detailed and complete. Example parameters include: Description of data set summarized (i.e., location, population, dates,
etc.) Range of concentrations or percentiles Number of samples in data set Frequency of detection Measure of variation (CV, standard deviation) Measure of central tendency (mean, geometric mean, median) Test for outliers (if applicable)
AND
Both adjusted and unadjusted results are provided (i.e., correction for void completeness in urine biomonitoring, whole-volume or lipid adjusted for blood biomonitoring) [only if applicable].
Medium (score = 2)
Supplementary or raw data (i.e., individual data points) are not reported, and therefore summary statistics cannot be reproduced. AND/OR
Summary statistics are reported but are missing one or more parameters (see description for high).

136
Confidence Level (Score)
Metric Description Selected
Score
AND/OR
Only adjusted or unadjusted results are provided, but not both [only if applicable].
Low (score = 3)
Supplementary data are not provided, and summary statistics are missing most parameters (see description for high). AND/OR
There are some inconsistencies or errors in the results reported, resulting in low confidence in the results reported (e.g., differences between text and tables in data source, less appropriate statistical methods).
Unacceptable (score = 4)
There are numerous inconsistencies or errors in the calculation and/or reporting of results, resulting in highly uncertain reported results.
Not rated/applicable
Reviewer’s comments
[Document concerns, uncertainties, limitations, and deficiencies and any additional comments that may highlight study strengths or important elements such as relevance]
Metric 8. Quality Assurance
High (score = 1)
The study applied quality assurance/quality control measures and all pertinent quality assurance information is provided in the data source or companion source. Examples include:
Laboratory, and/or storage recoveries. Laboratory control samples. Baseline (pre-exposure) samples. Biomarker stability Completeness of sample (i.e., creatinine, specific gravity, osmolality for
urine samples) AND
No quality control issues were identified or any identified issues were minor and adequately addressed (i.e., correction for low recoveries, correction for completeness).
Medium (score = 2)
The study applied and documented quality assurance/quality control measures; however, one or more pieces of QA/QC information is not described. Missing information is unlikely to have a substantial impact on results. AND
No quality control issues were identified or any identified issues were minor and addressed (i.e., correction for low recoveries, correction for completeness).
Low (score = 3)
Quality assurance/quality control techniques and results were not directly discussed, but can be implied through the study’s use of standard field and laboratory protocols. AND/OR
Deficiencies were noted in quality assurance/quality control measures that are likely to have a substantial impact on results. AND/OR
There are some inconsistencies in the quality assurance measures reported, resulting in low confidence in the quality assurance/control measures taken and results (e.g., differences between text and tables in data source).
Unacceptable (score = 4)
QA/QC issues have been identified which significantly interfere with the overall reliability of the study.
Not
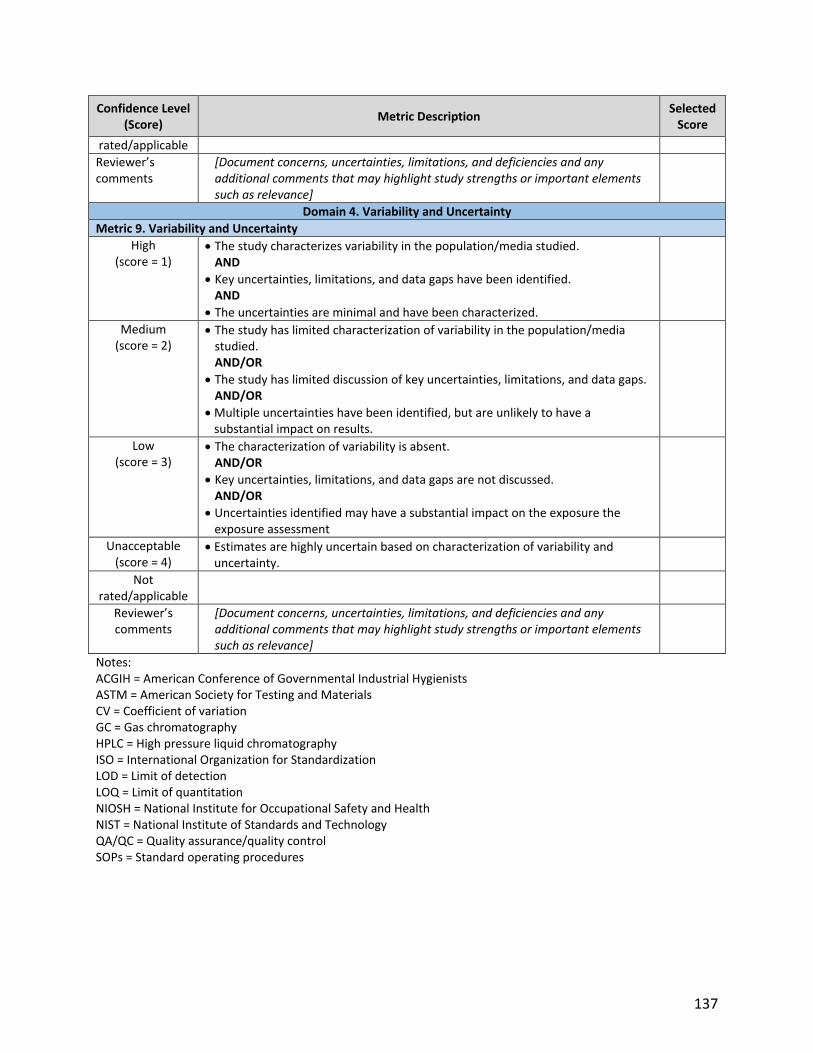
137
Confidence Level (Score)
Metric Description Selected
Score
rated/applicable
Reviewer’s comments
[Document concerns, uncertainties, limitations, and deficiencies and any additional comments that may highlight study strengths or important elements such as relevance]
Domain 4. Variability and Uncertainty
Metric 9. Variability and Uncertainty
High (score = 1)
The study characterizes variability in the population/media studied. AND
Key uncertainties, limitations, and data gaps have been identified. AND
The uncertainties are minimal and have been characterized.
Medium (score = 2)
The study has limited characterization of variability in the population/media studied. AND/OR
The study has limited discussion of key uncertainties, limitations, and data gaps. AND/OR
Multiple uncertainties have been identified, but are unlikely to have a substantial impact on results.
Low (score = 3)
The characterization of variability is absent. AND/OR
Key uncertainties, limitations, and data gaps are not discussed. AND/OR
Uncertainties identified may have a substantial impact on the exposure the exposure assessment
Unacceptable (score = 4)
Estimates are highly uncertain based on characterization of variability and uncertainty.
Not rated/applicable
Reviewer’s comments
[Document concerns, uncertainties, limitations, and deficiencies and any additional comments that may highlight study strengths or important elements such as relevance]
Notes: ACGIH = American Conference of Governmental Industrial Hygienists ASTM = American Society for Testing and Materials CV = Coefficient of variation GC = Gas chromatography HPLC = High pressure liquid chromatography ISO = International Organization for Standardization LOD = Limit of detection LOQ = Limit of quantitation NIOSH = National Institute for Occupational Safety and Health NIST = National Institute of Standards and Technology QA/QC = Quality assurance/quality control SOPs = Standard operating procedures

138
E.6.6 Database Data
Table E-18. Serious Flaws that Would Make Sources of Database Data Unacceptable for Use in the Exposure Assessment
Optimization of the list of serious flaws may occur after pilot calibration exercises.
Domain Metric Description of Serious Flaw(s) in Data Source
Reliability
Sampling methodology
The sampling methodologies used were not appropriate for the chemical/media of interest in the database (e.g., inappropriate sampling equipment, improper storage conditions).
Analytical methodology
The analytical methodologies used were not appropriate for the chemical/media of interest in the database (e.g., method not sensitive enough, not specific to the chemical, out of date).
Representative
Geographic Area
Geographic location of sampling data within database is not reported, discussed, or referenced.
Temporal Timing of sample data is not reported, discussed, or referenced.
Exposure Scenario
Data provided in the database are not representative of the media or population of interest.
Accessibility / Clarity
Availability of Database and
Supporting Documents
No information is provided on the database source or availability to the public.
Reporting Results
There are numerous inconsistencies or errors in the calculation and/or
reporting of results, resulting in highly uncertain reported results.
The information source reporting the analysis of the database data is missing key sections or lacks enough organization and clarity to locate and extract necessary information.
Variability and Uncertainty
Variability and Uncertainty
Estimates are highly uncertain based on characterization of variability and uncertainty.

139
Table E-19. Evaluation Criteria for Sources of Database Data
Confidence Level (Score)
Description Selected
Score
Domain 1. Reliability
Metric 1. Sampling methodology
High (score = 1)
Widely accepted sampling methodologies (i.e.,from a source generally using sound methods and/or approaches) were used to generate the data presented in the database. Example SOPs include USGS’s “National Field Manual for the Collection of Water-Quality Data”, EPA’s “Ambient Air Sampling” (SESDPROC-303-R5), etc.
Medium (score = 2)
The sampling methodologies were consistent with sound scientific theory and/or accepted approaches based on the reported sampling information, but may not have followed published procedures from a source generally known to use sound methods and/or approaches..
Low (score = 3)
The sampling methodology was not reported in data source or companion data source.
Unacceptable (score = 4)
The sampling methodologies used were not appropriate for the chemical/media of interest in the database (e.g., inappropriate sampling equipment, improper storage conditions).
Not rated/applicable
Reviewer’s comments
[Document concerns, uncertainties, limitations, and deficiencies and any additional comments that may highlight study strengths or important elements such as relevance]
Metric 2. Analytical methodology
High (score = 1)
Widely accepted analytical methodologies (i.e., from a source generally using sound methods and/or approaches) were used to generate the data presented in the database. Example SOPs include EPA SW-846 Methods, NIOSH Manual of Analytical Methods 5th Edition, etc.
Medium (score = 2)
The analytical methodologies were consistent with sound scientific theory and/or accepted approaches based on the reported analytical information, but may not have followed published procedures from a source generally known to use sound methods and/or approaches.
Low (score = 3)
The analytical methodology was not reported in data source or companion data source.
Unacceptable (score = 4)
The analytical methodologies used were not appropriate for the chemical/media of interest in the database (e.g., method not sensitive enough, not specific to the chemical, out of date).
Not rated/applicable
Reviewer’s comments
[Document concerns, uncertainties, limitations, and deficiencies and any additional comments that may highlight study strengths or important elements such as relevance]
Domain 2. Representative
Metric 3. Geographic Area
High (score = 1)
Geographic location(s) is reported, discussed, or referenced.
Medium (score = 2)
Not applicable. This metric is dichotomous (i.e., high versus unacceptable).
Low Not applicable. This metric is dichotomous (i.e., high versus unacceptable).

140
Confidence Level (Score)
Description Selected
Score
(score = 3)
Unacceptable (score = 4)
Geographic location is not reported, discussed, or referenced.
Not rated/applicable
Reviewer’s comments
[Document concerns, uncertainties, limitations, and deficiencies and any additional comments that may highlight study strengths or important elements such as relevance]
Metric 4. Temporal
High (score = 1)
The data reflect current conditions (within 5 years); and/or
Database contains robust historical data for spatial and temporal analyses (if applicable).
Medium (score = 2)
The data are less consistent with current or recent exposures (>5 to 15 years); and/or
Database contains sufficient historical data for spatial and temporal analyses (if applicable).
Low (score = 3)
Data are not consistent with when current exposures (>15 years old) may be expected; and/or
Database does not contain enough historical data for spatial and temporal analyses (if applicable).
Unacceptable (score = 4)
Timing of sample data is not reported, discussed, or referenced.
Not rated/applicable
Reviewer’s comments
[Document concerns, uncertainties, limitations, and deficiencies and any additional comments that may highlight study strengths or important elements such as relevance]
Metric 5. Exposure Scenario
High (score = 1)
The data closely represent relevant exposure scenario (i.e., the population/scenario/media of interest). Examples include: amount and type of chemical / product used source of exposure method of application or by-stander exposure use of exposure controls
microenvironment (location, time, climate)
Medium (score = 2)
The data likely represent the relevant exposure scenario (i.e., population/scenario/media of interest). One or more key pieces of information may not be described but the deficiencies are unlikely to have a substantial impact on the characterization of the exposure scenario. AND/OR
If surrogate data, activities seem similar to the activities within scope.
Low (score = 3)
The data lack multiple key pieces of information and the deficiencies are likely to have a substantial impact on the characterization of the exposure scenario. AND/OR
There are some inconsistencies or possible errors in the reporting of scenario information (e.g., differences between text and tables in data source, differences between standard method and actual procedures reported to have been used, etc.) which leads to a lower confidence in the scenario assessed. AND/OR

141
Confidence Level (Score)
Description Selected
Score
If surrogate data, activities have lesser similarity but are still potentially applicable to the activities within scope.
Unacceptable (score = 4)
If reported, the exposure scenario discussed in the monitored study does not represent the exposure scenario of interest for the chemical.
Not rated/applicable
Reviewer’s comments
[Document concerns, uncertainties, limitations, and deficiencies and any additional comments that may highlight study strengths or important elements such as relevance]
Domain 3. Accessibility / Clarity
Metric 6. Availability of Database and Supporting Documents
High (score = 1)
Database is widely accepted and/or from a source generally known to use sound methods and/or approaches (e.g., NHANES, STORET).
Medium (score = 2)
The database may not be widely known or accepted (e.g., state maintained databases), but the database is adequately documented with the following information:
Within the database, metadata is present (sample identifiers, annotations, flags, units, matrix descriptions, etc.) and data fields are generally clear and defined.
A user manual other supporting documentation is available, or there is sufficient documentation in the data source or companion source.
Database quality assurance and data quality control measures are defined and/or a QA/QC protocol was followed.
Low (score = 3)
The database may not be widely known or accepted and only limited database documentation is available (see the medium rating).
Unacceptable (score = 4)
No information is provided on the database source or availability to the public.
Not rated/ applicable
Reviewer’s comments
[Document concerns, uncertainties, limitations, and deficiencies and any additional comments that may highlight study strengths or important elements such as relevance]
Metric 7. Reporting of Results
High (score = 1)
The information source reporting the analysis of the database data is well organized and understandable by the target audience. AND
Summary statistics in the data source are detailed and complete. Example parameters include:
Description of data set summarized (i.e., location, population, dates, etc.) Range of concentrations or percentiles Number of samples in data set Frequency of detection Measure of variation (CV, standard deviation) Measure of central tendency (mean, geometric mean, median) Test for outliers (if applicable)
Medium (score = 2)
The information source reporting the analysis of the database data is well organized and understandable by the target audience. AND
Summary statistics are missing one or more parameters (see description for high).

142
Confidence Level (Score)
Description Selected
Score
Low (score = 3)
The information source reporting the analysis of the database data is unclear or not well organized. AND/OR
Summary statistics are missing most parameters (see description for high) AND/OR
There are some inconsistencies or errors in the results reported, resulting in low confidence in the results reported (e.g., differences between text and tables in data source, less appropriate statistical methods).
Unacceptable (score = 4)
There are numerous inconsistencies or errors in the calculation and/or reporting of results, resulting in highly uncertain reported results. AND/OR
The information source reporting the analysis of the database data is missing key sections or lacks enough organization and clarity to locate and extract necessary information.
Not rated/applicable
Reviewer’s comments
[Document concerns, uncertainties, limitations, and deficiencies and any additional comments that may highlight study strengths or important elements such as relevance]
Domain 4. Variability and Uncertainty
Metric 8. Variability and Uncertainty
High (score = 1)
Key uncertainties, limitations, and data gaps have been identified. AND
The uncertainties are minimal and have been characterized.
Medium (score = 2)
The study has limited discussion of key uncertainties, limitations, and data gaps. AND/OR
Multiple uncertainties have been identified, but are unlikely to have a substantial impact on results.
Low (score = 3)
Key uncertainties, limitations, and data gaps are not discussed. AND/OR
Uncertainties identified may have a substantial impact on the exposure the exposure assessment
Unacceptable (score = 4)
Estimates are highly uncertain based on characterization of variability and uncertainty.
Not rated/applicable
Reviewer’s comments
[Document concerns, uncertainties, limitations, and deficiencies and any additional comments that may highlight study strengths or important elements such as relevance]
Notes: CV = Coefficient of variation NHANES = National Health and Nutrition Examination Survey NIOSH = National Institute for Occupational Safety and Health QA/QC = Quality assurance/quality control SOPs = Standard operating procedures STORET = Storage and Retrieval for Water Quality Data database USGS = U.S. Geological Survey
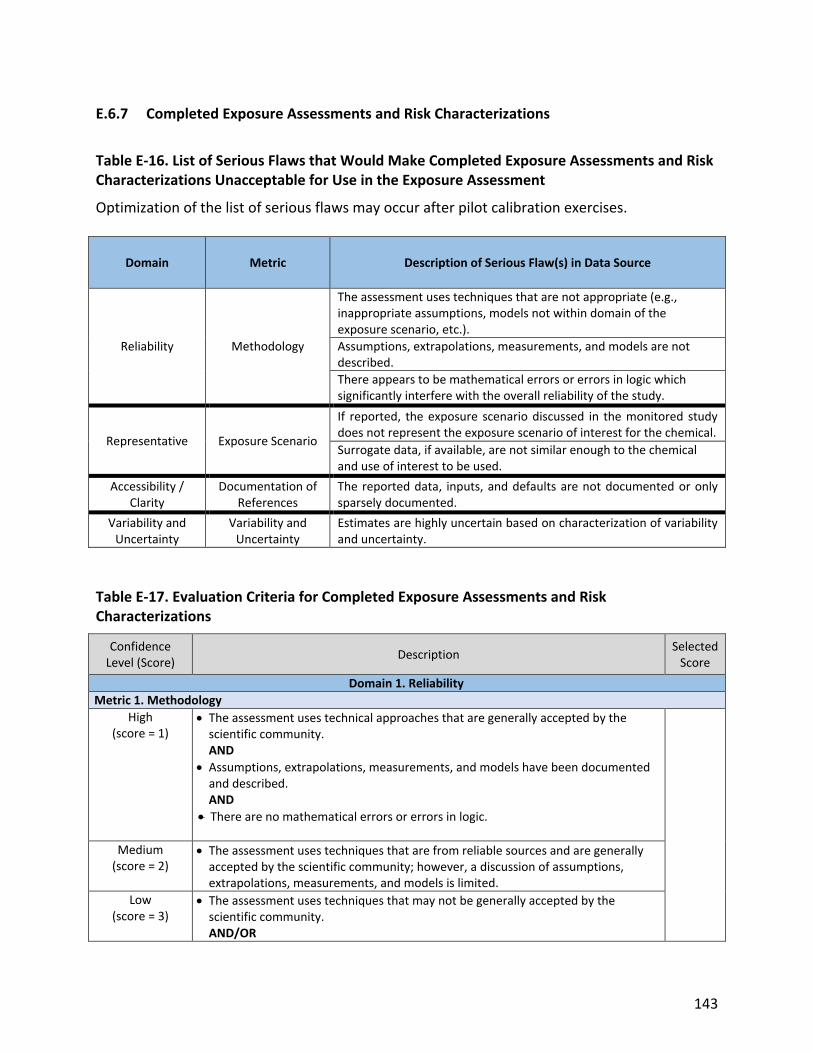
143
E.6.7 Completed Exposure Assessments and Risk Characterizations
Table E-16. List of Serious Flaws that Would Make Completed Exposure Assessments and Risk Characterizations Unacceptable for Use in the Exposure Assessment
Optimization of the list of serious flaws may occur after pilot calibration exercises.
Domain Metric Description of Serious Flaw(s) in Data Source
Reliability Methodology
The assessment uses techniques that are not appropriate (e.g., inappropriate assumptions, models not within domain of the exposure scenario, etc.).
Assumptions, extrapolations, measurements, and models are not described.
There appears to be mathematical errors or errors in logic which significantly interfere with the overall reliability of the study.
Representative Exposure Scenario
If reported, the exposure scenario discussed in the monitored study does not represent the exposure scenario of interest for the chemical.
Surrogate data, if available, are not similar enough to the chemical and use of interest to be used.
Accessibility / Clarity
Documentation of References
The reported data, inputs, and defaults are not documented or only sparsely documented.
Variability and Uncertainty
Variability and Uncertainty
Estimates are highly uncertain based on characterization of variability and uncertainty.
Table E-17. Evaluation Criteria for Completed Exposure Assessments and Risk Characterizations
Confidence Level (Score)
Description Selected
Score
Domain 1. Reliability
Metric 1. Methodology
High (score = 1)
The assessment uses technical approaches that are generally accepted by the scientific community. AND
Assumptions, extrapolations, measurements, and models have been documented and described. AND
There are no mathematical errors or errors in logic.
Medium (score = 2)
The assessment uses techniques that are from reliable sources and are generally accepted by the scientific community; however, a discussion of assumptions, extrapolations, measurements, and models is limited.
Low (score = 3)
The assessment uses techniques that may not be generally accepted by the scientific community. AND/OR
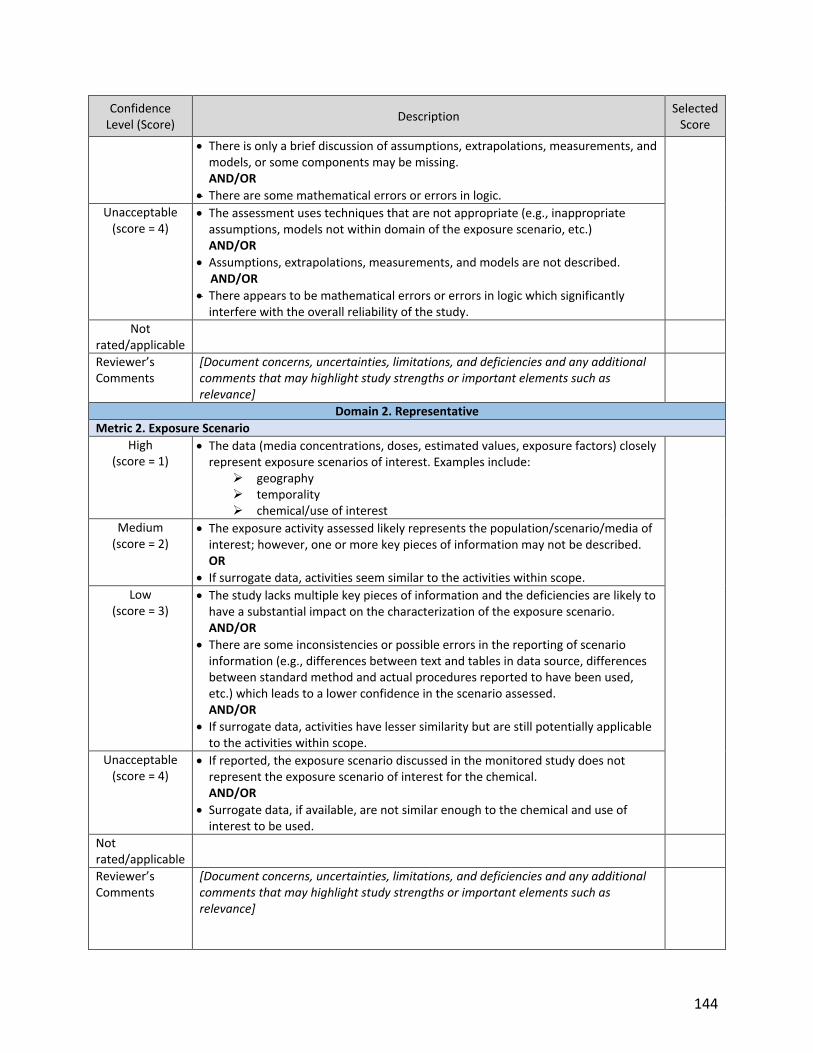
144
Confidence Level (Score)
Description Selected
Score
There is only a brief discussion of assumptions, extrapolations, measurements, and models, or some components may be missing. AND/OR
There are some mathematical errors or errors in logic.
Unacceptable (score = 4)
The assessment uses techniques that are not appropriate (e.g., inappropriate assumptions, models not within domain of the exposure scenario, etc.) AND/OR
Assumptions, extrapolations, measurements, and models are not described. AND/OR
There appears to be mathematical errors or errors in logic which significantly interfere with the overall reliability of the study.
Not rated/applicable
Reviewer’s Comments
[Document concerns, uncertainties, limitations, and deficiencies and any additional comments that may highlight study strengths or important elements such as relevance]
Domain 2. Representative
Metric 2. Exposure Scenario
High (score = 1)
The data (media concentrations, doses, estimated values, exposure factors) closely represent exposure scenarios of interest. Examples include:
geography temporality chemical/use of interest
Medium (score = 2)
The exposure activity assessed likely represents the population/scenario/media of interest; however, one or more key pieces of information may not be described. OR
If surrogate data, activities seem similar to the activities within scope.
Low (score = 3)
The study lacks multiple key pieces of information and the deficiencies are likely to have a substantial impact on the characterization of the exposure scenario. AND/OR
There are some inconsistencies or possible errors in the reporting of scenario information (e.g., differences between text and tables in data source, differences between standard method and actual procedures reported to have been used, etc.) which leads to a lower confidence in the scenario assessed. AND/OR
If surrogate data, activities have lesser similarity but are still potentially applicable to the activities within scope.
Unacceptable (score = 4)
If reported, the exposure scenario discussed in the monitored study does not represent the exposure scenario of interest for the chemical. AND/OR
Surrogate data, if available, are not similar enough to the chemical and use of interest to be used.
Not rated/applicable
Reviewer’s Comments
[Document concerns, uncertainties, limitations, and deficiencies and any additional comments that may highlight study strengths or important elements such as relevance]
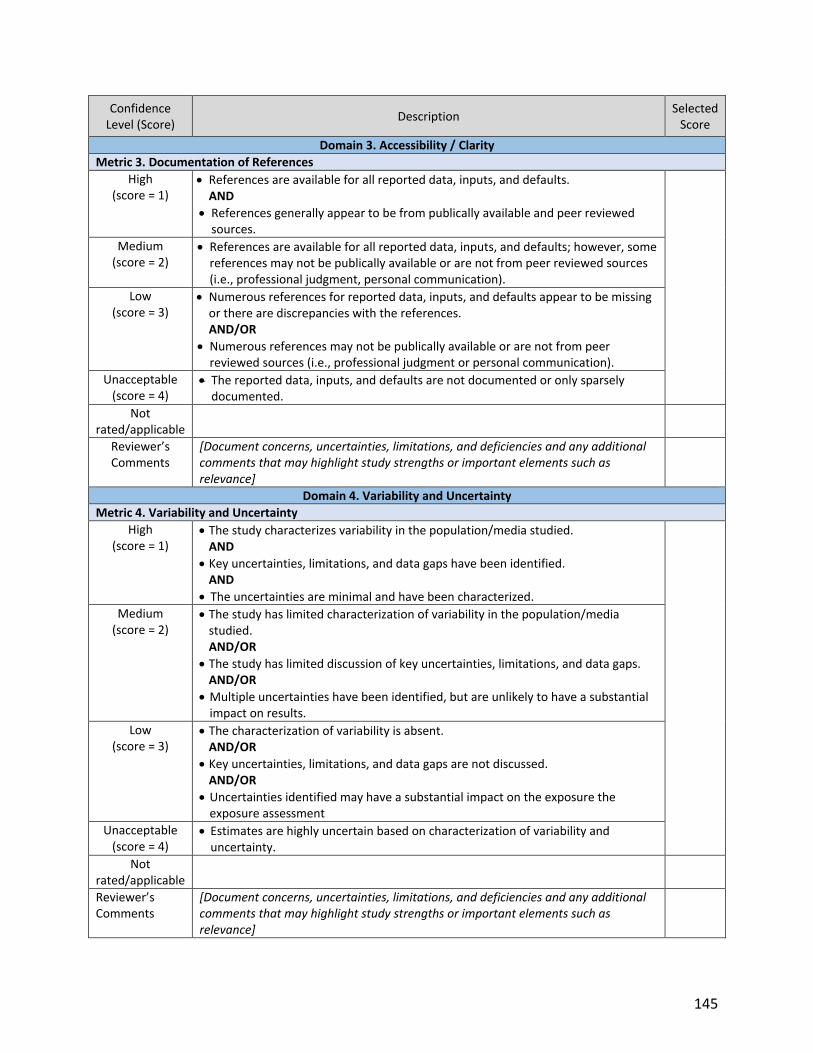
145
Confidence Level (Score)
Description Selected
Score
Domain 3. Accessibility / Clarity
Metric 3. Documentation of References
High (score = 1)
References are available for all reported data, inputs, and defaults. AND
References generally appear to be from publically available and peer reviewed sources.
Medium (score = 2)
References are available for all reported data, inputs, and defaults; however, some references may not be publically available or are not from peer reviewed sources (i.e., professional judgment, personal communication).
Low (score = 3)
Numerous references for reported data, inputs, and defaults appear to be missing or there are discrepancies with the references. AND/OR
Numerous references may not be publically available or are not from peer reviewed sources (i.e., professional judgment or personal communication).
Unacceptable (score = 4)
The reported data, inputs, and defaults are not documented or only sparsely documented.
Not rated/applicable
Reviewer’s Comments
[Document concerns, uncertainties, limitations, and deficiencies and any additional comments that may highlight study strengths or important elements such as relevance]
Domain 4. Variability and Uncertainty
Metric 4. Variability and Uncertainty
High (score = 1)
The study characterizes variability in the population/media studied. AND
Key uncertainties, limitations, and data gaps have been identified. AND
The uncertainties are minimal and have been characterized.
Medium (score = 2)
The study has limited characterization of variability in the population/media studied. AND/OR
The study has limited discussion of key uncertainties, limitations, and data gaps. AND/OR
Multiple uncertainties have been identified, but are unlikely to have a substantial impact on results.
Low (score = 3)
The characterization of variability is absent. AND/OR
Key uncertainties, limitations, and data gaps are not discussed. AND/OR
Uncertainties identified may have a substantial impact on the exposure the exposure assessment
Unacceptable (score = 4)
Estimates are highly uncertain based on characterization of variability and uncertainty.
Not rated/applicable
Reviewer’s Comments
[Document concerns, uncertainties, limitations, and deficiencies and any additional comments that may highlight study strengths or important elements such as relevance]

146
E.7 References
1. ECHA. (2011). Guidance on information requirements and chemical safety assessment. (ECHA-2011-G-13-EN). https://hero.epa.gov/heronet/index.cfm/reference/download/reference_id/4262842.
2. NRC. (1991). Environmental Epidemiology, Volume 1: Public Health and Hazardous Wastes. Washington, DC: The National Academies Press. https://hero.epa.gov/heronet/index.cfm/reference/download/reference_id/4262908.
3. U.S. EPA. (2009). Guidance on the Development, Evaluation, and Application of Environmental Models. (EPA/100/K-09/003). Washington, DC: Office of the Science Advisor. https://hero.epa.gov/heronet/index.cfm/reference/download/reference_id/4262976.

147
APPENDIX F: DATA QUALITY CRITERIA FOR ECOLOGICAL HAZARD STUDIES
F.1 Types of Data Sources
The data quality will be evaluated for a variety of ecological hazard studies (Table F-1). Since the availability of information varies considerably on different chemicals, it is anticipated that some ecological hazard studies will not be available while others may be identified beyond those listed in Table F-1.
Table F-1. Study Types that Provide Ecological Hazard Data
Data Category Types of Data Sources
Ecological Hazard
Acute and chronic toxicity to aquatic invertebrates and fish (e.g., freshwater, saltwater, and sediment-based exposures); toxicity to algae, cyanobacteria, and other microorganisms; toxicity to terrestrial invertebrates; acute oral toxicity to birds; toxicity to reproduction of birds; toxicity to terrestrial plants; toxicity to mammalian wildlife
F.2 Data Quality Evaluation Domains
The methods for evaluation of study quality were developed after review of selected existing processes and references describing existing study quality and risk of bias evaluation tools for toxicity studies including Criteria for Reporting and Evaluating Ecotoxicity Data (CRED) and ECOTOX knowledgebase (ECOTOX) (EC, 2018; Cooper et al., 2016; Lynch et al., 2016; Moermond et al., 2016b; Samuel et al., 2016; NTP, 2015a; Hooijmans et al., 2014; Koustas et al., 2014; Kushman et al., 2013; Hartling et al., 2012; Hooijmans et al., 2010). These publications, coupled with professional judgment and experience, informed the identification of domains and metrics for consideration in the evaluation and scoring of study quality. The evaluation domains and criteria were developed by harmonizing criteria across existing processes including CRED and ECOTOX processes. Furthermore, the evaluation tool is intended to address elements of TSCA Science Standards 26(h)(1) through 26(h)(5) that EPA must address during the development process of the risk evaluations. Ecological hazard studies will be evaluated for data quality by assessing the following seven domains: Test Substance, Test Design, Exposure Characterization, Test Organism, Outcome Assessment, Confounding/Variable Control, and Data Presentation and Analysis. The data quality within each domain will be evaluated by assessing unique metrics that pertain to each domain. For example, the Test Substance domain will be evaluated by considering the information reported by the study on the test substance identity, purity, and source. The domains are defined in Table F-2 and further information on evaluation metrics is provided in section F.3.

148
Table F-2. Data Evaluation Domains and Definitions
Evaluation Domain Definition
Test Substance
Metrics in this domain evaluate whether the information provided in the study provides a reliablea confirmation that the test substance used in a study has the same (or sufficiently similar) identity, purity, and properties as the substance of interest.
Test Design
Metrics in this domain evaluate whether the experimental design enables the study to distinguish the effect of exposure from other factors. This domain includes metrics related to the use of control groups and randomization in allocation to ensure that the effect of exposure is isolated.
Exposure Characterization
Metrics in this domain assess the validity and reliability of methods used to measure or characterize exposure. These metrics evaluate whether exposure to the test substance was characterized using a method(s) that provides valid and reliable results, whether the exposure remained consistent over the duration of the experiment, and whether the exposure levels were appropriate to the outcome of interest.
Test Organisms These metrics assess the appropriateness of the population or organism(s), number of organisms used in the study, and the organism conditions to assess the outcome of interest associated with the exposure of interest.
Outcome Assessment
Metrics in this domain assess the validity and reliability of methods, including sensitivity of methods, that are used to measure or otherwise characterize the outcome((e.g.. immobilization as a measure of mortality in aquatic invertebrates)
Confounding/Variable Control
Metrics in this domain assess the potential impact of factors other than exposure that may affect the risk of outcome. The metrics evaluate whether studies identify and account for factors that are related to exposure and independently related to outcome (confounding factors) and whether appropriate experimental or analytical (statistical) methods are used to control for factors unrelated to exposure that may affect the risk of outcome (variable control).
Data Presentation and Analysis Metrics in this domain assess whether appropriate statistical methods were used and if data for all outcomes are presented.
Other Metrics in this domain are added as needed to incorporate chemical- or study-specific evaluations.
Note: a Reliability is defined as “the inherent property of a study or data, which includes the use of well-founded scientific approaches, the avoidance of bias within the study or data collection design and faithful study or data collection conduct and documentation” (ECHA, 2011b).
F.3 Data Quality Evaluation Metrics
The data quality evaluation domains will be evaluated by assessing unique metrics that have been developed for ecological hazard studies. Each metric will be binned into a confidence level of high, medium, low, or unacceptable. Each confidence level is assigned a numerical score (i.e., 1 through 4) that is used in the method of assessing the overall quality of the study. Table F-3 lists the data evaluation domains and metrics for ecological hazard studies. Each domain has between 2 and 6 metrics; however, some metrics may not apply to all study types.

149
A general domain for other considerations is available for metrics that are specific to a given test substance or study type. EPA/OPPT may modify the metrics used for ecological hazard studies as the Agency acquires experience with the evaluation tool. Any modifications will be documented. Confidence level specifications for each metric are provided in Table F-4. Table F-7 summarizes the serious flaws that would make ecological hazard studies unacceptable for use in the assessment.
Table F-3. Data Evaluation Domains and Metrics for Ecological Hazard Studies
Evaluation Domain
Number of
Metrics Overall
Metrics (Metric Number and Description)
Test Substance 3
Metric 1: Test Substance Identity
Metric 2: Test Substance Source
Metric 3: Test Substance Purity
Test Design 3
Metric 4: Negative Controls
Metric 5: Negative Control Response
Metric 6: Randomized Allocation
Exposure Characterization
6
Metric 7: Experimental System/Test Media Preparation
Metric 8: Consistency of Exposure Administration
Metric 9: Measurement of Test Substance Concentration
Metric 10: Exposure Duration and Frequency
Metric 11: Number of Exposure Groups and Spacing of Exposure Levels
Metric 12: Testing at or Below Solubility Limit
Test Organisms 4
Metric 13: Test Organism Characteristics
Metric 14: Acclimatization and Pretreatment Conditions
Metric 15: Number of Organisms and Replicates per Group
Metric 16: Adequacy of Test Conditions
Outcome Assessment 2 Metric 17: Outcome Assessment Methodology
Metric 18: Consistency of Outcome Assessment
Confounding/ Variable Control
2 Metric 19: Confounding Variables in Test design and Procedures
Metric 20: Outcomes Unrelated to Exposure
Data Presentation and Analysis
3
Metric 21: Statistical Methods
Metric 22: Reporting of Data
Metric 23: Explanation of Unexpected Outcomes

150
F.4 Scoring Method and Determination of Overall Data Quality Level
Appendix A provides information about the evaluation method that will be applied across the various data/information sources being assessed to support TSCA risk evaluations. This section provides details about the scoring system that will be applied to ecological hazard studies, including the weighting factors assigned to each metric score of each domain.
Some metrics will be given greater weights than others, if they are regarded as key or critical metrics. Thus, EPA/OPPT will use a weighting approach to reflect that some metrics are more important than others when assessing the overall quality of the data.
F.4.1 Weighting Factors
Each metric was assigned a weighting factor of 1 or 2, with the higher weighting factor (2) given to metrics deemed critical for the evaluation. In selecting critical metrics, EPA recognized that the relevance of an individual study to the risk analysis for a given substance is determined by its ability to inform hazard characterization and/or exposure-response assessment. Thus, the critical metrics are those that determine how well a study answers these key questions:
Is a change in the outcome demonstrated in the study?
Is the observed change more likely than not attributable to the substance exposure?
At what test substance concentrations does the change occur?
EPA/OPPT assigned a weighting factor of 2 to each metric considered critical to answering these questions. Remaining metrics were assigned a weighting factor of 1. Table F-4 identifies the critical metrics (i.e., those assigned a weighting factor of 2) for ecological hazard studies and provides a rationale for selection of each metric. Table F-5 identifies the weighting factors assigned to each metric, and the ranges of possible weighted metric scores for ecological hazard studies.
F.4.2 Calculation of Overall Study Score
A confidence level (1, 2, or 3 for High, Medium, or Low confidence, respectively) is assigned for each relevant metric within each domain. To determine the overall study score, the first step is to multiply the score for each metric (1, 2, or 3 for High, Medium, or Low confidence, respectively) by the appropriate weighting factor (as shown in Table F-5) to obtain a weighted metric score. The weighted metric scores are then summed and divided by the sum of the weighting factors (for all metrics that are scored) to obtain an overall study score between 1 and 3. The equation for calculating the overall score is shown below:
Overall Score (range of 1 to 3) = ∑(Metric Score x Weighting Factor)/∑(Weighting Factors) Some metrics may not be applicable to all study types. Any metrics that are considered to be Not rated/not applicable to the study under evaluation will not be considered in the calculation of the study’s overall quality score. These metrics will not be included in the nominator or denominator of the equation above. The overall score will be calculated using only those

151
metrics that receive a numerical score. Scoring samples for ecological hazard studies are given in Tables F-6 and F-7. Studies with any single metric scored as unacceptable (score = 4) will be automatically assigned an overall quality score of 4 (Unacceptable). An unacceptable score means that serious flaws are noted in the domain metric that consequently make the data unusable (or invalid). If a metric is not applicable for a study type, the serious flaws would not be applicable for that metric and would not receive a score. EPA/OPPT plans to use data with an overall quality level of High, Medium, or Low confidence to quantitatively or qualitatively support the risk evaluations, but does not plan to use data rated as Unacceptable. An overall study score will not be calculated when a serious flaw is identified for any metric. If a publication reports more than one study or endpoint, each study and, as needed, each endpoint will be evaluated separately. Detailed tables showing quality criteria for the metrics are provided in Tables F-8 and F-9, including a table that summarizes the serious flaws that would make the data unacceptable for use in the environmental hazard assessment.

152
Table F-4. Ecological Hazard Metrics with Greater Importance in the Evaluation and Rationale for Selection
Domain Critical Metrics with
Weighting Factor of 2 (Metric Number) a
Rationale
Test substance Test substance identity
(Metric 1)
The test substance must be identified and characterized definitively to ensure that the study is relevant to the substance of interest.
Test design Negative controls
(Metric 4) A concurrent negative control is required to ensure that any observed effects are attributable to substance exposure.
Exposure characterization
Experimental test system/test media
preparation (Metric 7)
The design of the test system and methods of test media preparation must take into account the physical-chemical properties (e.g., solubility, volatility) and reactivity of the test substance (e.g., hydrolysis, biodegradation, bioaccumulation, adsorption) to ensure confidence in test substance concentrations, which will allow for determination of a concentration-response relationship and enable valid comparisons across studies.
Exposure characterization
Measurement of test substance concentration
(Metric 9) b
For test substances that have poor water solubility, are volatile or unstable in the test media measurement of test substance concentrations is necessary for determination of a concentration-response relationship and to enable valid comparisons across studies.
Test organisms Test organism characteristics
(Metric 13)
The test organism characteristics must be reported to enable assessment of a) whether they are suitable for the endpoint of interest; and b) whether there are species, strain, sex, size, or age/lifestage differences within or between different studies.
Outcome assessment Outcome assessment
methodology (Metric 17)
The methods used for outcome assessment must be fully described, valid, and sensitive to ensure that effects are detected, that observed effects are true, and to enable valid comparisons across studies.
Confounding/variable control
Confounding variables in test design and
procedures (Metric 19)
Control for confounding variables in test design and procedures are necessary to ensure that any observed effects are attributable to substance exposure and not to other factors.
Data presentation and analysis
Reporting of data (Metric 22)
Detailed results are necessary to determine if the study authors’ conclusions are valid and to determine a exposure-response relationship.
Notes: a A weighting factor of 1 is assigned for the following metrics: test substance source (metric 2); test substance
purity (metric 3); negative control response (metric 5); randomized allocation (metric 6); consistency of exposure administration (metric 8); exposure duration and frequency (metric 10); number of exposure groups and spacing of exposure levels (metric 11); testing at or below solubility limit (metric 12); acclimatization and pretreatment conditions (metric 14); number of organisms and replicates per group (metric 15); adequacy of test conditions (metric 16); consistency of outcome assessment (metric 18); outcomes unrelated to exposure (metric 20); statistical methods (metric 21); and explanation of unexpected outcomes (metric 23)
b This metric is applicable only to test substances that have poor water solubility or are volatile or unstable in test media
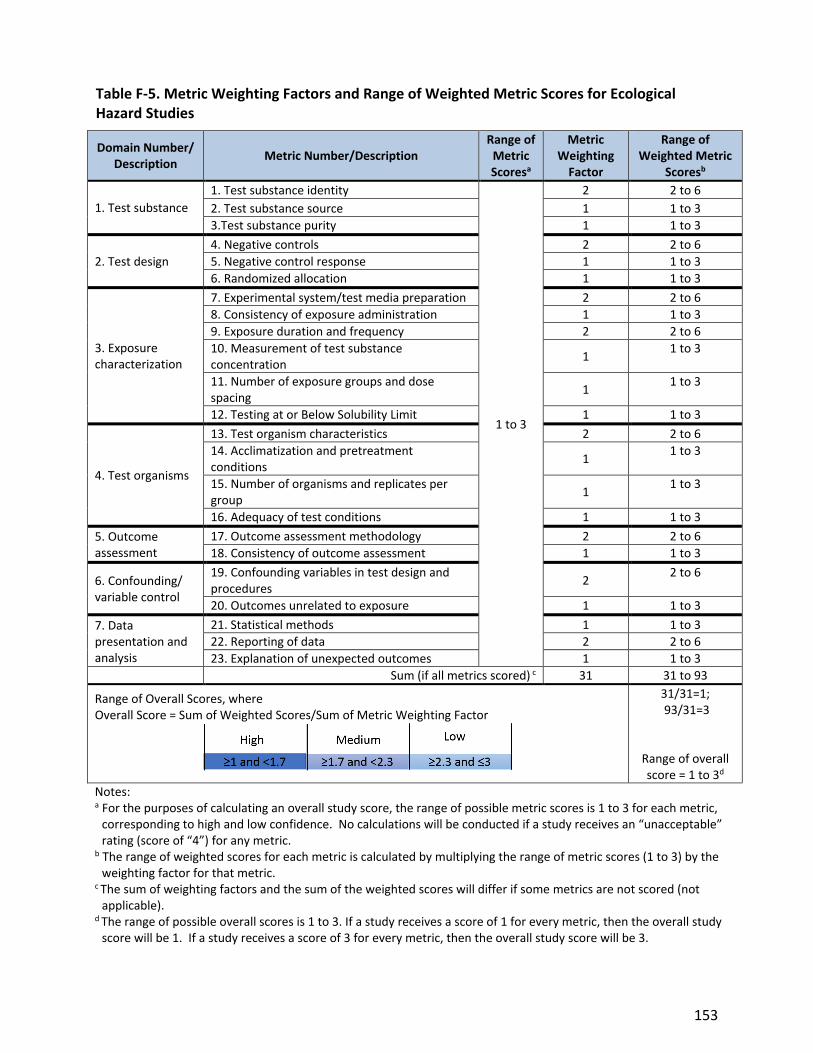
153
Table F-5. Metric Weighting Factors and Range of Weighted Metric Scores for Ecological Hazard Studies
Domain Number/ Description
Metric Number/Description Range of
Metric Scoresa
Metric Weighting
Factor
Range of Weighted Metric
Scoresb
1. Test substance
1. Test substance identity
1 to 3
2 2 to 6
2. Test substance source 1 1 to 3
3.Test substance purity 1 1 to 3
2. Test design
4. Negative controls 2 2 to 6
5. Negative control response 1 1 to 3
6. Randomized allocation 1 1 to 3
3. Exposure characterization
7. Experimental system/test media preparation 2 2 to 6
8. Consistency of exposure administration 1 1 to 3
9. Exposure duration and frequency 2 2 to 6
10. Measurement of test substance concentration
1 1 to 3
11. Number of exposure groups and dose spacing
1 1 to 3
12. Testing at or Below Solubility Limit 1 1 to 3
4. Test organisms
13. Test organism characteristics 2 2 to 6
14. Acclimatization and pretreatment conditions
1 1 to 3
15. Number of organisms and replicates per group
1 1 to 3
16. Adequacy of test conditions 1 1 to 3
5. Outcome assessment
17. Outcome assessment methodology 2 2 to 6
18. Consistency of outcome assessment 1 1 to 3
6. Confounding/ variable control
19. Confounding variables in test design and procedures
2 2 to 6
20. Outcomes unrelated to exposure 1 1 to 3
7. Data presentation and analysis
21. Statistical methods 1 1 to 3
22. Reporting of data 2 2 to 6
23. Explanation of unexpected outcomes 1 1 to 3
Sum (if all metrics scored) c 31 31 to 93
Range of Overall Scores, where Overall Score = Sum of Weighted Scores/Sum of Metric Weighting Factor
31/31=1; 93/31=3
Range of overall score = 1 to 3d
Notes: a For the purposes of calculating an overall study score, the range of possible metric scores is 1 to 3 for each metric,
corresponding to high and low confidence. No calculations will be conducted if a study receives an “unacceptable” rating (score of “4”) for any metric.
b The range of weighted scores for each metric is calculated by multiplying the range of metric scores (1 to 3) by the weighting factor for that metric.
c The sum of weighting factors and the sum of the weighted scores will differ if some metrics are not scored (not applicable).
d The range of possible overall scores is 1 to 3. If a study receives a score of 1 for every metric, then the overall study score will be 1. If a study receives a score of 3 for every metric, then the overall study score will be 3.

154
Table F-6. Scoring Example for an Ecological Hazard Study with all Metrics Scored
Domain Metric Metric Score Metric Weighting
Factor Weighted
Score
Test substance 1. Test substance identity 2 2 4
2. Test substance source 3 1 3
3.Test substance purity 2 1 2
Test design 4. Negative controls 1 2 2
5. Negative control response 2 1 2
6. Randomized allocation 3 1 3
Exposure characterization 7. Experimental system/test media preparation 2 2 4
8. Consistency of exposure administration 1 1 1
9. Exposure duration and frequency 1 2 2
10. Measurement of test substance concentration 1 1 1
11. Number of exposure groups and dose spacing 1 1 1
12. Testing at or Below Solubility Limit 1 1 1
Test organisms 13. Test organism characteristics 2 2 4
14. Acclimatization and pretreatment conditions 2 1 2
15. Number of organisms and replicates per group 1 1 1
16. Adequacy of test conditions 1 1 1
Outcome assessment 17. Outcome assessment methodology 1 2 2
18. Consistency of outcome assessment 1 1 1
Confounding/variable control 19. Confounding variables in test design and procedures 2 2 4
20. Outcomes unrelated to exposure 2 1 2
Data presentation and analysis 21. Statistical methods 2 1 2
22. Reporting of data 1 2 2
23. Explanation of unexpected outcomes 2 1 2
Sum
31 49
Overall Study Score 1.6= High
Overall Score = Sum of Weighted Scores/Sum of Metric Weighting Factor

155
Table F-7. Scoring Example for an Ecological Hazard with Some Metrics Not Rated/Not Applicable
Domain Metric Metric Score
Metric Weighting Factor
Weighted Score
Test substance 1. Test substance identity 2 2 4
2. Test substance source 3 1 3
3.Test substance purity 2 1 2
Test design 4. Negative controls 1 2 2
5. Negative control response 2 1 2
6. Randomized allocation 3 1 3
Exposure characterization 7. Experimental system/test media preparation 2 2 4
8. Consistency of exposure administration 1 1 1
9. Exposure duration and frequency 1 2 2
10. Measurement of test substance concentration 1 1 1
11. Number of exposure groups and dose spacing 1 1 1
12. Testing at or Below Solubility Limit NR
Test organisms 13. Test organism characteristics 3 2 6
14. Acclimatization and pretreatment conditions 2 1 2
15. Number of organisms and replicates per group 1 1 1
16. Adequacy of test conditions NR
Outcome assessment 17. Outcome assessment methodology 1 2 2
18. Consistency of outcome assessment NR
Confounding/variable control 19. Confounding variables in test design and procedures 3 2 6
20. Outcomes unrelated to exposure NR
Data presentation and analysis 21. Statistical methods 2 1 2
22. Reporting of data 1 2 2
23. Explanation of unexpected outcomes NR NR= not rated/not applicable Sum
26 46
Overall Study Score 1.8= Medium
Overall Score = Sum of Weighted Scores/Sum of Metric Weighting Factor

156
F.5 Data Quality Criteria
Table F-8. Serious Flaws that Would Make Ecological Hazard Studies Unacceptable
Optimization of the list of serious flaws may occur after pilot calibration exercises.
Domain Metric Description of Serious Flaw(s) in Data Source
Test substance
Test substance identity
The test substance identity and form (the latter if applicable) cannot be determined from the information provided (e.g., nomenclature was unclear and CASRN or structure were not reported) OR for mixtures, the components and ratios were not characterized.
Test substance source
The test substance was not obtained from a manufacturer OR if synthesized or extracted, analytical verification of the test substance was not conducted.
Test substance purity The nature and quantity of reported impurities were such that study results were likely to be due to one or more of the impurities.
Test design
Negative controls
A concurrent negative control group was not included or reported OR the reported negative control group was not appropriate (e.g., age/weight of organisms differed between control and treated groups).
Negative control response
The biological responses of the negative control groups were not reported OR there was unacceptable variation in biological responses between control replicates.
Randomized allocation
The study reported using a biased method to allocate organisms to study groups (e.g., each study group consists of organisms from a single brood and the broods differ among study groups).
Exposure characterization
Experimental system/test media preparation
The physical-chemical properties of the test substance required special considerations for preparation and maintenance of test substance concentrations, but no measures were taken to appropriately prepare test concentrations and/or minimize loss of test substance before and during the exposure and/or the use of such measures was not reported. In addition, the test substance concentrations were not measured, thereby preventing characterization of a concentration-response relationship.
Consistency of exposure administration
Reported information indicated that critical exposure details were inconsistent across study groups and these differences are considered serious flaws that make the study unusable (e.g., for a poorly soluble mixture, a solvent was used for some study groups while a water-accommodated fraction was used for others).

157
Domain Metric Description of Serious Flaw(s) in Data Source
Measurement of test substance concentration
For test substances that have poor water solubility or are volatile or unstable in test media: Exposure concentrations were not measured and nominal values are highly uncertain due to the nature of the test substance OR exposure concentrations were measured but analytical methods were not appropriate for the test substance resulting in serious uncertainties in measured concentrations (e.g., recovery and/or repeatability were poor).
Exposure duration and frequency
The duration of exposure and/or exposure frequency were not reported OR the reported duration of exposure and/or exposure frequency were not suited to the study type and/or outcome(s) of interest (e.g., study intended to assess effects on reproduction did not expose organisms to test substance for an acceptable period of time prior to mating).
Number of exposure groups and spacing of exposure
levels
The number of exposure groups and spacing of exposure levels were not conducive to the purpose of the study (e.g., the range of concentrations tested was either too high or too low to observe a concentration-response relationship, a LOAEC, NOAEC, LC50, or EC50 could not be identified) OR no information is provided on the number of exposure groups and spacing of exposure levels.
Testing at or below solubility limit
All exposure concentrations greatly exceeded the water solubility limit (or dispersibility limit if applicable) and the range of exposure concentrations tested was insufficient to characterize a concentration-response relationship AND/OR the solvent concentration exceeded an appropriate concentration and is likely to have influenced the biological response of the test organisms.
Test organisms
Test organism characteristics
The test organisms were not identified sufficiently or were not appropriate for the evaluation of the specific outcome(s) of interest or were not from an appropriate source (e.g., collected from a polluted field site).
Acclimatization and pretreatment conditions
There were serious differences in acclimatization and/or pretreatment conditions between control and exposed groups OR organisms were previously exposed to the test substance or other unintended stressors.
Number of organisms and replicates per group
The number of test organisms and/or replicates was insufficient to characterize toxicological effects and/or provided insufficient power for statistical analysis (e.g., 1-2 organisms/group).

158
Domain Metric Description of Serious Flaw(s) in Data Source
Adequacy of test conditions
Organism housing and/or environmental conditions and/or food, water, and nutrients and/or biomass loading were not conducive to maintenance of health (e.g., overt signs of handling stress are evident).
Outcome assessment
Outcome assessment methodology
The outcome assessment methodology was not reported OR the reported outcome assessment methodology was not sensitive for the outcome(s) of interest (e.g., in the assessment of reproduction in a chronic daphnid test, offspring were not counted and removed until the end of the test, rather than daily).
Consistency of outcome assessment
There were large inconsistencies in the execution of study protocols for outcome assessment across study groups OR outcome assessments were not adequately reported for meaningful interpretation of results.
Confounding/variable control
Confounding variables in test design and procedures
The study reported significant differences among the study groups with respect to environmental conditions (e.g., differences in pH unrelated to the test substance) or other non-treatment-related factors and these prevent meaningful interpretation of the results.
Outcomes unrelated to exposure
One or more study groups experienced serious test organism attrition or outcomes unrelated to exposure (e.g., infection).
Data presentation and analysis
Statistical methods
Statistical methods used were not appropriate (e.g., parametric test for non-normally distributed data) OR statistical analysis was not conducted AND data enabling an independent statistical analysis were not provided.
Reporting of data
Data presentation was inadequate (e.g., the report does not differentiate among findings in multiple treatment groups) OR major inconsistencies were present in reporting of results.
Explanation of unexpected outcomes
The occurrence of unexpected outcomes, including, but not limited to, within-study variability and/or variation from historical measures, are considered serious flaws that make the study unusable.

159
Table F-9. Data Quality Criteria for Ecological Hazard Studies
Confidence Level (Score)
Description Selected
Score
Domain 1. Test Substance
Metric 1. Test substance identity Was the test substance identified definitively (i.e., established nomenclature, CASRN, and/or structure reported, including information on the specific form tested [e.g., valence state] for substances that may vary in form)? If test substance is a mixture, were mixture components and ratios characterized?
High (score = 1)
The test substance was identified definitively and the specific form was characterized (where applicable). For mixtures, the components and ratios were characterized.
Medium (score = 2)
The test substance and form (the latter if applicable) were identified and components and ratios of mixtures were characterized, but there were minor uncertainties (e.g., minor characterization details were omitted) that are unlikely to have a substantial impact on results.
Low (score = 3)
The test substance and form (the latter if applicable) were identified and components and ratios of mixtures were characterized, but there were uncertainties regarding test substance identification or characterization that are likely to have a substantial impact on results.
Unacceptable (score = 4)
The test substance identity and form (the latter if applicable) cannot be determined from the information provided (e.g., nomenclature was unclear and CASRN or structure were not reported) OR for mixtures, the components and ratios were not characterized. These are serious flaws that make the study unusable.
Not rated/applicable
Reviewer’s comments [Document concerns, uncertainties, limitations, and deficiencies and any additional comments that may highlight study strengths or important elements such as relevance]
Metric 2. Test substance source Is the source of the test substance reported, including manufacturer and batch/lot number for materials that may vary in composition? If synthesized or extracted, was test substance identity verified by analytical methods?
High (score = 1)
The source of the test substance was reported, including manufacturer and batch/lot number for materials that may vary in composition, and its identity was certified by manufacturer and/or verified by analytical methods (e.g., melting point, chemical analysis, etc.).
Medium (score = 2)
The source of the test substance and/or the analytical verification of a synthesized test substance was reported incompletely, but the omitted details are unlikely to have a substantial impact on results.
Low (score = 3)
Omitted details on the source of the test substance and/or the analytical verification of a synthesized test substance are likely to have a substantial impact on results.
Unacceptable (score = 4)
The test substance was not obtained from a manufacturer OR if synthesized or extracted, analytical verification of the test substance was not conducted. These are serious flaws that make the study unusable.
Not rated/applicablea
Reviewer’s comments [Document concerns, uncertainties, limitations, and deficiencies and any additional comments that may highlight study strengths or important elements such as relevance]

160
Confidence Level (Score)
Description Selected
Score
Metric 3. Test substance purity Was the purity or grade (i.e., analytical, technical) of the test substance reported and adequate to identify its toxicological effects? Were impurities identified? Were impurities present in quantities that could influence the results?
High (score = 1)
The test substance purity and composition were such that any observed effects were highly likely to be due to the nominal test substance itself (e.g., highly pure or analytical-grade test substance or a formulation comprising primarily inert ingredients with small amount of active ingredient).
Medium (score = 2)
Minor uncertainties or limitations were identified regarding the test substance purity and composition; however, the purity and composition were such that observed effects were more likely than not due to the nominal test substance, and any identified impurities are unlikely to have a substantial impact on results.
Low (score = 3)
Purity and/or grade of test substance were not reported or were low enough to have a substantial impact on results (i.e., observed effects may not be due to the nominal test substance).
Unacceptable (score = 4)
The nature and quantity of reported impurities were such that study results were likely to be due to one or more of the impurities. This is a serious flaw that makes the study unusable.
Not rated/applicablea
Reviewer’s comments [Document concerns, uncertainties, limitations, and deficiencies and any additional comments that may highlight study strengths or important elements such as relevance]
Domain 2. Test Design Metric 4. Negative controls Was an appropriate concurrent negative control group tested? If a vehicle/solvent was used, was a vehicle (solvent) control tested in parallel?
High (score = 1)
Study authors reported using an appropriate concurrent negative control group (i.e., all conditions equal except chemical exposure).
Medium (score = 2)
Study authors reported using a concurrent negative control group, but all conditions were not equal to those of treated groups (e.g., untreated control instead of a vehicle control); however, the identified differences are considered to be minor limitations that are unlikely to have a substantial impact on results.
Low (score = 3)
Study authors acknowledged using a concurrent negative control group, but details regarding the negative control group were not reported, and the lack of details is likely to have a substantial impact on results.
Unacceptable (score = 4)
A concurrent negative control group was not included or reported OR the reported negative control group was not appropriate (e.g., age/weight of organisms differed between control and treated groups). This is a serious flaw that makes the study unusable.
Not rated/applicablea
Reviewer’s comments [Document concerns, uncertainties, limitations, and deficiencies and any additional comments that may highlight study strengths or important elements such as relevance]
Metric 5. Negative control response Were the biological responses (e.g., survival, growth, reproduction, etc.) of the negative control group(s) adequate?
High (score = 1)
The biological responses (e.g., survival, growth, reproduction, etc.) of the negative control group(s) were adequate (e.g., mortality of control fish ≤10% in an acute test).

161
Confidence Level (Score)
Description Selected
Score
Medium (score = 2)
There were minor uncertainties or limitations regarding the biological responses of the negative control group(s) (e.g., differences in outcome between untreated and solvent controls) that are unlikely to have a substantial impact on results.
Low (score = 3)
The biological responses of the negative control group(s) were reported, but there were deficiencies regarding the control responses that are likely to have a substantial impact on results (e.g., 30% mortality of control fish in an acute test).
Unacceptable (score = 4)
The biological responses of the negative control groups were not reported OR there was unacceptable variation in biological responses between control replicates. These are serious flaws that make the study unusable.
Not rated/applicable
Reviewer’s comments [Document concerns, uncertainties, limitations, and deficiencies and any additional comments that may highlight study strengths or important elements such as relevance]
Metric 6. Randomized allocation Did the study explicitly report randomized allocation of organisms to study groups?
High (score = 1)
The study reported that organisms were randomly allocated into study groups (including the control group).
Medium (score = 2)
The study reported methods of allocation of organisms to study groups, but there were minor limitations in the allocation method (e.g., method with a nonrandom component like assignment to minimize differences in body weight across groups) that are unlikely to have a substantial impact on results.
Low (score = 3)
Researchers did not report how organisms were allocated to study groups, or there were deficiencies regarding the allocation method that are likely to have a substantial impact on results (e.g., allocation by animal number).
Unacceptable (score = 4)
The study reported using a biased method to allocate organisms to study groups (e.g., each study group consists of organisms from a single brood and the broods differ among study groups). This is a serious flaw that makes the study unusable.
Not rated/applicablea
Reviewer’s comments [Document concerns, uncertainties, limitations, and deficiencies and any additional comments that may highlight study strengths or important elements such as relevance]
Domain 3. Exposure Characterization Was the experimental system (e.g., static, semi-static, or flow-through regime) described in adequate detail? Were methods for test media preparation appropriate for the test substance, taking into account its physical-chemical properties (e.g., solubility, volatility) and reactivity (e.g., hydrolysis, biodegradation, bioaccumulation, adsorption)? For reactive, volatile, and/or poorly soluble test substances, were adequate measures taken to prepare and maintain test substance concentrations and minimize loss of test substance before and during the exposure? (Based on professional judgment, the reviewer may consider this metric to be not rated/applicable for field and mesocosm studies.)
High (score = 1)
The experimental system and methods for preparation of test media were described in adequate detail and appropriately accounted for the physical-chemical properties of the test substance (e.g., use of closed, static systems with minimal headspace for volatile substances, use of water-accommodated fractions for multi-component substances that are only partially soluble in water, etc.).

162
Confidence Level (Score)
Description Selected
Score
Medium (score = 2)
The experimental system and/or test media preparation methods were adequately reported but did not completely account for physical-chemical properties (e.g., period between renewals was greater than the half-life of a test substance that degrades in the system); however, the identified limitations are unlikely to have a substantial impact on results.
Low (score = 3)
The type of experimental system and/or test media preparation methods were not reported OR the study provided only limited details on the measures taken to appropriately prepare test concentrations and/or minimize loss of test substance before and during the exposure for reactive, volatile, and/or poorly soluble substances AND concentrations of test substance were not measured during the study. Therefore, the deficiencies are likely to have a substantial impact on results.
Unacceptable (score = 4)
The physical-chemical properties of the test substance required special considerations for preparation and maintenance of test substance concentrations, but no measures were taken to appropriately prepare test concentrations and/or minimize loss of test substance before and during the exposure and/or the use of such measures was not reported. In addition, the test substance concentrations were not measured, thereby preventing characterization of a concentration-response relationship. These are serious flaws that make the study unusable.
Not rated/applicablea
Reviewer’s comments [Document concerns, uncertainties, limitations, and deficiencies and any additional comments that may highlight study strengths or important elements such as relevance]
Metric 8. Consistency of exposure administration Were exposures administered consistently across study groups (e.g., same exposure protocol; same time of day)?
High (score = 1)
Details of exposure administration were reported and exposures were administered consistently across study groups.
Medium (score = 2)
Details of exposure administration were reported, but minor inconsistencies in administration of exposures among study groups were identified that are unlikely to have a substantial impact on results (e.g., slightly different solvent concentrations).
Low (score = 3)
Details of exposure administration were reported, but inconsistencies in administration of exposures among study groups are considered deficiencies that are likely to have a substantial impact on results (e.g., differing periods between renewal for an unstable test substance) OR reporting omissions are likely to have a substantial impact on results.
Unacceptable (score = 4)
Reported information indicated that critical exposure details were inconsistent across study groups and these differences are considered serious flaws that make the study unusable (e.g., for a poorly soluble mixture, a solvent was used for some study groups while a water-accommodated fraction was used for others).
Not rated/applicablea
Reviewer’s comments [Document concerns, uncertainties, limitations, and deficiencies and any additional comments that may highlight study strengths or important elements such as relevance]

163
Confidence Level (Score)
Description Selected
Score
Metric 9. Measurement of test substance concentration If test substance has poor water solubility, is volatile or unstable in the test system (e.g., hydrolyzes or biodegrades rapidly), is bioaccumulated by biota, adsorbs to objects in the test system, or is otherwise subject to factors that are likely to cause test concentrations to change during exposure, were test substance concentrations in the exposure medium measured analytically? Were appropriate analytical methods used (i.e., recovery and repeatability were demonstrated)? This metric is not rated/applicable if the test substance does not have poor water solubility and is not subject to any factors that are likely to cause test concentrations to change during exposure.
High (score = 1)
Exposure concentrations were measured using appropriate analytical methods (i.e., recovery and repeatability were demonstrated). Endpoints were based on measured concentrations or analytically verified nominal concentrations.
Medium (score = 2)
Exposure concentrations were measured and measured concentrations were similar to nominal, but analytical methods were not reported OR exposure concentrations were not measured, but based on professional judgment of experimental design and nature of test substance, actual concentrations are likely to be similar to nominal concentrations. These minor uncertainties or limitations are unlikely to have a substantial impact on results.
Low (score = 3)
Exposure concentrations were not measured or measurements were not reported AND based on professional judgment of experimental design and nature of test substance, actual concentrations cannot be expected to be similar to nominal concentrations. This is likely to have a substantial impact on results
Unacceptable (score = 4)
Exposure concentrations were not measured and nominal values are highly uncertain due to the nature of the test substance OR exposure concentrations were measured but analytical methods were not appropriate for the test substance resulting in serious uncertainties in measured concentrations (e.g., recovery and/or repeatability were poor). These are serious flaws that make the study unusable.
Not rated/applicable
Reviewer’s comments [Document concerns, uncertainties, limitations, and deficiencies and any additional comments that may highlight study strengths or important elements such as relevance]
Metric 10. Exposure duration and frequency Were the duration of exposure and/or exposure frequency reported and appropriate for the study type and/or outcome(s) of interest?
High (score = 1)
The duration of exposure and/or exposure frequency were reported and appropriate for the study type and/or outcome(s) of interest (e.g., acute daphnid study of 48-hour duration).
Medium (score = 2)
Minor limitations in exposure frequency and duration of exposure were identified (e.g., acute daphnid toxicity study of 24-hour duration) but are unlikely to have a substantial impact on results.
Low (score = 3)
The duration of exposure and/or exposure frequency differed significantly from typical study designs (e.g., acute daphnid toxicity study of 8-hour duration), and these deficiencies are likely to have a substantial impact on results.
Unacceptable (score = 4)
The duration of exposure and/or exposure frequency were not reported OR

164
Confidence Level (Score)
Description Selected
Score
the reported duration of exposure and/or exposure frequency were not suited to the study type and/or outcome(s) of interest (e.g., study intended to assess effects on reproduction did not expose organisms to test substance for an acceptable period of time prior to mating). These are serious flaws that make the study unusable.
Not rated/applicablea
Reviewer’s comments [Document concerns, uncertainties, limitations, and deficiencies and any additional comments that may highlight study strengths or important elements such as relevance]
Metric 11. Number of exposure groups and spacing of exposure levels Were the number of exposure groups and spacing of exposure levels justified by study authors (e.g., based on range-finding studies) and adequate to address the purpose of the study? Did the range of concentrations/doses tested allow for identification of endpoint values (i.e., LOAEC and NOAEC, LC50, or EC50, depending upon duration of study)?
High (score = 1)
The number of exposure groups and spacing of exposure levels were justified by study authors, adequate to address the purpose of the study (e.g., the selected doses produce a range of responses), and allowed for identification of endpoint values.
Medium (score = 2)
There were minor limitations regarding the number of exposure groups and/or spacing of exposure levels (e.g., unclear if lowest concentration was low enough), but the number of exposure groups and spacing of exposure levels were adequate to show results relevant to the outcome of interest (e.g., observation of a concentration-response relationship) and the concerns are unlikely to have a substantial impact on results.
Low (score = 3)
There were deficiencies regarding the number of exposure groups and/or spacing of exposure levels (e.g., narrow spacing between exposure levels with similar responses across groups), which may include the omission of some important details (e.g., not all exposure levels are specified), and these are likely to have a substantial impact on results.
Unacceptable (score = 4)
The number of exposure groups and spacing of exposure levels were not conducive to the purpose of the study (e.g., the range of concentrations tested was either too high or too low to observe a concentration-response relationship, a LOAEC, NOAEC, LC50, or EC50 could not be identified) OR no information is provided on the number of exposure groups and spacing of exposure levels. These are serious flaws that make the study unusable.
Not rated/applicablea
Reviewer’s comments [Document concerns, uncertainties, limitations, and deficiencies and any additional comments that may highlight study strengths or important elements such as relevance]
Metric 12. Testing at or below solubility limit Were exposure concentrations at or below the limit of water solubility (or dispersibility limit if applicable)? If a solvent was used, was the solvent concentration appropriate (i.e., no effects on biological responses were observed in the solvent control and no interactions were expected between the solvent and test substance)?
High (score = 1)
Exposure concentrations were at or below the water solubility limit (or dispersibility limit if applicable). The solvent concentration was appropriate.
Medium (score = 2)
A subset of the exposure concentrations exceeded the water solubility limit (or dispersibility limit if applicable) but a sufficient range of exposure concentrations was tested to characterize a concentration-response relationship AND/OR

165
Confidence Level (Score)
Description Selected
Score
the solvent concentration slightly exceeded an appropriate concentration or was not reported, but the biological response of the solvent control was acceptable and no interactions are expected between the solvent and test substance. These minor uncertainties or limitations are unlikely to have a substantial impact on results.
Low (score = 3)
Reporting omissions prevented determination of whether exposure concentrations exceeded the water solubility limit (or dispersibility limit if applicable) AND/OR both the solvent concentration and biological response of the solvent control were not reported. These deficiencies are likely to have a substantial impact on results.
Unacceptable (score = 4)
All exposure concentrations greatly exceeded the water solubility limit (or dispersibility limit if applicable) and the range of exposure concentrations tested was insufficient to characterize a concentration-response relationship AND/OR the solvent concentration exceeded an appropriate concentration and is likely to have influenced the biological response of the test organisms. These are serious flaws that make the study unusable.
Not rated/applicable
Reviewer’s comments [Document concerns, uncertainties, limitations, and deficiencies and any additional comments that may highlight study strengths or important elements such as relevance]
Domain 4. Test Organisms Metric 13. Test organism characteristics Were the species, strain, sex, age, size, life stage, and/or embryonic stage of the test organisms reported and appropriate for the evaluation of the specific outcome(s) of interest (e.g., routinely used for similar study types or acceptable rationale provided for selection)? Were the test organisms from a reliable source?
High (score = 1)
The test organisms were adequately described and were obtained from a reliable source. The test organisms were appropriate for evaluation of the specific outcome(s) of interest (e.g., routinely used for similar study types or acceptable rationale provided for selection).
Medium (score = 2)
There are minor reservations or uncertainties about the choice of test species, source of test organisms, or characteristics of test organisms (e.g., age, size, or sex not reported for fish) that are unlikely to have a substantial impact on results.
Low (score = 3)
There were significant deficiencies or concerns regarding the choice of test species, source of test organisms, or characteristics of test organisms that are likely to have a substantial impact on study results.
Unacceptable (score = 4)
The test organisms were not identified sufficiently or were not appropriate for the evaluation of the specific outcome(s) of interest or were not from an appropriate source (e.g., collected from a polluted field site). These are serious flaws that make the study unusable.
Not rated/applicable
Reviewer’s comments [Document concerns, uncertainties, limitations, and deficiencies and any additional comments that may highlight study strengths or important elements such as relevance]

166
Confidence Level (Score)
Description Selected
Score
Metric 14. Acclimatization and pretreatment conditions Were the test organisms acclimatized to test conditions? Were pretreatment conditions the same for control and exposed groups?
High (score = 1)
The test organisms were acclimatized to test conditions and all pretreatment conditions were the same for control and exposed populations, such that the only difference was exposure to test substance.
Medium (score = 2)
Some acclimatization and/or pretreatment conditions differed between control and exposed populations, but the differences are unlikely to have a substantial impact on results or there are minor uncertainties or limitations in the details provided.
Low (score = 3)
The study did not report whether test organisms were acclimatized and/or whether pretreatment conditions were the same for control and exposed groups, and this is likely to have a substantial impact on results.
Unacceptable (score = 4)
There were serious differences in acclimatization and/or pretreatment conditions between control and exposed groups OR organisms were previously exposed to the test substance or other unintended stressors. These are serious flaws that make the study unusable.
Not rated/applicable
Reviewer’s comments [Document concerns, uncertainties, limitations, and deficiencies and any additional comments that may highlight study strengths or important elements such as relevance]
Metric 15. Number of organisms and replicates per group Were the numbers of test organisms and replicates sufficient to characterize toxicological effects?
High (score = 1)
The numbers of test organisms and replicates were reported and sufficient to characterize toxicological effects.
Medium (score = 2)
The numbers of test organisms and replicates were sufficient to characterize toxicological effects, but minor uncertainties or limitations were identified regarding the number of test organisms and/or replicates that are unlikely to have a substantial impact on results.
Low (score = 3)
The number of test organisms and/or replicates was not reported and this is likely to have a substantial impact on results.
Unacceptable (score = 4)
The number of test organisms and/or replicates was insufficient to characterize toxicological effects and/or provided insufficient power for statistical analysis (e.g., 1-2 organisms/group). These are serious flaws that make the study unusable.
Not rated/applicable
Reviewer’s comments [Document concerns, uncertainties, limitations, and deficiencies and any additional comments that may highlight study strengths or important elements such as relevance]
Metric 16. Adequacy of test conditions Were organism housing, environmental conditions (e.g., temperature, pH, dissolved oxygen, hardness, and salinity), food, water, and nutrients conducive to maintenance of health, both before and during exposure? Was the biomass loading of the organisms in the test system appropriate?
High (score = 1)
Organism housing, environmental conditions, food, water, and nutrients were conducive to maintenance of health and biomass loading was appropriate.
Medium (score = 2)
Minor uncertainties or limitations were identified regarding organism housing, environmental conditions, food, water, nutrients, and/or biomass loading, but these are not likely to have a substantial impact on results.

167
Confidence Level (Score)
Description Selected
Score
Low (score = 3)
Reporting of housing and/or environmental conditions and/or food, water, and nutrients and/or biomass loading was limited or unclear, and the omitted details are likely to have a substantial impact on results.
Unacceptable (score = 4)
Organism housing and/or environmental conditions and/or food, water, and nutrients and/or biomass loading were not conducive to maintenance of health (e.g., overt signs of handling stress are evident). These are serious flaws that make the study unusable.
Not rated/applicablea
Reviewer’s comments [Document concerns, uncertainties, limitations, and deficiencies and any additional comments that may highlight study strengths or important elements such as relevance]
Domain 5. Outcome Assessment Metric 17. Outcome assessment methodology Did the outcome assessment methodology address or report the intended outcome(s) of interest? Was the outcome assessment methodology (including endpoints assessed and timing of endpoint assessment) sensitive for the outcome(s) of interest (e.g., measured endpoints that were able to detect a true biological effect or hazard)? (Note: Outcome, as addressed in this domain, refers to biological effects measured in an ecotoxicity study; e.g., reproductive toxicity.)
High (score = 1)
The outcome assessment methodology addressed or reported the intended outcome(s) of interest and was sensitive for the outcomes(s) of interest.
Medium (score = 2)
The outcome assessment methodology partially addressed or reported the intended outcomes(s) of interest (e.g., total number of offspring per group reported in the absence of data on fecundity per individual), but minor uncertainties or limitations are unlikely to have a substantial impact on results.
Low (score = 3)
Significant deficiencies in the reported outcome assessment methodology were identified OR due to incomplete reporting, it was unclear whether methods were sensitive for the outcome of interest. This is likely to have a substantial impact on results.
Unacceptable (score = 4)
The outcome assessment methodology was not reported OR the reported outcome assessment methodology was not sensitive for the outcome(s) of interest (e.g., in the assessment of reproduction in a chronic daphnid test, offspring were not counted and removed until the end of the test, rather than daily). These are serious flaws that make the study unusable.
Not rated/applicablea
Reviewer’s comments [Document concerns, uncertainties, limitations, and deficiencies and any additional comments that may highlight study strengths or important elements such as relevance]
Metric 18. Consistency of outcome assessment Was the outcome assessment carried out consistently (i.e., using the same protocol) across study groups (e.g., assessment at the same time after initial exposure in all study groups)?
High (score = 1)
Details of the outcome assessment protocol were reported and outcomes were assessed consistently across study groups (e.g., at the same time after initial exposure) using the same protocol in all study groups.
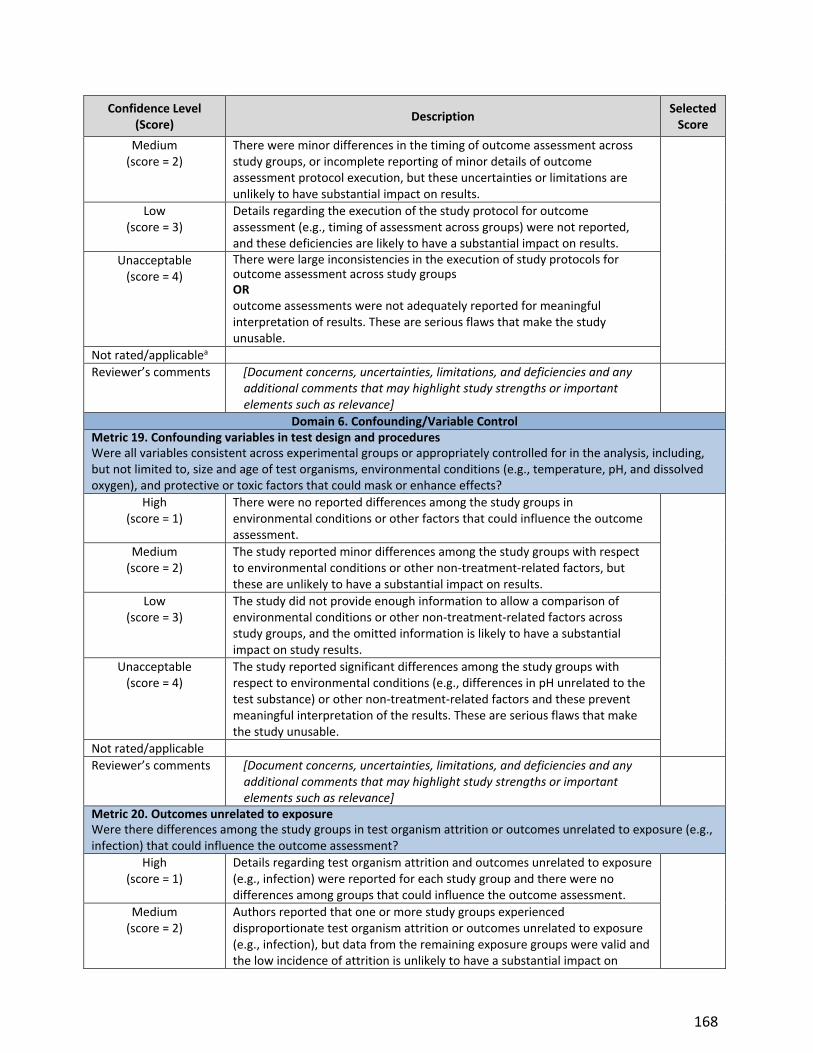
168
Confidence Level (Score)
Description Selected
Score
Medium (score = 2)
There were minor differences in the timing of outcome assessment across study groups, or incomplete reporting of minor details of outcome assessment protocol execution, but these uncertainties or limitations are unlikely to have substantial impact on results.
Low (score = 3)
Details regarding the execution of the study protocol for outcome assessment (e.g., timing of assessment across groups) were not reported, and these deficiencies are likely to have a substantial impact on results.
Unacceptable (score = 4)
There were large inconsistencies in the execution of study protocols for outcome assessment across study groups OR outcome assessments were not adequately reported for meaningful interpretation of results. These are serious flaws that make the study unusable.
Not rated/applicablea
Reviewer’s comments [Document concerns, uncertainties, limitations, and deficiencies and any additional comments that may highlight study strengths or important elements such as relevance]
Domain 6. Confounding/Variable Control Metric 19. Confounding variables in test design and procedures Were all variables consistent across experimental groups or appropriately controlled for in the analysis, including, but not limited to, size and age of test organisms, environmental conditions (e.g., temperature, pH, and dissolved oxygen), and protective or toxic factors that could mask or enhance effects?
High (score = 1)
There were no reported differences among the study groups in environmental conditions or other factors that could influence the outcome assessment.
Medium (score = 2)
The study reported minor differences among the study groups with respect to environmental conditions or other non-treatment-related factors, but these are unlikely to have a substantial impact on results.
Low (score = 3)
The study did not provide enough information to allow a comparison of environmental conditions or other non-treatment-related factors across study groups, and the omitted information is likely to have a substantial impact on study results.
Unacceptable (score = 4)
The study reported significant differences among the study groups with respect to environmental conditions (e.g., differences in pH unrelated to the test substance) or other non-treatment-related factors and these prevent meaningful interpretation of the results. These are serious flaws that make the study unusable.
Not rated/applicable
Reviewer’s comments [Document concerns, uncertainties, limitations, and deficiencies and any additional comments that may highlight study strengths or important elements such as relevance]
Metric 20. Outcomes unrelated to exposure Were there differences among the study groups in test organism attrition or outcomes unrelated to exposure (e.g., infection) that could influence the outcome assessment?
High (score = 1)
Details regarding test organism attrition and outcomes unrelated to exposure (e.g., infection) were reported for each study group and there were no differences among groups that could influence the outcome assessment.
Medium (score = 2)
Authors reported that one or more study groups experienced disproportionate test organism attrition or outcomes unrelated to exposure (e.g., infection), but data from the remaining exposure groups were valid and the low incidence of attrition is unlikely to have a substantial impact on

169
Confidence Level (Score)
Description Selected
Score
results OR data on attrition and/or outcomes unrelated to exposure for each study group were not reported because only substantial differences among groups were noted (as indicated by study authors).
Low (score = 3)
Data on attrition and/or outcomes unrelated to exposure were not reported for each study group, and this deficiency is likely to have a substantial impact on results.
Unacceptable (score = 4)
One or more study groups experienced serious test organism attrition or outcomes unrelated to exposure (e.g., infection). This is a serious flaw that makes the study unusable.
Not rated/applicable
Reviewer’s comments [Document concerns, uncertainties, limitations, and deficiencies and any additional comments that may highlight study strengths or important elements such as relevance]
Domain 7. Data Presentation and Analysis Metric 21. Statistical methods Were statistical methods clearly described and appropriate for dataset(s) (e.g., parametric test for normally distributed data)?
High (score = 1)
Statistical methods were clearly described and appropriate for dataset(s) (e.g., parametric test for normally distributed data). OR no statistical analyses, calculation methods, and/or data manipulation were conducted but sufficient data were provided to conduct an independent statistical analysis.
Medium (score = 2)
Not applicable for this metric
Low (score = 3)
Statistical analysis was not described clearly, and this deficiency is likely to have a substantial impact on results.
Unacceptable score = 4)
Statistical methods used were not appropriate (e.g., parametric test for non-normally distributed data) OR statistical analysis was not conducted AND data enabling an independent statistical analysis were not provided. These are serious flaws that make the study unusable.
Not rated/applicablea
Reviewer’s comments [Document concerns, uncertainties, limitations, and deficiencies and any additional comments that may highlight study strengths or important elements such as relevance]
Metric 22. Reporting of data Were the data for all outcomes presented? Were data reported for each treatment and control group? Were reported data sufficient to determine values for the endpoint(s) of interest (e.g., LOEC, NOEC, LC50, and EC50)?
High (score = 1)
Data for exposure-related findings were presented for each treatment and control group and were adequate to determine values for the endpoint(s) of interest. Negative findings were reported qualitatively or quantitatively.
Medium (score = 2)
Data for exposure-related findings were reported for most, but not all, outcomes by study group and/or data were not reported for outcomes with negative findings, but these minor uncertainties or limitations are unlikely to have a substantial impact on results.
Low Data for exposure-related findings were not shown for each study group, but
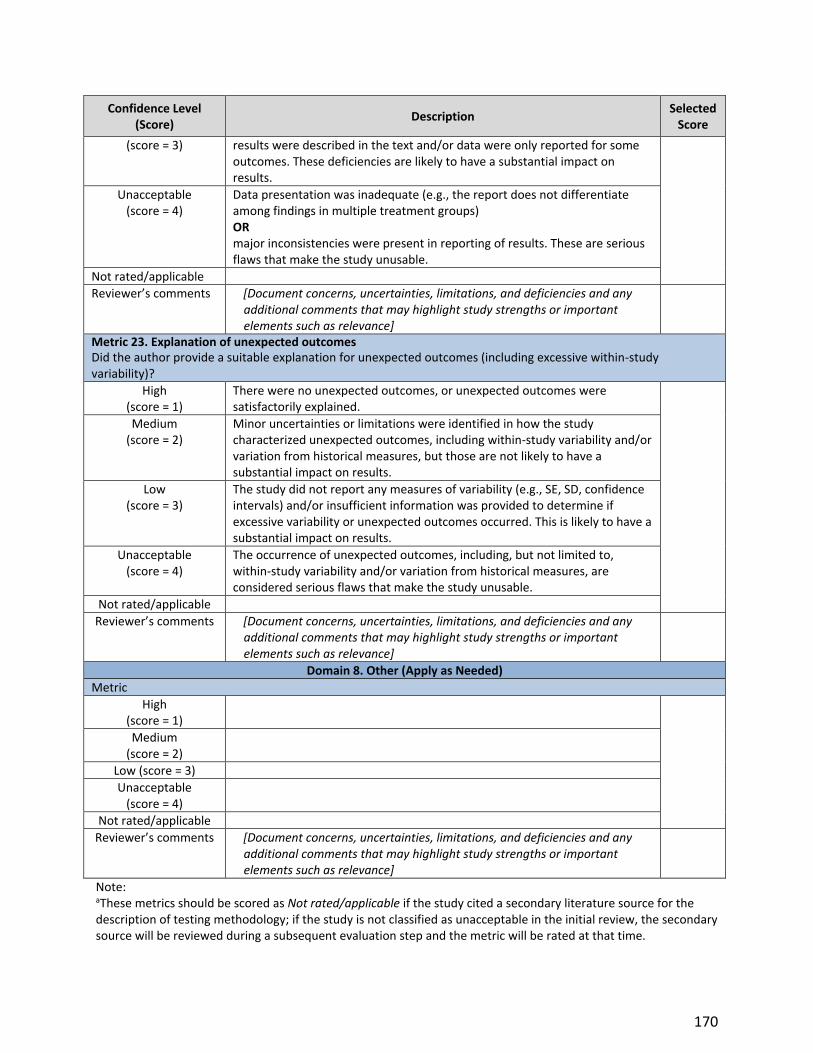
170
Confidence Level (Score)
Description Selected
Score
(score = 3) results were described in the text and/or data were only reported for some outcomes. These deficiencies are likely to have a substantial impact on results.
Unacceptable (score = 4)
Data presentation was inadequate (e.g., the report does not differentiate among findings in multiple treatment groups) OR major inconsistencies were present in reporting of results. These are serious flaws that make the study unusable.
Not rated/applicable
Reviewer’s comments [Document concerns, uncertainties, limitations, and deficiencies and any additional comments that may highlight study strengths or important elements such as relevance]
Metric 23. Explanation of unexpected outcomes Did the author provide a suitable explanation for unexpected outcomes (including excessive within-study variability)?
High (score = 1)
There were no unexpected outcomes, or unexpected outcomes were satisfactorily explained.
Medium (score = 2)
Minor uncertainties or limitations were identified in how the study characterized unexpected outcomes, including within-study variability and/or variation from historical measures, but those are not likely to have a substantial impact on results.
Low (score = 3)
The study did not report any measures of variability (e.g., SE, SD, confidence intervals) and/or insufficient information was provided to determine if excessive variability or unexpected outcomes occurred. This is likely to have a substantial impact on results.
Unacceptable (score = 4)
The occurrence of unexpected outcomes, including, but not limited to, within-study variability and/or variation from historical measures, are considered serious flaws that make the study unusable.
Not rated/applicable
Reviewer’s comments [Document concerns, uncertainties, limitations, and deficiencies and any additional comments that may highlight study strengths or important elements such as relevance]
Domain 8. Other (Apply as Needed)
Metric
High (score = 1)
Medium (score = 2)
Low (score = 3)
Unacceptable (score = 4)
Not rated/applicable
Reviewer’s comments [Document concerns, uncertainties, limitations, and deficiencies and any additional comments that may highlight study strengths or important elements such as relevance]
Note: aThese metrics should be scored as Not rated/applicable if the study cited a secondary literature source for the description of testing methodology; if the study is not classified as unacceptable in the initial review, the secondary source will be reviewed during a subsequent evaluation step and the metric will be rated at that time.

171
F.6 References
1. Cooper, GL, R. Agerstrand, M. Glenn, B. Kraft, A. Luke, A. Ratcliffe, J. (2016). Study sensitivity: Evaluating the ability to detect effects in systematic reviews of chemical exposures. Environ Int. 92-93: 605-610. http://dx.doi.org/10.1016/j.envint.2016.03.017.
2. EC. (2018). ToxRTool - Toxicological data Reliability assessment Tool. https://hero.epa.gov/heronet/index.cfm/reference/download/reference_id/4262819.
3. ECHA. (2011). Guidance on information requirements and chemical safety assessment. Chapter R.3: Information gathering. https://hero.epa.gov/heronet/index.cfm/reference/download/reference_id/4262857.
4. Hartling, LH, M. Milne, A. Vandermeer, B. Santaguida, P. L. Ansari, M. Tsertsvadze, A. Hempel, S. Shekelle, P. Dryden, D. M. (2012). Validity and inter-rater reliability testing of quality assessment instrumentsalidity and inter-rater reliability testing of quality assessment instruments. (AHRQ Publication No. 12-EHC039-EF). Rockville, MD: Agency for Healthcare Research and Quality. https://hero.epa.gov/heronet/index.cfm/reference/download/reference_id/4262864.
5. Hooijmans, CDV, R. Leenaars, M. Ritskes-Hoitinga, M. (2010). The Gold Standard Publication Checklist (GSPC) for improved design, reporting and scientific quality of animal studies GSPC versus ARRIVE guidelines. http://dx.doi.org/10.1258/la.2010.010130.
6. Hooijmans, CRR, M. M. De Vries, R. B. M. Leenaars, M. Ritskes-Hoitinga, M. Langendam, M. W. (2014). SYRCLE’s risk of bias tool for animal studies. BMC Medical Research Methodology. 14(1): 43. http://dx.doi.org/10.1186/1471-2288-14-43.
7. Koustas, EL, J. Sutton, P. Johnson, P. I. Atchley, D. S. Sen, S. Robinson, K. A. Axelrad, D. A. Woodruff, T. J. (2014). The Navigation Guide - Evidence-based medicine meets environmental health: Systematic review of nonhuman evidence for PFOA effects on fetal growth [Review]. Environ Health Perspect. 122(10): 1015-1027. http://dx.doi.org/10.1289/ehp.1307177; https://www.ncbi.nlm.nih.gov/pmc/articles/PMC4181920/pdf/ehp.1307177.pdf.
8. Kushman, MEK, A. D. Guyton, K. Z. Chiu, W. A. Makris, S. L. Rusyn, I. (2013). A systematic approach for identifying and presenting mechanistic evidence in human health assessments. Regul Toxicol Pharmacol. 67(2): 266-277. http://dx.doi.org/10.1016/j.yrtph.2013.08.005; https://www.ncbi.nlm.nih.gov/pmc/articles/PMC3818152/pdf/nihms516764.pdf.
9. Lynch, HNG, J. E. Tabony, J. A. Rhomberg, L. R. (2016). Systematic comparison of study quality criteria. Regul Toxicol Pharmacol. 76: 187-198. https://hero.epa.gov/heronet/index.cfm/reference/download/reference_id/4262904.
10. Moermond, CTK, R. Korkaric, M. Ågerstrand, M. (2016). CRED: Criteria for reporting and evaluating ecotoxicity data. Environ Toxicol Chem. 35(5): 1297-1309. http://dx.doi.org/10.1002/etc.3259.
11. NTP. (2015). Handbook for conducting a literature-based health assessment using OHAT approach for systematic review and evidence integration. U.S. Dept. of Health and Human Services, National Toxicology Program. http://ntp.niehs.nih.gov/pubhealth/hat/noms/index-2.html.
12. Samuel, GOH, S. Wright, R. A. Lalu, M. M. Patlewicz, G. Becker, R. A. Degeorge, G. L. Fergusson, D. Hartung, T. Lewis, R. J. Stephens, M. L. (2016). Guidance on assessing the methodological and reporting quality of toxicologically relevant studies: A scoping review. Environ Int. 92-93: 630-646. https://hero.epa.gov/heronet/index.cfm/reference/download/reference_id/4262966
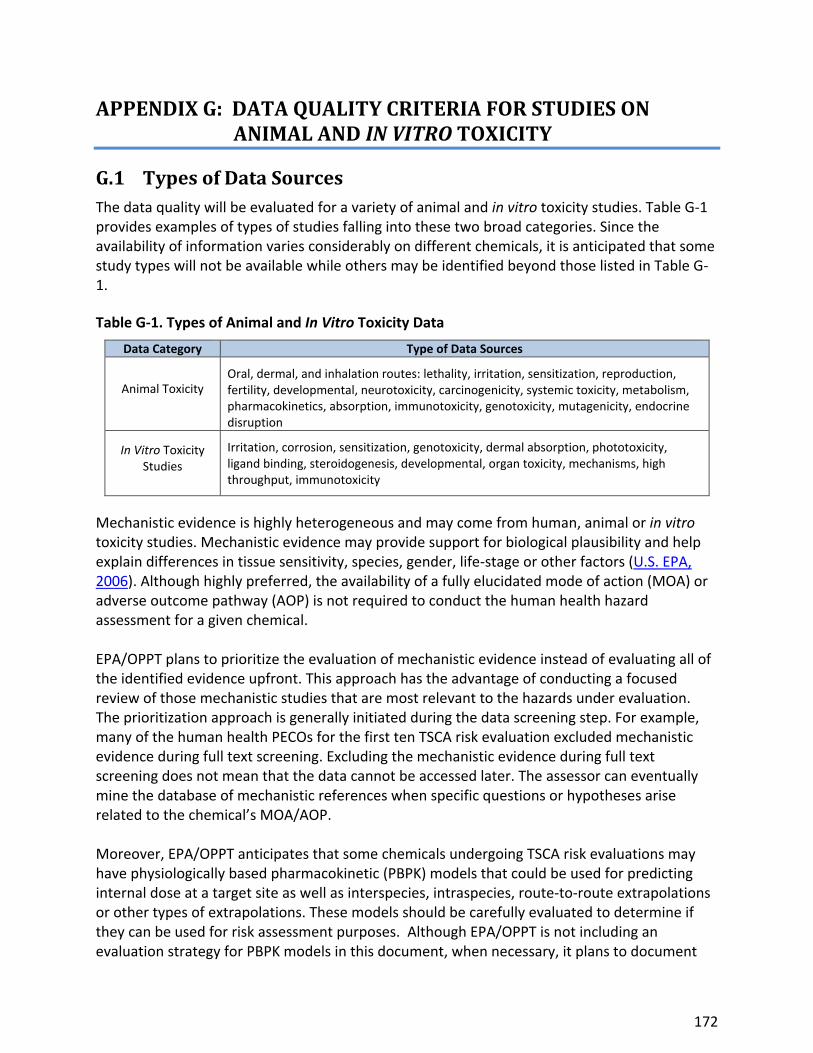
172
APPENDIX G: DATA QUALITY CRITERIA FOR STUDIES ON ANIMAL AND IN VITRO TOXICITY
G.1 Types of Data Sources
The data quality will be evaluated for a variety of animal and in vitro toxicity studies. Table G-1 provides examples of types of studies falling into these two broad categories. Since the availability of information varies considerably on different chemicals, it is anticipated that some study types will not be available while others may be identified beyond those listed in Table G-1.
Table G-1. Types of Animal and In Vitro Toxicity Data
Data Category Type of Data Sources
Animal Toxicity Oral, dermal, and inhalation routes: lethality, irritation, sensitization, reproduction, fertility, developmental, neurotoxicity, carcinogenicity, systemic toxicity, metabolism, pharmacokinetics, absorption, immunotoxicity, genotoxicity, mutagenicity, endocrine disruption
In Vitro Toxicity Studies
Irritation, corrosion, sensitization, genotoxicity, dermal absorption, phototoxicity, ligand binding, steroidogenesis, developmental, organ toxicity, mechanisms, high throughput, immunotoxicity
Mechanistic evidence is highly heterogeneous and may come from human, animal or in vitro toxicity studies. Mechanistic evidence may provide support for biological plausibility and help explain differences in tissue sensitivity, species, gender, life-stage or other factors (U.S. EPA, 2006). Although highly preferred, the availability of a fully elucidated mode of action (MOA) or adverse outcome pathway (AOP) is not required to conduct the human health hazard assessment for a given chemical. EPA/OPPT plans to prioritize the evaluation of mechanistic evidence instead of evaluating all of the identified evidence upfront. This approach has the advantage of conducting a focused review of those mechanistic studies that are most relevant to the hazards under evaluation. The prioritization approach is generally initiated during the data screening step. For example, many of the human health PECOs for the first ten TSCA risk evaluation excluded mechanistic evidence during full text screening. Excluding the mechanistic evidence during full text screening does not mean that the data cannot be accessed later. The assessor can eventually mine the database of mechanistic references when specific questions or hypotheses arise related to the chemical’s MOA/AOP. Moreover, EPA/OPPT anticipates that some chemicals undergoing TSCA risk evaluations may have physiologically based pharmacokinetic (PBPK) models that could be used for predicting internal dose at a target site as well as interspecies, intraspecies, route-to-route extrapolations or other types of extrapolations. These models should be carefully evaluated to determine if they can be used for risk assessment purposes. Although EPA/OPPT is not including an evaluation strategy for PBPK models in this document, when necessary, it plans to document
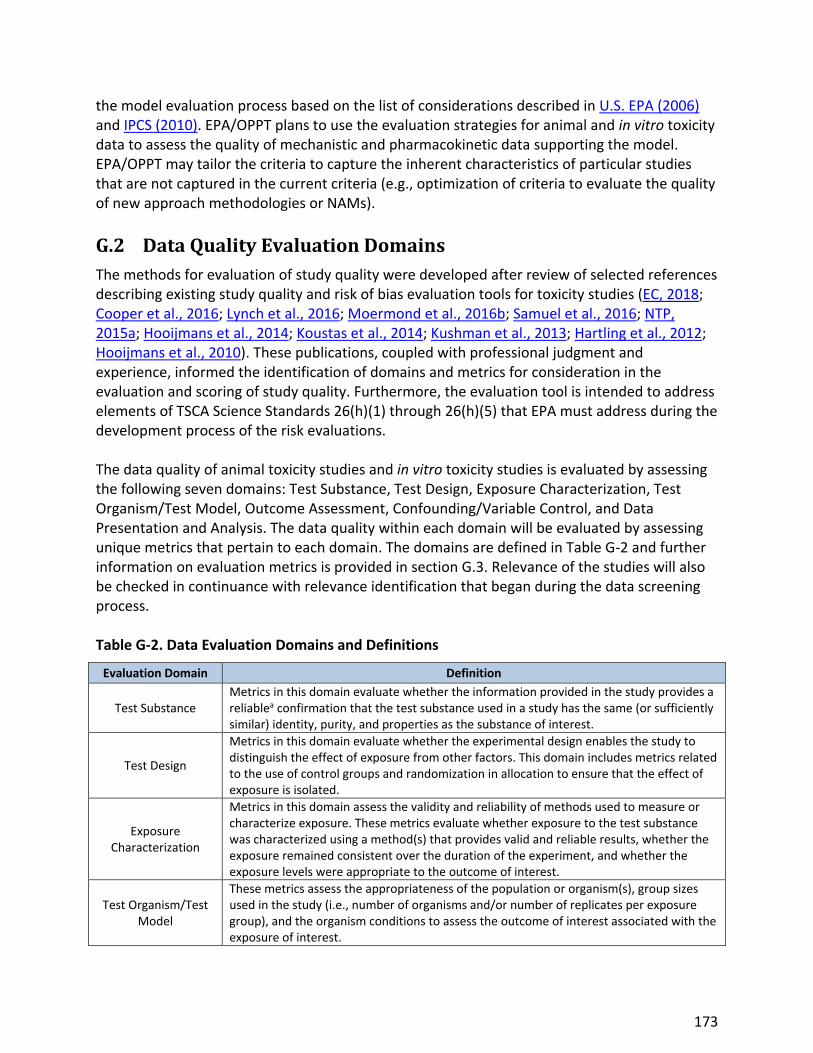
173
the model evaluation process based on the list of considerations described in U.S. EPA (2006) and IPCS (2010). EPA/OPPT plans to use the evaluation strategies for animal and in vitro toxicity data to assess the quality of mechanistic and pharmacokinetic data supporting the model. EPA/OPPT may tailor the criteria to capture the inherent characteristics of particular studies that are not captured in the current criteria (e.g., optimization of criteria to evaluate the quality of new approach methodologies or NAMs).
G.2 Data Quality Evaluation Domains
The methods for evaluation of study quality were developed after review of selected references describing existing study quality and risk of bias evaluation tools for toxicity studies (EC, 2018; Cooper et al., 2016; Lynch et al., 2016; Moermond et al., 2016b; Samuel et al., 2016; NTP, 2015a; Hooijmans et al., 2014; Koustas et al., 2014; Kushman et al., 2013; Hartling et al., 2012; Hooijmans et al., 2010). These publications, coupled with professional judgment and experience, informed the identification of domains and metrics for consideration in the evaluation and scoring of study quality. Furthermore, the evaluation tool is intended to address elements of TSCA Science Standards 26(h)(1) through 26(h)(5) that EPA must address during the development process of the risk evaluations. The data quality of animal toxicity studies and in vitro toxicity studies is evaluated by assessing the following seven domains: Test Substance, Test Design, Exposure Characterization, Test Organism/Test Model, Outcome Assessment, Confounding/Variable Control, and Data Presentation and Analysis. The data quality within each domain will be evaluated by assessing unique metrics that pertain to each domain. The domains are defined in Table G-2 and further information on evaluation metrics is provided in section G.3. Relevance of the studies will also be checked in continuance with relevance identification that began during the data screening process. Table G-2. Data Evaluation Domains and Definitions
Evaluation Domain Definition
Test Substance Metrics in this domain evaluate whether the information provided in the study provides a reliablea confirmation that the test substance used in a study has the same (or sufficiently similar) identity, purity, and properties as the substance of interest.
Test Design
Metrics in this domain evaluate whether the experimental design enables the study to distinguish the effect of exposure from other factors. This domain includes metrics related to the use of control groups and randomization in allocation to ensure that the effect of exposure is isolated.
Exposure Characterization
Metrics in this domain assess the validity and reliability of methods used to measure or characterize exposure. These metrics evaluate whether exposure to the test substance was characterized using a method(s) that provides valid and reliable results, whether the exposure remained consistent over the duration of the experiment, and whether the exposure levels were appropriate to the outcome of interest.
Test Organism/Test Model
These metrics assess the appropriateness of the population or organism(s), group sizes used in the study (i.e., number of organisms and/or number of replicates per exposure group), and the organism conditions to assess the outcome of interest associated with the exposure of interest.

174
Evaluation Domain Definition
Outcome Assessment Metrics in this domain assess the validity and reliability of methods, including sensitivity of methods, that are used to measure or otherwise characterize the outcome(s) of interest.
Confounding/Variable Control
Metrics in this domain assess the potential impact of factors other than exposure that may affect the risk of outcome. The metrics evaluate whether studies identify and account for factors that are related to exposure and independently related to outcome (confounding factors) and whether appropriate experimental or analytical (statistical) methods are used to control for factors unrelated to exposure that may affect the risk of outcome (variable control).
Data Presentation and Analysis
Metrics in this domain assess whether appropriate statistical methods were used and if data for all outcomes are presented.
Other Metrics in this domain are added as needed to incorporate chemical- or study-specific evaluations.
Note: a Reliability is defined as “the inherent property of a study or data, which includes the use of well-founded scientific approaches, the avoidance of bias within the study or data collection design and faithful study or data collection conduct and documentation” (ECHA, 2011a).
G.3 Data Quality Evaluation Metrics
The data quality evaluation domains are evaluated by assessing unique metrics that have been developed for animal and in vitro studies. Each metric is binned into a confidence level of High, Medium, Low, or Unacceptable. Each confidence level is assigned a numerical score (i.e., 1 through 4) that is used in the method of assessing the overall quality of the study. Table G-3 lists the data evaluation domains and metrics for animal toxicity studies including metrics that inform risk of bias and types of bias, and Table G-4 lists the data evaluation domains and metrics for in vitro toxicity studies. Each domain has between 2 and 6 metrics; however, some metrics may not apply to all study types. A general domain for other considerations is available for metrics that are specific to a given test substance or study type. EPA may modify the metrics used for animal toxicity and in vitro toxicity studies as the Agency acquires experience with the evaluation tool. Any modifications will be documented.
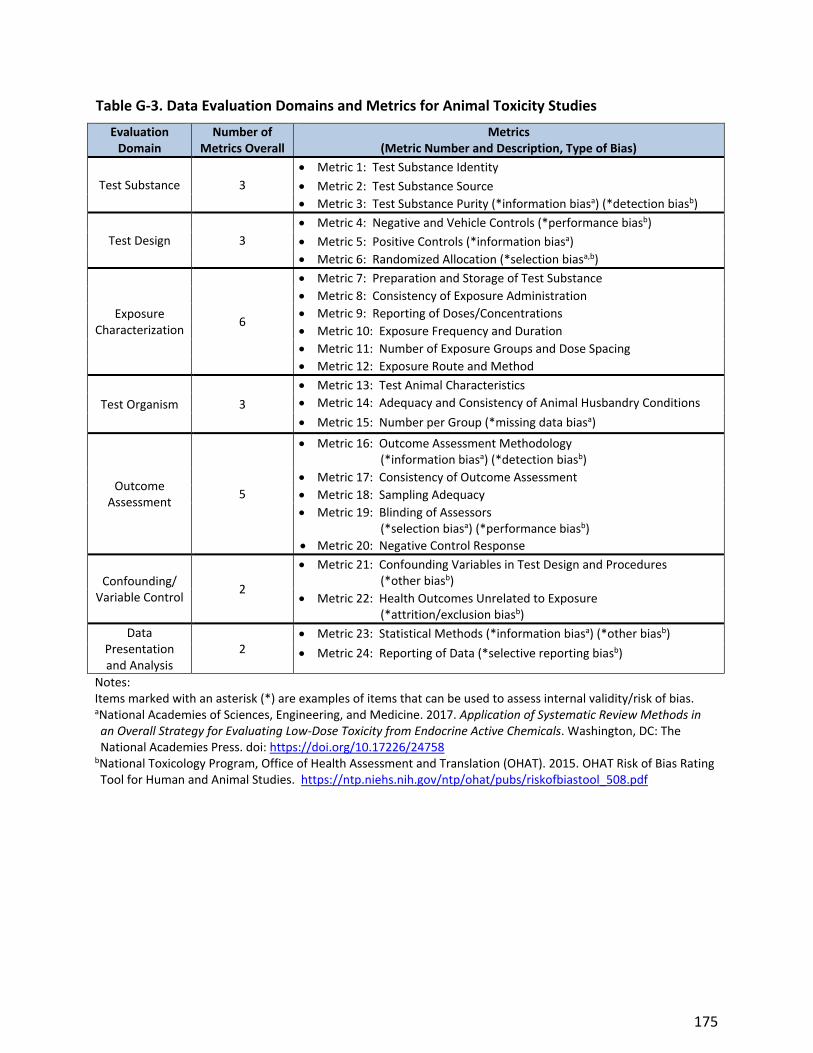
175
Table G-3. Data Evaluation Domains and Metrics for Animal Toxicity Studies
Evaluation Domain
Number of Metrics Overall
Metrics (Metric Number and Description, Type of Bias)
Test Substance 3
Metric 1: Test Substance Identity
Metric 2: Test Substance Source
Metric 3: Test Substance Purity (*information biasa) (*detection biasb)
Test Design 3
Metric 4: Negative and Vehicle Controls (*performance biasb)
Metric 5: Positive Controls (*information biasa)
Metric 6: Randomized Allocation (*selection biasa,b)
Exposure Characterization
6
Metric 7: Preparation and Storage of Test Substance
Metric 8: Consistency of Exposure Administration
Metric 9: Reporting of Doses/Concentrations
Metric 10: Exposure Frequency and Duration
Metric 11: Number of Exposure Groups and Dose Spacing
Metric 12: Exposure Route and Method
Test Organism 3
Metric 13: Test Animal Characteristics
Metric 14: Adequacy and Consistency of Animal Husbandry Conditions
Metric 15: Number per Group (*missing data biasa)
Outcome Assessment
5
Metric 16: Outcome Assessment Methodology (*information biasa) (*detection biasb)
Metric 17: Consistency of Outcome Assessment
Metric 18: Sampling Adequacy
Metric 19: Blinding of Assessors (*selection biasa) (*performance biasb)
Metric 20: Negative Control Response
Confounding/ Variable Control
2
Metric 21: Confounding Variables in Test Design and Procedures (*other biasb)
Metric 22: Health Outcomes Unrelated to Exposure (*attrition/exclusion biasb)
Data Presentation and Analysis
2 Metric 23: Statistical Methods (*information biasa) (*other biasb)
Metric 24: Reporting of Data (*selective reporting biasb)
Notes: Items marked with an asterisk (*) are examples of items that can be used to assess internal validity/risk of bias. aNational Academies of Sciences, Engineering, and Medicine. 2017. Application of Systematic Review Methods in an Overall Strategy for Evaluating Low-Dose Toxicity from Endocrine Active Chemicals. Washington, DC: The National Academies Press. doi: https://doi.org/10.17226/24758
bNational Toxicology Program, Office of Health Assessment and Translation (OHAT). 2015. OHAT Risk of Bias Rating Tool for Human and Animal Studies. https://ntp.niehs.nih.gov/ntp/ohat/pubs/riskofbiastool_508.pdf
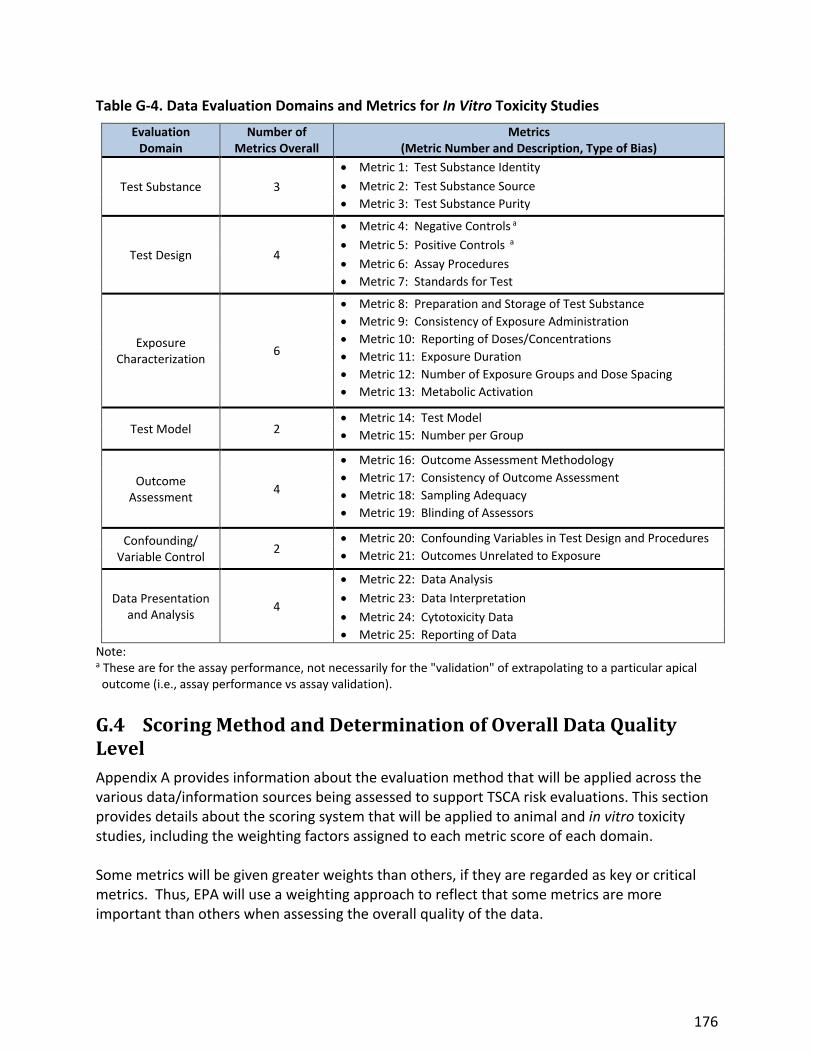
176
Table G-4. Data Evaluation Domains and Metrics for In Vitro Toxicity Studies
Evaluation Domain
Number of Metrics Overall
Metrics (Metric Number and Description, Type of Bias)
Test Substance 3
Metric 1: Test Substance Identity
Metric 2: Test Substance Source
Metric 3: Test Substance Purity
Test Design 4
Metric 4: Negative Controls a
Metric 5: Positive Controls a
Metric 6: Assay Procedures
Metric 7: Standards for Test
Exposure Characterization
6
Metric 8: Preparation and Storage of Test Substance
Metric 9: Consistency of Exposure Administration
Metric 10: Reporting of Doses/Concentrations
Metric 11: Exposure Duration
Metric 12: Number of Exposure Groups and Dose Spacing
Metric 13: Metabolic Activation
Test Model 2 Metric 14: Test Model
Metric 15: Number per Group
Outcome Assessment
4
Metric 16: Outcome Assessment Methodology
Metric 17: Consistency of Outcome Assessment
Metric 18: Sampling Adequacy
Metric 19: Blinding of Assessors
Confounding/ Variable Control
2 Metric 20: Confounding Variables in Test Design and Procedures
Metric 21: Outcomes Unrelated to Exposure
Data Presentation and Analysis
4
Metric 22: Data Analysis
Metric 23: Data Interpretation
Metric 24: Cytotoxicity Data
Metric 25: Reporting of Data
Note: a These are for the assay performance, not necessarily for the "validation" of extrapolating to a particular apical outcome (i.e., assay performance vs assay validation).
G.4 Scoring Method and Determination of Overall Data Quality Level
Appendix A provides information about the evaluation method that will be applied across the various data/information sources being assessed to support TSCA risk evaluations. This section provides details about the scoring system that will be applied to animal and in vitro toxicity studies, including the weighting factors assigned to each metric score of each domain. Some metrics will be given greater weights than others, if they are regarded as key or critical metrics. Thus, EPA will use a weighting approach to reflect that some metrics are more important than others when assessing the overall quality of the data.

177
G.4.1 Weighting Factors
Each metric was assigned a weighting factor of 1 or 2, with the higher weighting factor (2) given to metrics deemed critical for the evaluation. The critical metrics were identified based on professional judgment in conjunction with consideration of the factors that are most frequently included in other study quality/risk of bias tools for animal toxicity studies [reviewed by Lynch et al. (2016); Samuel et al. (2016)]. In selecting critical metrics, EPA recognized that the relevance of an individual study to the risk analysis for a given substance is determined by its ability to inform hazard identification and/or dose-response assessment. Thus, the critical metrics are those that determine how well a study answers these key questions:
Is a change in health outcome demonstrated in the study?
Is the observed change more likely than not attributable to the substance exposure?
At what substance dose(s) does the change occur?
EPA/OPPT assigned a weighting factor of 2 to each metric considered critical to answering these questions. Remaining metrics were assigned a weighting factor of 1. Tables G-5 and G-6 identify the critical metrics (i.e., those assigned a weighting factor of 2) for animal toxicity and in vitro toxicity studies, respectively, and provides a rationale for selection of each metric. Tables G-7 and G-8 identify the weighting factors assigned to each metric for animal toxicity and in vitro toxicity studies, respectively. Table G-5. Animal Toxicity Metrics with Greater Importance in the Evaluation and Rationale
for Selection
Domain Critical Metrics with
Weighting Factor of 2 (Metric Number) a
Rationale
Test substance Test substance identity
(Metric 1) The test substance must be identified and characterized definitively to ensure that the study is relevant to the substance of interest.
Test design Negative and vehicle
controls (Metric 4)
A concurrent negative control and vehicle control (when indicated) are required to ensure that any observed effects are attributable to substance exposure. Note that more than one negative control may be necessary in some studies.
Exposure characterization
Reporting of doses/concentrations
(Metric 9)
Dose levels must be defined without ambiguity to allow for determination of the dose-response relationship and to enable valid comparisons across studies.
Test organisms Test animal
characteristics (Metric 13)
The test animal characteristics must be reported to enable assessment of a) whether they are suitable for the endpoint of interest; b) whether there are species, strain, sex, or age/lifestage differences within or between different studies; and c) to enable consideration of approaches for extrapolation to humans.
Outcome assessment
Outcome assessment methodology (Metric 16)
The methods used for outcome assessment must be fully described, valid, and sensitive to ensure that effects are detected, that observed effects are true, and to enable valid comparisons across studies.
Confounding/ variable control
Confounding variables in test design and
procedures (Metric 21)
Control for confounding variables in test design and procedures is necessary to ensure that any observed effects are attributable to substance exposure and not to other factors.
Data presentation and
analysis
Reporting of data (Metric 24)
Detailed results are necessary to determine if the study authors’ conclusions are valid and to enable dose-response modeling.
Note: aA weighting factor of 1 is assigned for the remaining metrics.

178
Table G-6. In Vitro Toxicity Metrics with Greater Importance in the Evaluation and Rationale for Selection
Domain Critical Metrics with
Weighting Factor of 2 (Metric Number) a
Rationale
Test Substance Test Substance Identity
(Metric 1)
The test substance must be identified and characterized definitively to ensure that the study is relevant to the substance of interest.
Test Design
Negative and Vehicle Controls (Metric 4)
A concurrent negative control and vehicle control (when indicated) are required for comparison of results between exposed and unexposed models to allow determination of treatment-related effects.
Positive Controls (Metric 5)
A concurrent positive control or proficiency control (when applicable) is required to determine if the chemical of interest produces the intended outcome for the study type.
Exposure Characterization
Reporting of concentrations (Metric 10)
Dose levels must be defined without ambiguity to allow for determination of an accurate dose-response relationship or and to ensure valid comparisons across studies.
Exposure duration (Metric 11)
The exposure duration during the study must be defined to accurately assess potential risk.
Test Model Test Model (Metric 14)
The identity of the test model must be reported and suitable for the evaluation of outcome(s) of interest.
Outcome Assessment
Outcome assessment methodology (Metric 16)
The methods used for outcome assessment must be fully described, valid, and sensitive to ensure that effects are detected and that observed effects are true.
Sampling adequacy (Metric 18)
The number of samples evaluated must be sufficient to allow data interpretation and analysis.
Confounding/Variable Control
Confounding variables in test design and procedures
(Metric 20)
Control for confounding variables in test design and procedures are necessary to ensure that any observed effects are attributable to substance exposure and not to other factors.
Data Presentation and Analysis
Data interpretation (Metric 23)
The criteria for scoring and/or evaluation criteria are necessary so that the correct categorization (e.g., positive, negative, equivocal) can be determined for the chemical of interest.
Reporting of data (Metric 25)
Detailed results are necessary to determine if the study authors’ conclusions are valid and to enable dose-response modeling.
Note: a A weighting factor of 1 is assigned for the remaining metrics.
179
G.4.2 Calculation of Overall Study Score
A confidence level (1, 2, or 3 for High, Medium, or Low confidence, respectively) is assigned for each relevant metric within each domain. To determine the overall study score, the first step is to multiply the score for each metric (1, 2, or 3 for High, Medium, or Low confidence, respectively) by the appropriate weighting factor (as shown in Tables G-7 and G-8 for animal toxicity and in vitro studies, respectively) to obtain a weighted metric score. The weighted metric scores are then summed and divided by the sum of the weighting factors (for all metrics that are scored) to obtain an overall study score between 1 and 3. The equation for calculating the overall score is shown below:
Overall Score (range of 1 to 3) = ∑ (Metric Score x Weighting Factor)/∑(Weighting Factors)
Some metrics may not be applicable to all study types. These metrics will not be included in the nominator or denominator of the equation above. The overall score will be calculated using only those metrics that receive a numerical score. Scoring examples for animal toxicity and in vitro toxicity studies are in tables G-9 through G-12. Studies with any single metric scored as unacceptable (score = 4) will be automatically assigned an overall quality score of 4 (Unacceptable). An unacceptable score means that serious flaws are noted in the domain metric that consequently make the data unusable. If a metric is not applicable for a study type, the serious flaws would not be applicable for that metric and would not receive a score. EPA/OPPT plans to use data with an overall quality level of High, Medium, or Low confidence to quantitatively or qualitatively support the risk evaluations, but does not plan to use data rated as Unacceptable. An overall study score will not be calculated when a serious flaw is identified for any metric. If a publication reports more than one study or endpoint, each study and, as needed, each endpoint will be evaluated separately. Detailed tables showing quality criteria for the metrics are provided in Tables G-13 through G-16 for animal toxicity and in vitro toxicity studies, including a table that summarizes the serious flaws that would make the data unacceptable for use in the environmental hazard assessment

180
Table G-7. Metric Weighting Factors and Range of Weighted Metric Scores for Animal Toxicity Studies
Domain Number/ Description
Metric Number/Description Range of
Metric Scoresa
Metric Weighting
Factor
Range of Weighted
Metric Scoresb
1. Test Substance
1. Test Substance Identity
1 to 3
2 2 to 6
2. Test Substance Source 1 1 to 3
3. Test Substance Purity 1 1 to 3
2. Test Design
4. Negative and Vehicle Controls 2 2 to 6
5. Positive Controls 1 1 to 3
6. Randomized Allocation 1 1 to 3
3. Exposure Characterization
7. Preparation and Storage of Test Substance 1 1 to 3
8. Consistency of Exposure Administration 1 1 to 3
9. Reporting of Doses/Concentrations 2 2 to 6
10. Exposure Frequency and Duration 1 1 to 3
11. Number of Exposure Groups and Dose Spacing 1 1 to 3
12. Exposure Route and Method 1 1 to 3
4. Test Organisms
13. Test Animal Characteristics 2 2 to 6
14. Adequacy and Consistency of Animal Husbandry Conditions
1 1 to 3
15. Number per Group 1 1 to 3
5. Outcome Assessment
16. Outcome Assessment Methodology 2 2 to 6
17. Consistency of Outcome Assessment 1 1 to 3
18. Sampling Adequacy 1 1 to 3
19. Blinding of Assessors 1 1 to 3
20. Negative Control Response 1 1 to 3
6. Confounding/ Variable Control
21. Confounding Variables in Test Design and Procedures
2 2 to 6
22. Health Outcomes Unrelated to Exposure 1 1 to 3
7. Data Presentation and Analysis
23. Statistical Methods 1 1 to 3
24. Reporting of Data 2 2 to 6
Sum (if all metrics scored) c 31 31 to 93
Range of Overall Scores, where Overall Score = Sum of Weighted Scores/Sum of Metric Weighting Factor
31/31=1; 93/31=3
Range of overall
score = 1 to 3d
Notes: a For the purposes of calculating an overall study score, the range of possible metric scores is 1 to 3 for each metric,
corresponding to high and low confidence. No calculations will be conducted if a study receives an “unacceptable” rating (score of “4”) for any metric.
b The range of weighted scores for each metric is calculated by multiplying the range of metric scores (1 to 3) by the weighting factor for that metric.
c The sum of weighting factors and the sum of the weighted scores will differ if some metrics are not scored (not applicable).
d The range of possible overall scores is 1 to 3. If a study receives a score of 1 for every metric, then the overall study score will be 1. If a study receives a score of 3 for every metric, then the overall study score will be 3.

181
Table G-8. Metric Weighting Factors and Range of Weighted Metric Scores for In Vitro Toxicity Studies
Domain Number/ Description
Metric Number/Description
Range of
Metric Scoresa
Metric Weighting
Factor
Range of Weighted
Metric Scoresb
1. Test Substance
1. Test Substance Identity
1 to 3
2 2 to 6
2. Test Substance Source 1 1 to 3
3. Test Substance Purity 1 1 to 3
2. Test Design
4. Negative and Vehicle Controls 2 2 to 6
5. Positive Controls 2 2 to 6
6. Assay Procedures 1 1 to 3
7. Standards for Test 1 1 to 3
3. Exposure Characterization
8. Preparation and Storage of Test Substance 1 1 to 3
9. Consistency of Exposure Administration 1 1 to 3
10. Reporting of Concentrations 2 2 to 6
11. Exposure Duration 2 2 to 6
12. Number of Exposure Groups and Dose Spacing 1 1 to 3
13. Metabolic Activation 1 1 to 3
4. Test model 14. Test Model 2 2 to 6
15. Number per Group 1 1 to 3
5. Outcome Assessment
16. Outcome Assessment Methodology 2 2 to 6
17. Consistency of Outcome Assessment 1 1 to 3
18. Sampling Adequacy 2 2 to 6
19. Blinding of Assessors 1 1 to 3
6. Confounding/ Variable Control
20. Confounding Variables in Test design and Procedures
2 2 to 6
21. Outcomes Unrelated to Exposure 1 1 to 3
7. Data Presentation and Analysis
22. Data Analysis 1 1 to 3
23. Data Interpretation 2 2 to 6
24. Cytotoxicity Data 1 1 to 3
25. Reporting of Data 2 2 to 6
Sum (if all metrics scored) c 36 36 - 108
Range of Overall Scores, where Overall Score = Sum of Weighted Scores/Sum of Metric Weighting Factor
36/36=1; 108/36=3
Range of overall score = 1 to 3d
Notes: a For the purposes of calculating an overall study score, the range of possible metric scores is 1 to 3 for each metric,
corresponding to high and low confidence. No calculations will be conducted if a study receives an “unacceptable” rating (score of “4”) for any metric.
b The range of weighted scores for each metric is calculated by multiplying the range of metric scores (1 to 3) by the weighting factor for that metric.
c The sum of weighting factors and the sum of the weighted scores will differ if some metrics are not scored (not applicable).
d The range of possible overall scores is 1 to 3. If a study receives a score of 1 for every metric, then the overall study score will be 1. If a study receives a score of 3 for every metric, then the overall study score will be 3.

182
Table G-9. Scoring Example for Animal Toxicity Study with all Metrics Scored
Domain Metric Metric Score
Metric Weighting Factor
Weighted Score
Test substance 1. Test substance identity 2 2 4
2. Test substance source 3 1 3
3. Test substance purity 2 1 2
Test design 4. Negative and vehicle controls 1 2 2
5. Positive controls 2 1 2
6. Randomized allocation 3 1 3
Exposure characterization
7. Preparation and storage of test substance 2 1 2
8. Consistency of exposure administration 2 1 2
9. Reporting of doses/concentrations 1 2 2
10. Exposure frequency and duration 2 1 2
11. Number of exposure groups and dose spacing 1 1 1 12. Exposure route and method 1 1 1
Test organisms 13. Test animal characteristics 2 2 4 14. Consistency of animal conditions 2 1 2
15. Number per group 1 1 1
Outcome assessment
16. Outcome assessment methodology 2 2 4
17. Consistency of outcome assessment 3 1 3
18. Sampling adequacy 2 1 2 19. Blinding of assessors 3 1 3 20. Negative control responses 2 1 2
Confounding/variable control 21. Confounding variables in test design and procedures 2 2 4
22. Health outcomes unrelated to exposure 2 1 2
Data presentation and analysis 23. Statistical methods 2 1 2
24. Reporting of data 2 2 4
NR= not rated/not applicable Sum of scores
31 59
Overall Study Score 1.9 = Medium
Overall Score = Sum of Weighted Scores/Sum of Metric Weighting Factors

183
Table G-10. Scoring Example for Animal Toxicity Study with Some Metrics Not Rated/Not Applicable
Domain Metric Metric Score
Metric Weighting Factor
Weighted Score
Test substance
1. Test substance identity 2 2 4
2. Test substance source 3 1 3
3. Test substance purity 2 1 2
Test design
4. Negative and vehicle controls 1 2 2
5. Positive controls NR 6. Randomized allocation 3 1 3
Exposure characterization
7. Preparation and storage of test substance 2 1 2
8. Consistency of exposure administration NR 9. Reporting of doses/concentrations 1 2 2
10. Exposure frequency and duration 2 1 2
11. Number of exposure groups and dose spacing 1 1 1
12. Exposure route and method 1 1 1
Test organisms
13. Test animal characteristics 2 2 4
14. Consistency of animal conditions 2 1 2
15. Number per group 1 1 1
Outcome assessment
16. Outcome assessment methodology 2 2 4
17. Consistency of outcome assessment NR 18. Sampling adequacy 2 1 2
19. Blinding of assessors NR 20. Negative control responses 2 1 2
Confounding/variable control 21. Confounding variables in test design and procedures 2 2 4
22. Health outcomes unrelated to exposure 2 1 2
Data presentation and analysis
23. Statistical methods 2 1 2
24. Reporting of data 2 2 4
NR= not rated/not applicable Sum
27 49
Overall Study Score 1.8 = Medium
Overall Score = Sum of Weighted Scores/Sum of Metric Weighting Factor

184
Table G-11. Scoring Example for In Vitro Study with all Metrics Scored
Domain Metric Metric Score Metric Weighting
Factor Weighted
Score
Test substance 1. Test substance identity 1 2 2
2. Test substance source 2 1 2
3. Test substance purity 2 1 2
Test design 4. Negative controls 1 2 2
5. Positive controls 1 2 2
6. Assay procedures 2 1 2
7. Standards for test 3 1 3
Exposure characterization 8. Preparation and storage of test substance 2 1 2
9. Consistency of exposure administration 2 1 2
10. Reporting of concentrations 1 2 2
11. Exposure duration 1 2 2
12. Number of exposure groups and dose spacing 1 1 1
13. Metabolic activation 3 1 3
Test Model 14. Test model 2 2 4
15. Number per group 2 1 2
Outcome assessment 16. Outcome assessment methodology 3 2 6
17. Consistency of outcome assessment 2 1 2
18. Sampling adequacy 1 2 2
19. Blinding of assessors 2 1 2
Confounding/variable control 20. Confounding variables in test design and procedures 3 2 6
21. Outcomes unrelated to exposure 2 1 2
Data presentation and analysis 22. Data analysis 1 1 1
23. Data interpretation 2 2 4
24. Cytotoxicity data 2 1 2
25. Reporting of data 3 2 6
NR= not rated/not applicable Sum
36 66
Overall Study Score 1.8 = Medium
Overall Score = Sum of Weighted Scores/Sum of Metric Weighting Factor

185
Table G-12. Scoring Example for In Vitro Study with Some Metrics Not Rated/Not Applicable
Domain Metric Metric Score Metric Weighting
Factor Weighted
Score
Test substance 1. Test substance identity 1 2 2
2. Test substance source 2 1 2
3. Test substance purity 2 1 2
Test design 4. Negative controls 1 2 2
5. Positive controls 1 2 2
6. Assay procedures 2 1 2
7. Standards for test 3 1 3
Exposure characterization 8. Preparation and storage of test substance NR
9. Consistency of exposure administration 2 1 2
10. Reporting of concentrations 1 2 2
11. Exposure duration 1 2 2
12. Number of exposure groups and dose spacing 1 1 1
13. Metabolic activation NR
Test Model 14. Test model 2 2 4
15. Number per group 3 1 3
Outcome assessment 16. Outcome assessment methodology 3 2 6
17. Consistency of outcome assessment 2 1 2
18. Sampling adequacy 1 2 2
19. Blinding of assessors NR
Confounding/variable control 20. Confounding variables in test design and procedures 3 2 6
21. Outcomes unrelated to exposure 2 1 2
Data presentation and analysis 22. Data analysis 1 1 1
23. Data interpretation 2 2 4
24. Cytotoxicity data NR
25. Reporting of data 3 2 6
NR= not rated/not applicable Sum
32 58
Overall Study Score 1.8 = Medium
Overall Score = Sum of Weighted Scores/Sum of Metric Weighting Factor

186
G.5 Data Quality Criteria
G.5.1 Animal Toxicity Studies
Optimization of the list of serious flaws may occur after pilot calibration exercises. Table G-13. Serious Flaws that Would Make Animal Toxicity Studies Unacceptable
Domain Metric Description of Serious Flaw(s) in Data Source
Test substance
Test substance identity
The test substance identity and form (the latter if applicable) cannot be determined from the information provided (e.g., nomenclature was unclear and CASRN or structure were not reported) OR for mixtures, the components and ratios were not characterized.
Test substance source
The test substance was not obtained from a manufacturer OR if synthesized or extracted, analytical verification of the test substance was not conducted.
Test substance purity The nature and quantity of reported impurities were such that study results were likely to be due to one or more of the impurities.
Test design
Negative and vehicle controls
A concurrent negative control group was not included or reported OR the reported negative control group was not appropriate (e.g., age/ weight of animals differed between control and treated groups).
Positive controls
For study types that require a concurrent positive control group: When applicable, an appropriate concurrent positive control (i.e., inducing a positive response) was not used and its omission is a serious flaw that makes the study unusable.
Randomized allocation of animals
The study reported using a biased method to allocate animals to study groups (e.g., judgement of investigator).
Exposure characterization
Preparation and storage of test substance
Information on preparation and storage was not reported OR serious flaws reported with test substance preparation and/or storage conditions will have critical impacts on dose/concentration estimates and make the study unusable (e.g., instability of test substance in exposure medium was reported, or there was heterogeneous distribution of test substance in exposure matrix [e.g., aerosol deposition in exposure chamber, insufficient mixing of dietary matrix]). For inhalation studies, there was no mention of the method and equipment used to generate the test substance, or the method used is atypical and inappropriate.

187
Domain Metric Description of Serious Flaw(s) in Data Source
Consistency of exposure administration
Critical exposure details (e.g., methods for generating atmosphere in inhalation studies) were not reported OR reported information indicated that exposures were not administered consistently across study groups (e.g., differing particle size), resulting in serious flaws that make the study unusable.
Reporting of doses/concentrations
The reported exposure levels could not be validated (e.g., lack of food or water intake data for dietary or water exposures in conjunction with evidence of palatability differences, lack of body weight data in conjunction with qualitative evidence for body weight differences across groups, inconsistencies in reporting, etc.). For inhalation studies, actual concentrations not reported along with animal responses (or lack of responses) that indicate exposure problems due to faulty test substance generation. Animals were exposed to an aerosol but no particle size data were reported.
Exposure frequency and duration
The exposure frequency or duration of exposure were not reported OR the reported exposure frequency and duration were not suited to the study type and/or outcome(s) of interest (e.g., study length inadequate to evaluate tumorigenicity).
Number of exposure groups and dose/concentration
spacing
The number of exposure groups and spacing were not reported OR dose groups and spacing were not relevant for the assessment (e.g., all doses in a developmental toxicity study produced overt maternal toxicity).
Exposure route and method
The route or method of exposure was not reported OR an inappropriate route or method (e.g., administration of a volatile organic compound via the diet) was used for the test substance without taking steps to correct the problem (e.g., mixing fresh diet, replacing air in static chambers). For inhalation studies, there is no description of the inhalation chamber used, or an atypical exposure method was used, such as allowing a container of test substance to evaporate in a room.
Test organisms
Test animal characteristics
The test animal species was not reported OR the test animal (species, strain, sex, life-stage, source) was not appropriate for the evaluation of the specific outcome(s) of interest (e.g., genetically modified animals, strain was uniquely susceptible or resistant to one or more outcome of interest).
Adequacy and consistency of animal husbandry conditions
There were significant differences in husbandry conditions between control and exposed groups (e.g., temperature, humidity, light-dark cycle) OR
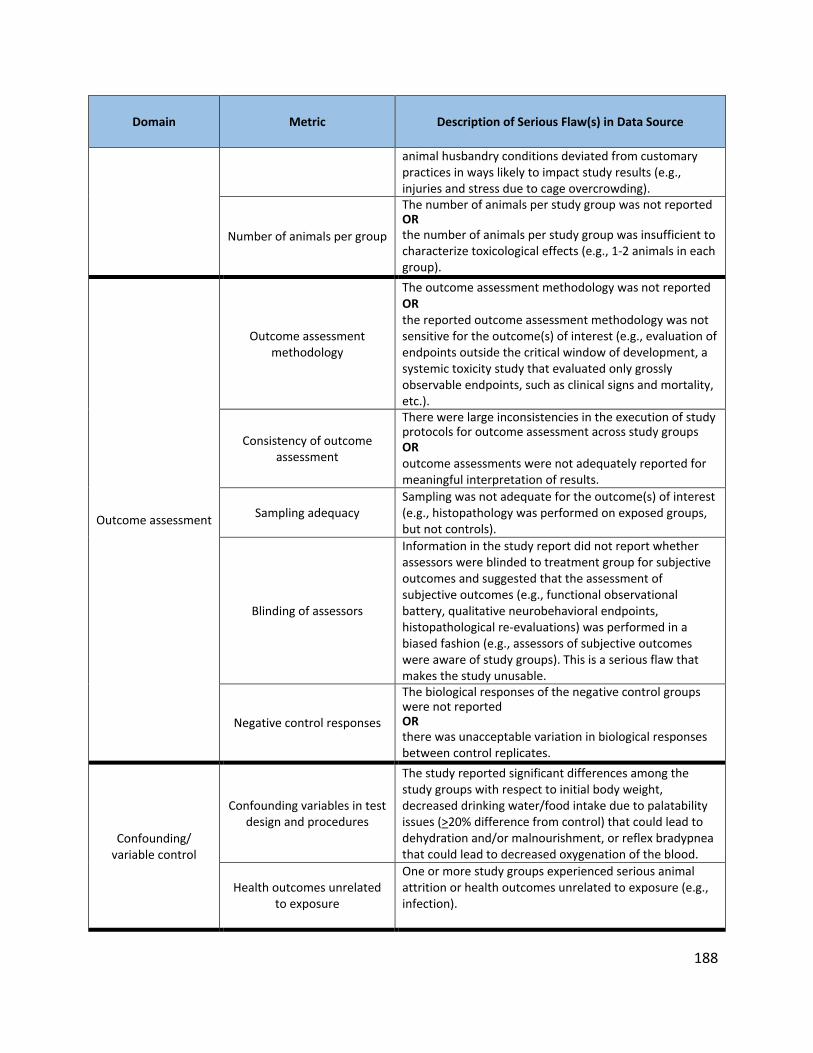
188
Domain Metric Description of Serious Flaw(s) in Data Source
animal husbandry conditions deviated from customary practices in ways likely to impact study results (e.g., injuries and stress due to cage overcrowding).
Number of animals per group
The number of animals per study group was not reported OR the number of animals per study group was insufficient to characterize toxicological effects (e.g., 1-2 animals in each group).
Outcome assessment
Outcome assessment methodology
The outcome assessment methodology was not reported OR the reported outcome assessment methodology was not sensitive for the outcome(s) of interest (e.g., evaluation of endpoints outside the critical window of development, a systemic toxicity study that evaluated only grossly observable endpoints, such as clinical signs and mortality, etc.).
Consistency of outcome assessment
There were large inconsistencies in the execution of study protocols for outcome assessment across study groups OR outcome assessments were not adequately reported for meaningful interpretation of results.
Sampling adequacy Sampling was not adequate for the outcome(s) of interest (e.g., histopathology was performed on exposed groups, but not controls).
Blinding of assessors
Information in the study report did not report whether assessors were blinded to treatment group for subjective outcomes and suggested that the assessment of subjective outcomes (e.g., functional observational battery, qualitative neurobehavioral endpoints, histopathological re-evaluations) was performed in a biased fashion (e.g., assessors of subjective outcomes were aware of study groups). This is a serious flaw that makes the study unusable.
Negative control responses
The biological responses of the negative control groups were not reported OR there was unacceptable variation in biological responses between control replicates.
Confounding/variable control
Confounding variables in test design and procedures
The study reported significant differences among the study groups with respect to initial body weight, decreased drinking water/food intake due to palatability issues (>20% difference from control) that could lead to dehydration and/or malnourishment, or reflex bradypnea that could lead to decreased oxygenation of the blood.
Health outcomes unrelated to exposure
One or more study groups experienced serious animal attrition or health outcomes unrelated to exposure (e.g., infection).

189
Domain Metric Description of Serious Flaw(s) in Data Source
Data presentation and analysis
Statistical methods
Statistical methods used were not appropriate (e.g., parametric test for non-normally distributed data) OR statistical analysis was not conducted AND data were not provided preventing an independent statistical analysis.
Reporting of data
Data presentation was inadequate (e.g., the report does not differentiate among findings in multiple exposure groups) OR major inconsistencies were present in reporting of results.
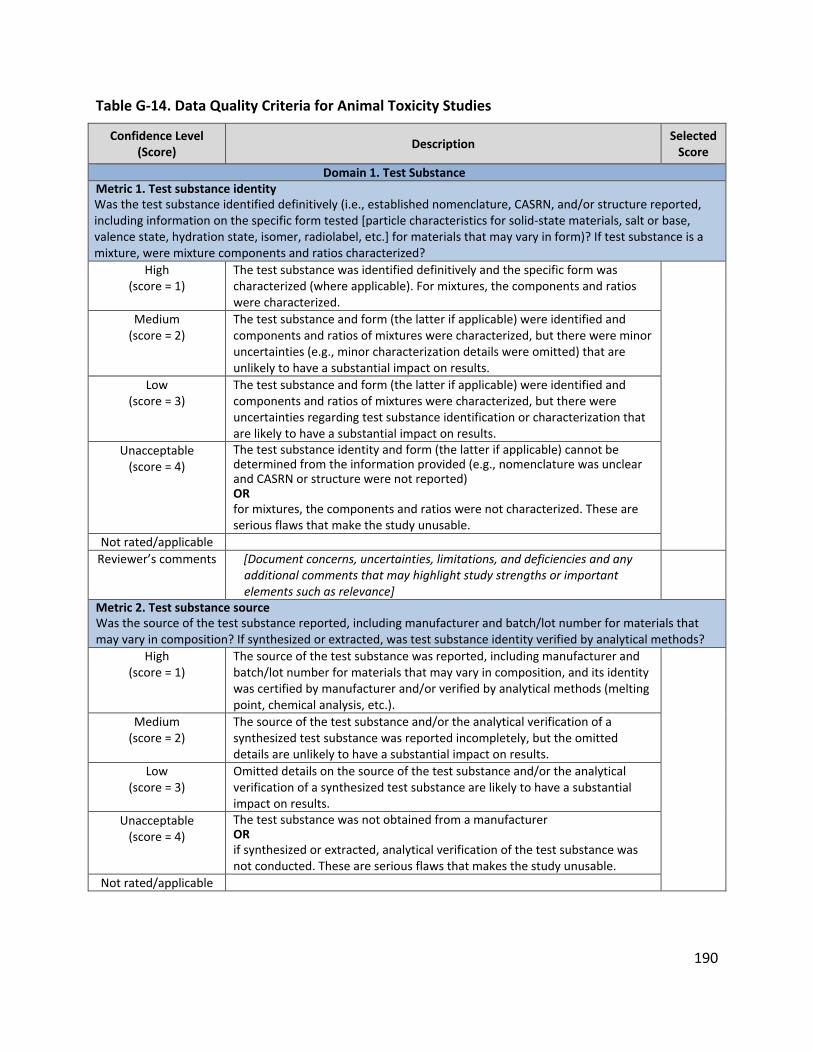
190
Table G-14. Data Quality Criteria for Animal Toxicity Studies
Confidence Level (Score)
Description Selected
Score
Domain 1. Test Substance Metric 1. Test substance identity Was the test substance identified definitively (i.e., established nomenclature, CASRN, and/or structure reported, including information on the specific form tested [particle characteristics for solid-state materials, salt or base, valence state, hydration state, isomer, radiolabel, etc.] for materials that may vary in form)? If test substance is a mixture, were mixture components and ratios characterized?
High (score = 1)
The test substance was identified definitively and the specific form was characterized (where applicable). For mixtures, the components and ratios were characterized.
Medium (score = 2)
The test substance and form (the latter if applicable) were identified and components and ratios of mixtures were characterized, but there were minor uncertainties (e.g., minor characterization details were omitted) that are unlikely to have a substantial impact on results.
Low (score = 3)
The test substance and form (the latter if applicable) were identified and components and ratios of mixtures were characterized, but there were uncertainties regarding test substance identification or characterization that are likely to have a substantial impact on results.
Unacceptable (score = 4)
The test substance identity and form (the latter if applicable) cannot be determined from the information provided (e.g., nomenclature was unclear and CASRN or structure were not reported) OR for mixtures, the components and ratios were not characterized. These are serious flaws that make the study unusable.
Not rated/applicable
Reviewer’s comments [Document concerns, uncertainties, limitations, and deficiencies and any additional comments that may highlight study strengths or important elements such as relevance]
Metric 2. Test substance source Was the source of the test substance reported, including manufacturer and batch/lot number for materials that may vary in composition? If synthesized or extracted, was test substance identity verified by analytical methods?
High (score = 1)
The source of the test substance was reported, including manufacturer and batch/lot number for materials that may vary in composition, and its identity was certified by manufacturer and/or verified by analytical methods (melting point, chemical analysis, etc.).
Medium (score = 2)
The source of the test substance and/or the analytical verification of a synthesized test substance was reported incompletely, but the omitted details are unlikely to have a substantial impact on results.
Low (score = 3)
Omitted details on the source of the test substance and/or the analytical verification of a synthesized test substance are likely to have a substantial impact on results.
Unacceptable (score = 4)
The test substance was not obtained from a manufacturer OR if synthesized or extracted, analytical verification of the test substance was not conducted. These are serious flaws that makes the study unusable.
Not rated/applicable

191
Confidence Level (Score)
Description Selected
Score
Reviewer’s comments [Document concerns, uncertainties, limitations, and deficiencies and any additional comments that may highlight study strengths or important elements such as relevance]
Metric 3. Test substance purity Was the purity or grade (i.e., analytical, technical) of the test substance reported and adequate to identify its toxicological effects? Were impurities identified? Were impurities present in quantities that could influence the results?
High (score = 1)
The test substance purity and composition were such that any observed effects were highly likely to be due to the nominal test substance itself (e.g., highly pure or analytical-grade test substance or a formulation comprising primarily inert ingredients with small amount of active ingredient).
Medium (score = 2)
Minor uncertainties or limitations were identified regarding the test substance purity and composition; however, the purity and composition were such that observed effects were more likely than not due to the nominal test substance, and any identified impurities are unlikely to have a substantial impact on results. Alternately, purity was not reported but given other information purity was not expected to be of concern.
Low (score = 3)
Purity and/or grade of test substance were not reported or were low enough to have a substantial impact on results (i.e., observed effects may not be due to the nominal test substance).
Unacceptable (score = 4)
The nature and quantity of reported impurities were such that study results were likely to be due to one or more of the impurities. This is a serious flaw that makes the study unusable.
Not rated/applicable
Reviewer’s comments [Document concerns, uncertainties, limitations, and deficiencies and any additional comments that may highlight study strengths or important elements such as relevance]
Domain 2. Test Design Metric 4. Negative and vehicle controls Was an appropriate concurrent negative control group included? If a vehicle was used, was the control group exposed to the vehicle? For inhalation and gavage studies, were controls sham-exposed?
High (score = 1)
Study authors reported using an appropriate concurrent negative control group (i.e., all conditions equal except chemical exposure). If gavage or inhalation study, a vehicle and/or sham-treated control group was included.
Medium (score = 2)
Study authors reported using a concurrent negative control group, but all conditions were not equal to those of treated groups; however, the identified differences are considered to be minor limitations that are unlikely to have a substantial impact on results.
Low (score = 3)
Study authors acknowledged using a concurrent negative control group, but details regarding the negative control group were not reported, and the lack of details is likely to have a substantial impact on results.
Unacceptable (score = 4)
A concurrent negative control group was not included or reported OR the reported negative control group was not appropriate (e.g., age/ weight of animals differed between control and treated groups). This is a serious flaw that makes the study unusable.
Not rated/applicable
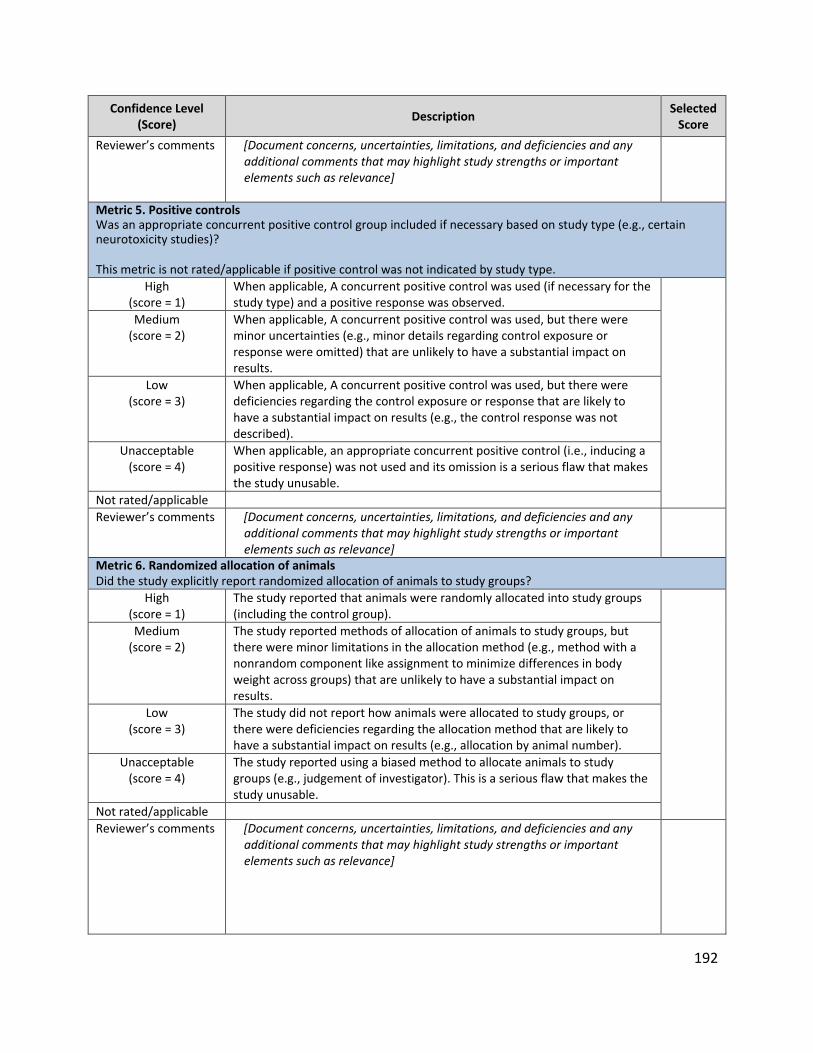
192
Confidence Level (Score)
Description Selected
Score
Reviewer’s comments [Document concerns, uncertainties, limitations, and deficiencies and any additional comments that may highlight study strengths or important elements such as relevance]
Metric 5. Positive controls Was an appropriate concurrent positive control group included if necessary based on study type (e.g., certain neurotoxicity studies)? This metric is not rated/applicable if positive control was not indicated by study type.
High (score = 1)
When applicable, A concurrent positive control was used (if necessary for the study type) and a positive response was observed.
Medium (score = 2)
When applicable, A concurrent positive control was used, but there were minor uncertainties (e.g., minor details regarding control exposure or response were omitted) that are unlikely to have a substantial impact on results.
Low (score = 3)
When applicable, A concurrent positive control was used, but there were deficiencies regarding the control exposure or response that are likely to have a substantial impact on results (e.g., the control response was not described).
Unacceptable (score = 4)
When applicable, an appropriate concurrent positive control (i.e., inducing a positive response) was not used and its omission is a serious flaw that makes the study unusable.
Not rated/applicable
Reviewer’s comments [Document concerns, uncertainties, limitations, and deficiencies and any additional comments that may highlight study strengths or important elements such as relevance]
Metric 6. Randomized allocation of animals Did the study explicitly report randomized allocation of animals to study groups?
High (score = 1)
The study reported that animals were randomly allocated into study groups (including the control group).
Medium (score = 2)
The study reported methods of allocation of animals to study groups, but there were minor limitations in the allocation method (e.g., method with a nonrandom component like assignment to minimize differences in body weight across groups) that are unlikely to have a substantial impact on results.
Low (score = 3)
The study did not report how animals were allocated to study groups, or there were deficiencies regarding the allocation method that are likely to have a substantial impact on results (e.g., allocation by animal number).
Unacceptable (score = 4)
The study reported using a biased method to allocate animals to study groups (e.g., judgement of investigator). This is a serious flaw that makes the study unusable.
Not rated/applicable
Reviewer’s comments [Document concerns, uncertainties, limitations, and deficiencies and any additional comments that may highlight study strengths or important elements such as relevance]

193
Confidence Level (Score)
Description Selected
Score
Domain 3. Exposure Characterization Metric 7. Preparation and storage of test substance Did the study characterize the test substance preparation and storage conditions (e.g., test substance stability, homogeneity, mixing temperature, stock concentration, stirring methods, centrifugation/filtration)? Were the frequency of preparation and/or storage conditions appropriate to the test substance stability? For inhalation studies, was the aerosol/vapor generation method appropriate?
High (score = 1)
The test substance preparation and storage conditions were reported and appropriate for the test substance (e.g., test substance well-mixed in diet). For inhalation studies, the method and equipment used to generate the test substance as a gas, vapor, or aerosol were reported and appropriate.
Medium (score = 2)
The test substance preparation and storage conditions were reported, but there were only minor limitations in the test substance preparation and/or storage conditions were identified (i.e., diet was not mixed fresh daily) or omission of details that are unlikely to have a substantial impact on results. For inhalation studies, the method and equipment used to generate the test substance were incomplete or confusing but there is no reason to believe there was an impact on animal exposure.
Low (score = 3)
Deficiencies in reporting of test substance preparation and/or storage conditions are likely to have a substantial impact on results (e.g., available information on physical-chemical properties suggested that stability and/or solubility of test substance in vehicle may be poor). For inhalation studies, there is reason to question the validity of the method used for generating the test substance.
Unacceptable (score = 4)
Information on preparation and storage was not reported OR serious flaws reported with test substance preparation and/or storage conditions will have critical impacts on dose/concentration estimates and make the study unusable (e.g., instability of test substance in exposure medium was reported, or there was heterogeneous distribution of test substance in exposure matrix [e.g., aerosol deposition in exposure chamber, insufficient mixing of dietary matrix]). For inhalation studies, there was no mention of the method and equipment used to generate the test substance, or the method used is atypical and inappropriate.
Not rated/applicable
Reviewer’s comments [Document concerns, uncertainties, limitations, and deficiencies and any additional comments that may highlight study strengths or important elements such as relevance]
Metric 8. Consistency of exposure administration Were exposures administered consistently across study groups (e.g., same exposure frequency; same time of day; consistent gavage volumes or diet compositions in oral studies; consistent chamber designs, animals/chamber, and comparable particle size characteristics in inhalation studies; consistent application methods and volumes in dermal studies)?
High (score = 1)
Details of exposure administration were reported and exposures were administered consistently across study groups in a scientifically sound manner (e.g., gavage volume was not excessive).
Medium (score = 2)
Details of exposure administration were reported, but minor limitations in administration of exposures (e.g., accidental mistakes in dosing) were

194
Confidence Level (Score)
Description Selected
Score
identified that are unlikely to have a substantial impact on results.
Low (score = 3)
Details of exposure administration were reported, but deficiencies in administration of exposures (e.g., exposed at different times of day) are likely to have a substantial impact on results.
Unacceptable (score = 4)
Critical exposure details (e.g., methods for generating atmosphere in inhalation studies) were not reported OR reported information indicated that exposures were not administered consistently across study groups (e.g., differing particle size), resulting in serious flaws that make the study unusable.
Not rated/applicable
Reviewer’s comments [Document concerns, uncertainties, limitations, and deficiencies and any additional comments that may highlight study strengths or important elements such as relevance]
Metric 9. Reporting of doses/concentrations Were doses/concentrations reported without ambiguity (e.g., point estimate in addition to a range)? In oral studies, if doses were not reported, was information reported that enabled dose estimation (e.g., test animal dietary intake and body weight monitoring data in dietary studies)? In inhalation studies, was test substance vapor/aerosol concentration measured analytically along with nominal and target concentrations?
High (score = 1)
For oral and dermal studies, administered doses/concentrations, or the information to calculate them, were reported without ambiguity. For inhalation studies, several specific considerations apply: Analytical, nominal and target chamber concentrations were all reported, with high confidence in the accuracy of the actual concentrations; the range of concentrations within a treatment group did not deviate widely (range should be within ±10% for gases and vapors and within ±20% for liquid and solid aerosols). The analytical method (HPLC, GC, IR spectrophotometry, etc.) used to measure chamber test substance and vehicle concentration was reported and appropriate. Actual chamber measurements using gravimetric filters are acceptable when testing dry aerosols and non-volatile liquid aerosols. The particle size distribution data, mass median aerodynamic diameter (MMAD), and geometric standard deviation were reported for all exposed groups (including vehicle controls, when used).
Medium (score = 2)
For oral and dermal studies, minor uncertainties in reporting of administered doses/concentrations occurred (e.g., dietary or air concentrations were not measured analytically) but are unlikely to have a substantial impact on results. For inhalation studies, several specific considerations apply: With gases only, actual concentrations were not reported but there is high confidence that the animals were exposed at approximately the reported target concentrations. [There is no comparable medium result for aerosols and vapors if analytical concentrations are not reported.] For inhalation studies (gas, vapor, aerosol), the analytical method used was less than ideal or subject to interference but nevertheless yielded fairly reliable measurements of chamber concentrations.
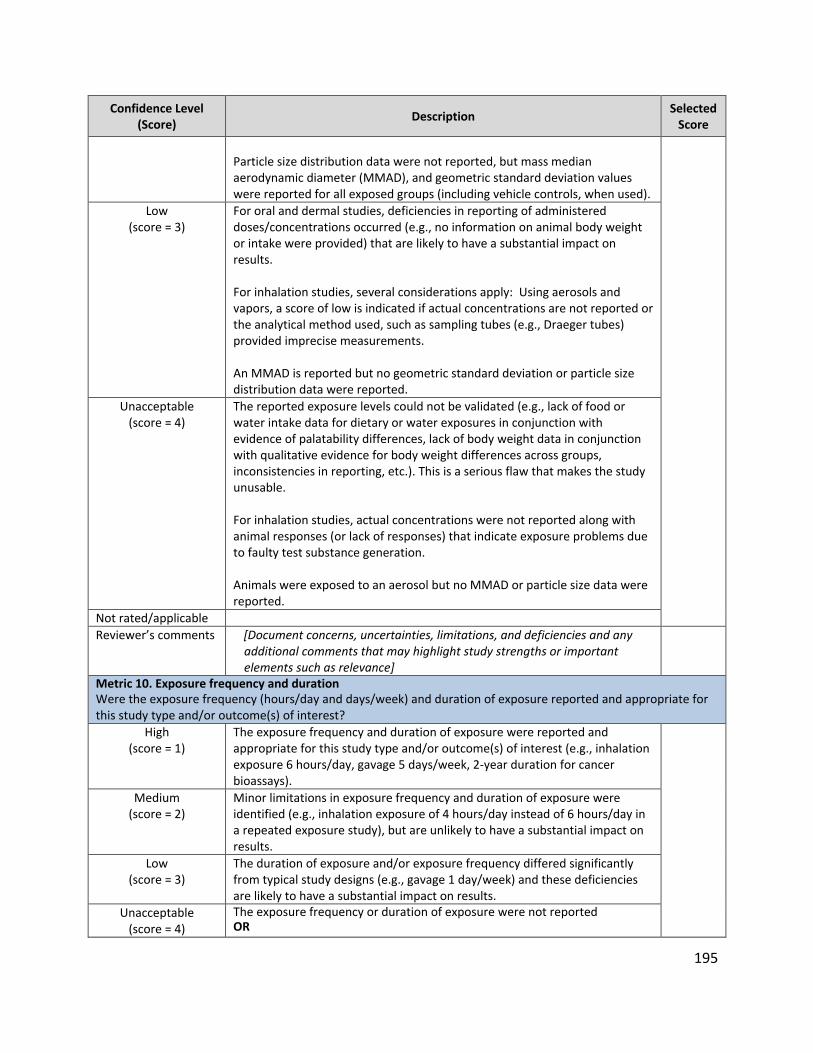
195
Confidence Level (Score)
Description Selected
Score
Particle size distribution data were not reported, but mass median aerodynamic diameter (MMAD), and geometric standard deviation values were reported for all exposed groups (including vehicle controls, when used).
Low (score = 3)
For oral and dermal studies, deficiencies in reporting of administered doses/concentrations occurred (e.g., no information on animal body weight or intake were provided) that are likely to have a substantial impact on results. For inhalation studies, several considerations apply: Using aerosols and vapors, a score of low is indicated if actual concentrations are not reported or the analytical method used, such as sampling tubes (e.g., Draeger tubes) provided imprecise measurements. An MMAD is reported but no geometric standard deviation or particle size distribution data were reported.
Unacceptable (score = 4)
The reported exposure levels could not be validated (e.g., lack of food or water intake data for dietary or water exposures in conjunction with evidence of palatability differences, lack of body weight data in conjunction with qualitative evidence for body weight differences across groups, inconsistencies in reporting, etc.). This is a serious flaw that makes the study unusable. For inhalation studies, actual concentrations were not reported along with animal responses (or lack of responses) that indicate exposure problems due to faulty test substance generation. Animals were exposed to an aerosol but no MMAD or particle size data were reported.
Not rated/applicable
Reviewer’s comments [Document concerns, uncertainties, limitations, and deficiencies and any additional comments that may highlight study strengths or important elements such as relevance]
Metric 10. Exposure frequency and duration Were the exposure frequency (hours/day and days/week) and duration of exposure reported and appropriate for this study type and/or outcome(s) of interest?
High (score = 1)
The exposure frequency and duration of exposure were reported and appropriate for this study type and/or outcome(s) of interest (e.g., inhalation exposure 6 hours/day, gavage 5 days/week, 2-year duration for cancer bioassays).
Medium (score = 2)
Minor limitations in exposure frequency and duration of exposure were identified (e.g., inhalation exposure of 4 hours/day instead of 6 hours/day in a repeated exposure study), but are unlikely to have a substantial impact on results.
Low (score = 3)
The duration of exposure and/or exposure frequency differed significantly from typical study designs (e.g., gavage 1 day/week) and these deficiencies are likely to have a substantial impact on results.
Unacceptable (score = 4)
The exposure frequency or duration of exposure were not reported OR

196
Confidence Level (Score)
Description Selected
Score
the reported exposure frequency and duration were not suited to the study type and/or outcome(s) of interest (e.g., study length inadequate to evaluate tumorigenicity). These are serious flaws that make the study unusable.
Not rated/applicable
Reviewer’s comments [Document concerns, uncertainties, limitations, and deficiencies and any additional comments that may highlight study strengths or important elements such as relevance]
Metric 11. Number of exposure groups and dose/concentration spacing Were the number of exposure groups and dose/concentration spacing justified by study authors (e.g., based on range-finding studies) and adequate to address the purpose of the study (e.g., to evaluate dose-response relationships, identify points of departure, inform MOA/AOP, etc.)?
High (score = 1)
The number of exposure groups and dose/concentration spacing were justified by study authors and considered adequate to address the purpose of the study (e.g., the selected doses produce a range of responses).
Medium (score = 2)
There were minor limitations regarding the number of exposure groups and/or dose/concentration spacing (e.g., unclear if lowest dose was low enough or the highest dose was high enough), but the number of exposure groups and spacing of exposure levels were adequate to show results relevant to the outcome of interest (e.g., observation of a dose-response relationship) and the concerns are unlikely to have a substantial impact on results.
Low (score = 3)
There were deficiencies regarding the number of exposure groups and/or dose/concentration spacing (e.g., narrow spacing between doses with similar responses across groups), and these are likely to have a substantial impact on results.
Unacceptable (score = 4)
The number of exposure groups and spacing were not reported OR dose groups and spacing were not relevant for the assessment (e.g., all doses in a developmental toxicity study produced overt maternal toxicity). These are serious flaws that make the study unusable.
Not rated/applicable
Reviewer’s comments [Document concerns, uncertainties, limitations, and deficiencies and any additional comments that may highlight study strengths or important elements such as relevance]
Metric 12. Exposure route and method Were the route and method of exposure reported and suited to the test substance (e.g., was the test substance non-volatile in dietary studies)?
High (score = 1)
The route and method of exposure were reported and were suited to the test substance. For inhalation studies, a dynamic chamber was used. While dynamic nose-only (or head-only) studies are generally preferred, dynamic whole-body chambers are acceptable for gases and for vapors that do not condense.
Medium (score = 2)
There were minor limitations regarding the route and method of exposure, but the researchers took appropriate steps to mitigate the problem (e.g., mixed diet fresh each day for volatile compounds). These limitations are unlikely to have a substantial impact on results. For inhalation studies, a dynamic whole-body chamber was used for vapors

197
Confidence Level (Score)
Description Selected
Score
that may condense or for aerosols.28
Low (score = 3)
There were deficiencies regarding the route and method of exposure that are likely to have a substantial effect on results. Researchers may have attempted to correct the problem, but the success of the mitigating action was unclear. For inhalation studies, there are significant flaws in the design or operation of the inhalation chamber, such as uneven distribution of test substance in a whole-body chamber, having less than 15 air changes/hour in a whole-body chamber, or using a whole-body chamber that is too small for the number and volume of animals exposed.
Unacceptable (score = 4)
The route or method of exposure was not reported OR an inappropriate route or method (e.g., administration of a volatile organic compound via the diet) was used for the test substance without taking steps to correct the problem (e.g., mixing fresh diet). These are serious flaws that makes the study unusable. For inhalation studies, either a static chamber was used, there is no description of the inhalation chamber, or an atypical exposure method was used, such as allowing a container of test substance to evaporate in a room.
Not rated/applicable
Reviewer’s comments [Document concerns, uncertainties, limitations, and deficiencies and any additional comments that may highlight study strengths or important elements such as relevance]
Domain 4. Test Animals Metric 13. Test animal characteristics Were the test animal species, strain, sex, health status, age, and starting body weight reported? Was the test animal from a commercial source or in-house colony? Was the test species and strain an appropriate animal model for the evaluation of the specific outcome(s) of interest (e.g., routinely used for similar study types)?
High (score = 1)
The test animal species, strain, sex, health status, age, and starting body weight were reported, and the test animal was obtained from a commercial source or laboratory-maintained colony. The test species and strain were an appropriate animal model for the evaluation of the specific outcome(s) of interest (e.g., routinely used for similar study types).
Medium (score = 2)
Minor uncertainties in the reporting of test animal characteristics (e.g., health status, age, or starting body weight) are unlikely to have a substantial impact on results. The test animals were obtained from a commercial source or in-house colony, and the test species/strain/sex was an appropriate animal model for the evaluation of the specific outcome(s) of interest (e.g., routinely used for similar study types).
Low (score = 3)
The source of the test animal was not reported OR the test animal strain or sex was not reported. These deficiencies are likely to
28 This results in a medium score because in addition to inhalation exposure to the test substance, there may
also be significant oral exposure due to rodents grooming test substance that adheres to their fur. The combined oral and inhalation exposure results in a lower POD, which makes a test substance appear more toxic than it really is by the inhalation route.

198
Confidence Level (Score)
Description Selected
Score
have a substantial impact on results. Unacceptable
(score = 4)
The test animal species was not reported OR the test animal (species, strain, sex, life-stage, source) was not appropriate for the evaluation of the specific outcome(s) of interest (e.g., genetically modified animals, strain was uniquely susceptible or resistant to one or more outcome of interest). These are serious flaws that make the study unusable.
Not rated/applicable
Reviewer’s comments [Document concerns, uncertainties, limitations, and deficiencies and any additional comments that may highlight study strengths or important elements such as relevance]
Metric 14. Adequacy and consistency of animal husbandry conditions Were all husbandry conditions (e.g., housing, temperature) adequate and the same for control and exposed populations, such that the only difference was exposure to the test substance?
High (score = 1)
All husbandry conditions were reported (e.g., temperature, humidity, light-dark cycle) and were adequate and the same for control and exposed populations, such that the only difference was exposure.
Medium (score = 2)
Most husbandry conditions were reported and were adequate and similar for all groups. Some differences in conditions were identified among groups, but these differences were considered minor uncertainties or limitations that are unlikely to have a substantial impact on results.
Low (score = 3)
Husbandry conditions were not sufficiently reported to evaluate if husbandry was adequate and if differences occurred between control and exposed populations. These deficiencies are likely to have a substantial impact on results.
Unacceptable (score = 4)
There were significant differences in husbandry conditions between control and exposed groups (e.g., temperature, humidity, light-dark cycle) OR animal husbandry conditions deviated from customary practices in ways likely to impact study results (e.g., injuries and stress due to cage overcrowding). These are serious flaws that makes the study unusable.
Not rated/applicable
Reviewer’s comments [Document concerns, uncertainties, limitations, and deficiencies and any additional comments that may highlight study strengths or important elements such as relevance]
Metric 15. Number of animals per group Was the number of animals per study group appropriate for the study type and outcome analysis?
High (score = 1)
The number of animals per study group was reported, appropriate for the study type and outcome analysis, and consistent with studies of the same or similar type (e.g., 50/sex/group for rodent cancer bioassay, 10/sex/group for rodent subchronic study, etc.).
Medium (score = 2)
The reported number of animals per study group was lower than the typical number used in studies of the same or similar type (e.g., 30/sex/group for rodent cancer bioassay, 8/sex/group for rodent subchronic study, etc.), but sufficient for statistical analysis and this minor limitation is unlikely to have a substantial impact on results.
Low (score = 3)
The reported number of animals per study group was not sufficient for statistical analysis (e.g., varying numbers per group with some groups consisting of only one animal) and this deficiency is likely to have a substantial impact on results.

199
Confidence Level (Score)
Description Selected
Score
Unacceptable (score = 4)
The number of animals per study group was not reported OR the number of animals per study group was insufficient to characterize toxicological effects (e.g., 1-2 animals in each group). These are serious flaws that makes the study unusable.
Not rated/applicable
Reviewer’s comments [Document concerns, uncertainties, limitations, and deficiencies and any additional comments that may highlight study strengths or important elements such as relevance]
Domain 5. Outcome Assessment Metric 16. Outcome assessment methodology Did the outcome assessment methodology address or report the intended outcome(s) of interest? Was the outcome assessment methodology (including endpoints and timing of assessment) sensitive for the outcome(s) of interest (e.g., measured endpoints that are able to detect a true health effect or hazard)? Note: Outcome, as addressed in this domain, refers to health effects measured in an animal study (e.g., organ-specific toxicity, reproductive and developmental toxicity).
High (score = 1)
The outcome assessment methodology addressed or reported the intended outcome(s) of interest and was sensitive for the outcomes(s) of interest.
Medium (score = 2)
The outcome assessment methodology partially addressed or reported the intended outcomes(s) of interest (e.g., serum chemistry and organ weight evaluated in the absence of histology), but minor uncertainties are unlikely to have a substantial impact on results.
Low (score = 3)
Significant deficiencies in the reported outcome assessment methodology were identified OR due to incomplete reporting, it was unclear whether methods were sensitive for the outcome of interest. This is likely to have a substantial impact on results.
Unacceptable (score = 4)
The outcome assessment methodology was not reported OR the reported outcome assessment methodology was not sensitive for the outcome(s) of interest (e.g., evaluation of endpoints outside the critical window of development, a systemic toxicity study that evaluated only grossly observable endpoints, such as clinical signs and mortality, etc.). These are serious flaws that make the study unusable.
Not rated/applicable
Reviewer’s comments [Document concerns, uncertainties, limitations, and deficiencies and any additional comments that may highlight study strengths or important elements such as relevance]
Metric 17. Consistency of outcome assessment Was the outcome assessment carried out consistently (i.e., using the same protocol) across study groups (e.g., assessment at the same time after initial exposure in all study groups)?
High (score = 1)
Details of the outcome assessment protocol were reported and outcomes were assessed consistently across study groups (e.g., at the same time after initial exposure) using the same protocol in all study groups.
Medium (score = 2)
There were minor differences in the timing of outcome assessment across study groups, or incomplete reporting of minor details of outcome assessment protocol execution, but these uncertainties or limitations are unlikely to have substantial impact on results.

200
Confidence Level (Score)
Description Selected
Score
Low (score = 3)
Details regarding the execution of the study protocol for outcome assessment (e.g., timing of assessment across groups) were not reported, and these deficiencies are likely to have a substantial impact on results.
Unacceptable (score = 4)
There were large inconsistencies in the execution of study protocols for outcome assessment across study groups OR outcome assessments were not adequately reported for meaningful interpretation of results. These are serious flaws that make the study unusable.
Not rated/applicable
Reviewer’s comments [Document concerns, uncertainties, limitations, and deficiencies and any additional comments that may highlight study strengths or important elements such as relevance]
Metric 18. Sampling adequacy Was sampling adequate for the outcome(s) of interest, including experimental unit (e.g., litter vs. individual animal weight), number of evaluations per dose group, and endpoint (e.g., number of slides evaluated per organ)?
High (score = 1)
Details regarding sampling for the outcome(s) of interest were reported and the study used adequate sampling for the outcome(s) of interest (e.g., litter data provided for developmental studies; endpoints were evaluated in an adequate number of animals in each group).
Medium (score = 2)
Details regarding sampling for the outcome(s) of interest were reported, but minor limitations were identified in the sampling of the outcome(s) of interest (e.g., histopathology was performed for high-dose group and controls only, and treatment-related changes were observed at the high dose) that are unlikely to have a substantial impact on results.
Low (score = 3)
Details regarding sampling of outcomes were not reported and this deficiency is likely to have a substantial impact on results.
Unacceptable (score = 4)
Sampling was not adequate for the outcome(s) of interest (e.g., histopathology was performed on exposed groups, but not controls). This is a serious flaw that makes the study unusable.
Not rated/applicable
Reviewer’s comments [Document concerns, uncertainties, limitations, and deficiencies and any additional comments that may highlight study strengths or important elements such as relevance]
Metric 19. Blinding of assessors Were investigators assessing subjective outcomes (i.e., those evaluated using human judgment, including functional observational battery, qualitative neurobehavioral endpoints, histopathological re-evaluations) blinded to treatment group? If blinding was not applied, were quality control/quality assurance procedures for endpoint evaluation cited? Note that blinding is not required for initial histopathology review in accordance with Best Practices recommended by the Society of Toxicologic Pathology. This should be considered when rating this metric.a This metric is not rated/applicable for initial histopathology review or if no subjective outcomes were assessed (i.e., only automated measurements were included and/or human judgment was not applied).
High (score = 1)
The study explicitly reported that investigators assessing subjective outcomes (i.e., those evaluated using human judgment, including functional observational battery, qualitative neurobehavioral endpoints, histopathological re-evaluations) were blinded to treatment group or that quality control/quality assurance methods were followed in the absence of blinding.

201
Confidence Level (Score)
Description Selected
Score
Medium (score = 2)
The study reported that blinding was not possible, but steps were taken to minimize bias (e.g., knowledge of study group was restricted to personnel not assessing subjective outcome) and this minor uncertainty is unlikely to have a substantial impact on results. Alternately, blinding was not reported; however, lack of blinding is not expected to have a substantial impact on results.
Low (score = 3)
The study did not report whether assessors were blinded to treatment group for subjective outcomes, and this deficiency is likely to have a substantial impact on results.
Unacceptable (score = 4)
Information in the study report did not report whether assessors were blinded to treatment group for subjective outcomes or suggested that the assessment of subjective outcomes (e.g., functional observational battery, qualitative neurobehavioral endpoints, histopathological re-evaluations) was performed in a biased fashion (e.g., assessors of subjective outcomes were aware of study groups). This is a serious flaw that makes the study unusable.
Not rated/applicable
Reviewer’s comments [Document concerns, uncertainties, limitations, and deficiencies and any additional comments that may highlight study strengths or important elements such as relevance]
Metric 20. Negative control response Were the biological responses (e.g., histopathology, litter size, pup viability, etc.) of the negative control group(s) adequate?
High (score = 1)
The biological responses of the negative control group(s) were adequate (e.g., no/low incidence of histopathological lesions).
Medium (score = 2)
There were minor uncertainties or limitations regarding the biological responses of the negative control group(s) (e.g., differences in outcome between untreated and solvent controls) that are unlikely to have a substantial impact on results.
Low (score = 3)
The biological responses of the negative control group(s) were reported, but there were deficiencies regarding the control responses that are likely to have a substantial impact on results (e.g., elevated incidence of histopathological lesions).
Unacceptable (score = 4)
The biological responses of the negative control groups were not reported OR
there was unacceptable variation in biological responses between control replicates. These are serious flaws that make the study unusable.
Not rated/applicable
Reviewer’s comments [Document concerns, uncertainties, limitations, and deficiencies and any additional comments that may highlight study strengths or important elements such as relevance]

202
Confidence Level (Score)
Description Selected
Score
Domain 6. Confounding/Variable Control Metric 21 Confounding variables in test design and procedures Were there confounding differences among the study groups in initial body weight or test substance palatability that could influence the outcome assessment (e.g., did palatability issues lead to dehydration and/or malnourishment)? Did reflex bradypnea (i.e., reduced respiration and reduced test substance exposure) induced by respiratory irritants influence outcome assessment? Were normal signs of reflex bradypnea misinterpreted as neurologic, behavioral, or developmental effects (e.g. hypothermia, lethargy, unconsciousness, poor performance in behavioral studies, delayed pup development)?
High (score = 1)
There were no reported differences among the study groups in initial body weight, food or water intake, or respiratory rate that could influence the outcome assessment.
Medium (score = 2)
The study reported minor differences among the study groups (<20% difference from control) with respect to initial body weight, drinking water and/or food consumption due to palatability issues, or respiratory rate due to reflex bradypnea. These minor uncertainties are unlikely to have a substantial impact on results. Alternately, the lack of reporting of initial body weights, food/water intake, and/or respiratory rate is not likely to have a significant impact on results.
Low (score = 3)
Initial body weight, food/water intake, and respiratory rate were not reported. These deficiencies are likely to have a substantial impact on results.
Unacceptable (score = 4)
The study reported significant differences among the study groups with respect to initial body weight, decreased drinking water/food intake due to palatability issues (>20% difference from control) that could lead to dehydration and/or malnourishment, or reflex bradypnea that could lead to decreased oxygenation of the blood. These are serious flaws that makes the study unusable.
Not rated/applicable
Reviewer’s comments [Document concerns, uncertainties, limitations, and deficiencies and any additional comments that may highlight study strengths or important elements such as relevance]
Metric 22. Health outcomes unrelated to exposure Were there differences among the study groups in animal attrition or health outcomes unrelated to exposure (e.g., infection) that could influence the outcome assessment? Professional judgement should be used to determine whether or not signs of infection would invalidate the study. Criteria for High, Medium and Low are used when the study is still usable.
High (score = 1)
Details regarding animal attrition and health outcomes unrelated to exposure (e.g., infection) were reported for each study group and there were no differences among groups that could influence the outcome assessment.
Medium (score = 2)
Authors reported that one or more study groups experienced disproportionate animal attrition or health outcomes unrelated to exposure (e.g., infection), but data from the remaining exposure groups were valid and the low incidence of attrition is unlikely to have a substantial impact on results OR data on attrition and/or health outcomes unrelated to exposure for each study group were not reported because only substantial differences among groups were noted (as indicated by study authors).
Low (score = 3)
Data on attrition and/or health outcomes unrelated to exposure were not reported for each study group and this deficiency is likely to have a substantial impact on results. OR data on attrition and/or health outcomes

203
Confidence Level (Score)
Description Selected
Score
are reported and could have substantial impact on results.
Unacceptable (score = 4)
One or more study groups experienced serious animal attrition or health outcomes unrelated to exposure (e.g., infection). This is a serious flaw that makes the study unusable.
Not rated/applicable
Reviewer’s comments [Document concerns, uncertainties, limitations, and deficiencies and any additional comments that may highlight study strengths or important elements such as relevance]
Domain 7. Data Presentation and Analysis Metric 23. Statistical methods Were statistical methods clearly described and appropriate for dataset(s) (e.g., parametric test for normally distributed data)?
High (score = 1)
Statistical methods were clearly described and appropriate for dataset(s) (e.g., parametric test for normally distributed data). OR no statistical analyses, calculation methods, and/or data manipulation were conducted but sufficient data were provided to conduct an independent statistical analysis.
Medium (score = 2)
Statistical analysis was described with some omissions that would unlikely have a substantial impact on results.
Low (score = 3)
Statistical analysis was not described clearly, and this deficiency is likely to have a substantial impact on results.
Unacceptable (score = 4)
Statistical methods were not appropriate (e.g., parametric test for non-normally distributed data) OR statistical analysis was not conducted AND data were not provided preventing an independent statistical analysis. These are serious flaws that make the study unusable.
Not rated/applicable
Reviewer’s comments [Document concerns, uncertainties, limitations, and deficiencies and any additional comments that may highlight study strengths or important elements such as relevance]
Metric 24. Reporting of data Were the data for all outcomes presented? Were data reported by exposure group and sex (if applicable), with numbers of animals affected and numbers of animals evaluated (for quantal data) or group means and variance (for continuous data)? If severity scores were used, was the scoring system clearly articulated?
High (score = 1)
Data for exposure-related findings were presented for all outcomes by exposure group and sex (if applicable) with quantal and/or continuous presentation and description of severity scores if applicable. Negative findings were reported qualitatively or quantitatively.
Medium (score = 2)
Data for exposure-related findings were reported for most, but not all, outcomes by exposure group and sex (if applicable) with quantal and/or continuous presentation and description of severity scores if applicable. The minor uncertainties in outcome reporting are unlikely to have substantial impact on results.
Low (score = 3)
Data for exposure-related findings were not shown for each study group, but results were described in the text and/or data were only reported for some outcomes. These deficiencies are likely to have a substantial impact on

204
Confidence Level (Score)
Description Selected
Score
results.
Unacceptable (score = 4)
Data presentation was inadequate (e.g., the report does not differentiate among findings in multiple exposure groups) OR major inconsistencies were present in reporting of results. These are serious flaws that make the study unusable.
Not rated/applicable
Reviewer’s comments [Document concerns, uncertainties, limitations, and deficiencies and any additional comments that may highlight study strengths or important elements such as relevance]
Domain 8. Other (Apply as Needed)
Metric:
High (score = 1)
Medium (score = 2)
Low (score = 3)
Unacceptable (score = 4)
Not rated/applicable
Reviewer’s comments [Document concerns, uncertainties, limitations, and deficiencies and any additional comments that may highlight study strengths or important elements such as relevance]
a Crissman et al. (2004)
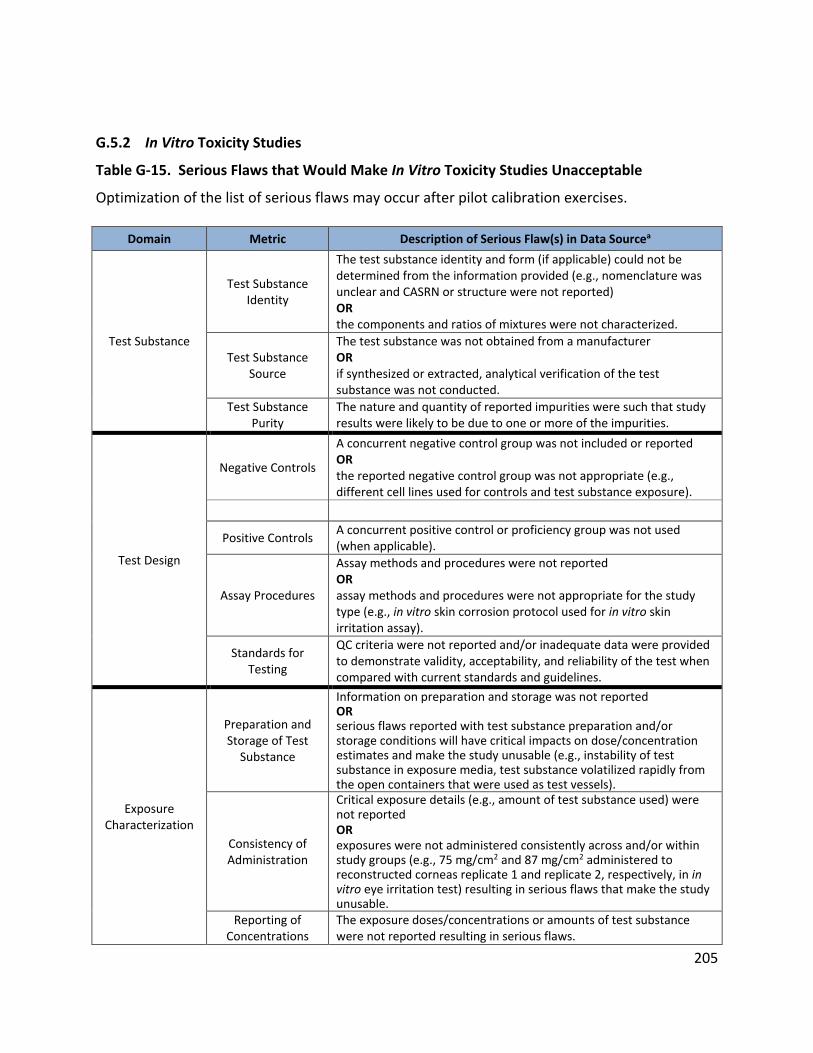
205
G.5.2 In Vitro Toxicity Studies
Table G-15. Serious Flaws that Would Make In Vitro Toxicity Studies Unacceptable
Optimization of the list of serious flaws may occur after pilot calibration exercises.
Domain Metric Description of Serious Flaw(s) in Data Sourcea
Test Substance
Test Substance Identity
The test substance identity and form (if applicable) could not be determined from the information provided (e.g., nomenclature was unclear and CASRN or structure were not reported) OR the components and ratios of mixtures were not characterized.
Test Substance Source
The test substance was not obtained from a manufacturer OR if synthesized or extracted, analytical verification of the test substance was not conducted.
Test Substance Purity
The nature and quantity of reported impurities were such that study results were likely to be due to one or more of the impurities.
Test Design
Negative Controls
A concurrent negative control group was not included or reported OR the reported negative control group was not appropriate (e.g., different cell lines used for controls and test substance exposure).
Positive Controls A concurrent positive control or proficiency group was not used (when applicable).
Assay Procedures
Assay methods and procedures were not reported OR assay methods and procedures were not appropriate for the study type (e.g., in vitro skin corrosion protocol used for in vitro skin irritation assay).
Standards for Testing
QC criteria were not reported and/or inadequate data were provided to demonstrate validity, acceptability, and reliability of the test when compared with current standards and guidelines.
Exposure Characterization
Preparation and Storage of Test
Substance
Information on preparation and storage was not reported OR serious flaws reported with test substance preparation and/or storage conditions will have critical impacts on dose/concentration estimates and make the study unusable (e.g., instability of test substance in exposure media, test substance volatilized rapidly from the open containers that were used as test vessels).
Consistency of Administration
Critical exposure details (e.g., amount of test substance used) were not reported OR exposures were not administered consistently across and/or within study groups (e.g., 75 mg/cm2 and 87 mg/cm2 administered to reconstructed corneas replicate 1 and replicate 2, respectively, in in vitro eye irritation test) resulting in serious flaws that make the study unusable.
Reporting of Concentrations
The exposure doses/concentrations or amounts of test substance were not reported resulting in serious flaws.

206
Domain Metric Description of Serious Flaw(s) in Data Sourcea
Exposure Duration
No information on exposure duration(s) was reported OR the exposure duration was not appropriate for the study type and/or outcome of interest (e.g., 5 hours for reconstructed epidermis in skin irritation test, 24 hours exposure for bacterial reverse mutation test).
Number of Exposure Groups and
Concentrations Spacing
The number of exposure groups and dose/concentration spacing were not reported OR the number of exposure groups and dose/concentration spacing were not relevant for the assessment (e.g., all concentrations used in an in vitro mammalian cell micronucleus test were cytotoxic).
Metabolic Activation No information on the characterization and use of a metabolic activation system was reported.
Test Model
Test Model
The test model and descriptive information were not reported OR the test model was not appropriate for evaluation of the specific outcome of interest (e.g., bacterial reverse mutation assay to evaluate chromosome aberrations).
Number per Group
The number of organisms or tissues per study group and/or replicates per study group were not reported OR the number of organisms or tissues per study group and/or replicates per study group were insufficient to characterize toxicological effects (e.g., one tissue/test concentration/one exposure time for in vitro skin corrosion test, one replicate/strain of bacteria exposed in bacterial reverse mutation assay).
Outcome Assessment
Outcome Assessment
Methodology
The outcome assessment methodology was not reported OR the assessment methodology was not appropriate for the outcome(s) of interest (e.g., cells were evaluated for chromosomal aberrations immediately after exposure to the test substance instead of after post-exposure incubation period, cytotoxicity not determined prior to CD86/CD expression measurement assay, and labeling antibodies were not tested on proficiency substances in an in vitro skin sensitization test in h-CLAT cells).
Consistency of Outcome
Assessment
There were large inconsistencies in the execution of study protocols for outcome assessment across study groups OR outcome assessments were not adequately reported for meaningful interpretation of results.
Sampling Adequacy
Reported sampling was not adequate for the outcome(s) of interest and/or serious uncertainties or limitations were identified in how the study carried out the sampling of the outcome(s) of interest (e.g., replicates from control and test concentrations were evaluated at different times).
Blinding of Assessors Information in the study report suggested that the assessment of subjective outcomes was performed in a biased fashion (e.g., assessors of subjective outcomes were aware of study groups).
Confounding/ Variable Control
Confounding Variables in Test
Design and
There were significant differences among the study groups with respect to the strain/batch/lot number of organisms or models used per group or size and/or quality of tissues exposed (e.g., initial
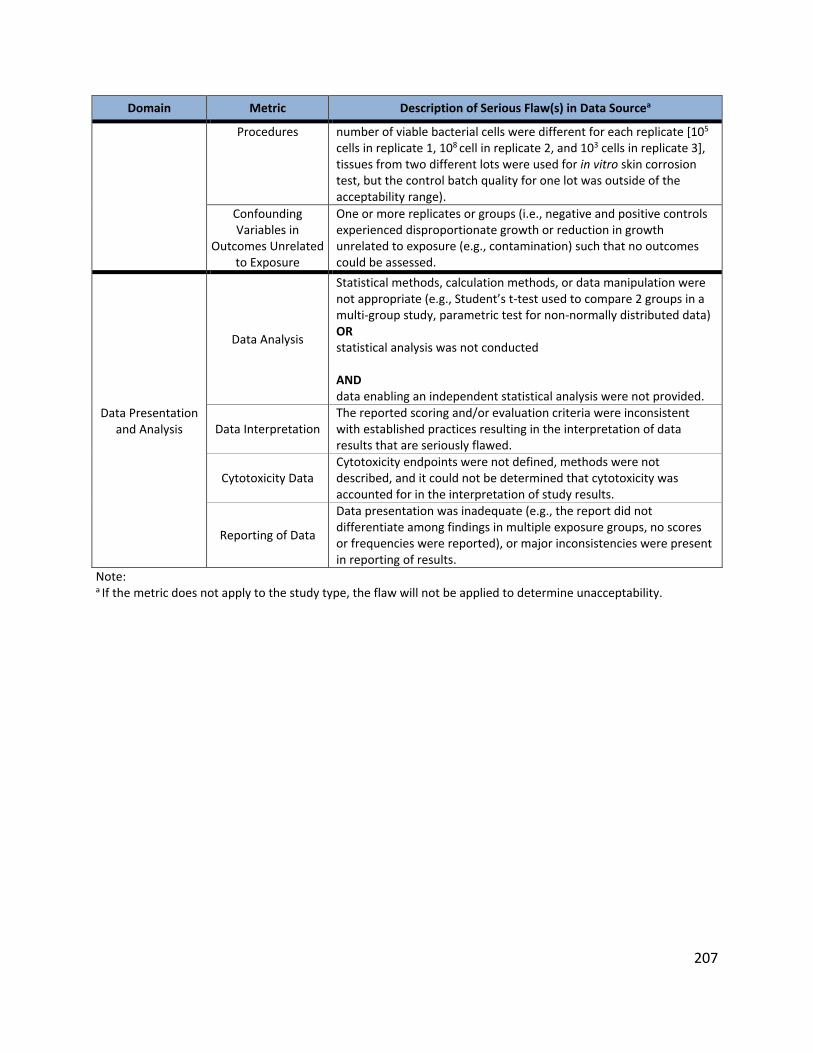
207
Domain Metric Description of Serious Flaw(s) in Data Sourcea
Procedures number of viable bacterial cells were different for each replicate [105 cells in replicate 1, 108 cell in replicate 2, and 103 cells in replicate 3], tissues from two different lots were used for in vitro skin corrosion test, but the control batch quality for one lot was outside of the acceptability range).
Confounding Variables in
Outcomes Unrelated to Exposure
One or more replicates or groups (i.e., negative and positive controls experienced disproportionate growth or reduction in growth unrelated to exposure (e.g., contamination) such that no outcomes could be assessed.
Data Presentation and Analysis
Data Analysis
Statistical methods, calculation methods, or data manipulation were not appropriate (e.g., Student’s t-test used to compare 2 groups in a multi-group study, parametric test for non-normally distributed data) OR statistical analysis was not conducted AND data enabling an independent statistical analysis were not provided.
Data Interpretation The reported scoring and/or evaluation criteria were inconsistent with established practices resulting in the interpretation of data results that are seriously flawed.
Cytotoxicity Data Cytotoxicity endpoints were not defined, methods were not described, and it could not be determined that cytotoxicity was accounted for in the interpretation of study results.
Reporting of Data
Data presentation was inadequate (e.g., the report did not differentiate among findings in multiple exposure groups, no scores or frequencies were reported), or major inconsistencies were present in reporting of results.
Note: a If the metric does not apply to the study type, the flaw will not be applied to determine unacceptability.
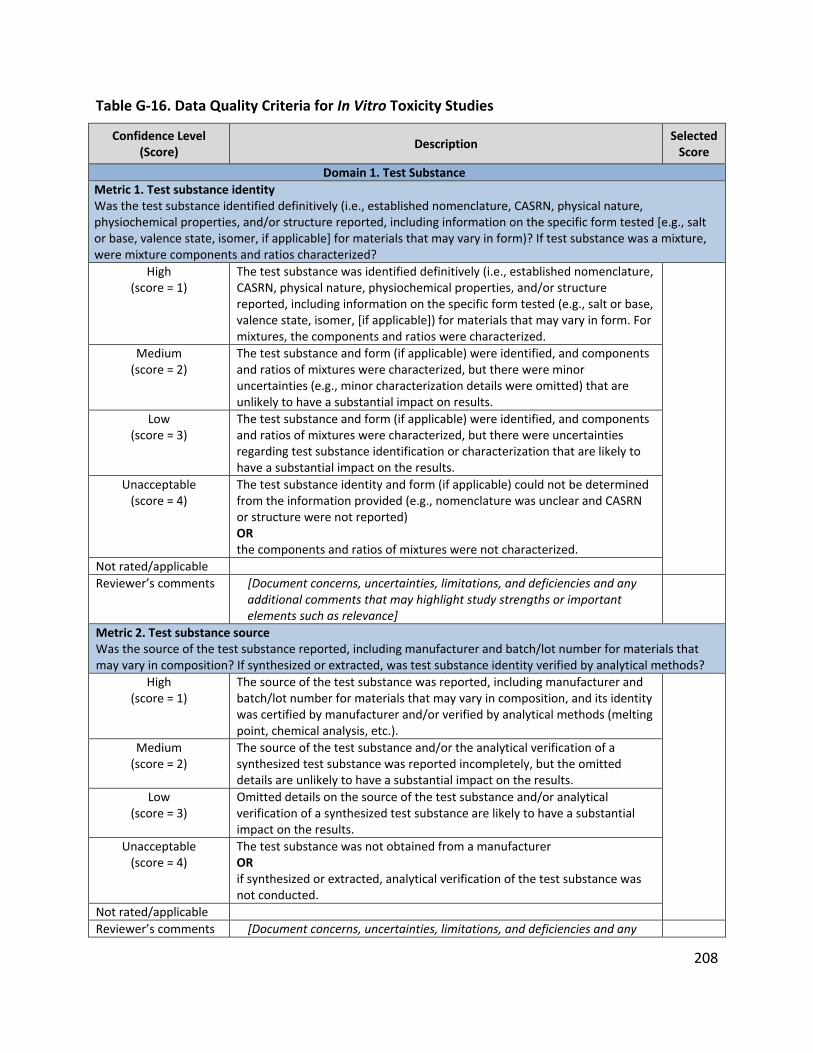
208
Table G-16. Data Quality Criteria for In Vitro Toxicity Studies
Confidence Level (Score)
Description Selected
Score
Domain 1. Test Substance
Metric 1. Test substance identity Was the test substance identified definitively (i.e., established nomenclature, CASRN, physical nature, physiochemical properties, and/or structure reported, including information on the specific form tested [e.g., salt or base, valence state, isomer, if applicable] for materials that may vary in form)? If test substance was a mixture, were mixture components and ratios characterized?
High (score = 1)
The test substance was identified definitively (i.e., established nomenclature, CASRN, physical nature, physiochemical properties, and/or structure reported, including information on the specific form tested (e.g., salt or base, valence state, isomer, [if applicable]) for materials that may vary in form. For mixtures, the components and ratios were characterized.
Medium (score = 2)
The test substance and form (if applicable) were identified, and components and ratios of mixtures were characterized, but there were minor uncertainties (e.g., minor characterization details were omitted) that are unlikely to have a substantial impact on results.
Low (score = 3)
The test substance and form (if applicable) were identified, and components and ratios of mixtures were characterized, but there were uncertainties regarding test substance identification or characterization that are likely to have a substantial impact on the results.
Unacceptable (score = 4)
The test substance identity and form (if applicable) could not be determined from the information provided (e.g., nomenclature was unclear and CASRN or structure were not reported) OR the components and ratios of mixtures were not characterized.
Not rated/applicable
Reviewer’s comments [Document concerns, uncertainties, limitations, and deficiencies and any additional comments that may highlight study strengths or important elements such as relevance]
Metric 2. Test substance source Was the source of the test substance reported, including manufacturer and batch/lot number for materials that may vary in composition? If synthesized or extracted, was test substance identity verified by analytical methods?
High (score = 1)
The source of the test substance was reported, including manufacturer and batch/lot number for materials that may vary in composition, and its identity was certified by manufacturer and/or verified by analytical methods (melting point, chemical analysis, etc.).
Medium (score = 2)
The source of the test substance and/or the analytical verification of a synthesized test substance was reported incompletely, but the omitted details are unlikely to have a substantial impact on the results.
Low (score = 3)
Omitted details on the source of the test substance and/or analytical verification of a synthesized test substance are likely to have a substantial impact on the results.
Unacceptable (score = 4)
The test substance was not obtained from a manufacturer OR if synthesized or extracted, analytical verification of the test substance was not conducted.
Not rated/applicable
Reviewer’s comments [Document concerns, uncertainties, limitations, and deficiencies and any
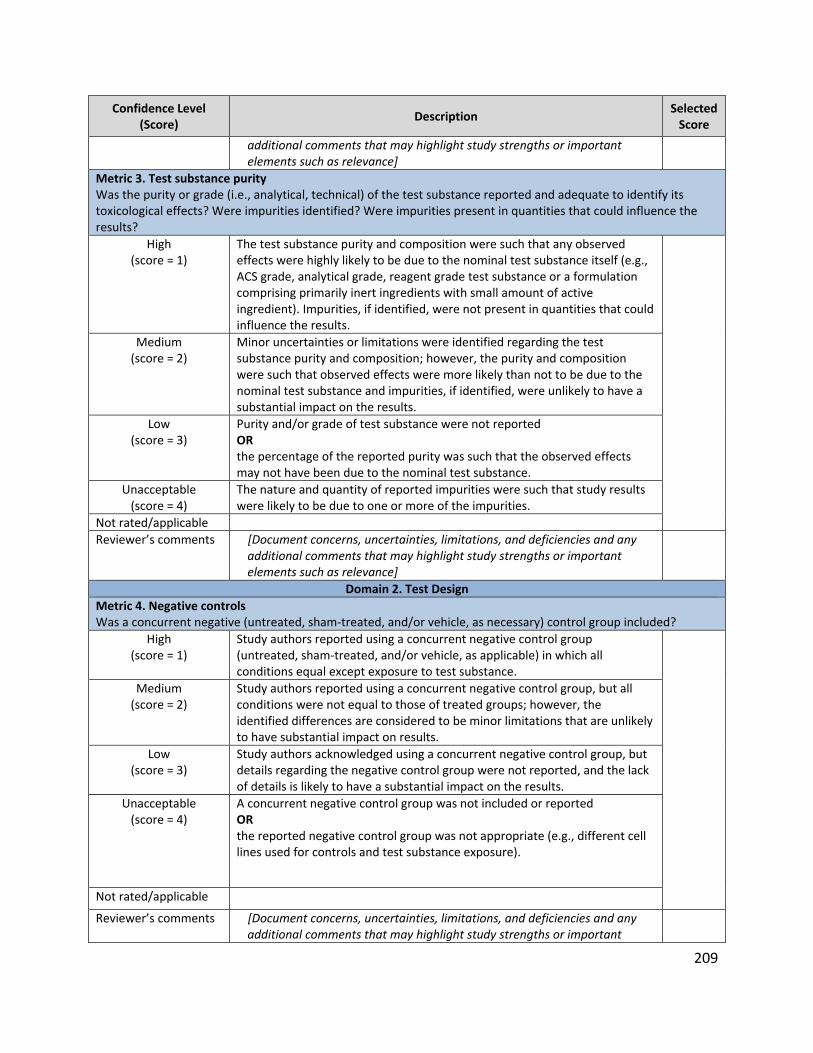
209
Confidence Level (Score)
Description Selected
Score
additional comments that may highlight study strengths or important elements such as relevance]
Metric 3. Test substance purity Was the purity or grade (i.e., analytical, technical) of the test substance reported and adequate to identify its toxicological effects? Were impurities identified? Were impurities present in quantities that could influence the results?
High (score = 1)
The test substance purity and composition were such that any observed effects were highly likely to be due to the nominal test substance itself (e.g., ACS grade, analytical grade, reagent grade test substance or a formulation comprising primarily inert ingredients with small amount of active ingredient). Impurities, if identified, were not present in quantities that could influence the results.
Medium (score = 2)
Minor uncertainties or limitations were identified regarding the test substance purity and composition; however, the purity and composition were such that observed effects were more likely than not to be due to the nominal test substance and impurities, if identified, were unlikely to have a substantial impact on the results.
Low (score = 3)
Purity and/or grade of test substance were not reported OR the percentage of the reported purity was such that the observed effects may not have been due to the nominal test substance.
Unacceptable (score = 4)
The nature and quantity of reported impurities were such that study results were likely to be due to one or more of the impurities.
Not rated/applicable
Reviewer’s comments [Document concerns, uncertainties, limitations, and deficiencies and any additional comments that may highlight study strengths or important elements such as relevance]
Domain 2. Test Design
Metric 4. Negative controls Was a concurrent negative (untreated, sham-treated, and/or vehicle, as necessary) control group included?
High (score = 1)
Study authors reported using a concurrent negative control group (untreated, sham-treated, and/or vehicle, as applicable) in which all conditions equal except exposure to test substance.
Medium (score = 2)
Study authors reported using a concurrent negative control group, but all conditions were not equal to those of treated groups; however, the identified differences are considered to be minor limitations that are unlikely to have substantial impact on results.
Low (score = 3)
Study authors acknowledged using a concurrent negative control group, but details regarding the negative control group were not reported, and the lack of details is likely to have a substantial impact on the results.
Unacceptable (score = 4)
A concurrent negative control group was not included or reported OR the reported negative control group was not appropriate (e.g., different cell lines used for controls and test substance exposure).
Not rated/applicable
Reviewer’s comments [Document concerns, uncertainties, limitations, and deficiencies and any additional comments that may highlight study strengths or important
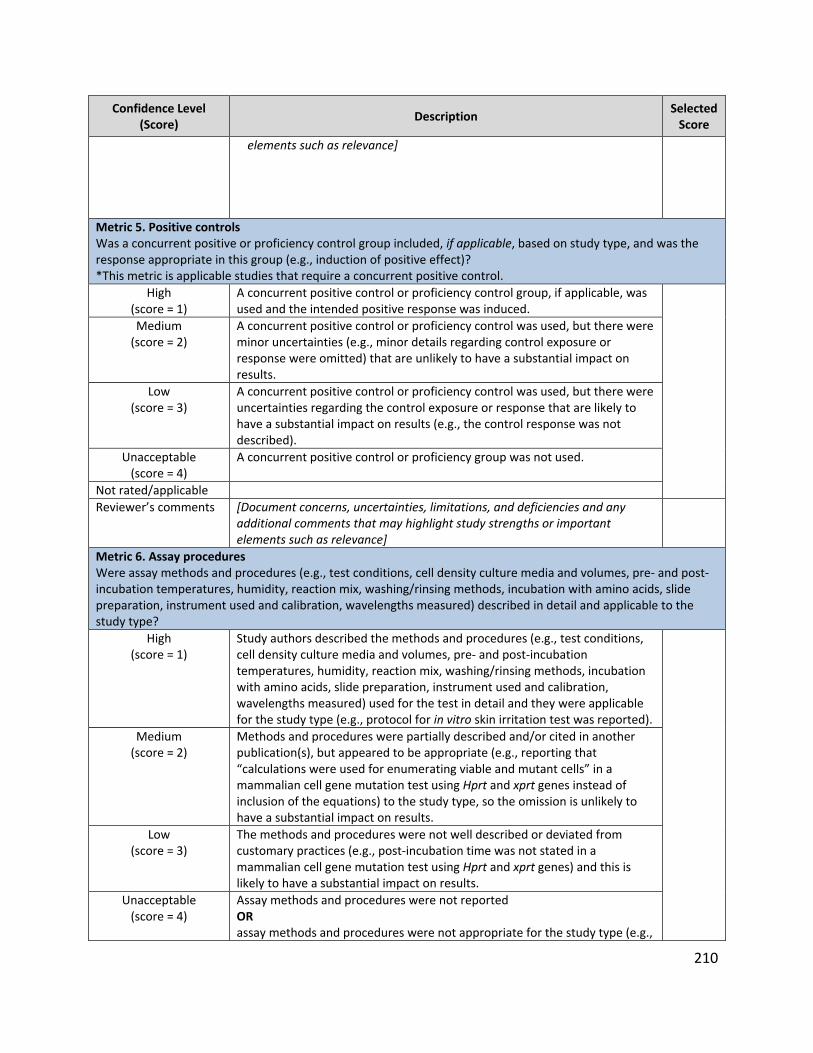
210
Confidence Level (Score)
Description Selected
Score
elements such as relevance]
Metric 5. Positive controls Was a concurrent positive or proficiency control group included, if applicable, based on study type, and was the response appropriate in this group (e.g., induction of positive effect)? *This metric is applicable studies that require a concurrent positive control.
High (score = 1)
A concurrent positive control or proficiency control group, if applicable, was used and the intended positive response was induced.
Medium (score = 2)
A concurrent positive control or proficiency control was used, but there were minor uncertainties (e.g., minor details regarding control exposure or response were omitted) that are unlikely to have a substantial impact on results.
Low (score = 3)
A concurrent positive control or proficiency control was used, but there were uncertainties regarding the control exposure or response that are likely to have a substantial impact on results (e.g., the control response was not described).
Unacceptable (score = 4)
A concurrent positive control or proficiency group was not used.
Not rated/applicable
Reviewer’s comments [Document concerns, uncertainties, limitations, and deficiencies and any additional comments that may highlight study strengths or important elements such as relevance]
Metric 6. Assay procedures Were assay methods and procedures (e.g., test conditions, cell density culture media and volumes, pre- and post-incubation temperatures, humidity, reaction mix, washing/rinsing methods, incubation with amino acids, slide preparation, instrument used and calibration, wavelengths measured) described in detail and applicable to the study type?
High (score = 1)
Study authors described the methods and procedures (e.g., test conditions, cell density culture media and volumes, pre- and post-incubation temperatures, humidity, reaction mix, washing/rinsing methods, incubation with amino acids, slide preparation, instrument used and calibration, wavelengths measured) used for the test in detail and they were applicable for the study type (e.g., protocol for in vitro skin irritation test was reported).
Medium (score = 2)
Methods and procedures were partially described and/or cited in another publication(s), but appeared to be appropriate (e.g., reporting that “calculations were used for enumerating viable and mutant cells” in a mammalian cell gene mutation test using Hprt and xprt genes instead of inclusion of the equations) to the study type, so the omission is unlikely to have a substantial impact on results.
Low (score = 3)
The methods and procedures were not well described or deviated from customary practices (e.g., post-incubation time was not stated in a mammalian cell gene mutation test using Hprt and xprt genes) and this is likely to have a substantial impact on results.
Unacceptable (score = 4)
Assay methods and procedures were not reported OR assay methods and procedures were not appropriate for the study type (e.g.,

211
Confidence Level (Score)
Description Selected
Score
in vitro skin corrosion protocol used for in vitro skin irritation assay).
Not rated/applicable
Reviewer’s comments [Document concerns, uncertainties, limitations, and deficiencies and any additional comments that may highlight study strengths or important elements such as relevance]
Metric 7. Standards for tests For assays with established criteria, were the test validity, acceptability, reliability, and/or QC criteria reported and consistent with current standards and guidelines? Example acceptability and QC criteria for an in vitro skin corrosion test using the EpiSkinTM (SM) model: Acceptability criteria: negative control OD values between ≥0.6 and ≤1.5, variability of the positive control replicates should be ≤20% of negative control, difference of viability between 2 tissue replicates should not exceed 30% in the range of 20-100% viability and for EDs≥0.3; QC criteria: Only QC-accepted tissue batches having an IC50 range of 1.0-3.0 mg/mL were used.) * This metric is generally applicable to studies using reconstructed human cells and may not be applicable to other studies.
High (score = 1)
The test validity, acceptability, reliability, and/or QC criteria were reported and consistent with current standards and guidelines,a if applicable.
Medium (score = 2)
Not applicable for this metric.
Low (score = 3)
Not applicable for this metric.
Unacceptable (score = 4)
QC criteria were not reported and/or inadequate data were provided to demonstrate validity, acceptability, and reliability of the test when compared with current standards and guidelines.
Not rated/applicable
Reviewer’s comments [Document concerns, uncertainties, limitations, and deficiencies and any additional comments that may highlight study strengths or important elements such as relevance]
Domain 3. Exposure Characterization
Metric 8. Preparation and storage of test substance Did the study characterize preparation of the test substance and storage conditions? Were the frequency of preparation and/or storage conditions appropriate to the test substance stability and solubility (if applicable)?
High (score = 1)
The test substance preparation and/or storage conditions (e.g., test substance stability, homogeneity, mixing temperature, stock concentration, stirring methods, centrifugation/filtration, aerosol/vapor generation method, storage conditions) were reported and appropriate (e.g., stability in exposure media confirmed, volatile test substances prepared and stored in sealed containers) for the test substance.
Medium (score = 2)
The test substance preparation and storage conditions were reported, but minor limitations in the test substance preparation and/or storage conditions were identified (e.g., test substance formulations were stirred instead of centrifuged for a specific number of rotations per minute) that are unlikely to have a substantial impact on results.
Low (score = 3)
Deficiencies in reporting of test substance preparation, and/or storage conditions are likely to have a substantial impact on results (e.g., available information on physical-chemical properties suggests that stability and/or solubility of test substance in vehicle or culture media may be poor).
Unacceptable (score = 4)
Information on preparation and storage was not reported OR
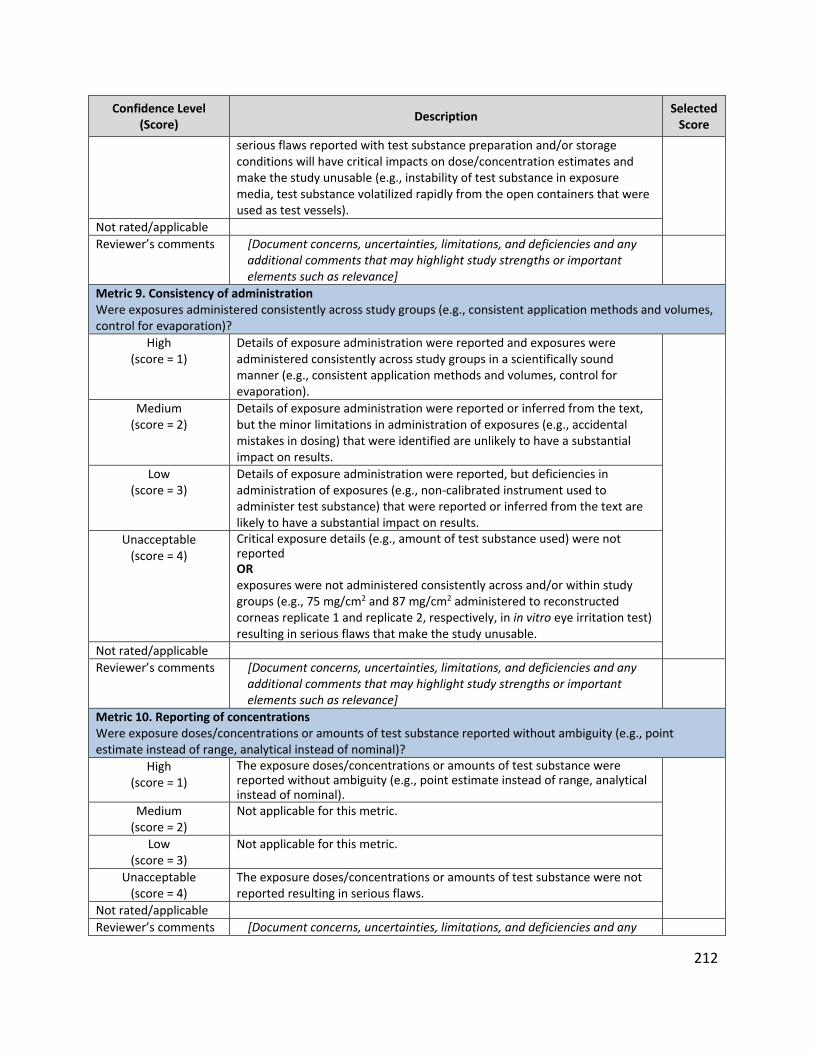
212
Confidence Level (Score)
Description Selected
Score
serious flaws reported with test substance preparation and/or storage conditions will have critical impacts on dose/concentration estimates and make the study unusable (e.g., instability of test substance in exposure media, test substance volatilized rapidly from the open containers that were used as test vessels).
Not rated/applicable
Reviewer’s comments [Document concerns, uncertainties, limitations, and deficiencies and any additional comments that may highlight study strengths or important elements such as relevance]
Metric 9. Consistency of administration Were exposures administered consistently across study groups (e.g., consistent application methods and volumes, control for evaporation)?
High (score = 1)
Details of exposure administration were reported and exposures were administered consistently across study groups in a scientifically sound manner (e.g., consistent application methods and volumes, control for evaporation).
Medium (score = 2)
Details of exposure administration were reported or inferred from the text, but the minor limitations in administration of exposures (e.g., accidental mistakes in dosing) that were identified are unlikely to have a substantial impact on results.
Low (score = 3)
Details of exposure administration were reported, but deficiencies in administration of exposures (e.g., non-calibrated instrument used to administer test substance) that were reported or inferred from the text are likely to have a substantial impact on results.
Unacceptable (score = 4)
Critical exposure details (e.g., amount of test substance used) were not reported OR exposures were not administered consistently across and/or within study groups (e.g., 75 mg/cm2 and 87 mg/cm2 administered to reconstructed corneas replicate 1 and replicate 2, respectively, in in vitro eye irritation test) resulting in serious flaws that make the study unusable.
Not rated/applicable
Reviewer’s comments [Document concerns, uncertainties, limitations, and deficiencies and any additional comments that may highlight study strengths or important elements such as relevance]
Metric 10. Reporting of concentrations Were exposure doses/concentrations or amounts of test substance reported without ambiguity (e.g., point estimate instead of range, analytical instead of nominal)?
High (score = 1)
The exposure doses/concentrations or amounts of test substance were reported without ambiguity (e.g., point estimate instead of range, analytical instead of nominal).
Medium (score = 2)
Not applicable for this metric.
Low (score = 3)
Not applicable for this metric.
Unacceptable (score = 4)
The exposure doses/concentrations or amounts of test substance were not reported resulting in serious flaws.
Not rated/applicable
Reviewer’s comments [Document concerns, uncertainties, limitations, and deficiencies and any
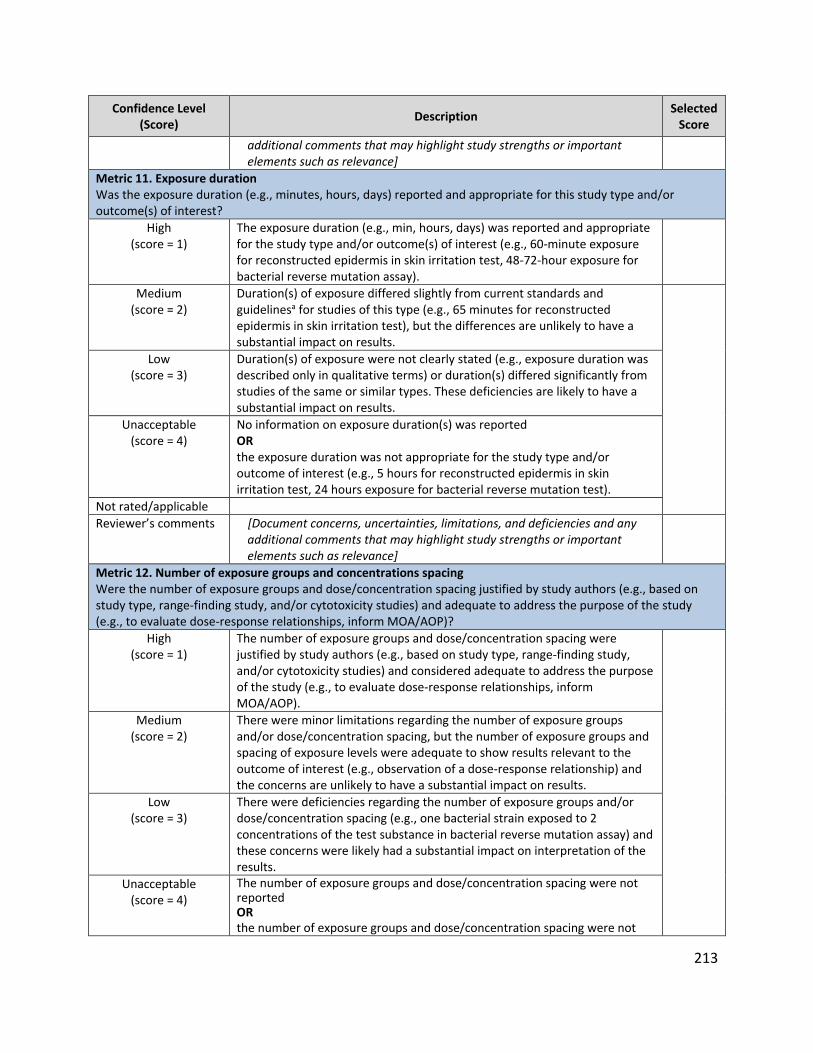
213
Confidence Level (Score)
Description Selected
Score
additional comments that may highlight study strengths or important elements such as relevance]
Metric 11. Exposure duration Was the exposure duration (e.g., minutes, hours, days) reported and appropriate for this study type and/or outcome(s) of interest?
High (score = 1)
The exposure duration (e.g., min, hours, days) was reported and appropriate for the study type and/or outcome(s) of interest (e.g., 60-minute exposure for reconstructed epidermis in skin irritation test, 48-72-hour exposure for bacterial reverse mutation assay).
Medium (score = 2)
Duration(s) of exposure differed slightly from current standards and guidelinesa for studies of this type (e.g., 65 minutes for reconstructed epidermis in skin irritation test), but the differences are unlikely to have a substantial impact on results.
Low (score = 3)
Duration(s) of exposure were not clearly stated (e.g., exposure duration was described only in qualitative terms) or duration(s) differed significantly from studies of the same or similar types. These deficiencies are likely to have a substantial impact on results.
Unacceptable (score = 4)
No information on exposure duration(s) was reported OR the exposure duration was not appropriate for the study type and/or outcome of interest (e.g., 5 hours for reconstructed epidermis in skin irritation test, 24 hours exposure for bacterial reverse mutation test).
Not rated/applicable
Reviewer’s comments [Document concerns, uncertainties, limitations, and deficiencies and any additional comments that may highlight study strengths or important elements such as relevance]
Metric 12. Number of exposure groups and concentrations spacing Were the number of exposure groups and dose/concentration spacing justified by study authors (e.g., based on study type, range-finding study, and/or cytotoxicity studies) and adequate to address the purpose of the study (e.g., to evaluate dose-response relationships, inform MOA/AOP)?
High (score = 1)
The number of exposure groups and dose/concentration spacing were justified by study authors (e.g., based on study type, range-finding study, and/or cytotoxicity studies) and considered adequate to address the purpose of the study (e.g., to evaluate dose-response relationships, inform MOA/AOP).
Medium (score = 2)
There were minor limitations regarding the number of exposure groups and/or dose/concentration spacing, but the number of exposure groups and spacing of exposure levels were adequate to show results relevant to the outcome of interest (e.g., observation of a dose-response relationship) and the concerns are unlikely to have a substantial impact on results.
Low (score = 3)
There were deficiencies regarding the number of exposure groups and/or dose/concentration spacing (e.g., one bacterial strain exposed to 2 concentrations of the test substance in bacterial reverse mutation assay) and these concerns were likely had a substantial impact on interpretation of the results.
Unacceptable (score = 4)
The number of exposure groups and dose/concentration spacing were not reported OR the number of exposure groups and dose/concentration spacing were not

214
Confidence Level (Score)
Description Selected
Score
relevant for the assessment (e.g., all concentrations used in an in vitro mammalian cell micronucleus test were cytotoxic).
Not rated/applicable
Reviewer’s comments [Document concerns, uncertainties, limitations, and deficiencies and any additional comments that may highlight study strengths or important elements such as relevance]
Metric 13. Metabolic activation (if applicable) Were exposures conducted in the presence and absence of a metabolic activation system, if applicable, for the study type? Were the source, method of preparation, concentration or volume in final culture, and quality control information on the metabolic activation system reported?
High (score = 1)
Study authors reported exposures were conducted in the presence of metabolic activation and the type and source, method of preparation, concentration or volume in final culture, and quality control information of the metabolic activation system were described.
Medium (score = 2)
The presence of a commonly used metabolic activation system (e.g., aroclor-, ethanol-, or phenobarbitial/β-naphthoflavone-induced rat, hamster, or mice liver cells) was reported in the study; however, some details regarding type, composition mix, concentration, or quality control information were not described. These omissions are unlikely to have a substantial impact on the results.
Low (score = 3)
The presence of a metabolic activation system was reported in the study, but the system described was not validated (e.g., rigorous testing to ensure that it suitable for the purpose for which it is used) or comparable to commonly used systems (e.g., aroclor-, ethanol-, or phenobarbitial/β-naphthoflavone-induced rat, hamster, or mice liver cells).
Unacceptable (score = 4)
No information on the characterization and use of a metabolic activation system was reported.
Not rated/applicable
Reviewer’s comments [Document concerns, uncertainties, limitations, and deficiencies and any additional comments that may highlight study strengths or important elements such as relevance]
Domain 4. Test Model
Metric 14. Test model Were the test models (e.g., cell types or lines, tissue models) and descriptive information (e.g., tissue origin, number of passages, karyotype features, doubling times, donor information, biomarkers) reported? Was the test model from a commercial source or an in-house culture? Was the model routinely used for the outcome of interest (e.g., Chinese hamster ovary cells for micronucleus formation)?
High (score = 1)
The test model (e.g., cell types or lines, tissue models) and descriptive information (e.g., tissue origin, number of passages, karyotype features, doubling times, donor information, biomarkers) were reported, the test model was obtained from a commercial source or laboratory-maintained culture, and the test model was routinely used for the outcome of interest (e.g., Chinese hamster ovary cells for micronucleus formation).
Medium (score = 2)
The test model was reported along with limited descriptive information. The test model was routinely used for the outcome of interest. Reporting limitations are unlikely to have a substantial impact on results.
Low (score = 3)
The test model was reported but no additional details were reported AND/OR

215
Confidence Level (Score)
Description Selected
Score
the test model was not routinely used for the outcome of interest (e.g., feline cell line for micronucleus formation). This is likely to have a substantial impact on results.
Unacceptable (score = 4)
The test model and descriptive information were not reported OR the test model was not appropriate for evaluation of the specific outcome of interest (e.g., bacterial reverse mutation assay to evaluate chromosome aberrations).
Not rated/applicable
Reviewer’s comments [Document concerns, uncertainties, limitations, and deficiencies and any additional comments that may highlight study strengths or important elements such as relevance]
Metric 15. Number per group Was the number of organisms or tissues per study group and/or replicates per study group reported and appropriate for the study type and outcome analysis?
High (score = 1)
The number of organisms or tissues per study group and/or number of replicates per study group were reported and were appropriatea for the study type and outcome analysis, and consistent with studies of the same or similar type (e.g., at least two replicates/test substance/3 different exposure times for in vitro skin corrosion test, 3 replicates/strain of bacteria in bacterial reverse mutation assay).
Medium (score = 2)
The number of organisms or tissues per study group and/or replicates per study group were reported but were lower than the typical number used in studies of the same or similar type (e.g., 3 replicates/strain of bacteria in bacterial reverse mutation assay), but were sufficient for analysis and unlikely to have a substantial impact on results.
Low (score = 3)
The number of organisms or tissues per study group and/or replicates per study group were reported but were less than recommended by current standards and guidelinesa (e.g., one tissue/test concentration/exposure time for in vitro skin corrosion test). This is likely to have a substantial impact on results.
Unacceptable (score = 4)
The number of organisms or tissues per study group and/or replicates per study group were not reported OR the number of organisms or tissues per study group and/or replicates per study group were insufficient to characterize toxicological effects (e.g., one tissue/test concentration/one exposure time for in vitro skin corrosion test, one replicate/strain of bacteria exposed in bacterial reverse mutation assay).
Not rated/applicable
Reviewer’s comments [Document concerns, uncertainties, limitations, and deficiencies and any additional comments that may highlight study strengths or important elements such as relevance]
Domain 5. Outcome Assessment
Metric 16. Outcome assessment methodology Did the outcome assessment methodology address or report the intended outcome(s) of interest? Was the outcome assessment methodology (including endpoints and timing of assessment) sensitive for the outcome(s) of interest (e.g., measured endpoints that are able to detect a true effect)?
High (score = 1)
The outcome assessment methodology addressed or reported the intended outcome(s) of interest and was sensitive for the outcome(s) of interest.
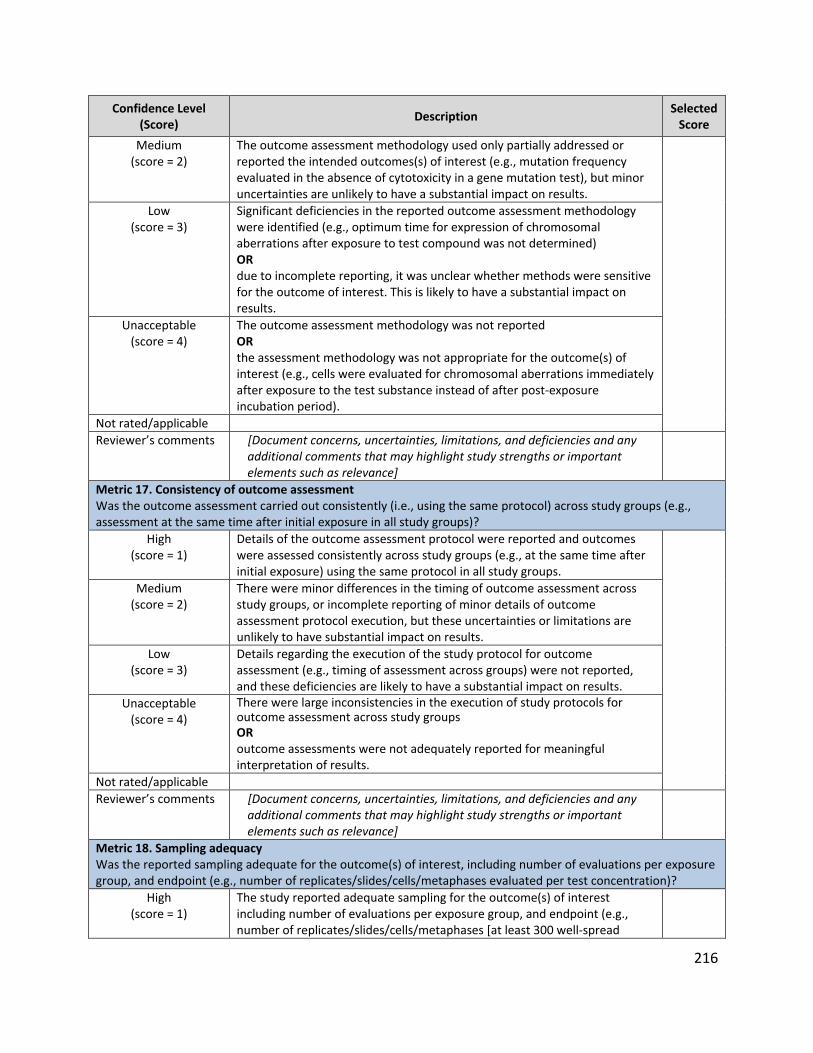
216
Confidence Level (Score)
Description Selected
Score
Medium (score = 2)
The outcome assessment methodology used only partially addressed or reported the intended outcomes(s) of interest (e.g., mutation frequency evaluated in the absence of cytotoxicity in a gene mutation test), but minor uncertainties are unlikely to have a substantial impact on results.
Low (score = 3)
Significant deficiencies in the reported outcome assessment methodology were identified (e.g., optimum time for expression of chromosomal aberrations after exposure to test compound was not determined) OR due to incomplete reporting, it was unclear whether methods were sensitive for the outcome of interest. This is likely to have a substantial impact on results.
Unacceptable (score = 4)
The outcome assessment methodology was not reported OR the assessment methodology was not appropriate for the outcome(s) of interest (e.g., cells were evaluated for chromosomal aberrations immediately after exposure to the test substance instead of after post-exposure incubation period).
Not rated/applicable
Reviewer’s comments [Document concerns, uncertainties, limitations, and deficiencies and any additional comments that may highlight study strengths or important elements such as relevance]
Metric 17. Consistency of outcome assessment Was the outcome assessment carried out consistently (i.e., using the same protocol) across study groups (e.g., assessment at the same time after initial exposure in all study groups)?
High (score = 1)
Details of the outcome assessment protocol were reported and outcomes were assessed consistently across study groups (e.g., at the same time after initial exposure) using the same protocol in all study groups.
Medium (score = 2)
There were minor differences in the timing of outcome assessment across study groups, or incomplete reporting of minor details of outcome assessment protocol execution, but these uncertainties or limitations are unlikely to have substantial impact on results.
Low (score = 3)
Details regarding the execution of the study protocol for outcome assessment (e.g., timing of assessment across groups) were not reported, and these deficiencies are likely to have a substantial impact on results.
Unacceptable (score = 4)
There were large inconsistencies in the execution of study protocols for outcome assessment across study groups OR outcome assessments were not adequately reported for meaningful interpretation of results.
Not rated/applicable
Reviewer’s comments [Document concerns, uncertainties, limitations, and deficiencies and any additional comments that may highlight study strengths or important elements such as relevance]
Metric 18. Sampling adequacy Was the reported sampling adequate for the outcome(s) of interest, including number of evaluations per exposure group, and endpoint (e.g., number of replicates/slides/cells/metaphases evaluated per test concentration)?
High (score = 1)
The study reported adequate sampling for the outcome(s) of interest including number of evaluations per exposure group, and endpoint (e.g., number of replicates/slides/cells/metaphases [at least 300 well-spread
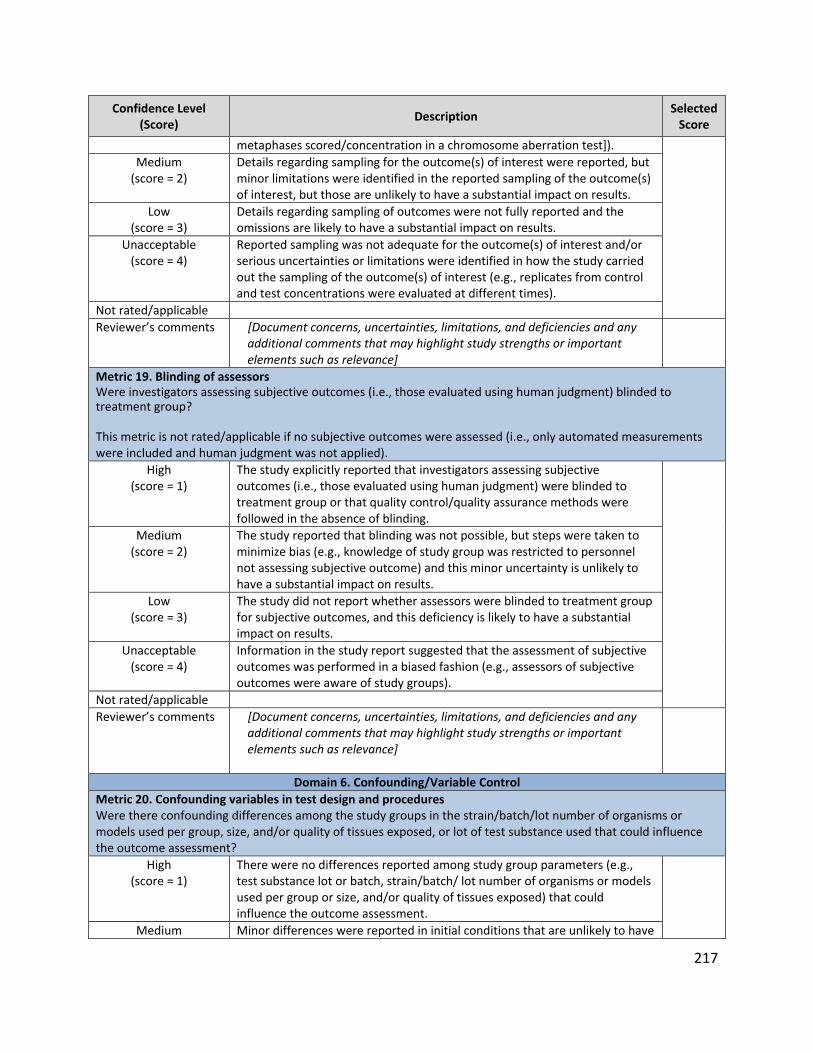
217
Confidence Level (Score)
Description Selected
Score
metaphases scored/concentration in a chromosome aberration test]).
Medium (score = 2)
Details regarding sampling for the outcome(s) of interest were reported, but minor limitations were identified in the reported sampling of the outcome(s) of interest, but those are unlikely to have a substantial impact on results.
Low (score = 3)
Details regarding sampling of outcomes were not fully reported and the omissions are likely to have a substantial impact on results.
Unacceptable (score = 4)
Reported sampling was not adequate for the outcome(s) of interest and/or serious uncertainties or limitations were identified in how the study carried out the sampling of the outcome(s) of interest (e.g., replicates from control and test concentrations were evaluated at different times).
Not rated/applicable
Reviewer’s comments [Document concerns, uncertainties, limitations, and deficiencies and any additional comments that may highlight study strengths or important elements such as relevance]
Metric 19. Blinding of assessors Were investigators assessing subjective outcomes (i.e., those evaluated using human judgment) blinded to treatment group? This metric is not rated/applicable if no subjective outcomes were assessed (i.e., only automated measurements were included and human judgment was not applied).
High (score = 1)
The study explicitly reported that investigators assessing subjective outcomes (i.e., those evaluated using human judgment) were blinded to treatment group or that quality control/quality assurance methods were followed in the absence of blinding.
Medium (score = 2)
The study reported that blinding was not possible, but steps were taken to minimize bias (e.g., knowledge of study group was restricted to personnel not assessing subjective outcome) and this minor uncertainty is unlikely to have a substantial impact on results.
Low (score = 3)
The study did not report whether assessors were blinded to treatment group for subjective outcomes, and this deficiency is likely to have a substantial impact on results.
Unacceptable (score = 4)
Information in the study report suggested that the assessment of subjective outcomes was performed in a biased fashion (e.g., assessors of subjective outcomes were aware of study groups).
Not rated/applicable
Reviewer’s comments [Document concerns, uncertainties, limitations, and deficiencies and any additional comments that may highlight study strengths or important elements such as relevance]
Domain 6. Confounding/Variable Control
Metric 20. Confounding variables in test design and procedures Were there confounding differences among the study groups in the strain/batch/lot number of organisms or models used per group, size, and/or quality of tissues exposed, or lot of test substance used that could influence the outcome assessment?
High (score = 1)
There were no differences reported among study group parameters (e.g., test substance lot or batch, strain/batch/ lot number of organisms or models used per group or size, and/or quality of tissues exposed) that could influence the outcome assessment.
Medium Minor differences were reported in initial conditions that are unlikely to have

218
Confidence Level (Score)
Description Selected
Score
(score = 2) a substantial impact on results (e.g., tissues from two different lots were used for in vitro skin corrosion test, and QC data were similar for both lots).
Low (score = 3)
Initial strain/batch/lot number of organisms or models used per group, size, and/or quality of tissues exposed was not reported. These deficiencies are likely to have a substantial impact on results.
Unacceptable (score = 4)
There were significant differences among the study groups with respect to the strain/batch/lot number of organisms or models used per group or size and/or quality of tissues exposed (e.g., initial number of viable bacterial cells were different for each replicate [105 cells in replicate 1, 108 cell in replicate 2, and 103 cells in replicate 3], tissues from two different lots were used for in vitro skin corrosion test, but the control batch quality for one lot was outside of the acceptability range).
Not rated/applicable
Reviewer’s comments [Document concerns, uncertainties, limitations, and deficiencies and any additional comments that may highlight study strengths or important elements such as relevance]
Metric 21. Confounding variables in outcomes unrelated to exposure Were there differences among the study groups unrelated to exposure to test substance (e.g., contamination) that could influence the outcome assessment? Did the test material interfere in the assay (e.g., altering fluorescence or absorbance, signal quenching by heavy metals, altering pH, solubility or stability issues)?
High (score = 1)
There were no reported differences among the study replicates or groups in test model unrelated to exposure (e.g., contamination) and the test substance did not interfere with the assay (e.g., signal quenching by heavy metals).
Medium (score = 2)
Authors reported that one or more replicates or groups experienced disproportionate outcomes unrelated to exposure (e.g., contamination), but data from the remaining exposure replicates or groups were valid and is unlikely to have a substantial impact on results OR data on experienced disproportionate outcomes unrelated to exposure were not reported because only substantial differences among groups were noted (as indicated by study authors). OR the test material interfered in the assay, but the interference did not cause substantial differences among the groups..
Low (score = 3)
Data on outcome differences unrelated to exposure were not reported for each study replicate or group. Assay interference was present or inferred resulting in large variabilities among the groups. The absence of this information is likely to have a substantial impact on results.
Unacceptable (score = 4)
One or more replicates or groups (i.e., negative and positive controls experienced disproportionate growth or reduction in growth unrelated to exposure (e.g., contamination), or assay interference occurred such that no outcomes could be assessed.
Not rated/applicable
Reviewer’s comments [Document concerns, uncertainties, limitations, and deficiencies and any additional comments that may highlight study strengths or important elements such as relevance]

219
Confidence Level (Score)
Description Selected
Score
Domain 7. Data Presentation and Analysis
Metric 22. Data analysis Were statistical methods, calculations methods, and/or data manipulation clearly described and appropriate for dataset(s)?
High (score = 1)
Statistical methods, calculation methods, and/or data manipulation were clearly described and presented for dataset(s) (e.g., frequencies of chromosomal aberrations were statistically analyzed across groups, trend test used to determine dose relationships, or results compared to historical negative control data). OR no statistical analyses, calculation methods, and/or data manipulation were conducted but sufficient data were provided to conduct an independent statistical analysis.
Medium (score = 2)
Statistical analysis was described with some omissions that would unlikely have a substantial impact on results.
Low (score = 3)
Statistical analysis was not described clearly, and this deficiency is likely to have a substantial impact on results.
Unacceptable (score = 4)
Statistical methods were not appropriate (e.g., Student’s t-test used to compare 2 groups in a multi-group study, parametric test for non-normally distributed data) OR statistical analysis was not conducted AND data were not provided preventing an independent statistical analysis.
Not rated/applicable
Reviewer’s comments [Document concerns, uncertainties, limitations, and deficiencies and any additional comments that may highlight study strengths or important elements such as relevance]
Metric 23. Data interpretation Were the scoring and/or evaluation criteria reported and consistent with standards and guidelines?
High (score = 1)
Study authors reported the scoring and/or evaluation criteria (e.g., for determining negative, positive, and equivocal outcomes) for the test and these were consistent with established practices.a
Medium (score = 2)
Scoring and/or evaluation criteria were partially reported (e.g., evaluation criteria were reported following 3- and 60-minute exposures, but not for 240-minute exposure in in vitro skin corrosion test), but the omissions are unlikely to have a substantial impact on results.
Low (score = 3)
Scoring and/or evaluation criteria were not reported and the omissions are likely to have a substantial impact on interpretation of the results.
Unacceptable (score = 4)
The reported scoring and/or evaluation criteria were inconsistent with established practices. resulting in the interpretation of data results that are seriously flawed.
Not rated/applicable
Reviewer’s comments [Document concerns, uncertainties, limitations, and deficiencies and any additional comments that may highlight study strengths or important elements such as relevance]
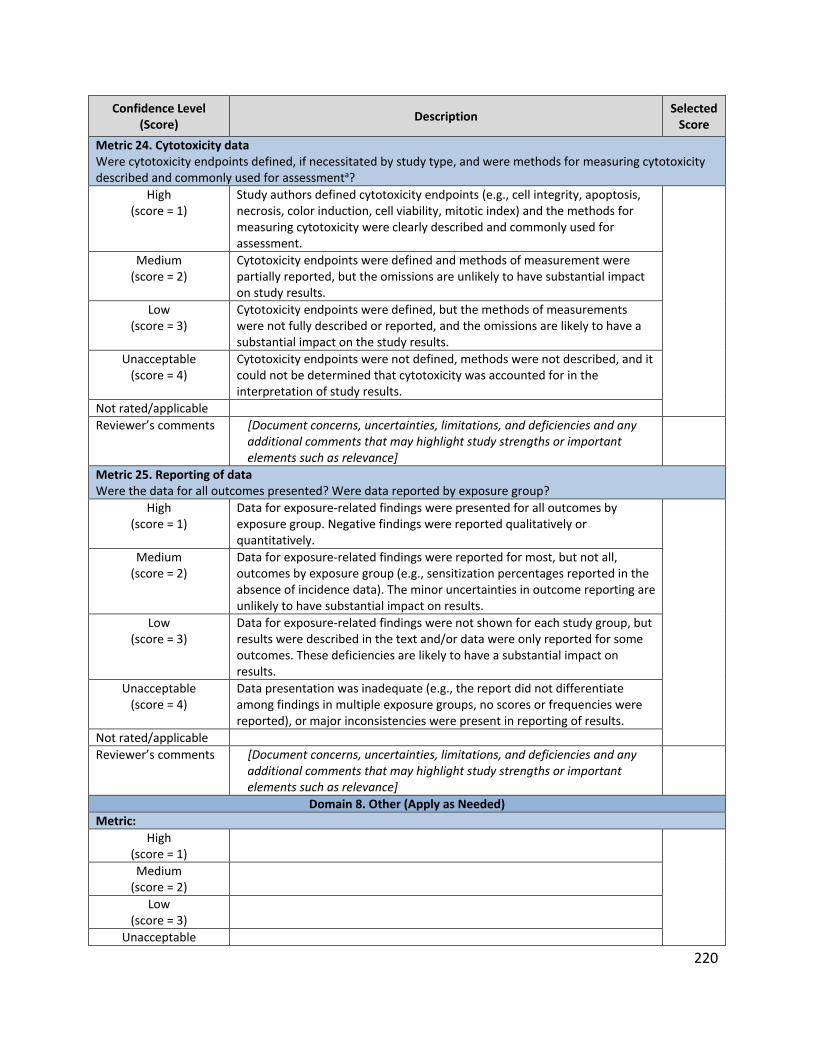
220
Confidence Level (Score)
Description Selected
Score
Metric 24. Cytotoxicity data Were cytotoxicity endpoints defined, if necessitated by study type, and were methods for measuring cytotoxicity described and commonly used for assessmenta?
High (score = 1)
Study authors defined cytotoxicity endpoints (e.g., cell integrity, apoptosis, necrosis, color induction, cell viability, mitotic index) and the methods for measuring cytotoxicity were clearly described and commonly used for assessment.
Medium (score = 2)
Cytotoxicity endpoints were defined and methods of measurement were partially reported, but the omissions are unlikely to have substantial impact on study results.
Low (score = 3)
Cytotoxicity endpoints were defined, but the methods of measurements were not fully described or reported, and the omissions are likely to have a substantial impact on the study results.
Unacceptable (score = 4)
Cytotoxicity endpoints were not defined, methods were not described, and it could not be determined that cytotoxicity was accounted for in the interpretation of study results.
Not rated/applicable
Reviewer’s comments [Document concerns, uncertainties, limitations, and deficiencies and any additional comments that may highlight study strengths or important elements such as relevance]
Metric 25. Reporting of data Were the data for all outcomes presented? Were data reported by exposure group?
High (score = 1)
Data for exposure-related findings were presented for all outcomes by exposure group. Negative findings were reported qualitatively or quantitatively.
Medium (score = 2)
Data for exposure-related findings were reported for most, but not all, outcomes by exposure group (e.g., sensitization percentages reported in the absence of incidence data). The minor uncertainties in outcome reporting are unlikely to have substantial impact on results.
Low (score = 3)
Data for exposure-related findings were not shown for each study group, but results were described in the text and/or data were only reported for some outcomes. These deficiencies are likely to have a substantial impact on results.
Unacceptable (score = 4)
Data presentation was inadequate (e.g., the report did not differentiate among findings in multiple exposure groups, no scores or frequencies were reported), or major inconsistencies were present in reporting of results.
Not rated/applicable
Reviewer’s comments [Document concerns, uncertainties, limitations, and deficiencies and any additional comments that may highlight study strengths or important elements such as relevance]
Domain 8. Other (Apply as Needed)
Metric:
High (score = 1)
Medium (score = 2)
Low (score = 3)
Unacceptable

221
Confidence Level (Score)
Description Selected
Score
(score = 4)
Not rated/applicable
Reviewer’s comments [Document concerns, uncertainties, limitations, and deficiencies and any additional comments that may highlight study strengths or important elements such as relevance]
Note: a For comparison purposes, current standards and guidelines may be reviewed at http://www.oecd-ilibrary.org/environment/oecd-guidelines-for-the-testing-of-chemicals-section-4-health-effects_20745788; https://www.epa.gov/test-guidelines-pesticides-and-toxic-substances; https://www.fda.gov/Food/GuidanceRegulation/GuidanceDocumentsRegulatoryInformation/IngredientsAdditivesGRASPackaging/ucm2006826.htm#TOC.
G.6 References
1. Cooper, GL, R. Agerstrand, M. Glenn, B. Kraft, A. Luke, A. Ratcliffe, J. (2016). Study sensitivity: Evaluating the ability to detect effects in systematic reviews of chemical exposures. Environ Int. 92-93: 605-610. http://dx.doi.org/10.1016/j.envint.2016.03.017.
2. Crissman, JWG, D. G. Hildebrandt, P. K. Maronpot, R. R. Prater, D. A. Riley, J. H. Seaman, W. J. Thake, D. C. (2004). Best practices guideline: Toxicologic histopathology. Toxicol Pathol. 32: 126-131. http://dx.doi.org/10.1080/01926230490268756.
3. EC. (2018). ToxRTool - Toxicological data Reliability assessment Tool. https://hero.epa.gov/heronet/index.cfm/reference/download/reference_id/4262819.
4. ECHA. (2011). Guidance on information requirements and chemical safety assessment. (ECHA-2011-G-13-EN). https://hero.epa.gov/heronet/index.cfm/reference/download/reference_id/4262842.
5. Hartling, LH, M. Milne, A. Vandermeer, B. Santaguida, P. L. Ansari, M. Tsertsvadze, A. Hempel, S. Shekelle, P. Dryden, D. M. (2012). Validity and inter-rater reliability testing of quality assessment instrumentsalidity and inter-rater reliability testing of quality assessment instruments. (AHRQ Publication No. 12-EHC039-EF). Rockville, MD: Agency for Healthcare Research and Quality. https://hero.epa.gov/heronet/index.cfm/reference/download/reference_id/4262864.
6. Hooijmans, CDV, R. Leenaars, M. Ritskes-Hoitinga, M. (2010). The Gold Standard Publication Checklist (GSPC) for improved design, reporting and scientific quality of animal studies GSPC versus ARRIVE guidelines. http://dx.doi.org/10.1258/la.2010.010130.
7. Hooijmans, CRR, M. M. De Vries, R. B. M. Leenaars, M. Ritskes-Hoitinga, M. Langendam, M. W. (2014). SYRCLE’s risk of bias tool for animal studies. BMC Medical Research Methodology. 14(1): 43. http://dx.doi.org/10.1186/1471-2288-14-43.
8. IPCS. (2010). Guidance on Characterization and Application of Physiologically Based Pharmacokinetic Models in Risk Assessment. https://hero.epa.gov/heronet/index.cfm/reference/download/reference_id/4262900.
9. Koustas, EL, J. Sutton, P. Johnson, P. I. Atchley, D. S. Sen, S. Robinson, K. A. Axelrad, D. A. Woodruff, T. J. (2014). The Navigation Guide - Evidence-based medicine meets environmental health: Systematic review of nonhuman evidence for PFOA effects on fetal growth [Review]. Environ Health Perspect. 122(10): 1015-1027. http://dx.doi.org/10.1289/ehp.1307177; https://www.ncbi.nlm.nih.gov/pmc/articles/PMC4181920/pdf/ehp.1307177.pdf.
10. Kushman, MEK, A. D. Guyton, K. Z. Chiu, W. A. Makris, S. L. Rusyn, I. (2013). A systematic approach for identifying and presenting mechanistic evidence in human health assessments. Regul Toxicol Pharmacol. 67(2): 266-277. http://dx.doi.org/10.1016/j.yrtph.2013.08.005;

222
https://www.ncbi.nlm.nih.gov/pmc/articles/PMC3818152/pdf/nihms516764.pdf. 11. Lynch, HNG, J. E. Tabony, J. A. Rhomberg, L. R. (2016). Systematic comparison of study quality
criteria. Regul Toxicol Pharmacol. 76: 187-198. https://hero.epa.gov/heronet/index.cfm/reference/download/reference_id/4262904.
12. Moermond, CTK, R. Korkaric, M. Ågerstrand, M. (2016). CRED: Criteria for reporting and evaluating ecotoxicity data. Environ Toxicol Chem. 35(5): 1297-1309. http://dx.doi.org/10.1002/etc.3259.
13. NTP. (2015). Handbook for conducting a literature-based health assessment using OHAT approach for systematic review and evidence integration. U.S. Dept. of Health and Human Services, National Toxicology Program. http://ntp.niehs.nih.gov/pubhealth/hat/noms/index-2.html.
14. Samuel, GOH, S. Wright, R. A. Lalu, M. M. Patlewicz, G. Becker, R. A. Degeorge, G. L. Fergusson, D. Hartung, T. Lewis, R. J. Stephens, M. L. (2016). Guidance on assessing the methodological and reporting quality of toxicologically relevant studies: A scoping review. Environ Int. 92-93: 630-646. https://hero.epa.gov/heronet/index.cfm/reference/download/reference_id/4262966.
15. U.S. EPA. (2006). Approaches for the application of physiologically based pharmacokinetic (PBPK) models and supporting data in risk assessment (Final Report) [EPA Report] (pp. 1-123). (EPA/600/R-05/043F). Washington, DC: U.S. Environmental Protection Agency, Office of Research and Development, National Center for Environmental Assessment. http://cfpub.epa.gov/ncea/cfm/recordisplay.cfm?deid=157668.

223
APPENDIX H: DATA QUALITY CRITERIA FOR EPIDEMIOLOGICAL STUDIES
H.1 Types of Data Sources
The data quality will be evaluated for the epidemiological studies listed in Table H-1.
Table H-1. Types of Epidemiological Studies
Data Category Types of Data Sources
Epidemiological
Studies Controlled exposure, cohort, case-control, cross-sectional, case-crossover
H.2 Data Quality Evaluation Domains
The data sources will be evaluated against the following six data quality evaluation domains: study participation, exposure characterization, outcome assessment, potential confounding/variability control, analysis, and other. These domains, as defined in Table H-2, address elements of TSCA Science Standards 26(h)(1) through 26(h)(5).
Table H-2. Data Evaluation Domains and Definitions
Evaluation Domain Definition
Study Participation
Study design elements characterizing the selection of participants in or out of the
study (or analysis sample), which influence whether the exposure-outcome
distribution among participants is representative of the exposure-outcome
distribution in the overall population of eligible persons.
Exposure Characterization
Evaluation of exposure assessment methodology that includes consideration of
methodological quality, sensitivity, and validation of the methods used, degree of
variation in participants, and an established time order between exposure and
outcome.
Outcome Assessment
Evaluation of outcome (effect) assessment methodology that includes consideration
of diagnostic methods, training of interviewers, data sources including registries,
blinding to exposure status or level, and reporting of all results.
Potential Confounding /
Variability Control
Valid and reliable methods to reduce research-specific bias, including standardization,
matching, adjustment in multivariate models, and stratification. This includes control
of potential co-exposures when it is known that there is potential for co-exposure to
occur and the co-exposure could influence the outcome of interest.
Analysis Appropriate study design chosen for the research question with evaluation of
statistical power, reproducibility, and statistical or modelling approaches.
Other / Consideration for
Biomarker Selection and
Measurement
Measures of biomarker (exposure and/or effect) data reliability. This includes but is
not limited to evaluations of storage, stability and contamination of samples, validity
and limits of detection of methods, method requirements, inclusion of matrix-specific
considerations, and relationship of biomarker with external exposure, internal dose,
or target dose.
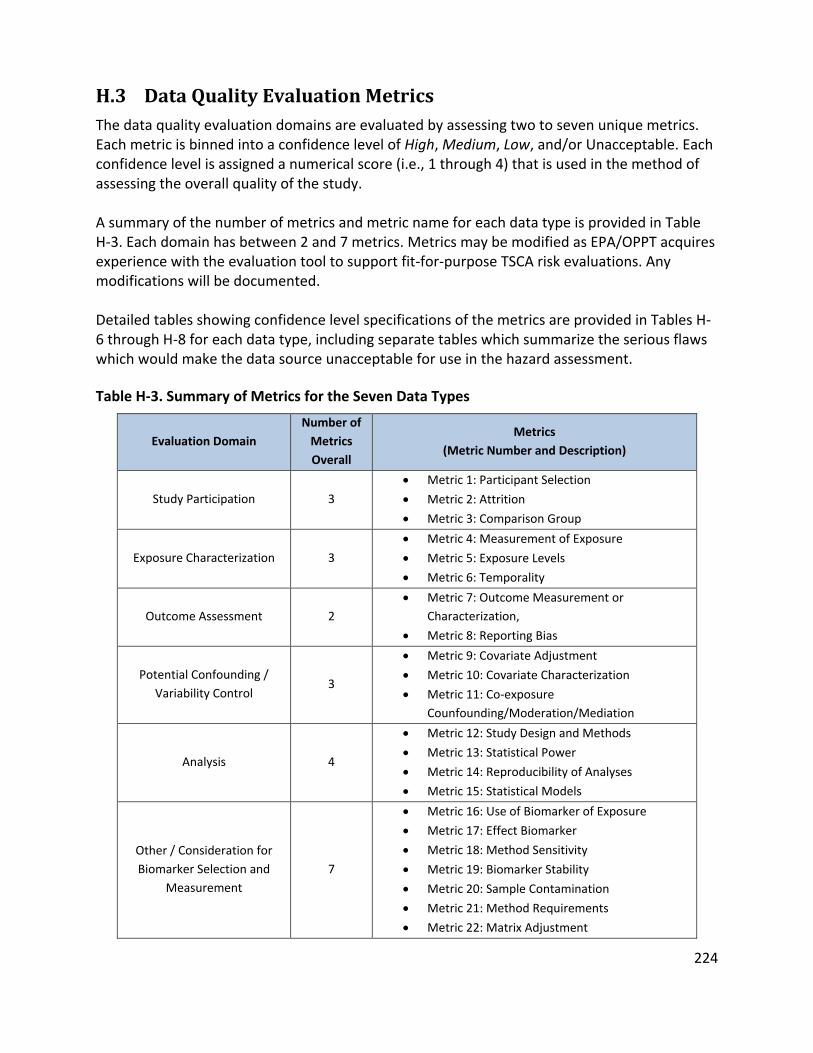
224
H.3 Data Quality Evaluation Metrics
The data quality evaluation domains are evaluated by assessing two to seven unique metrics. Each metric is binned into a confidence level of High, Medium, Low, and/or Unacceptable. Each confidence level is assigned a numerical score (i.e., 1 through 4) that is used in the method of assessing the overall quality of the study. A summary of the number of metrics and metric name for each data type is provided in Table H-3. Each domain has between 2 and 7 metrics. Metrics may be modified as EPA/OPPT acquires experience with the evaluation tool to support fit-for-purpose TSCA risk evaluations. Any modifications will be documented. Detailed tables showing confidence level specifications of the metrics are provided in Tables H-6 through H-8 for each data type, including separate tables which summarize the serious flaws which would make the data source unacceptable for use in the hazard assessment.
Table H-3. Summary of Metrics for the Seven Data Types
Evaluation Domain
Number of
Metrics
Overall
Metrics
(Metric Number and Description)
Study Participation 3
Metric 1: Participant Selection
Metric 2: Attrition
Metric 3: Comparison Group
Exposure Characterization 3
Metric 4: Measurement of Exposure
Metric 5: Exposure Levels
Metric 6: Temporality
Outcome Assessment 2
Metric 7: Outcome Measurement or
Characterization,
Metric 8: Reporting Bias
Potential Confounding /
Variability Control 3
Metric 9: Covariate Adjustment
Metric 10: Covariate Characterization
Metric 11: Co-exposure
Counfounding/Moderation/Mediation
Analysis 4
Metric 12: Study Design and Methods
Metric 13: Statistical Power
Metric 14: Reproducibility of Analyses
Metric 15: Statistical Models
Other / Consideration for
Biomarker Selection and
Measurement
7
Metric 16: Use of Biomarker of Exposure
Metric 17: Effect Biomarker
Metric 18: Method Sensitivity
Metric 19: Biomarker Stability
Metric 20: Sample Contamination
Metric 21: Method Requirements
Metric 22: Matrix Adjustment
225
H.4 Scoring Method and Determination of Overall Data Quality Level
A scoring system is used to assign the overall quality of the data source, as discussed in Appendix A. Each data source is assigned an overall qualitative confidence level of High, Medium, Low, or Unacceptable. This section provides details about the scoring system that will be applied to epidemiologic studies, including the weighting factors assigned to each metric score of each domain.
H.4.1 Weighting Factors
The weighting method assumes that each domain carries an equal amount of weight of 1. However, some metrics within a given domain are given greater weights than others in the same domain, if they are regarded as key or critical metrics. Thus, EPA will use a weighting approach to reflect that some metrics are more important than others when assessing the overall quality of the epidemiologic data. Each key or critical metric is assigned a higher weighting factor. The critical metrics are identified based on professional judgment in conjunction with consideration of the factors that are most frequently included in other study quality/risk of bias tools for epidemiologic literature. In developing metrics for each domain, several basic elements for epidemiologic studies were incorporated to form the structure of the 6 domains (Blumentthal et al. 2001), each of which are considered to be equally important aspects of an epidemiologic study. The critical metrics within each domain are those that cover the most important aspects of the domain and are those that more directly evaluate the role of confounding and bias. After pilot testing the evaluation tool, EPA recognized that more attention (or weight) should be given to studies that measure exposure and disease accurately and allow for the consideration of potential confounding factors. Therefore, metrics deemed as critical metrics are those that identify the major biases associated with the domain, evaluate the measurement of exposure and disease, and/or address any potential confounding. EPA/OPPT assigned a weighting factor that is twice the value of the other metrics within the same domain to each critical metric. Remaining metrics are assigned a weighting factor of 0.5 times the weighting factor assigned to the critical metric(s) in the domain. The sum of the weighting factors for each domain equals one. Tables H-4 identifies the critical metrics for epidemiologic studies, respectively, and provides a rationale for why the metrics are considered to be of greater importance than others within the domain. Table H-5 identifies the weighting factors assigned to each metric for epidemiologic studies, respectively.

226
Table H-4. Epidemiology Metrics with Greater Importance in the Evaluation and Rationale for Selection
Domain
Critical Metrics with Higher Weighting
Factors (Metric Number) a
Rationale
Study Participation
Study Participation
Participant Selection (Metric 1)
The participants selected for the study must be representative of the target population. Differences between participants and nonparticipants determines the amount of bias present, and differences should be well-described (Galea and Tracy 2007).
Attrition (Metric 2)
Study attrition threatens the internal validity of studies, affects sample size, and compromises the precision of the measured associations (Kristman et al. 2004).
Exposure characterization
Measurement of Exposure (Metric 4)
The exposure of interest of should be well-defined and measured in a manner that is accurate, precise, and reliable to ensure the internal and external validity of the study findings (Blumenthal et al. 2001, Nieuwenhuijsen 2015).
Temporality (Metric 6)
Temporality is essential to causal inference. Details must be provided to ensure the exposure sufficiently preceded the outcome and that enough time has passed since the exposure to observed said effect (Fedak et al. 2015).
Outcome assessment
Outcome Measurement or Characterization
(Metric 7)
The methods used for outcome assessment must be fully described, valid, and sensitive to ensure that the observed effects are true, and to enable valid comparisons across studies (Blumenthal et al. 2001).
Potential Confounding/
variable control
Covariate Adjustment (Metric 9)
Control for confounding variables either through study design or analysis is considered important to ensure that any observed effects are attributable to the chemical exposure of interest and not to other factors (Blumenthal et al. 2001).
Analysis Study Design and
Methods (Metric 12)
The study design selected and applied analytical techniques for the collected data must be suitable to address the research question at hand (Checkoway et al. 2007).
aFor the remaining metrics within the same domain, a weighting factor of 0.5*the key metric weighting factor is assigned
H.4.2 Calculation of Overall Study Score
A confidence level (1, 2, or 3 for High, Medium, or Low confidence, respectively) is assigned for each relevant metric within each domain. To determine the overall study score, the first step is to multiply the score for each metric (1, 2, or 3 for High, Medium, or Low confidence, respectively) by the appropriate weighting factor to obtain a weighted metric score. The weighted metric scores are then summed and divided by the sum of the weighting factors (for all metrics that are scored) to obtain an overall study score between 1 and 3. The equation for calculating the overall score is shown below:
Overall Score (range of 1 to 3) = ∑ (Metric Score x Weighting Factor)/∑(Weighting Factors)
227
Tables H-5 and H-6 present a summary of the domain, metrics and weighting approach for epidemiological studies with or without biomarkers, respectively. Table H-7 provides a scoring example for epidemiological studies where sample size is not applicable. EPA/OPPT plans to use data with an overall quality level of High, Medium, or Low confidence to quantitatively or qualitatively support the risk evaluations, but does not plan to use data rated as Unacceptable. Studies with any single metric scored as 4 will be automatically assigned an overall quality score of Unacceptable and further evaluation of the remaining metrics is not necessary. An Unacceptable score means that serious flaws are noted in the domain metric that consequently make the data unusable (or invalid). Any metrics that are Not rated/not applicable to the study under evaluation are not considered in the calculation of the study’s overall quality score. These metrics are not included in the nominator or denominator of the overall score equation. The overall score is calculated using only those metrics that receive a numerical score. In addition, if a publication reports more than one study or endpoint, each study and, as needed, each endpoint will be evaluated separately. Detailed tables showing quality criteria for the metrics are provided in Tables H-8 and H-9, including a table that summarizes the serious flaws that would make the data unacceptable for use in the human health hazard assessment.

228
Table H-5. Summary of Domain, Metrics, and Weighting Approach with Biomarkers
Domain Metric Range of
Metric Scores
Metric
weighting
Factor
Domain
Weight
Range of
Weighted
Metric Scores
Study
Participation
Participant Selection 1 to 3 0.4
1
0.4 to 1.2
Attrition 1 to 3 0.4 0.4 to 1.2
Comparison Group 1 to 3 0.2 0.2 to 0.6
Exposure
Characterization
Measurement of Exposure 1 to 3 0.4 1
0.4 to 1.2
Exposure Levels 1 to 3 0.2 0.2 to 0.6
Temporality 1 to 3 0.4 0.4 to 1.2
Outcome
Assessment
Outcome measurement or
characterization 1 to 3 0.67 1
0.67 to 2.01
Reporting Bias 1 to 3 0.33 0.33 to 0.99
Potential
Confounding/
Variable Control
Covariate Adjustment 1 to 3 0.5
1
0.5 to 1.5
Covariate Characterization 1 to 3 0.25 0.25 to 0.75
Co-exposure
Confounding/Moderation/
Mediation
1 to 3 0.25 0.25 to 0.75
Analysis
Study Design and Methods 1 to 3 0.4
1
0.4 to 1.2
Statistical Power 1 to 3 0.2 0.2 to 0.6
Reproducibility of Analyses 1 to 3 0.2 0.2 to 0.6
Statistical Models 1 to 3 0.2 0.2 to 0.6
Other
(if applicable)
Considerations for
Biomarker
Selection and
Measurement
(Lakind et al.,
2014)
Use of Biomarker of Exposure 1 to 3 0.143
1
0.143 to 0.429
Effect Biomarker 1 to 3 0.143
Method Sensitivity 1 to 3 0.143
Biomarker Stability 1 to 3 0.143
Sample Contamination 1 to 3 0.143
Method Requirements 1 to 3 0.143
Matrix Adjustment 1 to 3 0.143
Equation:
Overall Score = Sum of Weighted Scores/Sum of Metric Weighting Factor
Sum of Weighted
Scores = 6 to 18
Sum of Metric Weighting
Factors= 6
6/6=1;
18/6=3
Range of overall
score = 1 to 3
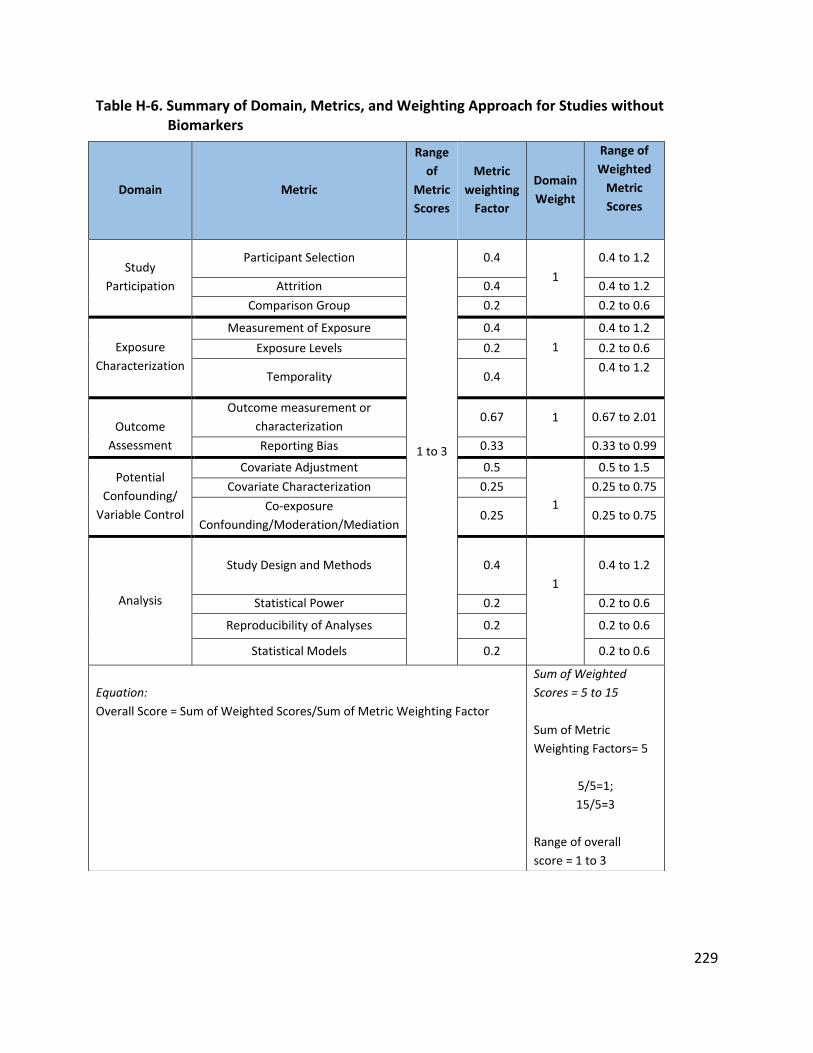
229
Table H-6. Summary of Domain, Metrics, and Weighting Approach for Studies without Biomarkers
Domain Metric
Range
of
Metric
Scores
Metric
weighting
Factor
Domain
Weight
Range of
Weighted
Metric
Scores
Study
Participation
Participant Selection
1 to 3
0.4
1
0.4 to 1.2
Attrition 0.4 0.4 to 1.2
Comparison Group 0.2 0.2 to 0.6
Exposure
Characterization
Measurement of Exposure 0.4
1
0.4 to 1.2
Exposure Levels 0.2 0.2 to 0.6
Temporality 0.4 0.4 to 1.2
Outcome
Assessment
Outcome measurement or
characterization 0.67 1
0.67 to 2.01
Reporting Bias 0.33 0.33 to 0.99
Potential
Confounding/
Variable Control
Covariate Adjustment 0.5
1
0.5 to 1.5
Covariate Characterization 0.25 0.25 to 0.75
Co-exposure
Confounding/Moderation/Mediation 0.25 0.25 to 0.75
Analysis
Study Design and Methods 0.4
1
0.4 to 1.2
Statistical Power 0.2 0.2 to 0.6
Reproducibility of Analyses 0.2 0.2 to 0.6
Statistical Models 0.2 0.2 to 0.6
Equation:
Overall Score = Sum of Weighted Scores/Sum of Metric Weighting Factor
Sum of Weighted
Scores = 5 to 15
Sum of Metric
Weighting Factors= 5
5/5=1;
15/5=3
Range of overall
score = 1 to 3

230
Table H-7. Example of Scoring for Epidemiologic Studies where Sample Size is Not Applicable
Domain Metric Metric
Score
Metric
Weighting
Factor
Weighted
Score
Study Participation
1. Participant Selection 1 0.4 0.4
2. Attrition 3 0.4 1.2
3. Comparison Group 2 0.2 0.4
Exposure Characterization
4. Measurement of Exposure 1 0.4 0.4
5. Exposure Levels 1 0.2 0.2
6. Temporality 1 0.4 0.8
Outcome Assessment
7. Outcome measurement or
characterization 3 0.67 2.01
8. Reporting Bias 2 0.33 0.33
Potential Confounding/
Variable Control
9. Covariate Adjustment 1 0.67 0.67
10. Covariate Characterization 1 0.33 0.33
11. Co-exposure
Confounding/Moderation/Mediation NR NR NR
Analysis
12. Study Design and Methods 1 0.4 1.2
13. Statistical Power 1 0.2 0.4
14. Reproducibility of Analyses 3 0.2 0.2
15. Statistical Models 3 0.2 0.6
Sum of scores 5 8.47
Overall Study Score 1.7 = Medium
NR= not rated/not applicable
Equation:
Overall Score = Sum of Weighted Scores/Sum of Metric Weighting Factor

231
H.5 Data Quality Criteria
Table H-8. Serious Flaws that Would Make Epidemiological Studies Unacceptable for Use in the Hazard Assessment
Optimization of the list of serious flaws may occur after pilot calibration exercises.
Domain Metric Description of Serious Flaw(s) in Data Source
Study Participation
Participant
Selection
For all study types: The reported information indicates that selection in
or out of the study (or analysis sample) and participation was likely to
be significantly biased (i.e., the exposure-outcome distribution of the
participants is likely not representative of the exposure-outcome
distributions in the overall population of eligible persons.)
Attrition
For cohort studies: The loss of subjects (i.e., incomplete outcome data)
was large and unacceptably handled (as described above in the low
confidence category) (Source: OHAT).
OR
Numbers of individuals were not reported at important stages of study
(e.g., numbers of eligible participants included in the study or analysis
sample, completing follow-up, and analyzed). Reasons were not
provided for non-participation at each stage [STROBE Checklist Item 13
(Von Elm et al., 2008)].
For case-control and cross-sectional studies: The exclusion of subjects
from analyses was large and unacceptably handled (as described above
in the low confidence category).
OR
Reasons were not provided for non-participation at each stage [STROBE
Checklist Item 13 (Von Elm et al., 2008)].
Comparison
Group
For cohort studies: Subjects in all exposure groups were not similar,
recruited within very different time frames, or had the very different
participation/ response rates (NTP, 2015a).
OR
Information was not reported to determine if participants in all
exposure groups were similar [STROBE Checklist 6 (Von Elm et al.,
2008)]
For case-control studies: Controls were drawn from a very dissimilar
population than cases or recruited within very different time frames
(NTP, 2015a).
OR
Rationale and/or methods for case and control selection, matching
criteria including number of controls per case (if relevant) were not
reported [STROBE Checklist 6 (Von Elm et al., 2008)].
For cross-sectional studies: Subjects in all exposure groups were not
similar, recruited within very different time frames, or had the very
different participation/response rates (NTP, 2015a).

232
Domain Metric Description of Serious Flaw(s) in Data Source
OR
Sources and methods of selection of participants in all exposure groups
were not reported [STROBE Checklist 6 (Von Elm et al., 2008)].
Exposure
Characterization
Measurement
of Exposure
For all study types: Exposure variables were not well defined, and
sources of data and detailed methods of exposure assessment were not
reported [STROBE Checklist 7 and 8 (Von Elm et al., 2008)].
OR
Exposure was assessed using methods known or suspected to have
poor validity (Source: OHAT).
OR
There is evidence of substantial exposure misclassification that would
significantly alter results.
Exposure Levels
For all study types: The levels of exposure are not sufficient or adequate
(as defined above) to detect an effect of exposure (Cooper et al., 2016).
OR
No description is provided on the levels or range of exposure.
Temporality
For all study types: Study lacks an established time order, such that
exposure is not likely to have occurred prior to outcome (Lakind et al.,
2014).
OR
Exposures clearly fell outside of relevant exposure window for the
outcome of interest.
OR
For each variable of interest (outcome and predictor), sources of data
and details of methods of assessment were not reported (e.g., periods
of exposure, dates of outcome ascertainment, etc.) [STROBE Checklist 8
(Von Elm et al., 2008)].
Outcome Assessment
Outcome
measurement
or
characterization
For all study types: Numbers of outcome events or summary
measures, or diagnostic criteria were not defined or reported [STROBE
Checklist 15 (Von Elm et al., 2008)].
Potential
Confounding/Variable
Control
Covariate
adjustment
For cohort and cross-sectional studies: The distribution of primary
covariates (excluding co-exposures) and known confounders differed
significantly between the exposure groups
OR
Confounding was demonstrated and was not appropriately adjusted for
in the final analyses (NTP, 2015a).
For case-control studies: The distribution of primary covariates
(excluding co-exposures) and known confounders differed significantly
between cases and controls.
OR
Confounding was demonstrated and was not appropriately adjusted for
in the final analyses (NTP, 2015a).

233
Domain Metric Description of Serious Flaw(s) in Data Source
Covariate
characterization
For all study types: Primary covariates (excluding co-exposures) and
confounders were not assessed.
Co-exposure
Confounding/
Moderation/
Mediation
For cohort and cross-sectional studies: There is direct evidence that
there was an unbalanced provision of additional co-exposures across
the primary study groups, which were not appropriately adjusted for.
For case-control studies: There is direct evidence that there was an
unbalanced provision of additional co-exposures across cases and
controls, which were not appropriately adjusted for, and significant
indication a biased exposure-outcome association.
Analysis
Study design
and methods
For all study types: The study design chosen was not appropriate for
the research question.
OR
Inappropriate statistical analyses were applied to assess the research
questions.
Statistical power
(sensitivity)
For cohort and cross-sectional studies: The number of participants are
inadequate to detect an effect in the exposed population and/or
subgroups of the total population.
For case-control studies: The number of cases and controls are
inadequate to detect an effect in the exposed population and/or
subgroups of the total population.
Other (if applicable)
Considerations for
Biomarker Selection
and Measurement
(Lakind et al., 2014)
Use of
Biomarker of
Exposure
Biomarker in a specified matrix is a poor surrogate (low accuracy and
precision) for exposure/dose.
Effect
biomarker
Biomarker has undetermined consequences (e.g., biomarker is not
specific to a health outcome).
Method
sensitivity
Frequency of detection too low to address the research hypothesis.
OR
LOD/LOQ (value or %) are not stated.
Biomarker
stability
Samples with either unknown storage history and/or no stability data
for target analytes and high likelihood of instability for the biomarker
under consideration.
Sample
contamination
There are known contamination issues and no documentation that the
issues were addressed.
Method
requirements
Instrumentation that only allows for possible quantification of the
biomarker, but the method has known interferants (e.g., GC–FID,
spectroscopy).
Matrix
adjustment
If applicable for the biomarker under consideration, no established
method for matrix adjustment was conducted.
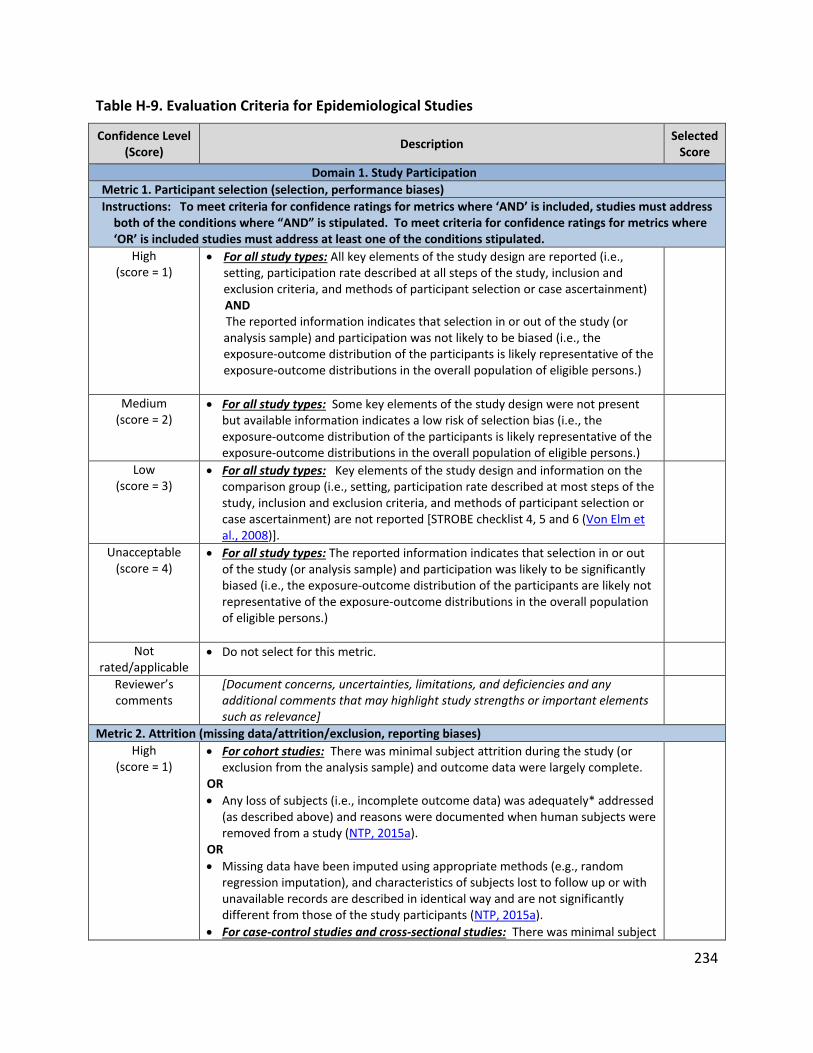
234
Table H-9. Evaluation Criteria for Epidemiological Studies
Confidence Level (Score)
Description Selected
Score
Domain 1. Study Participation
Metric 1. Participant selection (selection, performance biases)
Instructions: To meet criteria for confidence ratings for metrics where ‘AND’ is included, studies must address both of the conditions where “AND” is stipulated. To meet criteria for confidence ratings for metrics where ‘OR’ is included studies must address at least one of the conditions stipulated.
High (score = 1)
For all study types: All key elements of the study design are reported (i.e., setting, participation rate described at all steps of the study, inclusion and exclusion criteria, and methods of participant selection or case ascertainment)
AND The reported information indicates that selection in or out of the study (or analysis sample) and participation was not likely to be biased (i.e., the exposure-outcome distribution of the participants is likely representative of the exposure-outcome distributions in the overall population of eligible persons.)
Medium (score = 2)
For all study types: Some key elements of the study design were not present but available information indicates a low risk of selection bias (i.e., the exposure-outcome distribution of the participants is likely representative of the exposure-outcome distributions in the overall population of eligible persons.)
Low (score = 3)
For all study types: Key elements of the study design and information on the comparison group (i.e., setting, participation rate described at most steps of the study, inclusion and exclusion criteria, and methods of participant selection or case ascertainment) are not reported [STROBE checklist 4, 5 and 6 (Von Elm et al., 2008)].
Unacceptable (score = 4)
For all study types: The reported information indicates that selection in or out of the study (or analysis sample) and participation was likely to be significantly biased (i.e., the exposure-outcome distribution of the participants are likely not representative of the exposure-outcome distributions in the overall population of eligible persons.)
Not rated/applicable
Do not select for this metric.
Reviewer’s comments
[Document concerns, uncertainties, limitations, and deficiencies and any additional comments that may highlight study strengths or important elements such as relevance]
Metric 2. Attrition (missing data/attrition/exclusion, reporting biases)
High (score = 1)
For cohort studies: There was minimal subject attrition during the study (or exclusion from the analysis sample) and outcome data were largely complete.
OR
Any loss of subjects (i.e., incomplete outcome data) was adequately* addressed (as described above) and reasons were documented when human subjects were removed from a study (NTP, 2015a).
OR
Missing data have been imputed using appropriate methods (e.g., random regression imputation), and characteristics of subjects lost to follow up or with unavailable records are described in identical way and are not significantly different from those of the study participants (NTP, 2015a).
For case-control studies and cross-sectional studies: There was minimal subject

235
Confidence Level (Score)
Description Selected
Score
withdrawal from the study (or exclusion from the analysis sample) and outcome data were largely complete.
OR
Any exclusion of subjects from analyses was adequately* addressed (as described above), and reasons were documented when subjects were removed from the study or excluded from analyses (NTP, 2015a).
*NOTE for all study types: Adequate handling of subject attrition includes: very
little missing outcome data; reasons for missing subjects unlikely to be related to outcome (for survival data, censoring was unlikely to introduce bias); missing outcome data balanced in numbers across study groups, with similar reasons for missing data across groups.
Medium (score = 2)
For cohort studies: There was moderate subject attrition during the study (or exclusion from the analysis sample).
AND
Any loss or exclusion of subjects was adequately addressed (as described in the acceptable handling of subject attrition in the high confidence category) and reasons were documented when human subjects were removed from a study.
For case-control studies and cross-sectional studies: There was moderate subject withdrawal from the study (or exclusion from the analysis sample), but outcome data were largely complete.
AND
Any exclusion of subjects from analyses was adequately addressed (as described above), and reasons were documented when subjects were removed from the study or excluded from analyses (NTP, 2015a).
Low (score = 3)
For cohort studies: There was large subject attrition during the study (or exclusion from the analysis sample).
OR
Unacceptable handling of subject attrition: reason for missing outcome data likely to be related to true outcome, with either imbalance in numbers or reasons for missing data across study groups; or potentially inappropriate application of imputation (Source: OHAT).
For case-control and cross-sectional studies: There was large subject withdrawal from the study (or exclusion from the analysis sample).
OR
Unacceptable handling of subject attrition: reason for missing outcome data likely to be related to true outcome, with either imbalance in numbers or reasons for missing data across study groups; or potentially inappropriate application of imputation.
Unacceptable (score = 4)
For cohort studies: The loss of subjects (i.e., incomplete outcome data) was large and unacceptably handled (as described above in the low confidence category) (Source: OHAT).
OR
Numbers of individuals were not reported at important stages of study (e.g., numbers of eligible participants included in the study or analysis sample, completing follow-up, and analyzed). Reasons were not provided for non-participation at each stage [STROBE Checklist Item 13 (Von Elm et al., 2008)].
For case-control and cross-sectional studies: The exclusion of subjects from
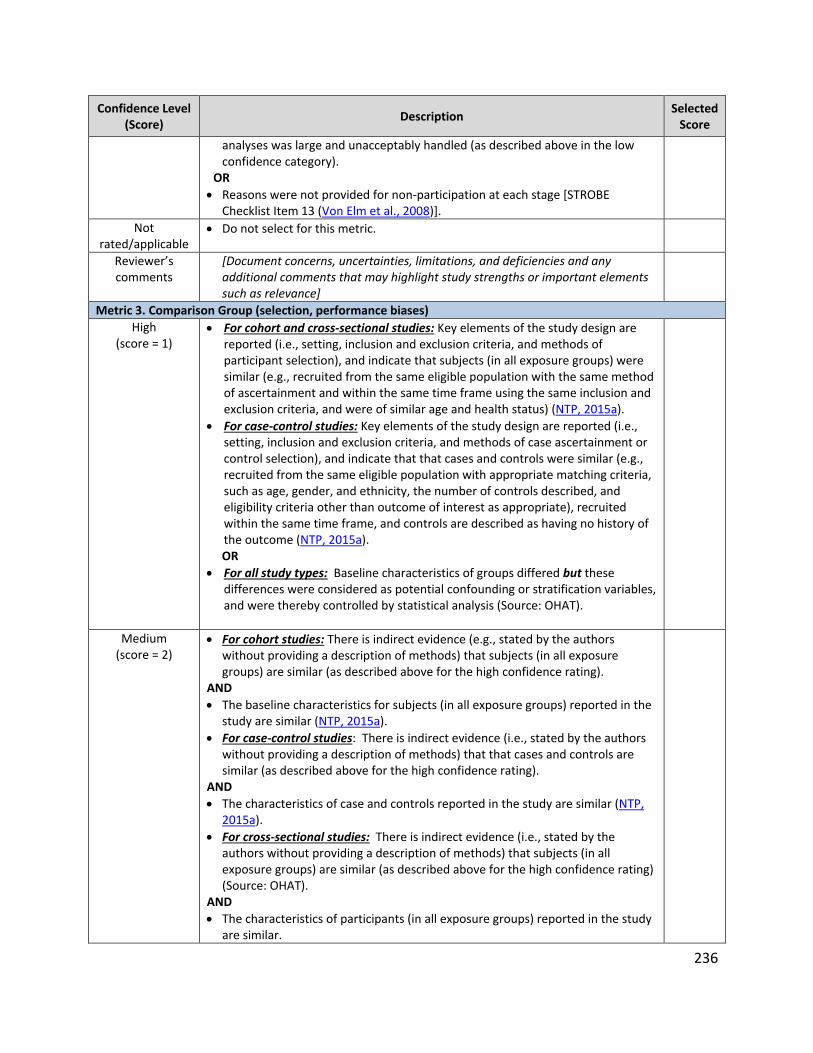
236
Confidence Level (Score)
Description Selected
Score
analyses was large and unacceptably handled (as described above in the low confidence category).
OR
Reasons were not provided for non-participation at each stage [STROBE Checklist Item 13 (Von Elm et al., 2008)].
Not rated/applicable
Do not select for this metric.
Reviewer’s comments
[Document concerns, uncertainties, limitations, and deficiencies and any additional comments that may highlight study strengths or important elements such as relevance]
Metric 3. Comparison Group (selection, performance biases)
High (score = 1)
For cohort and cross-sectional studies: Key elements of the study design are reported (i.e., setting, inclusion and exclusion criteria, and methods of participant selection), and indicate that subjects (in all exposure groups) were similar (e.g., recruited from the same eligible population with the same method of ascertainment and within the same time frame using the same inclusion and exclusion criteria, and were of similar age and health status) (NTP, 2015a).
For case-control studies: Key elements of the study design are reported (i.e., setting, inclusion and exclusion criteria, and methods of case ascertainment or control selection), and indicate that that cases and controls were similar (e.g., recruited from the same eligible population with appropriate matching criteria, such as age, gender, and ethnicity, the number of controls described, and eligibility criteria other than outcome of interest as appropriate), recruited within the same time frame, and controls are described as having no history of the outcome (NTP, 2015a).
OR
For all study types: Baseline characteristics of groups differed but these differences were considered as potential confounding or stratification variables, and were thereby controlled by statistical analysis (Source: OHAT).
Medium (score = 2)
For cohort studies: There is indirect evidence (e.g., stated by the authors without providing a description of methods) that subjects (in all exposure groups) are similar (as described above for the high confidence rating).
AND
The baseline characteristics for subjects (in all exposure groups) reported in the study are similar (NTP, 2015a).
For case-control studies: There is indirect evidence (i.e., stated by the authors without providing a description of methods) that that cases and controls are similar (as described above for the high confidence rating).
AND
The characteristics of case and controls reported in the study are similar (NTP, 2015a).
For cross-sectional studies: There is indirect evidence (i.e., stated by the authors without providing a description of methods) that subjects (in all exposure groups) are similar (as described above for the high confidence rating) (Source: OHAT).
AND
The characteristics of participants (in all exposure groups) reported in the study are similar.

237
Confidence Level (Score)
Description Selected
Score
Low (score = 3)
For cohort studies: There is indirect evidence (i.e., stated by the authors without providing a description of methods) that subjects (in all exposure groups) were similar (as described above for the high confidence rating).
AND
The baseline characteristics for subjects (in all exposure groups) are not reported (NTP, 2015a).
For case-control studies: There is indirect evidence (i.e., stated by the authors without providing a description of methods) that that cases and controls were similar (as described above for the high confidence rating).
AND
The characteristics of case and controls are not reported (Source: (NTP, 2015a).
For cross-sectional studies: There is indirect evidence (i.e., stated by the authors without providing a description of method) that subjects (in all exposure groups) were similar (as described above for the high confidence rating).
AND
The characteristics of participants (in all exposure groups) are not reported (Source: OHAT).
Unacceptable (score = 4)
For cohort studies: Subjects in all exposure groups were not similar, recruited within very different time frames, or had the very different participation/ response rates (NTP, 2015a).
OR
Information was not reported to determine if participants in all exposure groups were similar [STROBE Checklist 6 (Von Elm et al., 2008)]
For case-control studies: Controls were drawn from a very dissimilar population than cases or recruited within very different time frames (NTP, 2015a).
OR
Rationale and/or methods for case and control selection, matching criteria including number of controls per case (if relevant) were not reported [STROBE Checklist 6 (Von Elm et al., 2008)].
For cross-sectional studies: Subjects in all exposure groups were not similar, recruited within very different time frames, or had the very different participation/response rates (NTP, 2015a).
OR
Sources and methods of selection of participants in all exposure groups were not reported [STROBE Checklist 6 (Von Elm et al., 2008)].
Not rated/applicable
Do not select for this metric.
Reviewer’s comments
[Document concerns, uncertainties, limitations, and deficiencies and any additional comments that may highlight study strengths or important elements such as relevance]
Domain 2. Exposure Characterization
Metric 4. Measurement of Exposure (Detection/measurement/information, performance biases)
High (score = 1)
For all study types: Exposure was consistently assessed (i.e., under the same method and time-frame) using well-established methods (e.g., personal and/or industrial hygiene data used to determine levels of exposure, a frequently used biomarker of exposure) that directly measure exposure (e.g., measurement of the chemical in the environment (air, drinking water, consumer product, etc.) or

238
Confidence Level (Score)
Description Selected
Score
measurement of the chemical concentration in a biological matrix such as blood, plasma, urine, etc.) (NTP, 2015a).
Medium (score = 2)
For all study types: Exposure was directly measured and assessed using a method that is not well-established (e.g., newly developed biomarker of exposure), but is validated against a well-established method and demonstrated a high agreement between the two methods.
Low (score = 3)
For all study types: A less-established method (e.g., newly developed biomarker of exposure) was used and no method validation was conducted against well-established methods, but there was little to no evidence that the method had poor validity and little to no evidence of significant exposure misclassification (e.g., differential recall of self-reported exposure) (Source: OHAT).
Unacceptable (score = 4)
For all study types: Exposure variables were not well defined, and sources of data and detailed methods of exposure assessment were not reported [STROBE Checklist 7 and 8 (Von Elm et al., 2008)].
OR
Exposure was assessed using methods known or suspected to have poor validity (Source: OHAT).
OR
There is evidence of substantial exposure misclassification that would significantly alter results.
Not rated/applicable
Do not select for this metric.
Reviewer’s comments
[Document concerns, uncertainties, limitations, and deficiencies and any additional comments that may highlight study strengths or important elements such as relevance]
Metric 5. Exposure levels (Detection/measurement/information biases)
High (score = 1)
For all study types: The levels of exposure are sufficient* or adequate to detect an effect of exposure {Cooper, 2016, 3121908}.
* Sufficient or adequate for cohort and cross-sectional studies includes the reporting of at least 2 levels of exposure (referent group + 1 or more exposure groups) (Cooper) that capture exposure spatial and temporal variability within the study population (Source: IRIS).
Medium (score = 2)
Do not select for this metric.
Low (score = 3)
Do not select for this metric.
Unacceptable (score = 4)
For all study types: The levels of exposure are not sufficient or adequate (as defined above) to detect an effect of exposure (Cooper et al., 2016).
OR
No description is provided on the levels or range of exposure.
Not rated/applicable
Do not select for this metric.
Reviewer’s comments
[Document concerns, uncertainties, limitations, and deficiencies and any additional comments that may highlight study strengths or important elements such as relevance]
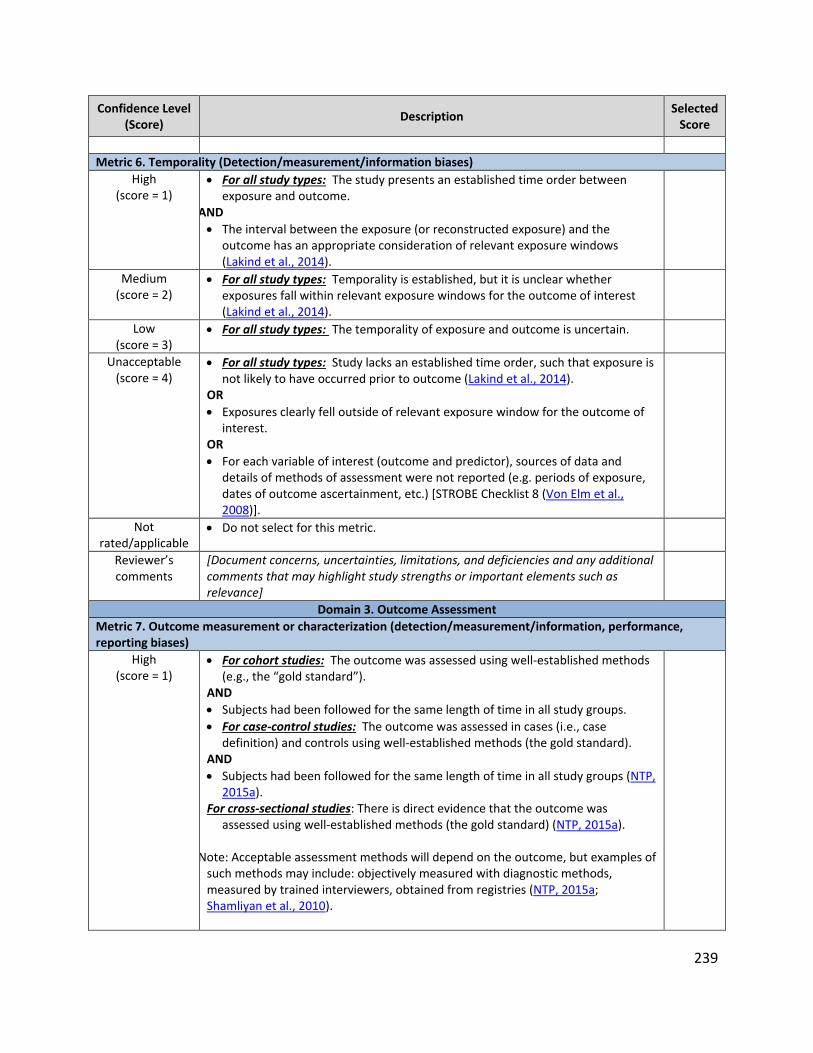
239
Confidence Level (Score)
Description Selected
Score
Metric 6. Temporality (Detection/measurement/information biases)
High (score = 1)
For all study types: The study presents an established time order between exposure and outcome.
AND
The interval between the exposure (or reconstructed exposure) and the outcome has an appropriate consideration of relevant exposure windows (Lakind et al., 2014).
Medium (score = 2)
For all study types: Temporality is established, but it is unclear whether exposures fall within relevant exposure windows for the outcome of interest (Lakind et al., 2014).
Low (score = 3)
For all study types: The temporality of exposure and outcome is uncertain.
Unacceptable (score = 4)
For all study types: Study lacks an established time order, such that exposure is not likely to have occurred prior to outcome (Lakind et al., 2014).
OR
Exposures clearly fell outside of relevant exposure window for the outcome of interest.
OR
For each variable of interest (outcome and predictor), sources of data and details of methods of assessment were not reported (e.g. periods of exposure, dates of outcome ascertainment, etc.) [STROBE Checklist 8 (Von Elm et al., 2008)].
Not rated/applicable
Do not select for this metric.
Reviewer’s comments
[Document concerns, uncertainties, limitations, and deficiencies and any additional comments that may highlight study strengths or important elements such as relevance]
Domain 3. Outcome Assessment
Metric 7. Outcome measurement or characterization (detection/measurement/information, performance, reporting biases)
High (score = 1)
For cohort studies: The outcome was assessed using well-established methods (e.g., the “gold standard”).
AND
Subjects had been followed for the same length of time in all study groups.
For case-control studies: The outcome was assessed in cases (i.e., case definition) and controls using well-established methods (the gold standard).
AND
Subjects had been followed for the same length of time in all study groups (NTP, 2015a).
For cross-sectional studies: There is direct evidence that the outcome was assessed using well-established methods (the gold standard) (NTP, 2015a).
*Note: Acceptable assessment methods will depend on the outcome, but examples of
such methods may include: objectively measured with diagnostic methods, measured by trained interviewers, obtained from registries (NTP, 2015a; Shamliyan et al., 2010).
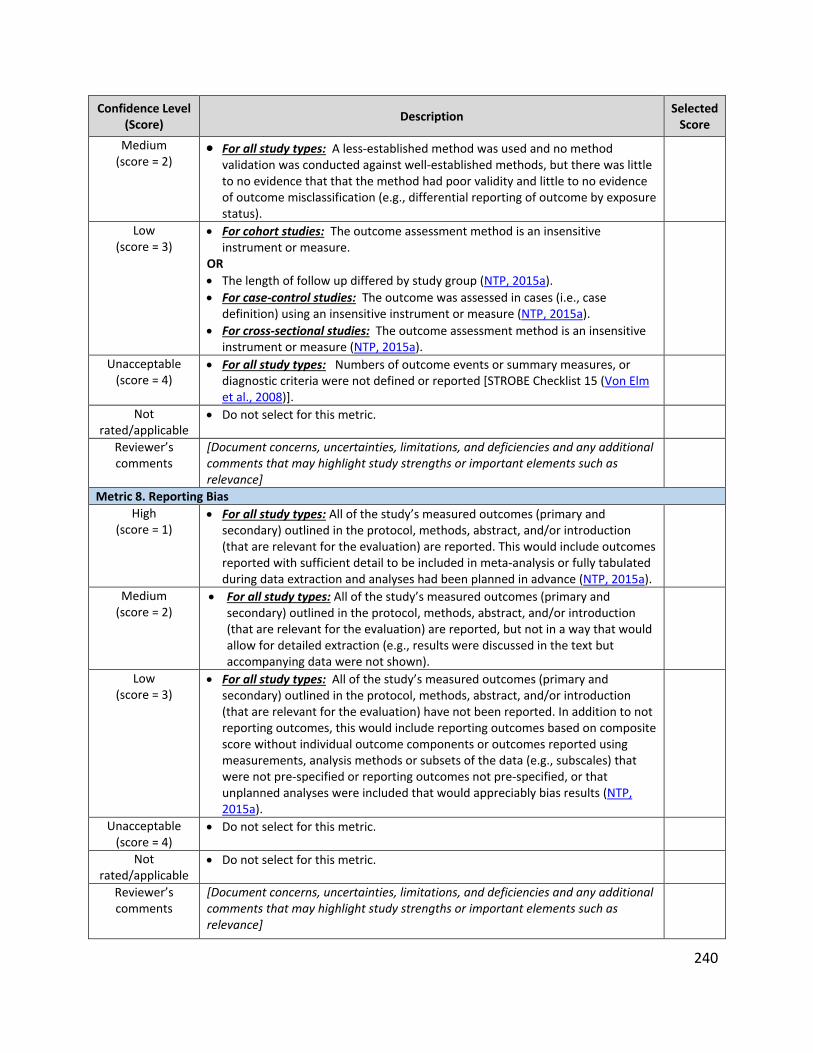
240
Confidence Level (Score)
Description Selected
Score
Medium (score = 2)
For all study types: A less-established method was used and no method validation was conducted against well-established methods, but there was little to no evidence that that the method had poor validity and little to no evidence of outcome misclassification (e.g., differential reporting of outcome by exposure status).
Low (score = 3)
For cohort studies: The outcome assessment method is an insensitive instrument or measure.
OR
The length of follow up differed by study group (NTP, 2015a).
For case-control studies: The outcome was assessed in cases (i.e., case definition) using an insensitive instrument or measure (NTP, 2015a).
For cross-sectional studies: The outcome assessment method is an insensitive instrument or measure (NTP, 2015a).
Unacceptable (score = 4)
For all study types: Numbers of outcome events or summary measures, or diagnostic criteria were not defined or reported [STROBE Checklist 15 (Von Elm et al., 2008)].
Not rated/applicable
Do not select for this metric.
Reviewer’s comments
[Document concerns, uncertainties, limitations, and deficiencies and any additional comments that may highlight study strengths or important elements such as relevance]
Metric 8. Reporting Bias
High (score = 1)
For all study types: All of the study’s measured outcomes (primary and secondary) outlined in the protocol, methods, abstract, and/or introduction (that are relevant for the evaluation) are reported. This would include outcomes reported with sufficient detail to be included in meta-analysis or fully tabulated during data extraction and analyses had been planned in advance (NTP, 2015a).
Medium (score = 2)
For all study types: All of the study’s measured outcomes (primary and secondary) outlined in the protocol, methods, abstract, and/or introduction (that are relevant for the evaluation) are reported, but not in a way that would allow for detailed extraction (e.g., results were discussed in the text but accompanying data were not shown).
Low (score = 3)
For all study types: All of the study’s measured outcomes (primary and secondary) outlined in the protocol, methods, abstract, and/or introduction (that are relevant for the evaluation) have not been reported. In addition to not reporting outcomes, this would include reporting outcomes based on composite score without individual outcome components or outcomes reported using measurements, analysis methods or subsets of the data (e.g., subscales) that were not pre-specified or reporting outcomes not pre-specified, or that unplanned analyses were included that would appreciably bias results (NTP, 2015a).
Unacceptable (score = 4)
Do not select for this metric.
Not rated/applicable
Do not select for this metric.
Reviewer’s comments
[Document concerns, uncertainties, limitations, and deficiencies and any additional comments that may highlight study strengths or important elements such as relevance]
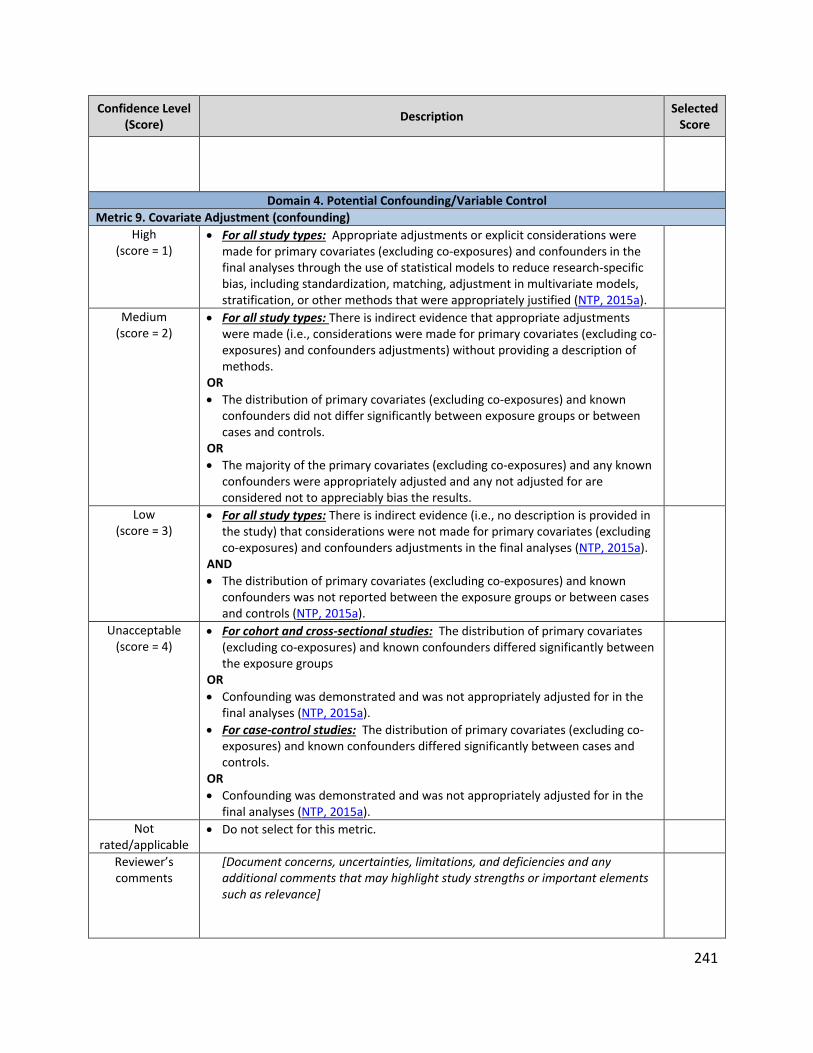
241
Confidence Level (Score)
Description Selected
Score
Domain 4. Potential Confounding/Variable Control
Metric 9. Covariate Adjustment (confounding)
High (score = 1)
For all study types: Appropriate adjustments or explicit considerations were made for primary covariates (excluding co-exposures) and confounders in the final analyses through the use of statistical models to reduce research-specific bias, including standardization, matching, adjustment in multivariate models, stratification, or other methods that were appropriately justified (NTP, 2015a).
Medium (score = 2)
For all study types: There is indirect evidence that appropriate adjustments were made (i.e., considerations were made for primary covariates (excluding co-exposures) and confounders adjustments) without providing a description of methods.
OR
The distribution of primary covariates (excluding co-exposures) and known confounders did not differ significantly between exposure groups or between cases and controls.
OR
The majority of the primary covariates (excluding co-exposures) and any known confounders were appropriately adjusted and any not adjusted for are considered not to appreciably bias the results.
Low (score = 3)
For all study types: There is indirect evidence (i.e., no description is provided in the study) that considerations were not made for primary covariates (excluding co-exposures) and confounders adjustments in the final analyses (NTP, 2015a).
AND
The distribution of primary covariates (excluding co-exposures) and known confounders was not reported between the exposure groups or between cases and controls (NTP, 2015a).
Unacceptable (score = 4)
For cohort and cross-sectional studies: The distribution of primary covariates (excluding co-exposures) and known confounders differed significantly between the exposure groups
OR
Confounding was demonstrated and was not appropriately adjusted for in the final analyses (NTP, 2015a).
For case-control studies: The distribution of primary covariates (excluding co-exposures) and known confounders differed significantly between cases and controls.
OR
Confounding was demonstrated and was not appropriately adjusted for in the final analyses (NTP, 2015a).
Not rated/applicable
Do not select for this metric.
Reviewer’s comments
[Document concerns, uncertainties, limitations, and deficiencies and any additional comments that may highlight study strengths or important elements such as relevance]

242
Confidence Level (Score)
Description Selected
Score
Metric 10. Covariate Characterization (measurement/information, confounding biases)
High (score = 1)
For all study types: Primary covariates (excluding co-exposures) and confounders were assessed using valid and reliable methodology (e.g., validated questionnaires, biomarker).
Medium (score = 2)
For all study types: A less-established method was used and no method validation was conducted against well-established methods, but there was little to no evidence that that the method had poor validity and little to no evidence of confounding.
Low (score = 3)
For all study types: The primary covariate (excluding co-exposures) and confounder assessment method is an insensitive instrument or measure or a method of unknown validity.
Unacceptable (score = 4)
For all study types: Primary covariates (excluding co-exposures) and confounders were not assessed.
Not rated/applicable
Do not select for this metric.
Reviewer’s comments
[Document concerns, uncertainties, limitations, and deficiencies and any additional comments that may highlight study strengths or important elements such as relevance]
Metric 11. Co-exposure Confounding/Moderation/Mediation (measurement/information, confounding biases)
High (score = 1)
For all study types: Any co-exposures to pollutants that are not the target exposure that would likely bias the results were not present.
OR
Co-exposures to pollutants were appropriately measured and adjusted for.
Medium (score = 2)
Do not select for this metric.
Low (score = 3)
Do not select for this metric.
Unacceptable (score = 4)
For cohort and cross-sectional studies: There is direct evidence that there was an unbalanced provision of additional co-exposures across the primary study groups, which were not appropriately adjusted for.
For case-control studies: There is direct evidence that there was an unbalanced provision of additional co-exposures across cases and controls, which were not appropriately adjusted for, and significant indication a biased exposure-outcome association.
Not rated/applicable
Enter ‘NA’ and do not score this metric.
Reviewer’s comments
[Document concerns, uncertainties, limitations, and deficiencies and any additional comments that may highlight study strengths or important elements such as relevance]
Domain 5. Analysis
Metric 12. Study Design and Methods (reporting bias)
High (score = 1)
For all study types: The study design chosen was appropriate for the research question (e.g. assess the association between exposure levels and common chronic diseases over time with cohort studies, assess the association between exposure and rare diseases with case-control studies, and assess the association between exposure levels and acute disease with a cross-sectional study design).

243
Confidence Level (Score)
Description Selected
Score
AND
The study uses an appropriate statistical method to address the research question(s) (e.g., repeated measures analysis for longitudinal studies, logistic regression analysis for case-control studies).
Medium (score = 2)
Do not select for this metric.
Low (score = 3)
Do not select for this metric.
Unacceptable (score = 4)
For all study types: The study design chosen was not appropriate for the research question.
OR
Inappropriate statistical analyses were applied to assess the research questions.
Not rated/applicable
Do not select for this metric.
Reviewer’s comments
[Document concerns, uncertainties, limitations, and deficiencies and any additional comments that may highlight study strengths or important elements such as relevance]
Metric 13. Statistical power (sensitivity, reporting bias)
High (score = 1)
For cohort and cross-sectional studies: The number of participants are adequate to detect an effect in the exposed population and/or subgroups of the total population.
OR
The paper reported statistical power high enough (≥ 80%) to detect an effect in the exposure population and/or subgroups of the total population.
For case-control studies: The number of cases and controls are adequate to detect an effect in the exposed population and/or subgroups of the total population.
OR
The paper reported statistical power was high (≥ 80%) to detect an effect in the exposure population and/or subgroups of the total population.
Medium (score = 2)
Do not select for this metric.
Low (score = 3)
Do not select for this metric.
Unacceptable (score = 4)
For cohort and cross-sectional studies: The number of participants are inadequate to detect an effect in the exposed population and/or subgroups of the total population.
For case-control studies: The number of cases and controls are inadequate to detect an effect in the exposed population and/or subgroups of the total population.
Not rated/applicable
Do not select for this metric.
Reviewer’s comments
[Document concerns, uncertainties, limitations, and deficiencies and any additional comments that may highlight study strengths or important elements such as relevance]

244
Confidence Level (Score)
Description Selected
Score
Metric 14. Reproducibility of analyses [adapted from Blettner et al. (2001)]
High (score = 1)
For all study types: The description of the analysis is sufficient to understand precisely what has been done and to be reproducible.
Medium (score = 2)
Do not select for this metric.
Low (score = 3)
For all study types: The description of the analysis is insufficient to understand what has been done and to be reproducible OR a description of analyses are not present (e.g., statistical tests and estimation procedures were not described, variables used in the analysis were not listed, transformations of continuous variables (such as logarithm) were not explained, rules for categorization of continuous variables were not presented, deleting of outliers were not elucidated and how missing values are dealt with was not mentioned).
Unacceptable (score = 4)
Do not select for this metric.
Not rated/applicable
Do not select for this metric.
Reviewer’s comments
[Document concerns, uncertainties, limitations, and deficiencies and any additional comments that may highlight study strengths or important elements such as relevance]
Metric 15. Statistical Models (confounding bias)
High (score = 1)
For all study types: The statistical model building process is transparent (it is stated how/why variables were included or excluded from the multivariate model) AND model assumptions were met.
Medium (score = 2)
Do not select for this metric.
Low (score = 3)
For all study types: The statistical model building process is not transparent OR it is not stated how/why variables were included or excluded from the multivariate model OR model assumptions were not met OR a description of analyses are not present OR no sensitivity analyses are described OR model assumptions were not discussed [STROBE Checklist 12e (Von Elm et al., 2008)].
Unacceptable (score = 4)
Do not select for this metric.
Not rated/applicable
Enter ‘NA’ if the study did not use a statistical model.
Reviewer’s comments
[Document concerns, uncertainties, limitations, and deficiencies and any additional comments that may highlight study strengths or important elements such as relevance]
Domain 6. Other (if applicable) Considerations for Biomarker Selection and Measurement Lakind et al. (2014)
Metric 16. Use of Biomarker of Exposure (detection/measurement/information biases)
High (score = 1)
Biomarker in a specified matrix has accurate and precise quantitative relationship with external exposure, internal dose, or target dose.
AND
Biomarker is derived from exposure to one parent chemical.
Medium (score = 2)
Biomarker in a specified matrix has accurate and precise quantitative relationship with external exposure, internal dose, or target dose.
AND
Biomarker is derived from multiple parent chemicals.

245
Confidence Level (Score)
Description Selected
Score
Low (score = 3)
Evidence exists for a relationship between biomarker in a specified matrix and external exposure, internal dose or target dose, but there has been no assessment of accuracy and precision or none was reported.
Unacceptable (score = 4)
Biomarker in a specified matrix is a poor surrogate (low accuracy and precision) for exposure/dose.
Not rated/applicable
Enter ‘NA’ and do not score the metric if no biomarker of exposure was measured.
Reviewer’s comments
[Document concerns, uncertainties, limitations, and deficiencies and any additional comments that may highlight study strengths or important elements such as relevance]
Metric 17. Effect biomarker (detection/measurement/information biases)
High (score = 1)
Bioindicator of a key event in an AOP.
Medium (score = 2)
Biomarkers of effect shown to have a relationship to health outcomes using well validated methods, but the mechanism of action is not understood.
Low (score = 3)
Biomarkers of effect shown to have a relationship to health outcomes, but the method is not well validated and mechanism of action is not understood.
Unacceptable (score = 4)
Biomarker has undetermined consequences (e.g., biomarker is not specific to a health outcome).
Not rated/applicable
Enter ‘NA’ and do not score the metric if no biomarker of effect was measured.
Reviewer’s comments
Metric 18. Method sensitivity (detection/measurement/information biases)
High (score = 1)
Limits of detection are low enough to detect chemicals in a sufficient percentage of the samples to address the research question.
Medium (score = 2)
Do not select for this metric.
Low (score = 3)
Do not select for this metric.
Unacceptable (score = 4)
Frequency of detection too low to address the research hypothesis. OR
LOD/LOQ (value or %) are not stated.
Not rated/applicable
Enter ‘NA’ and do not score the metric.
Reviewer’s comments
[Document concerns, uncertainties, limitations, and deficiencies and any additional comments that may highlight study strengths or important elements such as relevance]
Metric 19. Biomarker stability (detection/measurement/information biases)
High (score = 1)
Samples with a known history and documented stability data or those using real-time measurements.
Medium (score = 2)
Do not select for this metric.
Low (score = 3)
Samples have known losses during storage, but the difference between low and high exposures can be qualitatively assessed.
Unacceptable (score = 4)
Samples with either unknown storage history and/or no stability data for target analytes and high likelihood of instability for the biomarker under consideration.

246
Confidence Level (Score)
Description Selected
Score
Not rated/applicable
Enter ‘NA’ and do not score the metric if no biomarkers were assessed.
Reviewer’s comments
[Document concerns, uncertainties, limitations, and deficiencies and any additional comments that may highlight study strengths or important elements such as relevance]
Metric 20. Sample contamination (detection/measurement/information biases)
High (score = 1)
Samples are contamination-free from the time of collection to the time of measurement (e.g., by use of certified analyte free collection supplies and reference materials, and appropriate use of blanks both in the field and lab).
AND
Documentation of the steps taken to provide the necessary assurance that the study data are reliable is included.
Medium (score = 2)
Samples are stated to be contamination-free from the time of collection to the time of measurement.
AND
There is incomplete documentation of the steps taken to provide the necessary assurance that the study data are reliable.
Low (score = 3)
Samples are known to have contamination issues, but steps have been taken to address and correct contamination issues.
OR
Samples are stated to be contamination-free from the time of collection to the time of measurement, but there is no use or documentation of the steps taken to provide the necessary assurance that the study data are reliable.
Unacceptable (4) There are known contamination issues and no documentation that the issues were addressed.
Not rated/applicable
Enter ‘NA’ and do not score the metric if no samples were collected.
Reviewer’s comments
[Document concerns, uncertainties, limitations, and deficiencies and any additional comments that may highlight study strengths or important elements such as relevance]
Metric 21. Method requirements (detection/measurement/information biases)
High (score = 1)
Instrumentation that provides unambiguous identification and quantitation of the biomarker at the required sensitivity (e.g., GC–HRMS, GC–MS/MS, LC–MS/MS).
Medium (score = 2)
Do not select for this metric.
Low (score = 3)
Instrumentation that allows for identification of the biomarker with a high degree of confidence and the required sensitivity (e.g., GC–MS, GC–ECD).
Unacceptable (score = 4)
Instrumentation that only allows for possible quantification of the biomarker, but the method has known interferants (e.g., GC–FID, spectroscopy).
Not rated/applicable
Enter ‘NA’ and do not score the metric if biomarkers were not measured.
Reviewer’s comments
[Document concerns, uncertainties, limitations, and deficiencies and any additional comments that may highlight study strengths or important elements such as relevance]
Metric 22. Matrix adjustment (detection/measurement/information biases)
High (score = 1)
If applicable for the biomarker under consideration, study provides results, either in the main publication or as a supplement, for adjusted and unadjusted
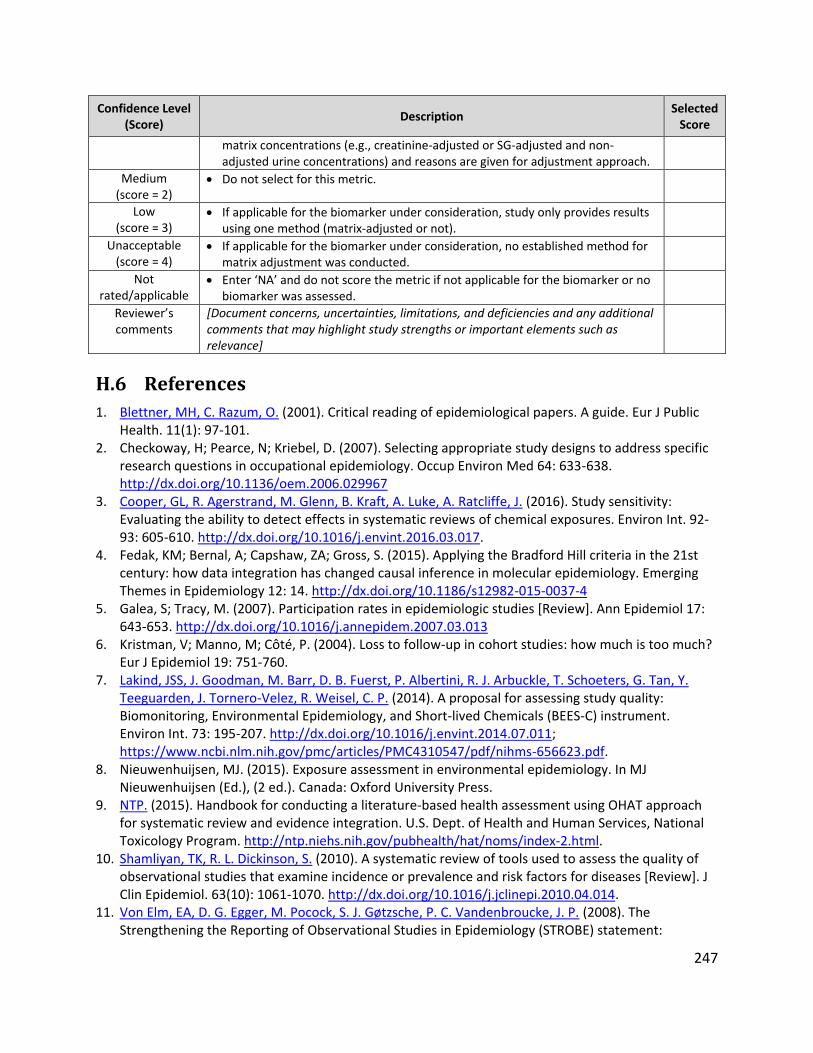
247
Confidence Level (Score)
Description Selected
Score
matrix concentrations (e.g., creatinine-adjusted or SG-adjusted and non-adjusted urine concentrations) and reasons are given for adjustment approach.
Medium (score = 2)
Do not select for this metric.
Low (score = 3)
If applicable for the biomarker under consideration, study only provides results using one method (matrix-adjusted or not).
Unacceptable (score = 4)
If applicable for the biomarker under consideration, no established method for matrix adjustment was conducted.
Not rated/applicable
Enter ‘NA’ and do not score the metric if not applicable for the biomarker or no biomarker was assessed.
Reviewer’s comments
[Document concerns, uncertainties, limitations, and deficiencies and any additional comments that may highlight study strengths or important elements such as relevance]
H.6 References
1. Blettner, MH, C. Razum, O. (2001). Critical reading of epidemiological papers. A guide. Eur J Public Health. 11(1): 97-101.
2. Checkoway, H; Pearce, N; Kriebel, D. (2007). Selecting appropriate study designs to address specific research questions in occupational epidemiology. Occup Environ Med 64: 633-638. http://dx.doi.org/10.1136/oem.2006.029967
3. Cooper, GL, R. Agerstrand, M. Glenn, B. Kraft, A. Luke, A. Ratcliffe, J. (2016). Study sensitivity: Evaluating the ability to detect effects in systematic reviews of chemical exposures. Environ Int. 92-93: 605-610. http://dx.doi.org/10.1016/j.envint.2016.03.017.
4. Fedak, KM; Bernal, A; Capshaw, ZA; Gross, S. (2015). Applying the Bradford Hill criteria in the 21st century: how data integration has changed causal inference in molecular epidemiology. Emerging Themes in Epidemiology 12: 14. http://dx.doi.org/10.1186/s12982-015-0037-4
5. Galea, S; Tracy, M. (2007). Participation rates in epidemiologic studies [Review]. Ann Epidemiol 17: 643-653. http://dx.doi.org/10.1016/j.annepidem.2007.03.013
6. Kristman, V; Manno, M; Côté, P. (2004). Loss to follow-up in cohort studies: how much is too much? Eur J Epidemiol 19: 751-760.
7. Lakind, JSS, J. Goodman, M. Barr, D. B. Fuerst, P. Albertini, R. J. Arbuckle, T. Schoeters, G. Tan, Y. Teeguarden, J. Tornero-Velez, R. Weisel, C. P. (2014). A proposal for assessing study quality: Biomonitoring, Environmental Epidemiology, and Short-lived Chemicals (BEES-C) instrument. Environ Int. 73: 195-207. http://dx.doi.org/10.1016/j.envint.2014.07.011; https://www.ncbi.nlm.nih.gov/pmc/articles/PMC4310547/pdf/nihms-656623.pdf.
8. Nieuwenhuijsen, MJ. (2015). Exposure assessment in environmental epidemiology. In MJ Nieuwenhuijsen (Ed.), (2 ed.). Canada: Oxford University Press.
9. NTP. (2015). Handbook for conducting a literature-based health assessment using OHAT approach for systematic review and evidence integration. U.S. Dept. of Health and Human Services, National Toxicology Program. http://ntp.niehs.nih.gov/pubhealth/hat/noms/index-2.html.
10. Shamliyan, TK, R. L. Dickinson, S. (2010). A systematic review of tools used to assess the quality of observational studies that examine incidence or prevalence and risk factors for diseases [Review]. J Clin Epidemiol. 63(10): 1061-1070. http://dx.doi.org/10.1016/j.jclinepi.2010.04.014.
11. Von Elm, EA, D. G. Egger, M. Pocock, S. J. Gøtzsche, P. C. Vandenbroucke, J. P. (2008). The Strengthening the Reporting of Observational Studies in Epidemiology (STROBE) statement:

248
guidelines for reporting observational studies. J Clin Epidemiol. 61(4): 344-349. https://hero.epa.gov/heronet/index.cfm/reference/download/reference_id/4263036.
12. WHO (World Health Organization). (2001). Epidemiology: A tool for the assessment of risk. In L Fewtrell; J Bartram (Eds.), Water Quality: Guidelines, Standards and Health: Assessment of risk and risk management for water-related infectious disease (pp. 135-160). London, UK: IWA Publishing. http://www.who.int/water_sanitation_health/dwq/iwaforeword.pdf