application of pas 2070: city of edmonton...application of pas 2070: city of edmonton discussion...
TRANSCRIPT

Application of PAS 2070: City of Edmonton Discussion Paper Final
February 20, 2019
Prepared for: City of Edmonton 9th Floor, Edmonton Tower - 10111 - 104 Ave Edmonton, AB, T5J 0J4 Prepared by: Stantec Consulting Ltd. 600 – 455 Tyee Road Victoria, BC V9A 6X5

APPLICATION OF PAS 2070: CITY OF EDMONTON
Table of Contents
EXECUTIVE SUMMARY ............................................................................................................ I
ABBREVIATIONS .................................................................................................................... IV
GLOSSARY .............................................................................................................................. VI
1.0 INTRODUCTION & CONTEXT ....................................................................................... 1 1.1 INTRODUCTION ............................................................................................................ 1 1.2 ROADMAP OF THIS REPORT....................................................................................... 3 1.3 GHG EMISSIONS ACCOUNTING .................................................................................. 3
1.3.1 Global Reporting Protocol for Communities .................................................... 5 1.3.2 PAS 2070:2013 Specification for the Assessment of Greenhouse Gas
Emissions of a City ......................................................................................... 6
2.0 2016 PRODUCTION BASED GHG INVENTORY .........................................................10 2.1 INTRODUCTION ...........................................................................................................10 2.2 METHODOLOGY ..........................................................................................................10 2.3 GREENHOUSE GASES (GHG) CONSIDERED ............................................................10 2.4 EMISSIONS FACTORS ................................................................................................11 2.5 2016 INVENTORY SUMMARY......................................................................................11
2.5.1 Stationary Energy ......................................................................................... 13 2.5.2 Transportation .............................................................................................. 14 2.5.3 Waste ........................................................................................................... 15 2.5.4 Industrial Processes and Product Use (IPPU) .............................................. 16 2.5.5 Agriculture, Forestry, and Other Land Use (AFOLU) .................................... 17
2.6 2016 INVENTORY GHG REPORTING METRICS .........................................................17
3.0 CONSUMPTION BASED GHG INVENTORY ................................................................18 3.1 INTRODUCTION ...........................................................................................................18 3.2 GHG INVENTORY BOUNDARIES ................................................................................18 3.3 METHODOLOGY ..........................................................................................................19
3.3.1 Approach...................................................................................................... 19 3.3.2 Assumptions ................................................................................................ 23 3.3.3 Data Sources ............................................................................................... 24
3.4 RESULTS ......................................................................................................................26 3.4.1 Household Spending & GHG Emissions ...................................................... 26 3.4.2 Private Sector Capital Spending & GHG Emissions ..................................... 29 3.4.3 Government Spending & GHG Emissions .................................................... 30 3.4.4 Other Spending ............................................................................................ 36
3.5 DISCUSSION ................................................................................................................36 3.5.1 Summary...................................................................................................... 36 3.5.2 Comparison of GHG Inventory Results ........................................................ 37 3.5.3 Conclusion ................................................................................................... 41
4.0 DIRECT PLUS SUPPLY CHAIN (DPSC) APPROACH .................................................42

APPLICATION OF PAS 2070: CITY OF EDMONTON
4.1 OVERVIEW ...................................................................................................................42 4.1.1 GHG Emissions From The Extraction, Processing, Refining And
Transport Of Primary Fuels .......................................................................... 42 4.1.2 GHG Emissions From Food And Drink Consumption ................................... 42 4.1.3 GHG Emissions From Water ........................................................................ 43 4.1.4 GHG Emissions From Construction Materials .............................................. 44 4.1.5 PAS 2070 Reporting Requirements .............................................................. 44 4.1.6 Modifications to the Existing City Community GHG Inventory....................... 44
5.0 CLOSURE .....................................................................................................................45
6.0 REFERENCES ..............................................................................................................46
LIST OF TABLES Table 1 Production- and Consumption-Based GHG Inventory Comparison .............................. 8 Table 2 Breakdown of Edmonton’s Community PB 2016 GHG Emissions ...............................12 Table 3 Breakdown of 2016 AFOLU GHG Emissions ..............................................................17 Table 4 Key Reporting Metrics for Reporting Year ...................................................................17 Table 5 Weighted Emission Factors ........................................................................................22 Table 6 Data Sources Used in Consumption Based GHG Inventory ........................................25 Table 7 Household Consumption GHG Emissions ..................................................................28 Table 8 GHG Emissions from Private Sector Capital Spending ...............................................30 Table 9 2016 City of Edmonton Capital Spending (Edmonton, 2017) ......................................31 Table 10 2016 Provincial Capital Spending (Alberta, 2017) .......................................................32 Table 11 GHG Emissions from Government Spending ..............................................................35 Table 12 Other City And State PB and CB GHG Inventories .....................................................38 Table 13. Summary of GHG Emissions (tCO2e) by GHG Method And Sector ...........................40 Table 14. Alberta Based Extraction, Processing, Refining And Transport Emissions
Factors .......................................................................................................................42 Table 15. Production Based Emission Factors ........................................................................ A.1
LIST OF FIGURES Figure 1 Overlap of Production- (Sector) and Consumption-Based GHG Inventories
(C40, 2018).................................................................................................................. 2 Figure 2 Sources and Boundaries of a City’s GHG Emissions (C40, 2018) ............................... 4 Figure 3 Edmonton’s GHG Emissions By Sector ......................................................................11 Figure 4 Edmonton’s GHG Emissions By Fuel Consumption ....................................................12 Figure 5 Breakdown of Stationary Energy GHG Emissions.......................................................13 Figure 6 Breakdown of Transportation Energy GHG Emissions ................................................14 Figure 7 Examination of On-Road GHG Emissions and Energy Usage ....................................15 Figure 8 City Waste GHG Emissions Profile .............................................................................16 Figure 9 City of Edmonton Municipal Boundary ........................................................................18 Figure 10 City of Edmonton 2016 Household Consumption Breakdown
(Statistics Canada. Not dated (2)) ...............................................................................27 Figure 11 Edmonton 2016 Household Consumption by Industry Sector .......................28 Figure 12 City of Edmonton 2016 Private Capital Expenditure Spending by
Industry Sector ...........................................................................................................29

APPLICATION OF PAS 2070: CITY OF EDMONTON
Figure 13 City of Edmonton 2016 Operational Spending (Edmonton, 2017) ................31 Figure 14 2016/2017 Government of Alberta Operational Spending (Alberta,
2017) 32 Figure 15 Federal Government Spending in Alberta 2016 (Statistics Canada
Table 36-10-0450-01) .................................................................................................33 Figure 16 Summary of 2016 Government Spending in Edmonton, Net of
Transfers and Interest Payments ................................................................................34 Figure 17. Breakdown of Total Consumption Based GHG Emissions .......................................36 Figure 18 GHG Emissions associated with City of Edmonton, Consumption
Based Estimate (MtCO2e) ...........................................................................................37 Figure 19. Comparison of GHG Inventory Approaches .............................................................39
LIST OF APPENDICES
APPENDIX A PRODUCTION BASED GHG EMISSION FACTORS ................................ A.1

APPLICATION OF PAS 2070: CITY OF EDMONTON
i
Executive Summary
Cities are centers of communication, commerce, and culture. They are also responsible for more than 70% of global energy-related greenhouse gas (GHG) emissions, and therefore, represent the single greatest opportunity for tackling climate change. Recognizing its ability to influence and reduce the Edmonton’s GHG emissions, the City of Edmonton (the City) has been tracking and reporting on its territorial, or production based (PB) GHG emissions since the early 1990’s. With the recent release of the consumption based (CB) inventory accounting standard - PAS 2070:2013 Specification for the Assessment of Greenhouse Gas Emissions of a City (PAS 2070) – the City sought to explore how a dual approach to inventorying GHG emissions may provide a more comprehensive overview of the City’s contributions to global GHG emissions, and how these inventory approaches differ.
As with current best practice, the City’s PB inventory accounts for direct GHG emissions based on the physical location to which the GHG emissions are released within the City’s municipal boundaries. These in-boundary GHG emissions sources include building heating and/or cooling, the consumption of grid-supplied electricity, vehicle fuel consumption, and the disposal of waste. In 2016, the City’s PB GHG emissions were 18.3 MtCO2e to which stationary energy and transportation accounted for 94% of these GHG emissions. Due to the reliance on fossil fuel-powered energy in Alberta, more than 40% of the City’s GHG emissions came from electricity use. Natural gas mainly used to heat buildings accounted for more than 20% of the GHG inventory, and fuels used in the operation of on-road and off-road vehicles accounted for more than 25% of the GHG inventory. On per capita basis, the City’s PB emissions are 19.6 tCO2e/person. Had the City’s municipal boundary extended to include Strathcona County, the proportion of energy use and City’s GHG emissions would be significantly higher (likely >3 MtCO2e) and proportionally different due to the number of large industrial emitters located in Strathcona.
The strength in the current PB inventory approach deployed by the City is that it relies on local energy, transportation, land-use, and waste data for the reporting year which is generally accessible and can provide insight into energy production, and energy-intensive consuming industries and specific sectors – e.g. the number of light duty gasoline vehicles in a city. These are often referred to as direct and indirect GHG emission sources. However, the approach is limited in that it does not capture ‘outsourced’ or ‘other indirect’ GHG emission sources associated with the creation and transport of manufactured products, such as electrical appliances and furniture, food, clothing, and services provided as these are often manufactured, assembled, transported in other cities and countries. These ‘outsourced’ GHG emission sources are captured in CB GHG inventories which allocate both direct and life cycle GHG emissions for all goods and services consumed by residents, governments, and businesses within a city. The strength of the CB inventory approach is that it can create accountability by providing cities with a better understanding of their consumption choices, which can lead to the implementation of policies that mitigate associated, but generally unregulated GHG emissions. The drawback is that CB inventories are complex and resource intensive as they require urban metabolism data (e.g., actual waste consumed, total materials recycled, total roads, buildings, and other infrastructure constructed) also known as a bottom-up approach, or the use of environmentally extended input-output models (EEIO) (a top-down approach) which require financial flow data from national or regional economic accounts, along with applicable life cycle-based emission factors. Each approach also has specific drawbacks – for instance, the top-down or economic-based approach does not account for GHG emissions from land use as there is no economic value assigned to goods and services provided by ecosystems as this is not tracked in most accounting systems. The bottom-up approach may not adequately capture all waste sources such as electronics and plastic

APPLICATION OF PAS 2070: CITY OF EDMONTON
ii
recycling as these are not typically tracked by cities. In Canada, the publicly available data sources are not granular enough to support a high level of precision when compared to a PB inventory which relies on actual energy consumption data. With the rising trend in global GHG emissions and a contrasting decline in global city PB reported GHG emissions – an indication that cities may be unassumingly outsourcing their GHG emissions – there is likely to be a greater demand for CB inventory data and associated inventories over the long-term.
In the case of the City’s CB inventory, since there was inadequate urban metabolism data available, a top down approach using EEIO data was deployed. For the 2016 reporting year, the City’s consumption based GHG emissions were estimated at 26.8 MtCO2e to which construction, manufacturing and wholesale trade accounted for 53% of the City’s GHG emissions of which 37% of these GHG emissions resulted from household consumption. Of the total consumption based GHG emissions, household consumption accounted for 61% of total emissions, followed by private sector capital investment at 22%, and then government spending at 17%. This breakdown is comparable with the breakdown of Canada’s 2016 GDP by expenditure, which was: household consumption (56%), private sector capital spending (21%), government spending (21%), other (1%) (Statistics Canada, CANSIM Table 380-0064). On a per-capita basis, the City’s consumption GHG emissions amount to 28.7 tCO2e/person which is 47% higher than the City’s per-capita production GHG emissions. On an absolute basis, the City’s consumption GHG emissions are 32% higher than the production based GHG emissions which is within the range of other comparable CB GHG emissions inventories. For example, the State of Oregon’s are estimated to be 19% higher than their estimated production GHG emissions (Oregon, 2015) and the San Francisco Bay Area’s consumption based GHG emissions are 35% higher (UC Berkley, 2015). On the higher end, the City of Vancouver’s CB emissions are estimated to be 94.2% higher than its PB GHG emissions, and London, England’s CB emissions estimated to be 157% higher (PAS, 2018). The relation between the City’s GHG inventories is presented in Figure E-1.

APPLICATION OF PAS 2070: CITY OF EDMONTON
iii
Figure E-1. Comparison of GHG Inventory Approaches
The CB inventory reiterates what the City’s PB inventories have historically shown – i.e., the City should continue to focus on reducing GHG emission from buildings and road transport. The CB inventory also shows that the consumption of manufactured goods and services, and food are sources of significant GHG emissions in the City, and further exploration of these GHG emissions sources is warranted. However, the data available to support the preparation of a localized City-based CB inventory is not granular enough to identify where in the supply chain the GHG emissions are likely to arise and thus is limited in its ability to support GHG related policy and program decisions that the City may wish to take. On this basis, it is recommended that the City expand its current PB inventory to include the GHG emission sources required under the PAS 2070 direct plus supply chain (DPSC) approach which includes accounting for GHG emissions from the consumption of food and drink, water, construction materials. Specifically, a bottom-up data collection approach, rather than top-down (as applied in the CB assessment) is recommended to capture local consumption trends and GHG emission sources in the supply chain. It is still recommended that the City continue to follow the GPC Protocol which is a requirement for cities that have committed to the Global Covenant of Mayors. Should the City include the sources under PAS 2070, the City would be reporting under the BASIC+SC level. Lastly, it is recommended that the City complete a complete CB inventory every 5-years, which would align with National Census reporting, to assess general consumption trends and patterns over time.
(5,000,000)
-
5,000,000
10,000,000
15,000,000
20,000,000
25,000,000
30,000,000
Consumption Production
GH
G E
mis
sion
s (tC
O2e
)
Upstream Fuel Extraction, Production and Transportation Non-profit institutions serving householdsArts, entertainment, recreation, and misc services Accommodations and Food ServicesEducation and Healthcare Services Waste Mgmt ServicesReal Estate Finance, Insurance, Professional Services, Business MgmtInformation & Cultural Industries Transportation & WarehousingWholesale & retail trade ManufacturingConstruction UtilitiesOil & gas, mining (support services) Agriculture, forestry

APPLICATION OF PAS 2070: CITY OF EDMONTON
iv
Abbreviations
AFOLU Agriculture, Forestry, and Other Land Use
C40 C40 Cities Climate Leadership Group
CB Consumption-Based
CH4 Methane
CIRAIG The International Reference Centre for the Life Cycle of Products, Processes and Services
CO2 carbon dioxide
CO2e carbon dioxide equivalents
DPSC direct plus supply chain
EEIO Environmentally extended input-output model
EPCOR Edmonton Electric Lighting and Power Company
GDP gross domestic product
GHG greenhouse gas
GIS Geographic Information Systems
GJ Gigajoules
GPC Global Protocol for Community-Scale Greenhouse Gas Emission Inventories
GWP global warming potentials
HFC Hydrofluorocarbons
ICLEI Local Governments for Sustainability
IPPU Industrial Process and Product Use
IOIC Input-Output Industry Codes
IOFDC Input-Output Final Demand Codes (IOFDC)
IPCC Intergovernmental Panel on Climate Change
ISO International Organization for Standardization
LCA Life cycle analysis

APPLICATION OF PAS 2070: CITY OF EDMONTON
v
MWh Megawatt hour
NAICS North American Industry Classification System
N2O nitrous oxides
NIR National Inventory Report
PAS Publicly Available Specification
PB Production-Based
PFC Perfluorocarbons
POA Province of Alberta
SC Other Scope 3
SF6 sulfur hexafluoride
WBCSD World Business Council for Sustainable Development
WRI World Resources Institute

APPLICATION OF PAS 2070: CITY OF EDMONTON
vi
Glossary
BASIC An inventory reporting level that includes all Scope 1 sources except from energy generation, imported waste, IPPU, and AFOLU, as well as all Scope 2 sources (GPC, 2014).
BASIC+ An inventory reporting level that covers all Core (GPC BASIC) sources, plus Scope 1 AFOLU and IPPU, and Scope 3 in the Stationary Energy and Transportation Sectors (GPC, 2014).
BASIC+SC An inventory reporting level that covers all Expanded (GPC BASIC+) sources, plus Other Scope 3 GHG emission sources (GPC, 2014).
Biogenic emissions Emissions produced by living organisms or biological processes, but not fossilized or from fossil sources (GPC, 2014).
Carbon dioxide equivalent (CO2e) The amount of carbon dioxide (CO2) emissions that would cause the same integrated radiative forcing, over a given time horizon, as an emitted amount of a greenhouse gas (GHG) or a mixture of GHGs. The CO2e emission is obtained by multiplying the emission of a GHG by its Global Warming Potential (GWP) for the given time horizon. For a mix of GHGs, it is obtained by summing the CO2e emissions of each gas (IPCC 2014).
Climate change Climate change refers to a change in the state of the climate that can be identified by changes in the mean and/or the variability of its properties and that persists for an extended period, typically decades or longer. Climate change may be due to natural internal processes or external forces such as modulations of the solar cycles, volcanic eruptions, and persistent anthropogenic changes in the composition of the atmosphere or in land use (IPCC, 2014).
Consumption-Based Inventory A GHG inventory based on economic final expenditure by households, and national, regional and/or local governments, and business capital investment within a set geographical boundary.
Cradle to Gate The life cycle stages from the extraction or acquisition of raw materials and other inputs to the point at which the good or service enters the city boundary (PAS 2070, 2013)
Emission The release of GHGs into the atmosphere (GPC, 2014).
Emission factor(s) A factor that converts activity data into GHG emissions data (GPC, 2014).
Environmentally extended input-output model (EEIO)
A model based on financial flow data from national or regional economic accounts, combined with environmental account data (PAS 2070, 2013)
Flaring The burning of natural gas and other hydrocarbon gases that cannot be used.
Fossil fuels A hydrocarbon deposit derived from the accumulated remains of ancient plants and animals that is used as an energy source.
Fugitive emission Emissions that are released during extraction, transformation, and transportation of primary fossil fuels. These GHG emissions are not combusted for energy.
Geographic boundary A geographic boundary that identifies the spatial dimensions of the inventory’s assessment boundary. This geographic boundary defines the physical perimeter separating in-boundary emissions from out-of-boundary and transboundary emissions (GPC, 2014).

APPLICATION OF PAS 2070: CITY OF EDMONTON
vii
Global warming A gradual increase in the Earth’s temperature which is attributed to the greenhouse effect caused by the release of greenhouse gas (GHG) emissions into the atmosphere.
Global warming potential (GWP) An index measuring the radiative forcing following an emission of a unit mass of a given substance, accumulated over a chosen time horizon, relative to that of the reference substance, carbon dioxide (CO2). The GWP thus represents the combined effect of the differing times these substances remain in the atmosphere and their effectiveness in causing radiative forcing. The Kyoto Protocol is based on global warming potentials over a 100-year period (IPCC, 2014). These are also applied in this GHG inventory.
Greenhouse gas (GHG) GHGs are the seven gases covered by the UNFCCC: carbon dioxide (CO2); methane (CH4); nitrous oxide (N2O); hydrofluorocarbons (HFCs); perfluorocarbons (PFCs); sulphur hexafluoride (SF6); and nitrogen trifluoride (NF3) (GPC, 2014).
GHG intensity The annual rate to which GHG emissions are released in the atmosphere, relative to a specific intensity.
Gross domestic product (GDP) An economic measure of all goods and services produced in an economy. In-boundary Occurring within the established geographic boundary (GPC, 2014).
Life cycle emissions analysis The calculation of GHG emissions related to all the processes to create (extraction and processing), use and dispose of a good or service. This includes direct, indirect, and other indirect GH emissions sources.
Production-Based Inventory A GHG inventory based on the direct and indirect use of fossil fuels within a set geographical boundary.
Reporting year The year for which emissions are reported (GPC, 2014).
Scope 1 (Direct) Emissions that physically occur within the City.
Scope 2 (Indirect) Emissions that occur from the use of electricity, steam, and/or heating/cooling supplied by grids which may or may not cross the City boundaries.
Scope 3 (Other Indirect) Emissions that occur outside the City but are driven by activities taking place within the City’s boundaries.
Tonne Measure of weight equal to 1,000 kilograms.
Tonne of CO2e A tonne of greenhouse gases (GHGs) is the amount created when we consume: • 385 litres of gasoline (about 10 fill-ups) • $200 of natural gas (a month of winter heating)
Transboundary GHG emissions Emissions from sources that cross the geographic boundary (GPC, 2014).

APPLICATION OF PAS 2070: CITY OF EDMONTON
Introduction & Context
1
1.0 INTRODUCTION & CONTEXT
1.1 INTRODUCTION
Cities are centers of communication, commerce, and culture. They are also a significant and growing source of energy consumption and GHG emissions. On a global scale, cities are major players in greenhouse gas (GHG) emissions: cities are responsible for more than 70% of global energy-related carbon dioxide emissions, and therefore, represent the single greatest opportunity for tackling climate change (GPC, 2014). For a city to act on mitigating climate change and monitor its progress, it is crucial to have quality GHG emissions data to account for sources and quantities of GHG emissions generated by community activities. GHG inventories enable cities to understand the breakdown of their GHG emissions and plan for effective climate action.
This report includes two distinct GHG inventories for the City of Edmonton (the City): a production-based (PB) inventory, and a consumption-based (CB) inventory. Following the Global Protocol for Community-Scale Greenhouse Gas Emissions (GPC Protocol), the PB inventory assigns GHG emissions to the producers of those GHG emissions within the City’s municipal boundaries. It includes in-boundary energy consuming activities, like building and vehicle fuel consumption, the consumption of grid-supplied electricity, heating and/or cooling, and the disposal of waste. The CB inventory does the inverse. Rather than assigning GHG emissions to the producers of GHG emissions within a set municipal boundary, it allocates GHG emissions from the extraction of raw materials, manufacture, distribution, retail and disposal to the final consumers of the goods and services located within a city’s boundary. To avoid double counting, a CB inventory does exclude the exported or non-consumed goods and services. The City’s CB inventory, which follows the PAS 2070:2013 Specification for the Assessment of Greenhouse Gas Emissions of a City (PAS 2070), accounts for the GHG emissions associated with the goods and services consumed by the City (corporately), residents, and businesses located within the City’s municipal boundaries. Although different in approach, both of the GHG accounting methodologies – i.e., the GPC Protocol and PAS 2070 – specify similar requirements for identifying the assessment boundaries, the sources of GHG emissions to be included, the data requirements for carrying out the analysis, and the calculation of the results to develop a community GHG inventory.
The dual approach to inventorying GHG emissions provides a more comprehensive overview of the City’s contributions to global GHG emissions, and how these inventories differ (Figure 1). For example, the use of both GHG inventories can help the City assess if GHG reductions are occurring locally as a result of local policy, or whether they are shifting the GHG emissions outside of the cities set boundaries (referred to a leakage). Looking at a City’s GHG emission through these two lenses can broaden a city’s understanding of the sources of GHG emissions and identify a wider range of emission reduction opportunities when compared to a single GHG inventory approach.

APPLICATION OF PAS 2070: CITY OF EDMONTON
Introduction & Context
2
Figure 1 Overlap of Production- (Sector) and Consumption-Based GHG Inventories (C40, 2018)

APPLICATION OF PAS 2070: CITY OF EDMONTON
Introduction & Context
3
1.2 ROADMAP OF THIS REPORT
This report reviews the scope and methods of each GHG inventory approach and presents the findings of the PB and CB 2016 GHG emissions inventories. Specifically, Section 2 presents a summary and breakdown of the PB 2016 GHG inventory. Unlike Section 3, which presents the 2016 CB GHG inventory, Section 2 does not present the methodologies, assumptions, uncertainties, and other limitations of the PB inventory as this material has been prepared in separate annual GHG reports This section concludes with an overview of the two inventory methods. Section 4 includes a series of recommendations for the City to consider should it transition to preparing CB inventories.
1.3 GHG EMISSIONS ACCOUNTING
GHG emissions of organizations are generally categorized as either Scope 1, Scope 2 or Scope 3 emissions. These categorizations are based upon where the GHG emissions arise and their relationship with GHG emissions reporter, in this case, the City. These definitions are important for the assignment of GHG emissions that occur outside the city to activities within the city’s geopolitical boundary. The World Resources Institute (WRI) / World Business Council for Sustainable Development (WBCSD) distinguishes between emissions that physically occur within the city (Scope 1), from those that occur outside the city but are driven by activities taking place within the city’s boundaries (Scope 3), from those that occur from the use of electricity, steam, and/or heating/cooling supplied by grids which may or may not cross city boundaries (Scope 2). Scope 1 emissions may also be termed “territorial” emissions, because they are produced solely within the territory defined by the geographic boundary (Figure 2).

APPLICATION OF PAS 2070: CITY OF EDMONTON
Introduction & Context
4
Figure 2 Sources and Boundaries of a City’s GHG Emissions (C40, 2018)

APPLICATION OF PAS 2070: CITY OF EDMONTON
Introduction & Context
5
PB inventories focus on capturing Scope 1, Scope 2 and some Scope 3 GHG emissions (i.e., waste, transboundary transportation, and transmission distribution and line losses), whereas CB inventories aim to capture nearly all GHG emissions scopes. CB inventories, however, do not capture all downstream GHG emissions, such as waste disposal which can be a Scope 1 or Scope 3 GHG emissions source depending on where the GHG emissions are released. To address some of the inherent limitations in each approach and for the purposes of standardization, GHG methodologies or protocols have been developed for international use. At the time of reporting, two protocols are deemed to be best practice: GPC Protocol, and PAS 2070.
1.3.1 Global Reporting Protocol for Communities
The GPC Protocol is the result of a collaborative effort between the GHG Protocol at the World Resources Institute (WRI), C40 Cities Climate Leadership Group (C40), and ICLEI—Local Governments for Sustainability (ICLEI). The GPC Protocol is recognized as one of the first set of standardized global rules for cities to measure and publicly report city-wide GHG emissions. It sets out requirements and provides guidance for calculating and reporting city-wide GHG emissions, consistent with the IPCC guidelines on how to estimate GHG emissions (IPCC, 2014).
The GPC Protocol sets several assessment boundaries which identify the restrictions for gases, emission sources, geographic area, and time span covered by a GHG inventory. Specifically, the GHG inventory is required to include all seven Kyoto Protocol GHGs occurring within the geographic boundary of a city, and the GHG emissions from city-wide activities must be organized and reporting under the following five sectors, based on the selected reporting level:
• Stationary Energy • Transportation • Waste • Industrial Processes and Product Use (IPPU) • Agriculture, Forestry, and Other Land Use (AFOLU)
Under the GPC Protocol, a city has the option of reporting GHG emissions under three different levels:
• GPC BASIC—This level covers emissions Scopes 1 and 2, from stationary energy and transportation, as well as emissions Scopes 1 and 3 from waste.
• GPC BASIC+—This level covers the same scopes as BASIC and includes more in-depth and data dependent methodologies. Specifically, it expands the reporting scope to include emissions from Industrial Process and Product Use (IPPU), Agriculture, Forestry, and Other Land-Use (AFOLU), and transboundary transportation. The sources covered in BASIC+ also align with sources required for national reporting in IPCC guidelines. The City currently reports at the BASIC+ level.
• GPC BASIC+ Scope 3 (SC)— This inventory extends beyond the Expanded GHG inventory to include Other Scope 3 (SC) emissions such as GHG emissions from goods and services production and transportation. Depending on the depth and breadth of the Scope 3 GHG emissions assessment by the GHG emissions reporter, this reporting level could align with the PAS 2070 direct plus supply chain (DPSC) methodology (discussed below). However, at present the GPC Protocol provides no guidance on how to align a BASIC+SC GHG inventory with the PAS 2070 DPSC GHG inventory.
Internationally, GHG emissions are currently calculated and reduction targets set using the PB method. The strength in the PB inventory method is that it relies on local energy, transportation, and waste data for the reporting year which
APPLICATION OF PAS 2070: CITY OF EDMONTON
Introduction & Context
6
is generally accessible, and can provide insight into energy production, and energy-intensive consuming industries and specific sectors – e.g. the number of light duty gasoline vehicles in a city. The PB inventory method is limited in that it does not capture GHG emissions associated with the use of manufactured products, such as electrical appliances and furniture, food, clothing, and services provided as these are often manufactured, assembled, transported in other cities and countries. As reporting cities mature and evolve in their GHG emissions reporting, and begin to consider political acceptability, social equity and justice considerations, such cites may shift to using CB inventories to attribute responsibility of GHG emissions based on consumption instead of production. This shift may occur sooner than later as there has been a global trend in declining PB based GHG emissions, and a rise in CB based GHG emissions which is likely the result of increased globalization and the outsourcing of GHG emissions-based activities.
1.3.2 PAS 2070:2013 Specification for the Assessment of Greenhouse Gas Emissions of a City
PAS 2070 is a GHG emissions quantification standard that sets out requirements for the assessment of GHG emissions of a city using two distinct methodologies: the direct plus supply chain (DPSC) methodology, and the consumption-based (CB) methodology.
The DPSC methodology is similar to the GPC Protocol methodology in that it requires the assessment and reporting of GHG emissions by sector:
• Stationary Energy • Transportation • Industrial Processes And Product Use (IPPU) • Agriculture, Forestry And Other Land Uses (AFOLU) • Waste And Wastewater Treatment • Goods And Services – Water Provision, Food And Drink And Construction Materials
The DPSC differs in that it goes beyond the GPC Protocol requirements by requiring reporters to account for upstream GHG emissions, such as fuel extraction, production, and transportation GHG emissions, as well as cradle-to-gate GHG emissions associated with the consumption of goods and services like food and drink, water, construction materials, and other goods and services that are estimated to make a material contribution to a city’s GHG inventory (>2%). Ultimately, the DPSC method is a hybrid PB and CB inventory.
The CB methodology is distinctly different from the prior methodologies. It allocates direct and life cycle GHG emissions for all goods and services consumed by residents, governments, and businesses within a city. The strength of the CB inventory approach is that it can create accountability by providing cities with a better understanding of their consumption choices, which can lead to the implementation of policies that mitigate associated, but generally unregulated GHG emissions.
As it relates to the data used, CB inventories either use a bottom-up approach, which relies on urban metabolism data (e.g., actual waste consumed, total materials recycled, total roads, buildings, and other infrastructure constructed), or a top-down approach which requires the use of environmentally extended input-output models (EEIO). EEIO models take financial flow data from national or regional economic accounts and estimate GHG emissions using average GHG emission factors for each consumption category (i.e. in the city, rest of the country, or rest of the world). EEIO models are cradle-to-gate which means that they do not evaluate the downstream impacts of
APPLICATION OF PAS 2070: CITY OF EDMONTON
Introduction & Context
7
consumption activities – for example, unlike a bottom-up approach, the top-down approach does not include the processes required to produce, use, dispose a good or service. As the top-down CB method uses an EEIO model, they are limited in that they rely on the homogeneity principle which assumes that each sector in an economy produces a single or homogeneous good or service and carries an identical embodied environmental impact (Kitzes, 2013). Further, the data is typically collected at the national level for both financial and GHG emission accounts to which assumptions have to be made to apply it to a city reporting level which can introduce biases and uncertainties. The bottom-up method is also subject to its limitations in that it is not likely to capture all of the goods and services being consumed within a City and is likely to underestimate consumption GHG emissions. Due to the nature of how the EEIO data is reported, a top-down CB inventory cannot be cleanly organized into reporting sectors, like a city can under the GPC Protocol. The reason is that the EEIO data is organized by financial trade accounts (e.g. finance and insurance, real estate and rental and leasing, professional, scientific and technical services, etc.) and represent emissions over the complete life-cycle of the material, energy or service assessed. This can make comparability to other CB inventories limited without understanding how each of the CB inventory trade accounts and the GHG emission factors, determined on an $/tCO2e value, are developed. Both the CB top-down and bottom-up approaches rely on LCA GHG emission factors which may be outdated or limited in their scope. For example, the estimation of electricity GHG emissions under the PB and CB inventories can lead to significantly different results. Under the PB inventory for the City, electricity GHG emissions would be estimated using the Alberta grid-intensity average for the year, whereas under the CB inventory, the electricity GHG emissions are likely to be based on a Canadian or global average.
In light of these challenges, top-down approaches to estimate CB GHG emissions are more commonly deployed than bottom-up approaches as there is often significant effort and cost in collecting this information, and there is no standardized approach to implementing urban metabolism studies (Beloin-Saint-Pierre et al., 2018). The benefit to a bottom-up approach is that it provides a direct link between policy intervention and GHG emission outputs at the city scale, allows for forecasting and modelling out predictive reductions as a result of policy, and can be more clearly organized by sector and emissions source.
It is important to note that both the PB and CB inventory methods suffer from a degree of uncertainty. For example, PB inventories can suffer from a lack of available data to estimate transportation movements, in terms of vehicle kilometers travelled, and assigning transboundary transportation GHG emissions, or a lack of land use GHG emission factors, both of which can be a constraining factor in producing an accurate GHG emissions inventory. In addition, both the PB and CB methods are not likely to capture all energy consuming activities occurring in an economy (e.g. cutting down and burning firewood for heat),
In the case of the City, since the data to support a bottom-up approach was not available, a top down approach using EEIO data was deployed. As it relates to the City’s PB and CB inventories, the differences in the two inventory approaches are presented in the following table.

APPLICATION OF PAS 2070: CITY OF EDMONTON
Introduction & Context
8
Table 1 Production- and Consumption-Based GHG Inventory Comparison
Aspect Production–Based GHG Inventory Consumption-Based GHG Inventory General Description In-boundary GHG emissions from Stationary Energy,
Transportation, Waste, Industrial Processes and Product Use (IPPU), and Agriculture, Forestry, and Other Land Use (AFOLU)
Globally-distributed consumption GHG emissions associated with economic final demand by Edmonton.
Inventory Years Available 2005-2017 2016
Gases Included CO2, CH4, N2O Note that HFCs, PFCs, SF6, and NF3 ideally should be included in a PB inventory but there is limited data to quantify these GHG emission sources. This is disclosed in the City’s annual GHG reports.
CO2, CH4, N2O, HFCs, PFCs, SF6, and NF3
Stationary Energy Indirect Alberta-based electric power GHG emissions (includes production, transmission, distribution and losses) used directly by residents, businesses, households and governments. Direct use of fossil fuels related to the operation of in-boundary buildings, and off-road equipment. Fugitive GHG emissions resulting from the operation of in-boundary natural gas distribution systems.
Life-cycle emissions of electricity and other fossil fuels used directly by residents, businesses, governments. This includes direct, indirect, and other indirect GH emissions sources. All electricity and fossil fuels used in the provision and supply chains of goods and services consumed by residents, businesses, governments.
Transportation GHG emissions from in-boundary and transboundary transportation fuels by all users and sources (on-road, off-road, rail, aviation) (not-life cycle)
Life-cycle emissions from purchased transportation fuels and transport services used by residents, businesses, and governments; all transportation emissions associated with the movement and supply chains of goods and services consumed.
Waste In-boundary solid waste fugitive GHG emissions, wastewater treatment and discharge GHG emissions, and biological treatment of waste (composting) GHG emissions.
The lifecycle GHG emissions from solid waste, water, and wastewater operations. No fugitive GHG emissions.
IPPU In-boundary IPPU GHG emissions. Life cycle GHG emissions from IPPU GHG emissions.
AFOLU Land-use change GHG emissions included Biogenic CO2 GHG emissions excluded.
Not included
Other GHG Emissions Sources
Not included. All other emissions from supply chains of goods and services consumed by City residents, businesses, and governments (e.g. food,
Primary Data Sources Numerous reporting year local utility and governmental data Economic consumption data from Statistics Canada,

APPLICATION OF PAS 2070: CITY OF EDMONTON
Introduction & Context
9
sets, and the National Inventory Report (NIR). Government of Alberta, the City, and other data sources.

APPLICATION OF PAS 2070: CITY OF EDMONTON
2016 Production Based GHG Inventory
10
2.0 2016 PRODUCTION BASED GHG INVENTORY
2.1 INTRODUCTION
The City’s 2016 PB inventory meets the GPC Protocol BASIC+ reporting requirements as it estimates GHG emissions occurring within the City of Edmonton’s municipal boundary by GPC reporting sector which includes Stationary Energy, Transportation, Waste, IPPU, and AFOLU. The City’s PB inventory for the 2016 reporting year is summarized below to allow for comparison to the CB inventory (Section 3.0).
2.2 METHODOLOGY
As part of reporting to the Carbon Disclosure Project (CDP), the City has prepared a detailed methodology manual which identifies data sources, limitations, assumptions and emission factors and thus will not be presented here.
2.3 GREENHOUSE GASES (GHG) CONSIDERED
A GHG can be any atmospheric gas that absorbs and re-emits infrared radiation, thereby acting as a thermal blanket for the planet and warming the lower levels of the atmosphere. GHGs are released to the atmosphere from several natural and anthropogenic (human activity) sources (IPCC, 2014).
Emissions of each of the specific GHGs are multiplied by their 100-year global warming potential (GWP) and are reported as carbon dioxide equivalent (CO2e). The GWP of these GHGs are:
• Carbon dioxide (CO2) = 1.0 • Methane (CH4) = 25 • Nitrous oxide (N2O) = 298 • Sulphur hexafluoride (SF6) = 22,800 • Nitrogen trifluoride (NF3) = 17,200 • Hydrofluorocarbon (HFC) gases range from 12 to 14,800 • Perfluorocarbon (PFC) gases range from 7,390 to 17,340 (IPCC 2012).
Not all GHGs listed above are applicable to the GHG inventory. Those included in the PB inventory are CO2, CH4 and N2O. The other gases have not been included due to limited data availability.
On this basis, carbon dioxide equivalents (CO2e) for the GHG inventory are calculated as:
CO2e = (mass CO2 x 1.0) + (mass CH4 x 25) + (mass N2O x 298)

APPLICATION OF PAS 2070: CITY OF EDMONTON
2016 Production Based GHG Inventory
11
2.4 EMISSIONS FACTORS
Under the PB inventory approach, emissions from energy consumption are calculated using emission intensity values (or emissions factors), which specify the amount of CO2e produced per kilowatt hour (kWh) of electricity consumed. The emissions factor is then multiplied by the total energy (kWh) used to determine the total amount of CO2e produced.
CO2e (kg) = Energy Use (kWh) * coefficient (kg of CO2e/kWh)
A detailed list of emission factors can be found in Appendix A.
2.5 2016 INVENTORY SUMMARY
Following the requirements of the GPC Protocol, BASIC+ reporting level, the City’s 2016 community PB GHG emissions are estimated to be 18,305,588 tCO2e. Like most cities, the stationary energy and transportation sectors account for the largest portion of the City’s GHG emissions (Figure 1). Because more than 40% of Alberta's generation capacity is natural gas-fired and 60% is coal-fired, more than 40% of the City’s GHG emissions come from electricity use (Government of Alberta, 2018) (Figure 4). Natural gas mainly used to heat buildings accounting for more than 20% of the GHG inventory, and lastly fuels used in the operation of on-road and off-road vehicles accounted for more than 25% of the GHG inventory.
Figure 3 Edmonton’s GHG Emissions By Sector
Stationary Energy 64%
Transportation 30%
Waste 1%
IPPU 4%
AFOLU -1%

APPLICATION OF PAS 2070: CITY OF EDMONTON
2016 Production Based GHG Inventory
12
Figure 4 Edmonton’s GHG Emissions By Fuel Consumption
A breakdown of the City’s 2016 GHG emissions by sector and sub-sector is presented in Table 2.
Table 2 Breakdown of Edmonton’s Community PB 2016 GHG Emissions
Sector Sub-Sector 2016 GHG Emissions
(tCO2e)
Contribution to the GHG Inventory
(%)
Stationary Energy
Residential Buildings 3,280,925 17.9%
Agriculture, Forestry, And Fishing Activities 574,984 3.1%
Manufacturing Industries, and Construction 4,243,184 23.2%
Non-Specified Sources - 0.0%
Commercial / Institutional Buildings 3,275,991 17.9%
Energy Industries 490,399 2.7%
Fugitive Emissions: Oil and Natural Gas Systems 25,819 0.1%
Transportation
On-Road Transportation 2,869,996 15.7%
Transboundary Transportation 1,601,451 8.7%
Off-Road Transportation: Aviation, Railways, and Other Off-Road 1,175,726 6.4%
Waste Waste: Solid Waste Disposal, Biological Treatment of Waste, Wastewater Treatment and Discharge 123,838 0.7%
AFOLU AFOLU: Livestock, Land, and Other Agriculture (103,910) -0.6%
IPPU IPPU: Industrial Processes, and Product Use 747,185 4.1%
Total City GHG Emissions 18,305,588 100.00%
Electricity 43%
Natural Gas 23%
Propane 0%
Gasoline 19%
Diesel 14% Ethanol (10%) 1%
Jet Fuel 0%

APPLICATION OF PAS 2070: CITY OF EDMONTON
2016 Production Based GHG Inventory
13
Of the City’s community GHG emissions, 513,304 tCO2e (2.8%) are the direct result of corporate operations which came from the operation of City owned and operated buildings like recreation centers and pools, and waste management facilities, corporate service vehicles and transit fleet, the operation of streetlights and traffic signals and the decomposition of waste at City operated landfills.
2.5.1 Stationary Energy
Stationery energy sources are the largest contributors to the City’s GHG emissions. In 2016, stationary energy emissions sources accounted for 65% of the GHG inventory and included emissions from energy to heat and cool residential, commercial, and industrial buildings, as well as the activities that occur within these residences and facilities. Emissions associated with distribution losses from grid-supplied electricity/steam/heating/cooling are also included, as are fugitive emissions from sources such as coal piles, natural gas pipelines, and related off-road transportation GHG emission sources.
In the 2016 reporting year, residential, commercial and industrial buildings and associated energy use activities accounted for 90% of total stationary energy emissions and 65% of the City’s GHG inventory (Figure 5).
Figure 5 Breakdown of Stationary Energy GHG Emissions
Transportation 30%
Waste 1%
IPPU 4%
AFOLU 0% Residential buildings
18%
Agriculture, forestry and fishing activities
3%
Manufacturing industries and construction
23%
Non-specified sources
0% Commercial and
institutional buildings and facilities
18%
Energy industries 3%
Fugitives 0%
Other 65%

APPLICATION OF PAS 2070: CITY OF EDMONTON
2016 Production Based GHG Inventory
14
2.5.2 Transportation
Transportation GHG emission sources include on-road, railway, waterborne navigation, aviation, and off-road. These GHG emissions are produced directly by the combustion of fuel, and indirectly using grid-supplied electricity. Unlike the Stationary Energy sector, transit is mobile and can pose challenges in both accurately calculating GHG emissions and allocating them to a specific sub-sector. This is particularly true when it comes to transboundary transportation, which includes GHG emissions from trips that either start or finish within a city’s boundaries (e.g., departing flight emissions from an airport outside the city boundaries) (GPC, 2014). Under the GPC Protocol, cities are to report off-road GHG emissions under the off-road transportation sub-sector if and only if the GHG emissions are occurring at transportation facilities (e.g., airports, harbors, bus terminals, train stations, etc.). For example, off-road railway maintenance support equipment GHG emissions are reported under the off-road transportation sub-sector.
In 2016, transportation activities accounted for 30% of the City’s GHG emissions with almost 80% of the transportation GHG emissions (on-road and transboundary) resulting from the operation and use of gasoline and diesel powered on-road vehicles (Figure 6 and Figure 7).
Figure 6 Breakdown of Transportation Energy GHG Emissions
50.8%
28.4%
12.7%
0.7% 7.4%
On-Road
Transboundary
Off-Road
Aviation
Rail

APPLICATION OF PAS 2070: CITY OF EDMONTON
2016 Production Based GHG Inventory
15
Figure 7 Examination of On-Road GHG Emissions and Energy Usage
2.5.3 Waste
Cities produce GHG emissions that arise from activities related to the disposal and management of solid waste. Waste does not directly consume energy, but releases GHG emissions because of decomposition, burning, incineration, and other management methods. Under the GPC Protocol, the waste sector includes all GHG emissions that result from the treatment or decomposition of waste regardless of the source of the waste (e.g., another city’s waste in the City’s landfill). However, the GHG emissions that are associated with waste from outside a City’s boundary that is treated or decomposes within the city boundary are deemed to be “reporting only” emissions and do not contribute to the GHG inventory (GPC, 2014). Any GHG emissions that result from the combustion of waste or waste related gases to generate energy, such as a methane capture and energy generation system at a landfill, are reported under stationary energy generation supplied to the grid sub-sector (GPC, 2014). Any waste related GHG emissions that are combusted but not related to energy generation are reported in the appropriate waste sub-sector. Lastly, any waste GHG emissions that are released to the atmosphere are also captured in the appropriate waste sub-sector.
For the 2016 reporting year waste accounted for 1% of the City’s GHG emissions with more than 95% coming from solid waste fugitive GHG emissions (Figure 8).
0
200,000
400,000
600,000
800,000
1,000,000
1,200,000
1,400,000
1,600,000
1,800,000
2,000,000
LDV LDT HDV ORVE Motorcyle
GH
G E
mis
sion
s (tC
O2e
)
Diesel Gasoline Propane Natural Gas

APPLICATION OF PAS 2070: CITY OF EDMONTON
2016 Production Based GHG Inventory
16
Figure 8 City Waste GHG Emissions Profile
2.5.4 Industrial Processes and Product Use (IPPU)
Emissions from the IPPU sector are required for BASIC+ reporting. Industrial GHG emissions are produced from a wide variety of non-energy related industrial activities which are typically releases from industrial processes that chemically or physically transform materials. During these processes, many different GHGs can be produced. Also, reported in the IPPU sector are Product Use GHG emissions. Certain products used by industry and end-consumers, such as refrigerants, foams, or aerosol cans, also contain GHGs which can be released during use and disposal and thus, as with best-practice, must be accounted for.
It should be noted that the inclusion of different GHG emissions sources in the reported total varies by reporting GHG protocols and standards selected by a reporting City, and the GHG emissions sources will also vary in their level of potential influence depending on the geographic location and constraints, energy supplies available (e.g., hydro vs coal power), climate, and economic base. With respect to influence, it should also be noted that the City has limited control over certain emissions sectors and sub-sectors. For example, GHG emissions associated with IPPU GHG emissions or off-road GHG emissions are typically consumer driven and not under the control of the City, whereas on-site power generation can be much more easily affected through local decision-making and zoning.
For the 2016 reporting year, the City’s IPPU GHG emissions accounted for 4% of the City’s GHG emissions with 47% of these GHG emissions coming from reported industrial process activities, and the remaining from product use to which the latter was estimated on a per capita basis on the lack of available information.
Solid Waste 94%
Composting 5%
Wastewater 1%

APPLICATION OF PAS 2070: CITY OF EDMONTON
2016 Production Based GHG Inventory
17
2.5.5 Agriculture, Forestry, and Other Land Use (AFOLU)
Emissions from the AFOLU sector are only required for BASIC+ GHG reporting. AFOLU GHG emissions are those that are captured or released because of land-management activities. These activities can range from the preservation of forested lands to the development of crop land. Specifically, this sector includes GHG emissions from land-use change, manure management, livestock, and the direct and indirect release of nitrous oxides (N2O) from soil management, rice cultivation, biomass burning, urea application, fertilizer, and manure application (GPC, 2014).
Like most cities, the inclusion of AFOLU GHG emissions in the inventory results in an overall reduction of GHG emissions as the reporting city is capturing GHG emissions reductions from the preservation of greenspace (forestlands, grasslands, etc.). In 2016, the City reported a reduction of 103,910 tCO2e from the AFOLU sector.
Table 3 Breakdown of 2016 AFOLU GHG Emissions
Sub-Sector tCO2e Emissions from land (109,796)
Emissions from aggregate sources and non-CO2 emission sources on land 5,886
Total (103,910)
2.6 2016 INVENTORY GHG REPORTING METRICS
Table 4 summarizes the City’s reporting metrics for the 2016 reporting year.
Table 4 Key Reporting Metrics for Reporting Year
Aspect 2016 City Population 932,546.0
Energy (eGJ in Millions) 169.1
Energy (eGJ / Capita) 181.3
Electricity (Millions of MWh) 7.6
Energy (MWh / Capita) 8.2
Natural Gas (GJ in Millions) 70.1
Natural Gas (GJ / Capita) 75.2
Transportation (GJ in Millions) 56.6
Transportation (GJ / Capita) 60.6
Community GHG Emissions (MtCO2e) 18.3
GHG Emissions (tCO2e / Person) 19.6
Corporate GHG Emissions (MtCO2e) 0.5

APPLICATION OF PAS 2070: CITY OF EDMONTON
Consumption Based GHG Inventory
18
3.0 CONSUMPTION BASED GHG INVENTORY
3.1 INTRODUCTION
The City’s CB inventory has been prepared in accordance with the requirements of the PAS 2070:2013 Specification for the Assessment of Greenhouse Gas Emissions of a City (PAS 2070). The CB methodology requires the use of an environmentally extended input-output model (EEIO) which takes financial flow data from national economic accounts and estimates GHG emissions using average GHG emission factors for each consumption category depending on where the goods and services consumed in the City are produced. The GHG inventory boundaries, methodology, and results are presented below.
3.2 GHG INVENTORY BOUNDARIES
The CB inventory was prepared for the 2016 year and is defined geographically by the City of Edmonton municipal boundaries, as shown in Figure 9. This treatment is consistent with the PB inventory boundary.
Figure 9 City of Edmonton Municipal Boundary

APPLICATION OF PAS 2070: CITY OF EDMONTON
Consumption Based GHG Inventory
19
3.3 METHODOLOGY
3.3.1 Approach
With the CB methodology, GHG emissions are estimated using a top-down approach and is based on emissions associated with the production of goods and services consumed by households, government, and business capital investment within the City. The CB method is based on disaggregated final demand information (i.e. expenditures at the point of end-use, and not including intermediate use) as well as GHG emission factors for the various goods and services industries.
The quantification method is involves estimating disaggregated household, capital investment, government, and other spending and then applying GHG intensity factors to estimate overall GHG emissions. A break-down of the method is provided below.
3.3.1.1 Household Expenditures GHG Emissions
Statistics Canada Table 11-100222-01 reports average household spending in Canada, disaggregated by expenditure categories. Household expenditures within the City, by expenditure category, are estimated using the 2016 Census of the Population (Census) Profile information for the City while applying an adjustment factor that accounts for differences in average household income, and therefore propensity to spend, between residents of City and Alberta overall. Household expenditures are estimated using the following relationship:
HFDi (City) = Tio [POPCity X HFDi (AB) X [MFICity/MFIALB ]]
where:
HFDi (City) = 2016 average expenditure per household in City, by commodity code
POPCity = Population of City
HFDi (AB) = 2016 average expenditure per household in Alberta, by expenditure category i
MFICity = Median family income in City
MFIALB = Median family income in Alberta
Tio = Mathematical transformation using symmetrical input-output model
This method assumes that household expenditures are proportional to household income, and that savings rates are the same across the province of Alberta.
Average household spending in Edmonton was estimated based on median total and after-tax income reported in the 2016 Census profile for the City. An estimated 89.9% of after-tax household income was assumed to be used for household consumption, based on the breakdown of Canadian household expenditure available in Statistics Canada Table 11-100222-01, with the balance of household expenditures being used for non-consumables, such as pension contributions, insurance payments, and charitable contributions. To estimate GHG emissions associated with household consumption, average household consumption expenditures were transformed into expenditures based on

APPLICATION OF PAS 2070: CITY OF EDMONTON
Consumption Based GHG Inventory
20
NAICS commodity codes using a symmetric input-output table for Alberta and using the Input-Output Final Demand Codes (IOFDC) PEC00 (Household Consumption Expenditures) Table which is derived from the Statistics Canada Interprovincial Input-Output Model.
3.3.1.2 Private Sector Capital Spending GHG Emissions
Statistics Canada Table 34-10-0035-01 reports capital and repair expenditures, by province, disaggregated by North American Industry Classification System (NAICS). To estimate private sector capital investment within the City, the following steps were undertaken:
1. Estimate capital spending (capex) per employee, by industry, within Alberta using Statistics Canada NAICS capex and employment data.
2. Estimate capital expenditures by industries operating within City by applying per-employee estimates established above to NAICS employment estimates from the 216 Census Profile for City. In this calculation non-private sector industries (i.e. health, education, and government services are removed from the estimate).
Private sector capital spending was estimated using the following relationship:
PCSj (City) = PCSiPE(AB) X EMPi(City)
where:
PCSj (City) = Private Sector Capital Spending in City for industries j
PCSiPE(AB) = Average capital spending per employee in Alberta for industries j
EMPi(City), = Employment within City by industries j
This method assumes that capex by industry is accurately represented at the local scale.
3.3.1.3 Government Spending GHG Emissions
Estimates of government spending need to account of local, provincial, and federal contributions. Data sources used in the calculations are as follows:
• Local government spending – 2016 City of Government spending was obtained from the City 2016 Annual Report (Edmonton, 2017). Operational spending was obtained from the Consolidated Statement of Operations and Accumulated Surplus, while capital spending was derived from Schedule 1 – Consolidated Schedule of Tangible Capital Assets.
• Provincial government spending - The Government of Alberta releases annual reports with budget results and consolidated financial statements, among other information. Expense information is summarized at the Ministry (e.g., Health, Education, Infrastructure) and object level (e.g., salaries, wages, employment contracts and benefits, grants, and materials and supplies).
• Federal government spending - Statistics Canada Table 36-10-0450-01 reports revenue, expenditure, and budgetary balance information for general governments at the federal, provincial, and territorial level. From this table, estimates of federal spending within Alberta were disaggregated (i.e., expenditure estimates associated with line item “General governments expenditure’ [when filtered by ‘Alberta’ and ‘federal general government’]).

APPLICATION OF PAS 2070: CITY OF EDMONTON
Consumption Based GHG Inventory
21
To estimate government spending within the City expense information was taken from the above sources and classified against government-related Statistics Canada IOIC codes (i.e., IOIC codes with the naming convention GSXXXXXX). Classified expenditure information at the local level were also included in the calculations. For provincial and federal government spending, City per-capita provincial and federal ‘spending proxies’ (estimated by multiplying City Census population estimates against provincial and federal government per-capita spending within Alberta) were used. This approach is limited in that it assumes an even distribution of government spending across the province.
Government spending was estimated using the following relationship:
GSk (City) = Tio [LGS k (City) + (PCPGSk (AB) X POP(City)) + (PCFGSk (AB) X POP(City))]
where:
GSk (City) = Government spending in City for industries k
LGSk (City) = Local Government (City of Edmonton) spending in City for industries k
PCPGSk (AB) = Per-capita provincial government spending for industries k, within Alberta
POP(City) = Population of City
PCFGSk (AB) = Per-capita federal government spending for industries k, within Alberta
Tio = Mathematical transformation using symmetrical input-output model
To estimate GHG emissions associated with City operational spending, total 2016 operational expenditures were transformed into expenditures based on NAICS commodity codes and using the Input-Output Final Demand Codes (IOFDC) PEC00 (Household Consumption Expenditures) Table. Because expenditures on wages, salaries, and mixed income represent financial transfers to households these were netted out of total to avoid double-counting. Because GHG consumption due to municipal capital expenditure was estimated separately, it was also assumed that there are no GHG emissions associated with the gross operating surplus estimated for municipal operational expenditure.
GHG emissions from City of Edmonton expenditures were estimated directly from capital expenditure information available from the 2016 City Annual Report. GHG emissions from Province of Alberta (POA) capital spending were estimated based on information on changes in tangible assets from the POA’s 2016/2017 Annual Report.
GHG emissions from City of Edmonton expenditures were estimated directly from capital expenditure information available from its 2016 City Annual Report. GHG emissions from Province of Alberta (POA) capital spending were estimated based on information on changes in tangible assets from the POA’s 2016/2017 Annual Report.
3.3.1.4 Other GHG Emissions
Non-profits (NAICS code 81341) expenditures were included in the private sector estimates (Task 2 above). The NAICS industry amalgamation ‘Other services (except public administration)’ includes all NAICS code 81 except for code 814 (Private households) and was included in the analysis.
APPLICATION OF PAS 2070: CITY OF EDMONTON
Consumption Based GHG Inventory
22
3.3.1.5 GHG Emissions Factors
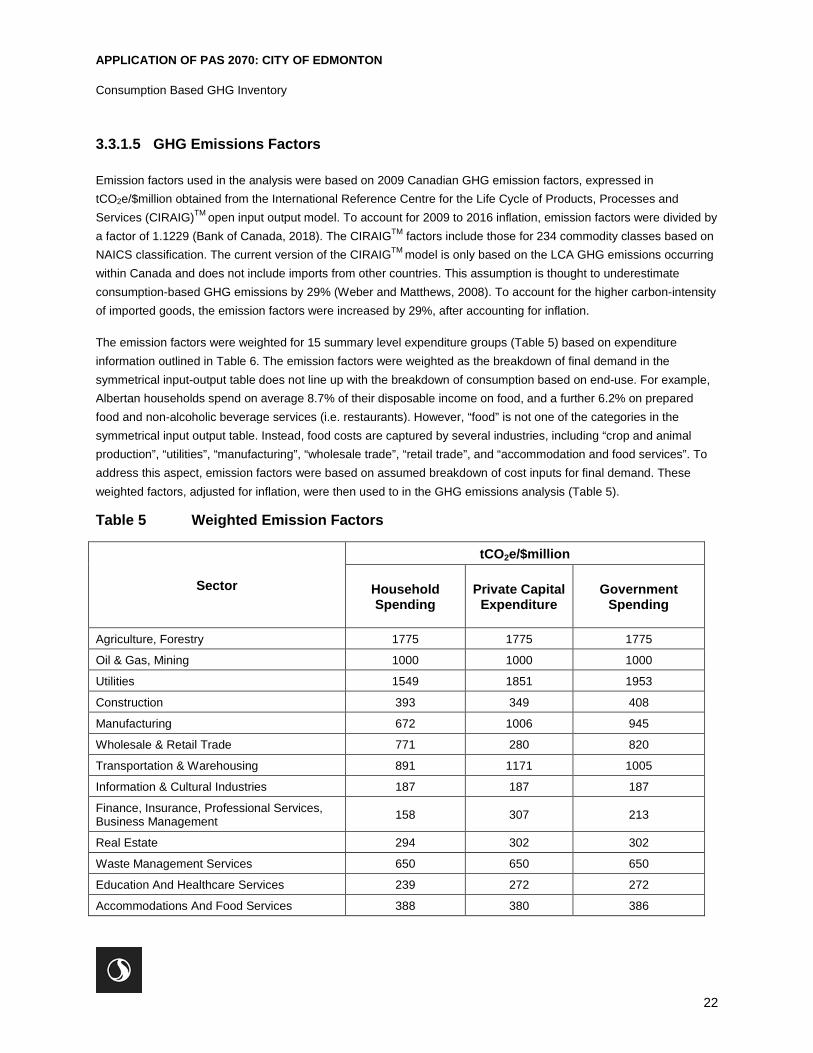
Emission factors used in the analysis were based on 2009 Canadian GHG emission factors, expressed in tCO2e/$million obtained from the International Reference Centre for the Life Cycle of Products, Processes and Services (CIRAIG)TM open input output model. To account for 2009 to 2016 inflation, emission factors were divided by a factor of 1.1229 (Bank of Canada, 2018). The CIRAIGTM factors include those for 234 commodity classes based on NAICS classification. The current version of the CIRAIGTM model is only based on the LCA GHG emissions occurring within Canada and does not include imports from other countries. This assumption is thought to underestimate consumption-based GHG emissions by 29% (Weber and Matthews, 2008). To account for the higher carbon-intensity of imported goods, the emission factors were increased by 29%, after accounting for inflation.
The emission factors were weighted for 15 summary level expenditure groups (Table 5) based on expenditure information outlined in Table 6. The emission factors were weighted as the breakdown of final demand in the symmetrical input-output table does not line up with the breakdown of consumption based on end-use. For example, Albertan households spend on average 8.7% of their disposable income on food, and a further 6.2% on prepared food and non-alcoholic beverage services (i.e. restaurants). However, “food” is not one of the categories in the symmetrical input output table. Instead, food costs are captured by several industries, including “crop and animal production”, “utilities”, “manufacturing”, “wholesale trade”, “retail trade”, and “accommodation and food services”. To address this aspect, emission factors were based on assumed breakdown of cost inputs for final demand. These weighted factors, adjusted for inflation, were then used to in the GHG emissions analysis (Table 5).
Table 5 Weighted Emission Factors
Sector
tCO2e/$million
Household Spending
Private Capital Expenditure
Government Spending
Agriculture, Forestry 1775 1775 1775
Oil & Gas, Mining 1000 1000 1000
Utilities 1549 1851 1953
Construction 393 349 408
Manufacturing 672 1006 945
Wholesale & Retail Trade 771 280 820
Transportation & Warehousing 891 1171 1005
Information & Cultural Industries 187 187 187
Finance, Insurance, Professional Services, Business Management 158 307 213
Real Estate 294 302 302
Waste Management Services 650 650 650
Education And Healthcare Services 239 272 272
Accommodations And Food Services 388 380 386

APPLICATION OF PAS 2070: CITY OF EDMONTON
Consumption Based GHG Inventory
23
Sector
tCO2e/$million
Household Spending
Private Capital Expenditure
Government Spending
Arts, Entertainment, Recreation, And Miscellaneous Services 472 472 472
3.3.1.6 GHG Emissions Analysis
The GHG emissions analysis involved deriving industry-specific GHG intensity factors, based on tCO2e/$ of expenditures (by industry or commodity group), and then multiplying these factors by the estimates of household spending, private sector capital spending, and government spending, as described above in Tasks 1 – 4.
Overall GHG emissions for the City are estimated using the following relationship:
GHGe = SUM[(HFDi X GIFi) + (PCSj X GIFj) + (GSk X GIFk) + (OSl X GIFl)]
where:
GHGe = Greenhouse gas emissions
HFDi = household final demand for goods and services within City, disaggregated by Statistics Canada Input-Output Industry Classification (IOIC) i, expressed in $
PCSj = Private sector capital spending within City, for Statistics Canada IOIC j, expressed in $
GSk = Government spending within City, within Statistics Canada IOIC k, expressed in $
OSl = Other spending within City, within Statistics Canada IOIC l, expressed in $
GIFi,j,k,l = GHG intensity factors for Statistics Canada IOIC i, j, k, l, expressed in tCO2e/$ million of expenditure
3.3.2 Assumptions
A number of assumptions were applied to facilitate the analysis, as identified below:
Emission factors – Consumption based emission factors were derived from those contained within the CIRAIGTM
database, which are average 2009 reporting year factors for all of Canada and do not include GHG emissions from imports. To account for inflation between 2009 and 2016, and the fact that the CIRAIG model does not account for life cycle GHG emissions outside of Canada, the emission factors were adjusted by a factor of 1.0496 (0.29/1.1229). This may result in the over estimation of non-imported (Canada made/generated) goods and services.
Expenditure categories – The CB analysis was tailored so that expenditure categories used in the analysis matched those provided for emission factors available from the CIRAIGTM model. This involved the use of a symmetrical input-output table to transpose overall household, private sector, and government spending into industry sectors based on North American Industry Classification System (NAICS) commodity codes. At the level of analysis performed for this

APPLICATION OF PAS 2070: CITY OF EDMONTON
Consumption Based GHG Inventory
24
paper, the emission factors used to estimate GHG emissions were based on relatively aggregated assumptions of the breakdown of expenditure by commodity group. For example, it was assumed that household expenditures associated with manufacturing will be divided into the following for expenditure categories: “other food products”, “gasoline”, “household appliances”, “other motor vehicle parts”, “passenger cars,” “household furniture, and “miscellaneous manufactured products.” Because the relative costs of goods and services differs across the country, the actual consumption-based emission factors for the City may differ from those contained within the CIRAIGTM database.
Emission factors homogeneity – It was assumed that GHG intensity of a disaggregated good or service will be the same for all end-users. By using a symmetrical input-output tables, goods and services consumed by households, private sector capital spending, and government spending are comparable based on the same breakdown of economic sectors that would experience a change in final demand.
Linearity of Household Consumption – It was assumed that the pattern of household consumption is linear at different income levels, and that the proportional breakdown of household expenditures of households with average after-tax income is representative of all households. In reality, households at different income levels likely exhibit differences in household consumption.
Private sector capital spending – It was assumed that the breakdown of private sector capital spending by industry is based on the proportion of each industry’s Albertan workforce that works in Edmonton. However, actual capital spending patterns within Edmonton may differ from those in Alberta overall for any given industrial sector.
Emission factor weighting – Emission factor weightings were based on assumed breakdown of spending for each expenditure category for household expenditure, private sector capital spending, and capital spending. While the weightings were informed by available expenditure information the spending breakdowns are aggregated, which may affect the accuracy of the estimated emission factors, and thus GHG estimates.
Government transfers, wages and salaries, and tax payments – It is assumed that government transfers, payment of wages and salaries, and tax payments do not contribute directly to GHG emissions. It is assumed that GHG emissions only occur at the point of final demand, via a good or service procured by a household, private organization, or government body.
Government spending – It is generally assumed that provincial and federal government spending within Edmonton is proportional to City’s population relative to Alberta overall. According to the 2016 Census, Edmonton had a population of 932,546 persons in 2016, approximately 22.9% of Alberta’s total (Statistics Canada, 2017).
3.3.3 Data Sources
3.3.3.1 Sources
Data used in the analysis came from the sources described in Table 6.

APPLICATION OF PAS 2070: CITY OF EDMONTON
Consumption Based GHG Inventory
25
Table 6 Data Sources Used in Consumption Based GHG Inventory
Source Type Description
City of Edmonton 2016 Annual Report.
Consolidated Statement of Operations and Accumulated Surplus
Schedule 1 - Consolidated Schedule of Tangible Capital Assets
Government of Alberta 2016/2017 Annual Report
Consolidated Statement of Operations
Schedule 12 – Tangible Capital Assets
Statistics Canada
2013. Provincial Symmetrical Input-Output Tables. 2010.
Symmetrical input-output tables for Province of Alberta, for 40 expenditure categories (goods, services, taxes, government spending, etc.) for 40 industry/economic sectors.
Statistics Canada 2016 Census (Edmonton, Alberta) 2016 Census profile for Edmonton, Alberta Census
sub-division.
Statistics Canada
Table 36-10-0035-01: Household Expenditure (Alberta)
Capital and repair expenditures, broken down by industry, for years: 2014 – 2018
Statistics Canada
Table 36-10-0225-01: Household Expenditure (Alberta)
Breakdown of total Alberta household expenditures on goods and services for years 2014 – 2017
Statistics Canada
36-10-0450-01: Government Spending (Federal)
Federal government revenue and expenditure in Alberta: 2014-2017
3.3.3.2 Data Quality Assessment
The analysis was based on a high-level breakdown of expenditures associated with household consumption, private sector capital spending, and government spending. Because it is based on highly aggregated information, there is low level of precision of CB GHG Inventory.
3.3.3.3 Limitations
The analysis undertaken is not based on the proportion of money spent on end-uses, but the proportion of economic activity associated with spending that would be reflected in industry output per major NAICS commodity classification codes. The data sets used in this analysis does not have the level of granularity needed to distinguish specific products produced in different areas. Furthermore, the data sets and assessment does not account for regional differences in income and cost of goods and services. This could be addressed by modifying the emission intensity factors based on purchasing power parity to account for regional differences in income and cost of goods and services, but this would require a very detailed economic trade assessment.
The assessment assumes that the production of goods and services imported into Canada and the City are equal in terms of intensity. However, in reality this is not the case and thus GHG emissions intensities are likely to be higher in some areas and countries than others. For example, using the Green Design Institute of Carnegie Mellon University

APPLICATION OF PAS 2070: CITY OF EDMONTON
Consumption Based GHG Inventory
26
Life Cycle Assessment (LCA) GHG emission factors, the City’s consumption GHG emissions are estimated to be an order of magnitude higher than the production based GHG emissions. An in-depth study of LCA GHG emissions specific to the City’s economic goods and services accounts would need to be completed to improve the accuracy of the emission factors.
The CB assessment data cannot readily be re-organized into reporting sectors to allow for a comparison to the PB GHG inventory. On the flip-side, the PB inventory is also limited in this aspect as well as the specific sources of the data (e.g. postal code) is not available due to privacy requirements. More disaggregated models of household spending may improve the accuracy of the CB analysis. Such models could be developed using a variety of statistical or modeling techniques, including multiple regression analysis, econometric modelling, or sector end-use modelling. As it relates to improving the accuracy of the consumption-based analysis of GHG emissions, it may be possible to obtain from Statistics Canada custom releases of data aggregated at the level of a census subdivision and/or more highly disaggregated consumption and expenditure information.
3.4 RESULTS
3.4.1 Household Spending & GHG Emissions
In 2016 average household income within the City of Edmonton was $114,083 (Statistics Canada, 2017). Of this amount, approximately 17.9% was paid in income taxes resulting in average disposable household income of $93,682. Figure 10 illustrates the estimated breakdown of household expenditures in City of Edmonton, based on Statistics Canada household survey information (Statistics Canada, Table 36-10-0225-01). Shelter and transportation are the largest household expenditures, collectively accounting for 40% of all household expenditures (Figure 10).

APPLICATION OF PAS 2070: CITY OF EDMONTON
Consumption Based GHG Inventory
27
Figure 10 City of Edmonton 2016 Household Consumption Breakdown (Statistics Canada. Not dated (2))
Edmonton’s 360,825 households purchased approximately $32.7 billion in goods and services in 2016. Consumption taxes accounted for an average of 6.3% of purchases, resulting in net of taxes purchases of $31,677 million. Figure 11 provides a breakdown of 2016 net household spending in Edmonton, organized by major economic commodity categories. Manufacturing, real estate, and wholesale/retail trade collectively account for 57% of all household consumption, with the remaining 12 sectors accounting for 43%.
Shelter 25%
Transportation 14%
Recreation and Culture
9% Insurance & Financial Services
9%
Food 9%
Accommodations and meals
8%
Furnishings 5%
Misc 5%
Health 4%
Clothing 4%
Alcohol/Tobacco 4%
Communications 3% Education
1%

APPLICATION OF PAS 2070: CITY OF EDMONTON
Consumption Based GHG Inventory
28
Figure 11 Edmonton 2016 Household Consumption by Industry Sector
In 2016, household consumption accounted for an estimated 16.4 million tonnes of GHG emissions in the City, of which the top three sectors, manufacturing, wholesale and retail trade, and real estate accounted for over 64% of total emissions (Table 7).
Table 7 Household Consumption GHG Emissions
Sector Intensity Factor ($M / tCO2e)
GHG Emissions (tCO2e)
Agriculture, Forestry 1,775 668,085
Oil & Gas, Mining (Support Services) 1,000 174,930
Utilities 1,549 937,412
Construction 393 14,647
Manufacturing 672 4,904,841
Wholesale & Retail Trade 771 3,978,149
Transportation & Warehousing 891 1,067,730
Information & Cultural Industries 187 234,263
Finance, Insurance, Professional Services, Business Management 158 741,910
Real Estate 294 1,666,367
$0
$1,000
$2,000
$3,000
$4,000
$5,000
$6,000
$7,000
$8,000
$ M
illion
s
T

APPLICATION OF PAS 2070: CITY OF EDMONTON
Consumption Based GHG Inventory
29
Sector Intensity Factor ($M / tCO2e)
GHG Emissions (tCO2e)
Waste Management Services 650 91,993
Education And Healthcare Services 239 225,250
Accommodations And Food Services 388 911,347
Arts, Entertainment, Recreation, And Miscellaneous Services 472 702,780
Non-Profit Institutions Serving Households 319 96,577
Total 16,416,282
3.4.2 Private Sector Capital Spending & GHG Emissions
2016 private sector capital spending in Alberta was $55.8 billion (Statistics Canada Table 34-10-0035-01), of which an estimated $8.4 billion in capital expenditure occurred in City. The top three sectors: oil and gas, transportation, and utilities, accounted for an estimated 63% of all private sector capital spending within City, with 37% of spending spread over the other sectors (Figure 12 ).
Figure 12 City of Edmonton 2016 Private Capital Expenditure Spending by Industry Sector
Of the $8.4 billion in private capital expenditure spending, an estimated 2.3% ($191 million) were taxes on products and production, while wages and salaries comprise an estimated 24% ($2.0 billion). Both taxation and wage payment are financial transfers and are assumed to take place with no GHG emissions.
$0
$500
$1,000
$1,500
$2,000
$2,500
$3,000
$ M
illion
s

APPLICATION OF PAS 2070: CITY OF EDMONTON
Consumption Based GHG Inventory
30
In 2016, private sector capital spending accounted for an estimated 5.8 million tonnes of GHG emissions in the City (Table 8) of which oil and gas/mining, transportation/warehousing, and utilities account for 78% of all emissions.
Table 8 GHG Emissions from Private Sector Capital Spending
Sector Intensity Factor ($M / tCO2e)
GHG Emissions (tCO2e)
Agriculture, Forestry 1,775 50,178
Oil & Gas, Mining (Support Services) 1,000 1,862,341
Utilities 1,851 1,171,953
Construction 349 99,271
Manufacturing 1,006 395,653
Wholesale & Retail Trade 280 33,203
Transportation & Warehousing 1,171 1,693,635
Information & Cultural Industries 187 37,603
Finance, Insurance, Professional Services, Business Management 307 34,921
Real Estate 302 125,177
Waste Management Services 650 35,690
Education And Healthcare Services 272 6,144
Accommodations And Food Services 380 12,959
Arts, Entertainment, Recreation, And Miscellaneous Services 472 186,954
Non-Profit Institutions Serving Households 319 59,761
Total 5,805,442
3.4.3 Government Spending & GHG Emissions
3.4.3.1 City of Edmonton Operational Spending
In 2016, the City incurred approximately $2.8 billion of operational spending (City of Edmonton 2017). Operational spending is spread over a number of city services, as summarized in Figure 13.

APPLICATION OF PAS 2070: CITY OF EDMONTON
Consumption Based GHG Inventory
31
Figure 13 City of Edmonton 2016 Operational Spending (Edmonton, 2017)
In 2016, the City spent approximately $1.9 billion on capital assets, including assets and transfers. Of this, approximately 52% was spent on engineered systems (roadways, and drainage), 32% on buildings, and the balance on machinery, equipment, land, and other expenditures (Table 9).
Table 9 2016 City of Edmonton Capital Spending (Edmonton, 2017)
Sector Additions / Transfers to Capital Assets
($ Thousands) Buildings $616,875
Roadway system $592,851
Drainage system $414,737
Machinery and equipment $101,494
Land improvements $72,618
Land $63,967
Vehicles $43,350
Light rail transit $11,256
Bus system $6,057
Waste $4,473
Other $1,595
Total $1,929,273
3.4.3.2 Government of Alberta
In 2016 the Government of Alberta (the Province) spent $48.3 billion providing a wide variety of services within the province. Health care and education dominate provincial spending, accounting for over 67% of total spending, with all other government services and programs accounting for the balance (Figure 14). Assuming that provincial
Transportation Services
29%
Protective Services 23%
Community Services 20%
Utility and enterprise services
13%
Corporate 15%

APPLICATION OF PAS 2070: CITY OF EDMONTON
Consumption Based GHG Inventory
32
government operational spending is evenly distributed by population, the City accounts for $12.1 billion of the Province’s operational spending, or approximately 22.9% of the total spend.
Figure 14 2016/2017 Government of Alberta Operational Spending (Alberta, 2017)
In 2016, the Province spent approximately $5.1 billion on capital assets, including assets and transfers. Of this, approximately 49% was spent on buildings, 20% on dams and water management works, and 18% on roads (32% on buildings, and the balance on machinery, equipment, land, and other expenditures) (Table 10).
Table 10 2016 Provincial Capital Spending (Alberta, 2017)
Sector Additions / Transfers to Capital Assets
($ Thousands) Buildings $2,482
Dams/Water Management $1,039
Highways and Roads $902
Equipment $405
Land $101
Computers $66
Bridges $60
Land Improvements $34
Total $5,089
Assuming that 10% of Provincial spending on water management and roads occurs in the City, and 23% for other capital items, the Province spent an estimated $807 on capital expenditures occurring within City boundaries in 2016.
Education 27%
Health 39%
Other 34%

APPLICATION OF PAS 2070: CITY OF EDMONTON
Consumption Based GHG Inventory
33
3.4.3.3 Federal Government Spending
In 2016, total federal spending in Alberta amounted to $27.3 billion. However, just 17.4% of federal spending ($4.7 billion) was on goods and services which would result in the release of GHG emissions. The bulk of federal spending in Alberta was transfers to households, other governments, and other organizations including childcare benefit, employment insurance payments, Old Age Security, and federal funding for healthcare and education. Such transfers are reflected in household, government, and non-government organization spending, and thus to avoid double-counting have not been not included in the assessment.
Figure 15 Federal Government Spending in Alberta 2016 (Statistics Canada Table 36-10-0450-01)
Assuming that federal government operational spending is evenly distributed by population, the City received approximately $1.1 billion worth of federal goods and services spending in 2016.
3.4.3.4 Total Government Spending
Total City 2016 spending, net of transfers and interest payments is estimated at $16.0 billion. Figure 16 illustrates the breakdown of expenditures between goods and services, taxes, wages and salaries, and gross operating surplus. The payment of wages and salaries is the largest expenditure item, accounting for over half of overall government spending. Because wage payment is a form of transfer to households, expenditures on wages and salaries are not included in the estimate of GHG emissions. Gross operating surplus includes funds used for capital spending as well as operational deficits or surpluses. In summary, for the 2016 reporting year, the three levels of government purchased approximately $6.0 billion in goods and services within the City’s boundaries that would contribute to the CB inventory.
Expenditures on Goods and Services
18%
Transfers to Households
39% Transfers to other
Governments 30%
Other Transfers 4%
Interest on debt 9%

APPLICATION OF PAS 2070: CITY OF EDMONTON
Consumption Based GHG Inventory
34
Figure 16 Summary of 2016 Government Spending in Edmonton, Net of Transfers and Interest Payments
In 2016, government spending accounted for an estimated 4.6 million tonnes of GHG emissions. Of these GHG emissions, City spending, inclusive of operational spending and capital expenditures accounted for an estimated 34% of emissions (1.5 MtCO2e). Provincial spending, including spending on health, education, and other services, as well as capital expenditure accounted for an estimated 61% of government-related emissions (2.8 MtCO2e). Federal government spending accounted for an estimated 244,326 tonnes of GHG emissions in 2016 (or 5% of total government GHG emissions). Expenditures related to the purchase of manufactured goods, construction, and wholesale and retail trade collectively accounted for over 65% of GHG emissions associated with government spending in 2016. A summary of government spending GHG emissions is presented in Table 11.
$0 $1,000 $2,000 $3,000 $4,000 $5,000 $6,000
Government Health
Government Education
Federal Government Services
Provincial Government Services
Municipal Services
Municipal Capital Expenditures
Provincial Capital Expenditures
$ Millions
Goods and Services Taxes and SubsidiesWages, Salaries, Mixed Income Gross Operating Surplus

APPLICATION OF PAS 2070: CITY OF EDMONTON
Consumption Based GHG Inventory
35
Table 11 GHG Emissions from Government Spending
Sector Government Health GHG Emissions
(tCO2e)
Government Education
GHG Emissions
(tCO2e)
Federal Government
Services GHG Emissions
(tCO2e)
Provincial Government
Services GHG
Emissions (tCO2e)
Municipal Services
GHG Emissions
(tCO2e)
Municipal Capital
Expenditures GHG
Emissions (tCO2e)
Provincial Capital
Expenditures GHG
Emissions (tCO2e)
Total GHG Emissions
(tCO2e)
Agriculture, Forestry 2,433 15,734 1,129 94,432 1,628 - - 115,356 Oil & Gas, Mining (Support Services) 14,935 13,134 2,246 10,533 30,270 - - 71,117
Utilities 32,477 28,033 11,244 50,080 85,878 - - 207,713 Construction 43,813 33,332 11,752 28,733 56,496 694,964 274,143 1,143,232 Manufacturing 104,455 540,032 68,954 280,422 138,087 136,888 101,411 1,370,251 Wholesale & Retail Trade 40,376 209,350 25,475 126,522 54,184 - - 455,906 Transportation & Warehousing 102,731 35,109 38,737 29,172 45,169 17,397 - 268,315 Information & Cultural Industries 10,553 6,188 2,323 9,555 7,066 - - 35,686
Finance, Insurance, Professional Services, Business Management
20,542 15,757 15,249 66,761 20,051 - - 138,359
Real Estate - - - - - - - - Waste Management Services 30,082 38,846 33,106 69,621 118,392 - - 290,045 Education And Healthcare Services 12,868 17,320 14,331 34,459 50,636 - - 129,615
Accommodations And Food Services 6,891 26,272 3,625 9,942 7,510 - - 54,240
Arts, Entertainment, Recreation, And Miscellaneous Services
26,482 35,795 15,675 116,854 61,861 - - 256,668
Non-Profit Institutions Serving Households 326 2,317 480 18,152 5,381 - - 26,656
Total 448,965 1,017,220 244,326 945,237 682,609 849,248 375,554 4,563,159

APPLICATION OF PAS 2070: CITY OF EDMONTON
Consumption Based GHG Inventory
36
3.4.4 Other Spending
GHG emissions resulting from spending by the non-profit sector are included in the estimated GHG emission inventory associated with household consumption, private sector capital spending, and government spending.
3.5 DISCUSSION
3.5.1 Summary
Total City consumption based GHG emissions are estimated at 26.8 MtCO2e. As it relates to the total CB inventory, for the 2016 reporting year, construction, manufacturing and wholesale trade account for 53% of the City’s GHG emissions to which 37% of these GHG emissions resulted from household consumption (Figure 17).
Figure 17. Breakdown of Total Consumption Based GHG Emissions
Of the total consumption based GHG emissions, household consumption accounted for 61% of total emissions, followed by private sector capital investment at 22%, and then government spending at 17%. This breakdown is comparable with the breakdown of Canada’s 2016 GDP by expenditure, which was: household consumption (56%),
Agriculture, forestry
3%
Oil & gas, Mining
8%
Utilities 9%
Construction 5%
Manufacturing 25%
Wholesale & Retail Trade 17%
Transportation & Warehousing
11%
Information & Cultural Industries
1%
Finance, Insurance, Professional Services,
Business Mgmt 3%
Real Estate 7%
Waste Mgmt Services 1%
Education and Healthcare Services
1% Accommodations and Food Services
4%
Arts, Entertainment, Recreation, and
Misc Services 4%
Non-profit Institutions Serving Households
1% Total

APPLICATION OF PAS 2070: CITY OF EDMONTON
Consumption Based GHG Inventory
37
private sector capital spending (21%), government spending (21%), other (1%) (Statistics Canada, CANSIM Table 380-0064).
Figure 18 GHG Emissions associated with City of Edmonton, Consumption Based Estimate (MtCO2e)
3.5.2 Comparison of GHG Inventory Results
The PB and CB inventories both estimate GHG emissions from numerous GHG sources, including residential, commercial, industrial, transportation, waste and land-use. But how they account for the GHG emissions differ significantly. The PB inventory accounts for all emissions that physically originate within the City’s municipal boundaries, like building and vehicle fuel consumption, the consumption of grid-supplied electricity, heating and/or cooling, and the disposal of waste. The CB inventory includes all the GHG emissions resulting from the consumption or use of goods and services by residents, businesses, and governments located within the City’s municipal boundaries. For the 2016 reporting year, the City’s PB and CB GHG emissions amounted to 18.3 MtCO2e and 26.8 MtCO2e, respectively.
On a per-capita basis, the City’s consumption GHG emissions amount to 28.7 tCO2e/person which is 47% higher than the City’s per-capita production GHG emissions. On an absolute basis, the City’s consumption GHG emissions are 32% higher than the production based GHG emissions which is consistent with other comparable consumption
-
1,000,000
2,000,000
3,000,000
4,000,000
5,000,000
6,000,000
7,000,000
8,000,000
GH
G E
mis
sion
s (tC
O2e
)
Government Private Sector Capital Spending Household Spending

APPLICATION OF PAS 2070: CITY OF EDMONTON
Consumption Based GHG Inventory
38
based GHG emissions inventories. For example, the State of Oregon’s are estimated to be 19% higher than their estimated production GHG emissions (Oregon, 2015) and the San Francisco Bay Area’s consumption based GHG emissions are 35% higher (UC Berkley, 2015). On the higher end, London, England’s CB emissions are estimated to be 157% higher that the PB emissions (PAS, 2018). These results, in addition to other city and state results, are presented in Table 12.
Table 12 Other City And State PB and CB GHG Inventories
City Production Based GHG Inventory Results
Consumption Based GHG Inventory Results
Difference (%)
City of London, UK 44,440,000 tCO2e 114,100,000 tCO2e 156.8%
District of Saanich, CAN 426,000 tCO2e 881,000 tCO2e 106.8%
City of Vancouver, CAN 2,847,507 tCO2e 5,530,605 tCO2e 94.2%
City of Victoria, CAN 387,694 tCO2e 703,000 tCO2e 81.3%
San Francisco Bay Area, US 86,600,000 tCO2e 115,200,000 tCO2e 33.0%
State of Oregon, US 62,800,000 tCO2e 74,700,000 tCO2e 18.9%
The relation between the City’s GHG inventories is presented in Figure 19, and summarized in Table 12.

APPLICATION OF PAS 2070: CITY OF EDMONTON
Consumption Based GHG Inventory
39
Figure 19. Comparison of GHG Inventory Approaches
(5,000,000)
-
5,000,000
10,000,000
15,000,000
20,000,000
25,000,000
30,000,000
Consumption Production
GH
G E
mis
sion
s (tC
O2e
)
Upstream Fuel Extraction, Production and Transportation Non-profit institutions serving households
Arts, entertainment, recreation, and misc services Accommodations and Food Services
Education and Healthcare Services Waste Mgmt Services
Real Estate Finance, Insurance, Professional Services, Business Mgmt
Information & Cultural Industries Transportation & Warehousing
Wholesale & retail trade Manufacturing
Construction Utilities
Oil & gas, mining (support services) Agriculture, forestry

APPLICATION OF PAS 2070: CITY OF EDMONTON
Consumption Based GHG Inventory
40
Table 13 Summary of GHG Emissions (tCO2e) by GHG Method And Sector
Method / Source A
gric
ultu
re, F
ores
try
Oil
& G
as, M
inin
g
Util
ities
Con
stru
ctio
n
Man
ufac
turin
g
Who
lesa
le &
Ret
ail T
rade
Tran
spor
tatio
n &
W
areh
ousi
ng
Info
rmat
ion
& C
ultu
ral
Indu
strie
s
Fina
nce,
Insu
ranc
e,
Prof
essi
onal
Ser
vice
s,
Bus
ines
s M
gt.
Rea
l Est
ate
Was
te M
anag
emen
t Ser
vice
s
Educ
atio
n A
nd H
ealth
care
Se
rvic
es
Acc
omm
odat
ions
and
Foo
d Se
rvic
es
Art
s, e
nter
tain
men
t, re
crea
tion,
and
Mis
c. s
ervi
ces
Non
-pro
fit in
stitu
tions
ser
ving
ho
useh
olds
Tota
l GH
G E
mis
sion
s (tO
C2e
)
Consumption GHG Emissions (tCO2e) 833.6 2,108.4 2,317.1 1,257.2 6,670.7 4,467.3 3,029.7 307.6 915.2 1,791.5 417.7 361.0 978.5 1,146.4 183.0 26,784.9
Production GHG Emissions (tCO2e) (103.9) - 11,891.3 - 747.2 - 5,647.2 - - - 123.8 - - - - 18,305.6
Stationary energy and transportation GHG emission sources account for more than 95% of the City’s PB GHG emissions inventory, whereas in the CB inventory, similar sources only account for 20% of the GHG inventory. A possible reason for the difference is that the PB inventory uses an Alberta based utility emission factor, whereas the CB GHG inventory uses a Canadian average which is expected to be quite lower. In the CB inventory, the consumption of food and beverages, vehicles, construction materials, air travel services, furnishings, electronics, and clothing are all significant consumption categories in the CB inventory (~57%); many of the GHG emissions are not captured in the PB inventory as they are out of scope. Transportation GHG emissions in the CB inventory are remarkably lower than the PB inventory. The most likely reason is that the transportation GHG emissions are spread out over a number of categories (e.g. waste management, construction, manufacturing) and due to the nature of the data, cannot be disaggregated to allow for better comparison. Lastly, the CB waste GHG emissions are expectedly higher than the PB inventory waste GHG emissions as the former includes the operation of waste facilities, equipment, and transportation related GHG emissions. However, the CB inventory does not include the downstream GHG emissions from waste like the PB inventory, and thus will result in an underestimate of GHG emissions.

APPLICATION OF PAS 2070: CITY OF EDMONTON
Consumption Based GHG Inventory
41
3.5.3 Conclusion
The CB inventory reiterates what the City’s PB inventories have historically shown – i.e., the City should continue to focus on reducing GHG emission from buildings and road transport. The CB inventory also shows that the consumption of manufactured goods and services, and food are sources of significant GHG emissions in the City, and further exploration of these GHG emissions sources is warranted. However, the data available to support the preparation of a localized City-based CB inventory is not granular enough to identify where in the supply chain the GHG emissions are likely to arise and thus is limited in its ability to support GHG related policy and program decisions that the City may wish to take. On this basis, it is recommended that the City expand its current GPC BASIC+ GHG inventory to include the GHG emission sources required under the PAS 2070 direct plus supply chain (DPSC) approach which includes accounting for GHG emissions from the consumption of food and drink, water, construction materials. Specifically, a bottom-up data collection approach, rather than top-down (as applied in the CB assessment) is recommended to capture local consumption trends and GHG emission sources in the supply chain. It is still recommended that the City continue to follow the GPC Protocol which is a requirement for cities that have committed to the Global Covenant of Mayors. Should the City include the sources under PAS 2070, the City would be reporting under the BASIC+SC level. Lastly, it is recommended that the City complete a complete CB inventory every 5-years, which would align with National Census reporting, to assess general consumption trends and patterns over time.

APPLICATION OF PAS 2070: CITY OF EDMONTON
Direct Plus Supply Chain (DPSC) Approach
42
4.0 DIRECT PLUS SUPPLY CHAIN (DPSC) APPROACH
4.1 OVERVIEW
The DPSC approach captures direct GHG emissions from activities within the city boundary and indirect GHG emissions from the consumption of grid-supplied electricity, district heating or cooling, transboundary travel and the consumption of key goods and services produced outside the city boundary (PAS 2070, 2018). This includes the extraction, processing, refining and transport of primary fuels used for energy generation, as well as cradle-to-gate GHG emissions associated with the consumption of goods and services like food and drink, water, and construction materials. PAS 2070 recommends also including other goods and services that are estimated to make a material contribution to a city’s GHG inventory (>2%), such as financial goods and services provided outside of the City to residents within the City. Based on the City’s PB and CB inventories, no other sources are likely to exceed this threshold.
The following section provides an overview of how each of the additional GHG emissions sources identified under the PAS 2070 DPSC method could be quantified by the City.
4.1.1 GHG Emissions From The Extraction, Processing, Refining And Transport Of Primary Fuels
The data to estimate GHG emissions from the extraction, processing, refining and transport of primary fuels used for energy generation can be estimated using the energy data collected in the PB inventory and Alberta derived extraction, processing, and refining emission factors for gasoline, diesel and natural gas. These emission factors are presented in Table 13.
Table 14 Alberta Based Extraction, Processing, Refining And Transport Emissions Factors
Source Emission Factor
Diesel Production (tCO2e/L) 0.000411692
Gasoline Production (tCO2e/L) 0.000411692 Natural Gas Production (tCO2e/m3) 0.000200086
Using 2016 diesel, gasoline and natural gas consumption values from the PB GHG inventory, these GHG emissions are estimated to be 1,181,965 tCO2e. Under the GPC Protocol, as with PAS 2070, these GHG emissions are to be reported as Scope 3 GHG emissions sources.
4.1.2 GHG Emissions From Food And Drink Consumption
GHG emissions from food and drink consumption are to be disaggregated by (PAS 2070, 2018):
• Cradle to gate GHG emissions associated with economic final consumption of food and drink within the city; and

APPLICATION OF PAS 2070: CITY OF EDMONTON
Direct Plus Supply Chain (DPSC) Approach
43
• Direct GHG emissions from food production on a non-commercial basis within the city boundary (i.e. food produced on small plots of land used by city residents and not sold to others).
PAS 2070 notes that the GHG emissions from the food and drink life cycles correlate well with final economic expenditure data and thus recommends this approach. However, PAS 2070 requires that this be limited to residents only and that consumption of food and drink by visitors be excluded from the assessment where possible. Cognisant of the limitations using economic data (noted in the prior section on the CB inventory), two other options to estimate food and drink consumption can be considered: top-down, and bottom-up.
A top-down method would involve using national food availability per person by year and applying food specific LCA GHG emissions factors. This disaggregated data is collected by Statistics Canada data and would need to be organized into larger food groups to estimate per-capita consumption by food type. The approach is limited in that it uses national consumption patterns, and non-localized life cycle emission factors.
A bottom up approach would involve completing localized food and waste surveys to estimate actual food and drink consumption as well as the amount of waste going to landfill. Although the approach would still use non-localized life cycle emission factors, it would provide the City with a better understanding of localized consumption patterns as well as a breakdown of waste streams. The data from thee surveys could also feed into City policy decisions and programs, such as a Solid Waste Management Plan. The challenge with this approach is that it is resource and finance intensive.
To estimate direct GHG emissions from food production on a non-commercial basis within the city boundary (i.e. food produced on small plots of land used by city residents and not sold to others), for both approaches, the City would need to use Geographic Information Systems (GIS) to estimate the total residential garden area (in hectares) and then apply a generalized agriculture land-use emission factor (also used in the PB inventory to estimate direct and indirect soil GHG emissions from crop land under the AFOLU sector).
4.1.3 GHG Emissions From Water
PAS 2070 (2018) requires that GHG emissions from water assessment be disaggregated by residential buildings, and commercial, industrial and government buildings and facilities, and must GHG emission sources from:
• mains water supply within the city boundary from sources within the city boundary;
• mains water supply outside the city boundary from supplies within the city boundary; and
• mains water supply within the city boundary from sources outside the city boundary.
To estimate GHG emissions from water, the City can use the EPCOR fuel consumption data used in the City Corporate Operations GHG inventory as the data is broken down by utility service (i.e. power, water, etc.). The fuel consumption volumes and GHG emissions for water will need to be deducted from the Stationary Energy Category as to avoid double counting.

APPLICATION OF PAS 2070: CITY OF EDMONTON
Direct Plus Supply Chain (DPSC) Approach
44
4.1.4 GHG Emissions From Construction Materials
Under PAS 2070, cities are only required to report on the life cycle of GHG emissions associated with annual use of cement and steel materials as all other construction materials are likely to fall under the 2% threshold reporting requirement.
Due to the limitations in the granularity of the economic data, estimating the actual consumption of steel and concrete is challenging as a result of the poor granularity of the data, and that any estimate have a significant amount of uncertainty as it relates to the end-use. One option for the City to consider is to derive a set of building archetypes to estimate GHG emissions (e.g. condos are cast-in place concrete, single family residential are wood-framed, etc.). This would require the creation of building archetypes for each sector (residential, multi-family, commercial, institutional, etc.) and then use the Athena Building GHG estimator to quantify the GHG emissions associated with the construction of each archetype. The detail of the building archetype does not need to be overly onerous – for example, a commercial building could be identified as a cast in place concrete structure that includes mechanical and electrical services, washrooms, with no finishes. Using GIS and these architypes, for each reporting year, the City could then assess the number of new buildings, calculate their total height and gross square footage, by type, and then estimate the GHG emissions based on the calculated building archetypes already developed by the City. Over time, the City could require that any new commercial buildings over a set square footage complete a life cycle analysis of the building as part of a development permit application or zoning change.
There is likely to be additional concrete use as a result of City operations (pour in place, and the installation of sanitary sewer and storm water trunk lines) which could be tracked through the City’s procurement department, or also estimated using GIS. Once the total volume of concrete has been determined, the GHG emissions can be estimated using a lifecycle emission factor for concrete.
4.1.5 PAS 2070 Reporting Requirements
PAS 2070 does not have any additional reporting requirements beyond what is already established in the GPC Protocol. Should the City include the DPSC reporting sectors, the City would be required to assess both data and emission factors on their level of uncertainty (Low, Medium, High) and data quality (Low, Medium, High) as well as document data sources and any assumptions.
4.1.6 Modifications to the Existing City Community GHG Inventory
Should the City wish to meet the PAS 2070 DPSC reporting requirements, the City would need to update its community GHG inventory to include reporting on the additional sectors noted herein. Specifically, in-boundary water GHG emissions would be reported under Scope 1 (and netted out of Stationary Energy to avoid double counting), and out of boundary water GHG emissions being reported under Scope 3. GHG emissions from the extraction, processing, refining and transport of primary fuels, food and drink, and construction materials would all be reported under Scope 3. As these additional GHG emissions sources are likely to be material (>10%) of the City’s community GHG inventory, the City will need to update its base year and prior reporting years.
Meeting the PAS 2070 DPSC reporting requirements would shift the City to the BASIC+SC reporting level under the GPC Protocol.

APPLICATION OF PAS 2070: CITY OF EDMONTON
Closure
45
5.0 CLOSURE
This report has been prepared for the sole benefit of the City of Edmonton. The report may not be used by any other person or entity without the express written consent of Stantec and the City of Edmonton. All parties are subject to the same limit of liability and other terms as agreed to in the Stantec project agreement under which the work was conducted.
Any use that a third-party makes of this report, or any reliance on decisions made based on it, is the responsibility of such third parties. Stantec accepts no responsibility for damages, if any, suffered by any third party as a result of decisions made, or actions taken, based on this report. If this becomes a public document, members of the public and other third parties may only rely on this report, for its intended purposes, with the expressed written consent of Stantec.
The conclusions presented in this report represent the best technical judgment Stantec based on the data obtained from the work.
This report was prepared by Daniel Hegg. Quality review was provided by Nicole Flanagan.
We appreciate being of service to the City of Edmonton on this project. Should you have any questions, please contact the undersigned.
Sincerely,
Stantec Consulting Services Inc.
Daniel Hegg, MSC. CEM, ENV-SP Verifier Project Lead Stantec Consulting Ltd. T: (250) 217-9729 E: [email protected]
Frank Bohlken B.Sc., MRM Project Economist Stantec Consulting Ltd. T: (604) 412-2988 E: [email protected]
Nicole Flanagan, M.A.Sc., P.Eng. Quality Reviewer Stantec Consulting Ltd. T: (613) 738-6086 E: [email protected]

APPLICATION OF PAS 2070: CITY OF EDMONTON
References
46
6.0 REFERENCES
Beloin-Saint-Pierre et al. 2013. A review of urban metabolism studies to identify key methodological choices for future
harmonization and implementation. Available at: https://reader.elsevier.com/reader/sd/pii/S0959652616313531?token=96BE9E5CC3156C9464670A1E56FB976C0A95DAA15A2A59FF1B1FBA32225423806BC4840A9D52957ECD6CD6BDB8842230. Accessed on November 8, 2018.
C40. 2018. Consumption-Based GHG Emissions Of C40 Cities. Available at:
https://www.c40.org/researches/consumption-based-emissions. Accessed on October 17, 2018 City of Edmonton. 2017. Annual Report for Year Ending December 31, 2016. Available at:
https://www.edmonton.ca/city_government/documents/City_of_Edmonton_2016_Annual_Report_WEB.pdf. Accessed: November 13, 2018
CIRAIG. 2015. Open IO-Canada : Open Source Input-Output LCA Model And Tool To Estimate Life Cycle Impacts Of
Products And Services. Available at: http://www.ciraig.org/en/open_io_canada/. Accessed on October 30, 2018.
Environment and Climate Change Canada. 2016. National Inventory Report 1990 to 2014: Greenhouse Gas Sources
and Sinks in Canada. Part 1-3. April 2016. Available at: https://unfccc.int/national_reports/annex_i_ghg_inventories/national_inventories_submissions/items/8812.php
GPC. 2014. Global Protocol for Community-Scale Greenhouse Gas Emission Inventories: An Accounting and
Reporting Standard for Cities”; World Resources Institute, C40 Cities Climate Leadership Group, and ICLEI – Local Governments for Sustainability.
Government of Alberta. 2017. 2016 –17 Annual Report Executive Summary, Consolidated Financial Statements and
Measuring Up. Available at: https://open.alberta.ca/dataset/7714457c-7527-443a-a7db-dd8c1c8ead86/resource/e6e99166-2958-47ac-a2db-5b27df2619a3/download/GoA-2016-17-Annual-Report.pdf. Accessed: November 13, 2018
Government of Alberta. 2018. Electricity Capacity Market. Available at: https://www.alberta.ca/electricity-capacity-
market.aspx. Accessed on November 3, 2018 IPCC. 2014. Climate Change 2014: Synthesis Report. Contribution of Working Groups I, II and III to the Fifth
Assessment Report of the Intergovernmental Panel on Climate Change [Core Writing Team, R.K. Pachauri and L.A. Meyer (eds.)]. IPCC, Geneva, Switzerland, 151 pp.
Kitzes. 2013. An Introduction to Environmentally-Extended Input-Output Analysis. Available at:
https://www.mdpi.com/2079-9276/2/4/489/htm. Accessed on October 30, 2018. Oregon Department of Environmental Quality. 2018. Oregon’s Greenhouse Gas Emissions through 2015: An
assessment of Oregon’s sector-based and consumption-based greenhouse gas emissions. Available at: https://www.oregon.gov/deq/FilterDocs/OregonGHGreportAB.pdf. Accessed on November 18, 2018.
PAS 2070. 2018. PAS 2070:2013 Specification For The Assessment Of Greenhouse Gas Emissions Of A City -
Direct Plus Supply Chain And Consumption-Based Methodologies. Available at: https://shop.bsigroup.com/Browse-By-Subject/Environmental-Management-and-Sustainability/PAS-2070-2013/1 Accessed November 19, 2018
Statistics Canada. CANSM table 380-0064. Real gross domestic product by expenditure account, year-over-year
changes. Available at: https://www150.statcan.gc.ca/t1/tbl1/en/tv.action?pid=3610010401Accessed November 19, 2018
APPLICATION OF PAS 2070: CITY OF EDMONTON
References
47
Statistics Canada. Table 34-10-0035-01 Capital and repair expenditures, non-residential tangible assets, by industry
and geography (x 1,000,000). Available at: https://www150.statcan.gc.ca/t1/tbl1/en/tv.action?pid=3410003501. Accessed November 12, 2018
Statistics Canada. Table 36-10-0225-01 Detailed household final consumption expenditure, provincial and territorial,
annual (x 1,000,000). Available at: https://www150.statcan.gc.ca/t1/tbl1/en/tv.action?pid=3610022501. Accessed: November 14, 2018.
Statistics Canada. Table 36-10-0450-01 Revenue, expenditure and budgetary balance - General governments,
provincial and territorial economic accounts (x 1,000,000). Available at: https://www150.statcan.gc.ca/t1/tbl1/en/tv.action?pid=3610045001. Accessed: November 13, 2018.
Statistics Canada. 2013. Provincial Symmetric Input-Output Tables, Alberta. Statistics Canada. 2017. Census Profile. 2016 Census. Statistics Canada Catalogue no. 98-316-X2016001. Ottawa. Released November 29 2017. Available at:
http://www12.statcan.gc.ca/census-recensement/2016/dp-pd/prof/index.cfm?Lang=E UC Berkeley. 2015. A Consumption-Based Greenhouse Gas Inventory of San Francisco Bay Area Neighborhoods,
Cities and Counties: Prioritizing Climate Action for Different Locations. Available at: https://escholarship.org/uc/item/2sn7m83z. Accessed on November 23, 2018.
Weber, Christopher L., and H. Scott Matthews. 2008. “Quantifying the Global and Distributional Aspects of American
Household Carbon Footprint.” Ecological Economics 66(2–3): 379–91. World Resource Institute/ World Business Council for Sustainable Development. 2004. The Greenhouse Gas
Protocol. A Corporate Accounting and Reporting Standard. Revised Edition. Available at: http://www.ghgprotocol.org

APPENDIX A Production Based GHG Emission Factors

APPLICATION OF PAS 2070: CITY OF EDMONTON
Appendix A Production Based GHG Emission Factors
A.1
Appendix A PRODUCTION BASED GHG EMISSION FACTORS
The following emission factors were used in the quantification of the City’s production based GHG inventory for the 2016 reporting year.
Table 15 Production Based Emission Factors
Fuel Type / Activity Total CO2e Units Reported Consumption Intensity for AB 0.9 t CO2e/MWh Reported Generation Intensity for AB 0.76 t CO2e/MWh Propane (Stationary) 0.001542784 tonnes CO2e/L Alberta - Natural Gas (Marketable) - Industrial 0.001938759 tonnes CO2e/ m3 Alberta - Natural Gas (Marketable) - Manufacturing Industries 0.001938759 tonnes CO2e/ m3 Alberta - Natural Gas (Marketable) - Residential, Commercial 0.001939355 tonnes CO2e/ m3 Fugitive Emissions (natural gas) - Transmission 0.00682588 Gg CO2e/106 m3 marketable gas Fugitive Emissions (oil) - Oil Transport (pipelines) 0.00013549 Gg CO2e/103 m3 marketable gas Gasoline-LDV 0.00246181 tonne CO2e / L Gasoline-LDT 0.00249484 tonne CO2e / L Gasoline-HDV 0.0023773 tonne CO2e / L Gasoline-ORVE 0.0023984 tonne CO2e / L E10-LDV 0.00223021 tonne CO2e / L E10-LDT 0.00226324 tonne CO2e / L E10-HDV 0.0021457 tonne CO2e / L E10-ORVE 0.0021668 tonne CO2e / L Diesel-LDV 0.002756835 tonne CO2e / L Diesel-LDT 0.00275726 tonne CO2e / L Diesel-HDV 0.002737748 tonne CO2e / L Diesel-ORVE 0.00299175 tonne CO2e / L Gasoline-HYBRID-LDV 0.00320306 tonne CO2e / L Motorcycle - Non catalyst 0.002387804 tonne CO2e / L Rail 0.0299175 tonne CO2e / L Jet Fuel 0.002581883 tonne CO2e / L Forestland 170.7 tonnes / ha Grasslands 161 tonnes / ha Wetlands 326 tonnes / ha Cropland 195.86616 tonnes / ha Settlements 0 tonnes / ha Other 0 tonnes / ha Forestland 170.7 tonnes / ha / year Grasslands 161 tonnes / ha / year

APPLICATION OF PAS 2070: CITY OF EDMONTON
Appendix A Production Based GHG Emission Factors
A.2
Fuel Type / Activity Total CO2e Units Wetlands 326 tonnes / ha / year Croplands 9.793308 tonnes / ha / year Settlements 0 tonnes / ha / year Other 0 tonnes / ha / year Emission factor for boilers, heaters and furnaces based on fuel usage 0.001902248 tonne of CO2e/m3 fuel
Emission factor for flaring of natural gas 0.002553442 tonne of CO2e/m3 fuel Emission factor for the industrial combustion of landfill gas 2.75474 tonne of CO2e/t Emission factor for N2O-N/kg sewage-N 2.98 kg N2O-N/kg sewage-N Biological treatment emission factors - composting 189.4 g / kg waste