application of paper-supported printed gold electrodes for
TRANSCRIPT
Biosensors 2013, 3, 1-17; doi:10.3390/bios3010001
biosensors ISSN 2079-6374
www.mdpi.com/journal/biosensors/
Article
Application of Paper-Supported Printed Gold Electrodes for Impedimetric Immunosensor Development
Petri Ihalainen 1,*, Himadri Majumdar 2,†,*, Tapani Viitala 3, Björn Törngren 1,
Tuomas Närjeoja 4, Anni Määttänen 1, Jawad Sarfraz 1, Harri Härmä 4, Marjo Yliperttula 3,
Ronald Österbacka 2 and Jouko Peltonen 1
1 Center of Excellence for Functional Materials and Laboratory of Physical Chemistry,
Department of Natural Sciences, Åbo Akademi University, Turku, Finland;
E-Mails: [email protected] (B.T.); [email protected] (A.M.); [email protected] (J.S.);
[email protected] (J.P.) 2 Center of Excellence for Functional Materials and Physics, Department of Natural Sciences,
Åbo Akademi University, Turku, Finland; E-Mail: [email protected] 3 Division of Biopharmaceutics and Pharmacokinetics, Faculty of Pharmacy, University of Helsinki,
Helsinki, Finland; E-Mails: [email protected] (T.V.); [email protected] (M.Y.) 4 Laboratory of Biophysics, Institute of Biomedicine and Medicity Research Laboratories,
University of Turku, Turku, Finland; E-Mails: [email protected] (T.N.);
[email protected] (H.H.)
† Current address: VTT Technical Research Center of Finland, Tietotie 3, Espoo 02150, Finland.
* Authors to whom correspondence should be addressed; E-Mails: [email protected] (P.I.);
[email protected] (H.M.); Tel.: +358-2-215-4256 (P.I.); Fax: +358-2-215-4609 (H.M.).
Received: 15 November 2012; in revised form: 13 December 2012 / Accepted: 24 December 2012 /
Published: 27 December 2012
Abstract: In this article, we report on the formation and mode-of-operation of an affinity
biosensor, where alternate layers of biotin/streptavidin/biotinylated-CRP-antigen/anti-CRP
antibody are grown on printed gold electrodes on disposable paper-substrates. We have
successfully demonstrated and detected the formation of consecutive layers of
supra-molecular protein assembly using an electrical (impedimetric) technique. The
formation process is also supplemented and verified using conventional surface plasmon
resonance (SPR) measurements and surface sensitive characterization techniques, such as
X-ray photoelectron spectroscopy (XPS) and atomic force microscopy (AFM). The article
provides a possible biosensor development scheme, where—(1) fabrication of paper
OPEN ACCESS

Biosensors 2013, 3 2
substrate (2) synthesis of gold nanoparticle inks (3) inkjet printing of gold electrodes on
paper (4) formation of the biorecognition layers on the gold electrodes and (5) electrical
(impedimetric) analysis of growth—all are coupled together to form a test-structure for
a recyclable and inexpensive point-of-care diagnostic platform.
Keywords: paper electronics; nanoparticles; inkjet printing; immunoassays; impedance
spectroscopy
1. Introduction
In the field of clinical diagnostics, much focus is currently put towards the development of high
performance biosensors that could provide low-cost and easy to use analytical tools for rapid, reliable
and sensitive diagnosis of the clinically relevant analytes [1]. Generally speaking, biosensors can be
classified as either enzymatic or affinity biosensors. In the former, enzymes are used as biorecognition
element, whereas the latter are based on the affinity reaction resulting in the formation of a complex.
Affinity biosensors include, e.g., immunosensors (antibody-antigen), DNA sensors and whole cell
biosensors. The label-free affinity-based probing concepts for monitoring of antibody-antigen
interactions are a subject of much academic and industrial level research, and they offer a potential
alternative to the well-established and widely used enzyme-linked immunosorbent assay (ELISA).
C-reactive protein (CRP) is a common marker of inflammation. Measuring and charting CRP
values can prove useful in determining disease progress or the effectiveness of treatments. In addition,
the acute phase proteins, such as CRP, display important biological functions with implications for the
etiopathogenesis of many autoimmune diseases [2]. The level of autoantibodies directed against native
or structurally altered forms of acute phase proteins have been shown to correlate with disease activity.
For example, anti-CRP antibodies levels have been shown to be helpful to assess disease activity in
systemic lupus erythematosus.
Surface plasmon resonance (SPR) is a standard optical technique that allows for real-time
monitoring of changes in the refractive index of a thin film close to a surface. This technique is used
for the measurement of real-time, label free biomolecular (affinity) interactions. While one of the
reaction partners is immobilized to the sensor surface, the other is passed over the immobilized layer as
a solution. Bindings are measured as changes in the refractive index of the surface. Such detections are
also possible by using electrical techniques, namely measurement of variation of the dielectric property
of the two binding layers. This method is, in general, called impedimetric detection. The operations,
development and applications of impedimetric immunosensors have been extensively reviewed in the
literature [3–8]. Immunosensors based on impedimetric detection are considered as potential
candidates because they possess attractive characteristics, such as cost-effective instrumentation, ease
of miniaturization and integration into multi-array concepts.
Paper-electronics or the science of creating electronics on paper by using various printing methods
has gained in popularity over the last decade [9]. This opens up the possibility of building electronic
platforms for cheap, disposable, recyclable applications. Biosensing, or medical diagnostics, is one
such area where paper electronics can be of immense potential. There have been several reports

Biosensors 2013, 3 3
worldwide on this topic. Screen-printing has been the most widely applied technique for
producing paper-supported devices for, e.g., electrochemical glucose detection or electrochemical
immunoassay [10–12]. It was recently shown by Määttänen et al. that inkjet printing can be utilized for
the fabrication of a low-cost three-electrode platform on a recyclable paper substrate. It was also
demonstrated that by modifying the printed gold working electrode, the platform could be used for
various electrochemical analyses, e.g., for the detection of glucose [13].
In this article, we report on the formation and mode-of-operation of an affinity biosensor, where
alternate layers of biotin/streptavidin/biotinylated-CRP-antigen/anti-CRP antibody are grown on
printed gold electrodes on disposable paper-substrates. The response of the sensors is recorded using
impedance analysis. The formation process of supramolecular protein assembly measured using
impedance spectroscopy is furthermore compared and verified using surface plasmon resonance (SPR)
measurements and surface sensitive characterization techniques, such as X-ray photoelectron
spectroscopy (XPS) and atomic force microscopy (AFM). The article provides a possible biosensor
development scheme where—(1) fabrication of paper substrate (2) synthesis of gold nanoparticle inks
(3) inkjet printing of gold electrodes on paper (4) formation of the biorecognition layers on the gold
electrodes and (5) electrical (impedimetric) analysis of growth—all are coupled together to build a
test-structure for a recyclable and inexpensive point-of-care diagnostic platform.
2. Experimental Section
2.1. Print Substrate
A multi-layer coated paper developed for printed electronics was used as print substrate [14,15].
The paper contains components normally used in industrial paper-making. The paper was coated with
materials that are commonly used in paper coatings, i.e., mainly latexes and mineral pigments. In its
core nature, the substrate used here is a natural fiber-based substrate, e.g., these papers are recyclable
in a similar way as normal paper prepared for the conventional graphic industry. The most important
physicochemical characteristics and examples of numerous applications in the field of printed
electronics are described in previously publications [13–20]. In short, the main components in the
nanoporous top coating (thickness ~3 µm) are kaolin pigment and styrene-butadiene latex binder. The
total thickness and grammage of the paper substrate was about 130 µm and 126 g/m2, respectively.
2.2. Synthesis and Characterization of the Gold Nanoparticles
All chemicals used for gold nanoparticle (AuNP) synthesis were purchased from Sigma-Aldrich
and used without further purification. Dodecanethiol-stabilized AuNPs were synthesized following the
procedure reported by Hostetler et al. [21]. Briefly, 1.4 mmol gold (III) chloride hydrate (HAuCl4·H2O)
in 20 mL deionized water was added under vigorous stirring to 32 mL toluene containing 3.5 mmol
tetraoctylammonium bromide (TOAB). The gold salt transferred into the organic phase, turning it
orange brown. The water phase was discarded, 0.35 mmol dodecanethiol was added to the organic
phase, and the mixture was stirred for 10 min. Sodium borohydride (NaBH4), 14 mmol in 20 mL
water, was added to the mixture under vigorous stirring. The dark solution was thereafter stirred for
3 h, after which the organic phase was collected and evaporated. The remaining dark residue was
Biosensors 2013, 3 4
redispersed in ethanol and filtered. The powder was washed with ethanol and acetone and dried in
vacuum overnight.
The size and shape of the synthesized gold nanoparticles were characterized using a FEI Tecnai 12
transmission electron microscope (TEM). The TEM samples were prepared by dispersing the solid
powder in xylene and applying a droplet onto a Cu mesh TEM grid. Image analysis of over
1,000 particles was carried out with the ImageJ software, giving a size distribution of 6.6 ± 2.3 nm.
2.3. Inkjet Printing of Gold Electrodes
The AuNP ink for inkjet printing was prepared by the dispersing nanoparticles (15 wt%) in xylene
(Sigma-Aldrich). Inkjet printing of the AuNP ink was performed with a Dimatix Materials Printer
(DMP-2800, FUJIFILM Dimatix, Inc., Santa Clara, CA, USA). The printing was done in ambient
conditions using a single nozzle, 10 pL drop volume, 27 ± 3 V firing voltage and a custom waveform
to ensure optimal droplet formation. Printing was performed using a drop spacing of 20 µm. Sintering
of the printed gold electrodes was carried out using a short-wave IR drier (IRT systems, Hedson
Technologies AB, Sweden) consisting of three 30 cm long 2 kW strip light bulbs with distance
between the sample and the lamp being about 20 cm. The sintering time was 20 s. The volume
resistivity of the printed gold structures was 1.6 × 10⁻⁷ Ωm. A more detailed description of the
fabrication, characterization and surface modification of the inkjet-printed paper-supported gold
electrodes is given in a previous communication [19]. In addition, a hydrophobic and translucent
polydimethylsiloxane (PDMS)-based ink (Dehesive 920, Wacker chemicals) was applied around the
perimeter of the electrodes to confine the aqueous sample solutions over the electrode area during the
protein immobilization and impedance measurements. The PDMS ink can be applied on a paper
substrate by manual spreading or by using roll-to-roll compatible techniques, such as flexographic or
inkjet printing [22]. A photograph of a paper-supported printed electrode used in this study is shown in
the Supplementary Figure S1. Material cost for manufacturing the electrodes are ~4 cents/cm2 due to
the low material consumption of inkjet printing, making them a really low-cost alternative to
conventionally prepared electrodes.
2.4. Monothiols and Proteins
11-Mercapto-1-undecanol (MuOH, HS(CH2)11OH) was purchased from Sigma-Aldrich. Biotinylated
hexa(ethylene glycol) undecane thiol (Biotin-PEG-thiol, HS(CH2)11(OCH2CH2)6NHBiotin) was obtained
from nanoScience Instruments (Phoenix, AZ, USA). The thiols were used as received. Streptavidin
was purchased from BioSPA (SPA Società Prodotti Antibiotici S.p.A., Italy). Anti-CRP antibody was
received from Orion Diagnostica Ltd., Finland. CRP antigen stock 2.95 mg/mL in TSA-buffer (pH 8,
20 mM Tris 150 mM NaCl, 7 mM NaN3 and 0.2 mM CaCl2) was acquired from Orion Diagnostica
Ltd., Finland. Biotinylated-CRP antigen (bio-CRP antigen) was prepared as follows: CRP antigen was
concentrated to 10 mg·mL−1 and the buffer was exchanged to 25 mM carbonate buffer (pH 8.2) in
Nanosep 30K (Pall, USA) centrifugal device. 1 mg of CRP antigen was biotinylated with (+)-Biotin
N-hydroxysuccinimide ester (Sigma-Aldrich, USA). Biotin-NHS was dissolved in DMSO to give
a final concentration of 11 mg·mL−1 and 10 μL aliquot was combined with CRP antigen. The reaction
was mixed and allowed to progress for 5 h at room temperature. The bio-CRP antigen was purified
Biosensors 2013, 3 5
with NAP5-column (GE healthcare, USA), and the buffer was exchanged back to TSA. The purified
concentration was assayed to be 599 mg·mL−1.
HEPES-EDTA aqueous solution (10 mM HEPES (Sigma), 150 mM NaCl (Fluka), 1 mM EDTA
(Sigma), pH 7.4) was used as a buffer solution in all the protein experiments.
2.5. Formation of Supramolecular Protein Layers on Printed Gold Electrodes
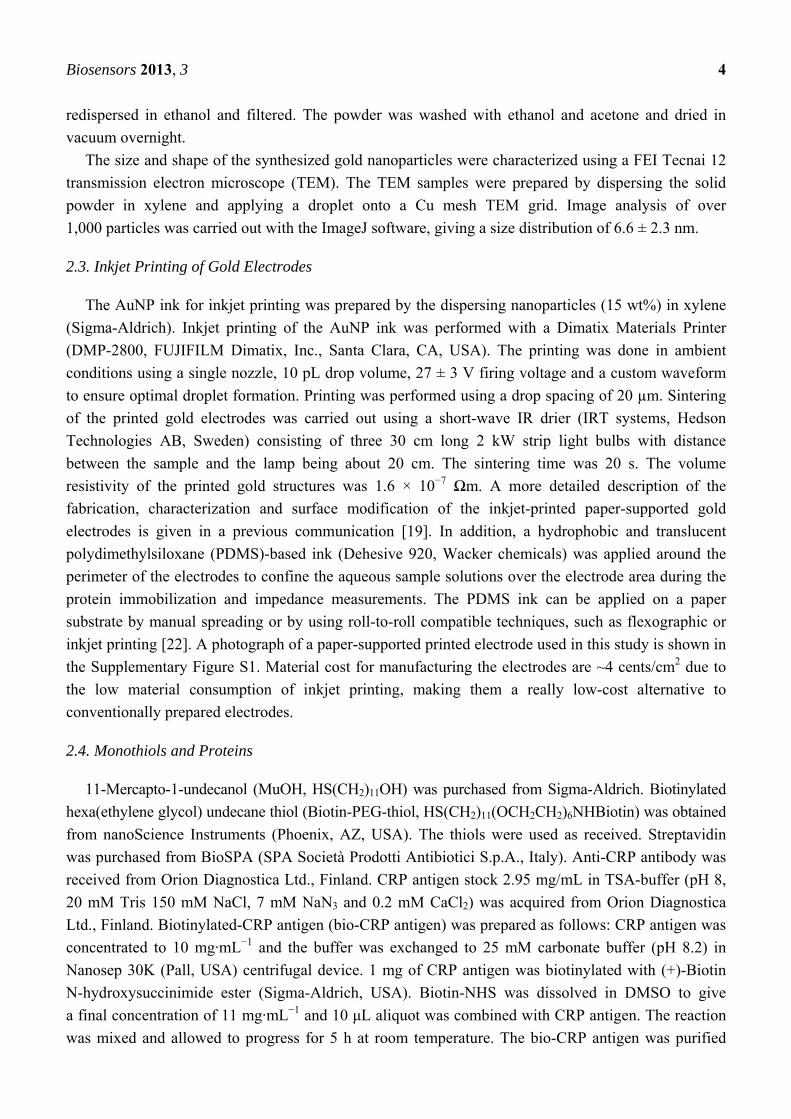
A schematic representation of the supramolecular protein layers is provided in Figure 1. The first
layer consisted of an adsorbed biotinylated self-assembled monolayer (SAM) on the gold electrodes,
formed from a MuOH:Biotin-PEG (85:15 mol%, 5 mM) (MBP) thiol solution in absolute ethanol
(ETAX Aa, Altia). Before exposure to SAM solution, the gold electrodes were cleaned with plasma
(air) flow (PDC-326, Harrick) for 2 min, rinsed with acetone and absolute ethanol and dried with
nitrogen gas. The paper-supported electrodes were sealed between two silicon rings in a liquid cell
with a cap to prevent evaporation, and the electrode surfaces were exposed to SAM solution (250 µL)
for 16 h at room temperature in the dark. The MBP was adsorbed on the gold surfaces. After thiolation,
the substrates were removed from the solution and rinsed immediately with absolute ethanol and dried
with nitrogen gas. The MBP SAM was used as a starting point for the formation of supramolecular
recognition assembly to ensure that the anchored streptavidin molecules remained biologically active
and in their native conformations and formed a homogenous and strongly bound intermediate layer
with a high binding capacity for subsequent immobilization of bio-CRP.
Figure 1. Schematic diagram of the structure (not to scale) of the supramolecular protein
layers streptavidin, biotinylated c-reactive protein (CRP) antigen and the bound analyte
(anti-CRP antibody) grown on biotinylated self-assembly monolayer (SAM)-covered
printed gold electrodes on a paper substrate.
The second layer was formed by applying a 40 µL drop of streptavidin in HEPES-EDTA aqueous
solution (2 µg/mL) over the electrode area. The immobilization of streptavidin onto the biotinylated
SAM covered electrodes was conducted at +4 °C for 8 h. After immobilization, the electrode surface
was rinsed with the HEPES-EDTA buffer solution and pure water (MilliQ) and dried with nitrogen gas.

Biosensors 2013, 3 6
The third layer was formed by applying a 40 µL drop of bio-CRP antigen in HEPES-EDTA
aqueous solution (20 µg/mL) over the electrode area. The immobilization of bio-CRP antigen onto the
MBP thiol/streptavidin layer covered electrodes was conducted at +4 °C for 8 h. After immobilization,
the electrode surface was rinsed with the HEPES-EDTA buffer solution and pure water (MilliQ) and
dried with nitrogen gas. The supramolecular protein assembly consisting of MBP SAM/streptavidin/
bio-CRP antigen formed the recognition layer for the subsequent immobilization of anti-CRP antibody.
The target analyte, anti-CRP antibody, was immobilized on the recognition layer by applying
a 40 µL drop of anti-CRP antibody in HEPES-EDTA aqueous solution (20 µg/mL) over the electrode
area. The immobilization of anti-CRP antibody onto the supramolecular recognition layer was
conducted at +4 °C for 8 h. After immobilization, the electrode surface was rinsed with buffer solution
and pure water (MilliQ) and dried with nitrogen gas.
2.6. Scanning Probe Microscopy
An NTEGRA Prima (NT-MDT, Russia) atomic force microscope (AFM) was used to analyze the
topography of the samples in intermittent-contact mode. The images (1,024 × 1,024 pixels) were
captured in ambient conditions (RH = 20–26%, T = 24–28 °C) using silicon cantilevers with a nominal
tip radius of 10 nm (Model: NSG10, NT-MDT, Russia). The scanning rate and the damping ratio were
0.39 Hz and 0.6–0.7, respectively. The reported values for the root-mean-square roughness (σ, the
standard deviation of height features) and the surface area ratio (Sdr, the increment of the interfacial
surface area relative to the area of the projected flat plane) were calculated from 1 µm × 1 µm
AFM images.
2.7. X-Ray Photoelectron Spectroscopy
The X-ray photoelectron spectroscopy (XPS) spectra were obtained with a PHI Quantum 2000
scanning spectrometer, using monochromatic Al Kα (1,486.6 eV) excitation and charge neutralization
by using an electron filament and an electron gun. The photoelectrons were collected at 45° in relation
to the sample surface with a hemispherical analyzer. The analyzing depth was approximately 5–10 nm.
The pass energy was 117.4 eV, and the acquisition time was 10 min. The measurements were carried
out on three different spots for each sample.
2.8. Surface Plasmon Resonance
Surface Plasmon Resonance (SPR) gold slides were coated with SAM by immersing the slide in
MBP solution (5 mM in ethanol) for 16 h. After thiolation, the substrates were removed from the
solution and rinsed immediately with absolute ethanol and dried with nitrogen gas. Immobilization of
streptavidin and bio-CRP-antigen was monitored in situ with a SPR instrument (SPR Navi 200,
Bionavis Ltd., Tampere, Finland). The SPR Navi 200 instrument has an integrated peristaltic pump
and a sample loop system connected to a 6-port valve, which allows injection of sample plugs into the
continuously running buffer. For streptavidin and bio-CRP-antigen interaction measurements, the flow
channel of the SPR system was first filled with HEPES-EDTA buffer with a constant flow rate of
20 L/min. After a stable baseline was obtained, solutions with increasing concentrations (ranging
Biosensors 2013, 3 7
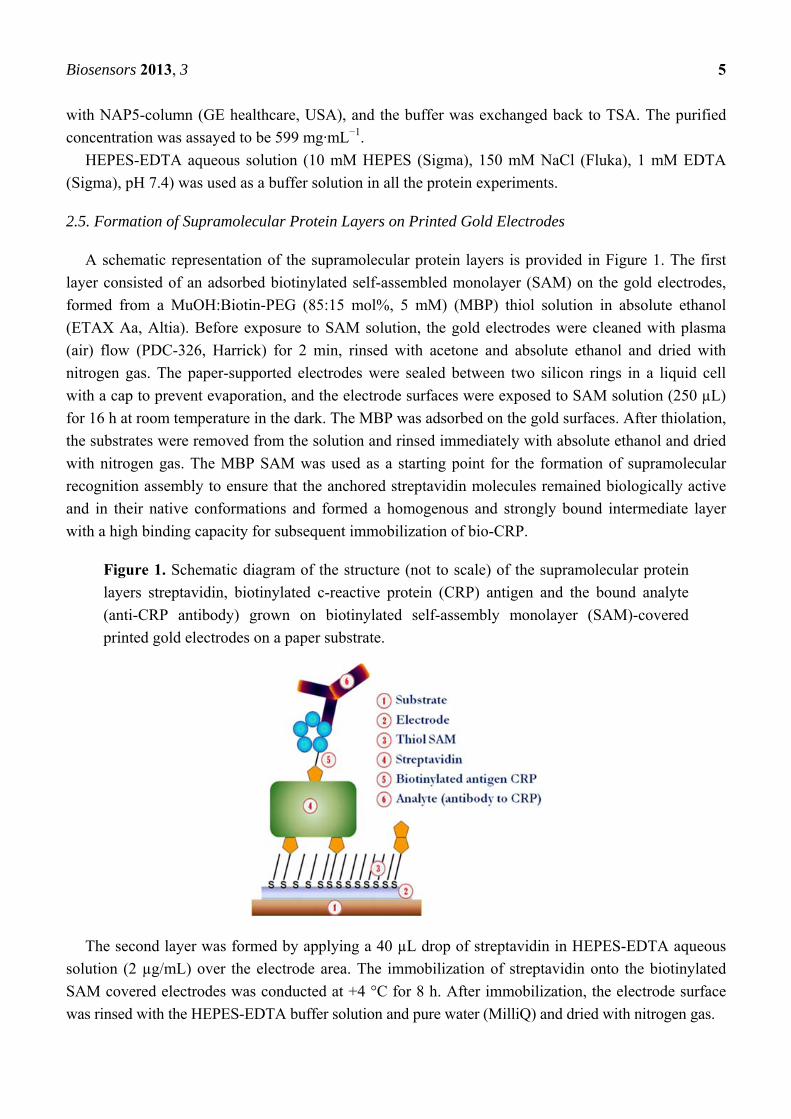
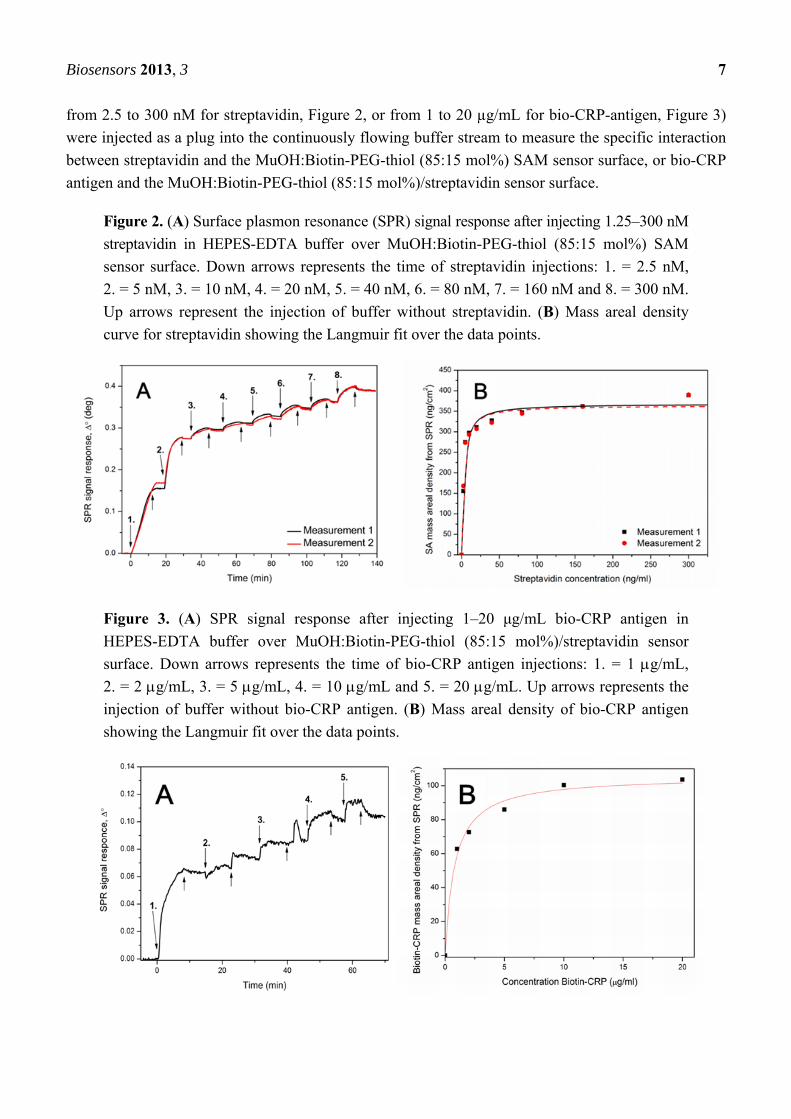
from 2.5 to 300 nM for streptavidin, Figure 2, or from 1 to 20 µg/mL for bio-CRP-antigen, Figure 3)
were injected as a plug into the continuously flowing buffer stream to measure the specific interaction
between streptavidin and the MuOH:Biotin-PEG-thiol (85:15 mol%) SAM sensor surface, or bio-CRP
antigen and the MuOH:Biotin-PEG-thiol (85:15 mol%)/streptavidin sensor surface.
Figure 2. (A) Surface plasmon resonance (SPR) signal response after injecting 1.25–300 nM
streptavidin in HEPES-EDTA buffer over MuOH:Biotin-PEG-thiol (85:15 mol%) SAM
sensor surface. Down arrows represents the time of streptavidin injections: 1. = 2.5 nM,
2. = 5 nM, 3. = 10 nM, 4. = 20 nM, 5. = 40 nM, 6. = 80 nM, 7. = 160 nM and 8. = 300 nM.
Up arrows represent the injection of buffer without streptavidin. (B) Mass areal density
curve for streptavidin showing the Langmuir fit over the data points.
Figure 3. (A) SPR signal response after injecting 1–20 μg/mL bio-CRP antigen in
HEPES-EDTA buffer over MuOH:Biotin-PEG-thiol (85:15 mol%)/streptavidin sensor
surface. Down arrows represents the time of bio-CRP antigen injections: 1. = 1 g/mL,
2. = 2 g/mL, 3. = 5 g/mL, 4. = 10 g/mL and 5. = 20 g/mL. Up arrows represents the
injection of buffer without bio-CRP antigen. (B) Mass areal density of bio-CRP antigen
showing the Langmuir fit over the data points.
Biosensors 2013, 3 8
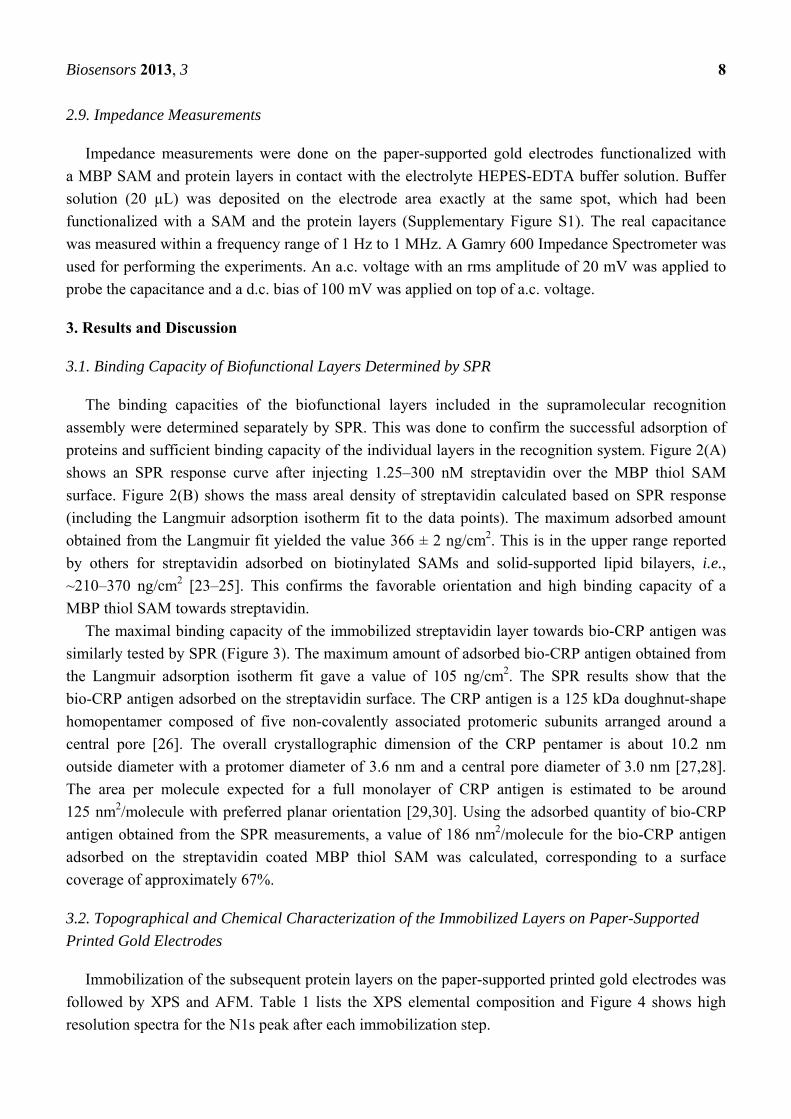
2.9. Impedance Measurements
Impedance measurements were done on the paper-supported gold electrodes functionalized with
a MBP SAM and protein layers in contact with the electrolyte HEPES-EDTA buffer solution. Buffer
solution (20 µL) was deposited on the electrode area exactly at the same spot, which had been
functionalized with a SAM and the protein layers (Supplementary Figure S1). The real capacitance
was measured within a frequency range of 1 Hz to 1 MHz. A Gamry 600 Impedance Spectrometer was
used for performing the experiments. An a.c. voltage with an rms amplitude of 20 mV was applied to
probe the capacitance and a d.c. bias of 100 mV was applied on top of a.c. voltage.
3. Results and Discussion
3.1. Binding Capacity of Biofunctional Layers Determined by SPR
The binding capacities of the biofunctional layers included in the supramolecular recognition
assembly were determined separately by SPR. This was done to confirm the successful adsorption of
proteins and sufficient binding capacity of the individual layers in the recognition system. Figure 2(A)
shows an SPR response curve after injecting 1.25–300 nM streptavidin over the MBP thiol SAM
surface. Figure 2(B) shows the mass areal density of streptavidin calculated based on SPR response
(including the Langmuir adsorption isotherm fit to the data points). The maximum adsorbed amount
obtained from the Langmuir fit yielded the value 366 ± 2 ng/cm2. This is in the upper range reported
by others for streptavidin adsorbed on biotinylated SAMs and solid-supported lipid bilayers, i.e.,
~210–370 ng/cm2 [23–25]. This confirms the favorable orientation and high binding capacity of a
MBP thiol SAM towards streptavidin.
The maximal binding capacity of the immobilized streptavidin layer towards bio-CRP antigen was
similarly tested by SPR (Figure 3). The maximum amount of adsorbed bio-CRP antigen obtained from
the Langmuir adsorption isotherm fit gave a value of 105 ng/cm2. The SPR results show that the
bio-CRP antigen adsorbed on the streptavidin surface. The CRP antigen is a 125 kDa doughnut-shape
homopentamer composed of five non-covalently associated protomeric subunits arranged around a
central pore [26]. The overall crystallographic dimension of the CRP pentamer is about 10.2 nm
outside diameter with a protomer diameter of 3.6 nm and a central pore diameter of 3.0 nm [27,28].
The area per molecule expected for a full monolayer of CRP antigen is estimated to be around
125 nm2/molecule with preferred planar orientation [29,30]. Using the adsorbed quantity of bio-CRP
antigen obtained from the SPR measurements, a value of 186 nm2/molecule for the bio-CRP antigen
adsorbed on the streptavidin coated MBP thiol SAM was calculated, corresponding to a surface
coverage of approximately 67%.
3.2. Topographical and Chemical Characterization of the Immobilized Layers on Paper-Supported
Printed Gold Electrodes
Immobilization of the subsequent protein layers on the paper-supported printed gold electrodes was
followed by XPS and AFM. Table 1 lists the XPS elemental composition and Figure 4 shows high
resolution spectra for the N1s peak after each immobilization step.
Biosensors 2013, 3 9
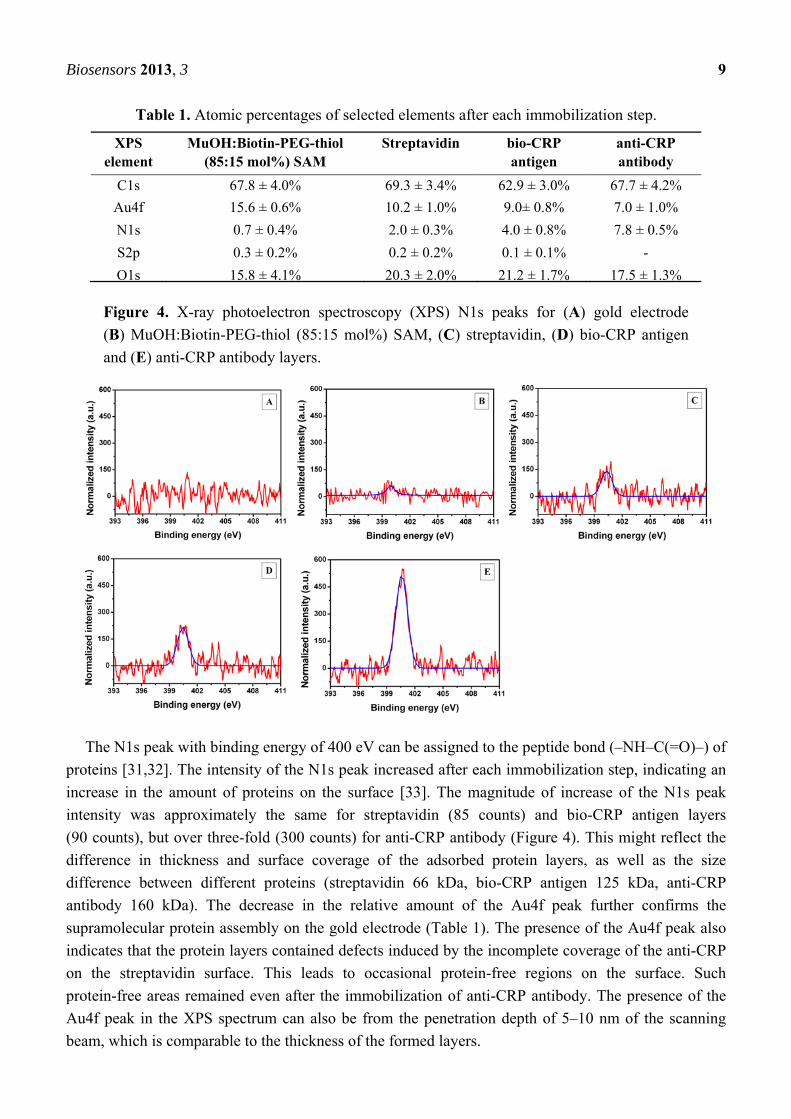
Table 1. Atomic percentages of selected elements after each immobilization step.
XPS element
MuOH:Biotin-PEG-thiol (85:15 mol%) SAM
Streptavidin bio-CRP antigen
anti-CRP antibody
C1s 67.8 ± 4.0% 69.3 ± 3.4% 62.9 ± 3.0% 67.7 ± 4.2%
Au4f 15.6 ± 0.6% 10.2 ± 1.0% 9.0± 0.8% 7.0 ± 1.0%
N1s 0.7 ± 0.4% 2.0 ± 0.3% 4.0 ± 0.8% 7.8 ± 0.5%
S2p 0.3 ± 0.2% 0.2 ± 0.2% 0.1 ± 0.1% -
O1s 15.8 ± 4.1% 20.3 ± 2.0% 21.2 ± 1.7% 17.5 ± 1.3%
Figure 4. X-ray photoelectron spectroscopy (XPS) N1s peaks for (A) gold electrode
(B) MuOH:Biotin-PEG-thiol (85:15 mol%) SAM, (C) streptavidin, (D) bio-CRP antigen
and (E) anti-CRP antibody layers.
The N1s peak with binding energy of 400 eV can be assigned to the peptide bond (–NH–C(=O)–) of
proteins [31,32]. The intensity of the N1s peak increased after each immobilization step, indicating an
increase in the amount of proteins on the surface [33]. The magnitude of increase of the N1s peak
intensity was approximately the same for streptavidin (85 counts) and bio-CRP antigen layers
(90 counts), but over three-fold (300 counts) for anti-CRP antibody (Figure 4). This might reflect the
difference in thickness and surface coverage of the adsorbed protein layers, as well as the size
difference between different proteins (streptavidin 66 kDa, bio-CRP antigen 125 kDa, anti-CRP
antibody 160 kDa). The decrease in the relative amount of the Au4f peak further confirms the
supramolecular protein assembly on the gold electrode (Table 1). The presence of the Au4f peak also
indicates that the protein layers contained defects induced by the incomplete coverage of the anti-CRP
on the streptavidin surface. This leads to occasional protein-free regions on the surface. Such
protein-free areas remained even after the immobilization of anti-CRP antibody. The presence of the
Au4f peak in the XPS spectrum can also be from the penetration depth of 5–10 nm of the scanning
beam, which is comparable to the thickness of the formed layers.
Biosensors 2013, 3 10
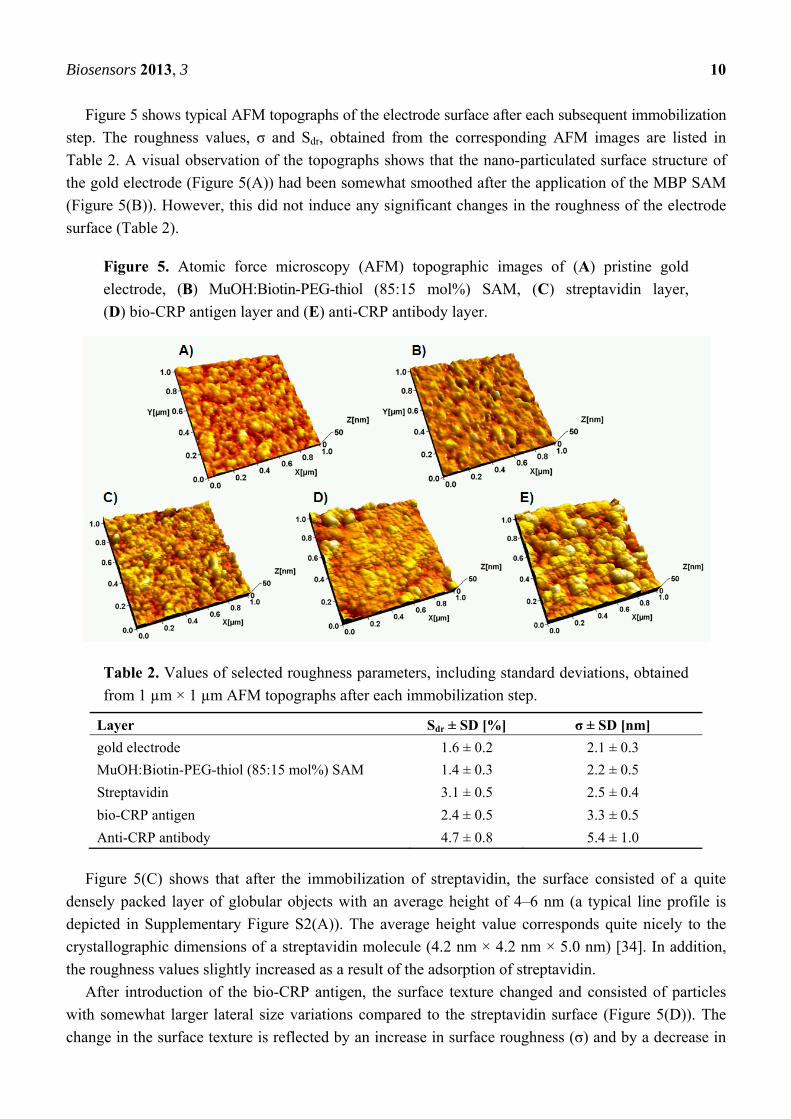
Figure 5 shows typical AFM topographs of the electrode surface after each subsequent immobilization
step. The roughness values, σ and Sdr, obtained from the corresponding AFM images are listed in
Table 2. A visual observation of the topographs shows that the nano-particulated surface structure of
the gold electrode (Figure 5(A)) had been somewhat smoothed after the application of the MBP SAM
(Figure 5(B)). However, this did not induce any significant changes in the roughness of the electrode
surface (Table 2).
Figure 5. Atomic force microscopy (AFM) topographic images of (A) pristine gold
electrode, (B) MuOH:Biotin-PEG-thiol (85:15 mol%) SAM, (C) streptavidin layer,
(D) bio-CRP antigen layer and (E) anti-CRP antibody layer.
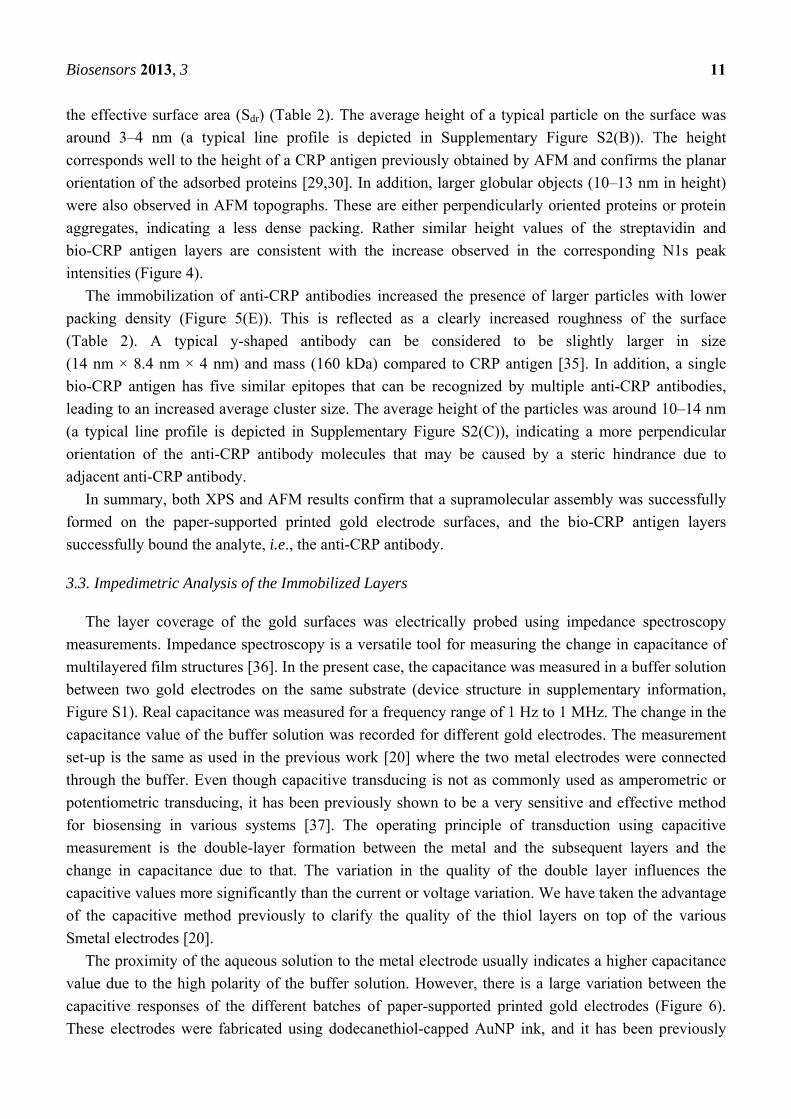
Table 2. Values of selected roughness parameters, including standard deviations, obtained
from 1 µm × 1 µm AFM topographs after each immobilization step.
Layer Sdr ± SD [%] σ ± SD [nm]
gold electrode 1.6 ± 0.2 2.1 ± 0.3
MuOH:Biotin-PEG-thiol (85:15 mol%) SAM 1.4 ± 0.3 2.2 ± 0.5
Streptavidin 3.1 ± 0.5 2.5 ± 0.4
bio-CRP antigen 2.4 ± 0.5 3.3 ± 0.5
Anti-CRP antibody 4.7 ± 0.8 5.4 ± 1.0
Figure 5(C) shows that after the immobilization of streptavidin, the surface consisted of a quite
densely packed layer of globular objects with an average height of 4–6 nm (a typical line profile is
depicted in Supplementary Figure S2(A)). The average height value corresponds quite nicely to the
crystallographic dimensions of a streptavidin molecule (4.2 nm × 4.2 nm × 5.0 nm) [34]. In addition,
the roughness values slightly increased as a result of the adsorption of streptavidin.
After introduction of the bio-CRP antigen, the surface texture changed and consisted of particles
with somewhat larger lateral size variations compared to the streptavidin surface (Figure 5(D)). The
change in the surface texture is reflected by an increase in surface roughness (σ) and by a decrease in
Biosensors 2013, 3 11
the effective surface area (Sdr) (Table 2). The average height of a typical particle on the surface was
around 3–4 nm (a typical line profile is depicted in Supplementary Figure S2(B)). The height
corresponds well to the height of a CRP antigen previously obtained by AFM and confirms the planar
orientation of the adsorbed proteins [29,30]. In addition, larger globular objects (10–13 nm in height)
were also observed in AFM topographs. These are either perpendicularly oriented proteins or protein
aggregates, indicating a less dense packing. Rather similar height values of the streptavidin and
bio-CRP antigen layers are consistent with the increase observed in the corresponding N1s peak
intensities (Figure 4).
The immobilization of anti-CRP antibodies increased the presence of larger particles with lower
packing density (Figure 5(E)). This is reflected as a clearly increased roughness of the surface
(Table 2). A typical y-shaped antibody can be considered to be slightly larger in size
(14 nm × 8.4 nm × 4 nm) and mass (160 kDa) compared to CRP antigen [35]. In addition, a single
bio-CRP antigen has five similar epitopes that can be recognized by multiple anti-CRP antibodies,
leading to an increased average cluster size. The average height of the particles was around 10–14 nm
(a typical line profile is depicted in Supplementary Figure S2(C)), indicating a more perpendicular
orientation of the anti-CRP antibody molecules that may be caused by a steric hindrance due to
adjacent anti-CRP antibody.
In summary, both XPS and AFM results confirm that a supramolecular assembly was successfully
formed on the paper-supported printed gold electrode surfaces, and the bio-CRP antigen layers
successfully bound the analyte, i.e., the anti-CRP antibody.
3.3. Impedimetric Analysis of the Immobilized Layers
The layer coverage of the gold surfaces was electrically probed using impedance spectroscopy
measurements. Impedance spectroscopy is a versatile tool for measuring the change in capacitance of
multilayered film structures [36]. In the present case, the capacitance was measured in a buffer solution
between two gold electrodes on the same substrate (device structure in supplementary information,
Figure S1). Real capacitance was measured for a frequency range of 1 Hz to 1 MHz. The change in the
capacitance value of the buffer solution was recorded for different gold electrodes. The measurement
set-up is the same as used in the previous work [20] where the two metal electrodes were connected
through the buffer. Even though capacitive transducing is not as commonly used as amperometric or
potentiometric transducing, it has been previously shown to be a very sensitive and effective method
for biosensing in various systems [37]. The operating principle of transduction using capacitive
measurement is the double-layer formation between the metal and the subsequent layers and the
change in capacitance due to that. The variation in the quality of the double layer influences the
capacitive values more significantly than the current or voltage variation. We have taken the advantage
of the capacitive method previously to clarify the quality of the thiol layers on top of the various
Smetal electrodes [20].
The proximity of the aqueous solution to the metal electrode usually indicates a higher capacitance
value due to the high polarity of the buffer solution. However, there is a large variation between the
capacitive responses of the different batches of paper-supported printed gold electrodes (Figure 6).
These electrodes were fabricated using dodecanethiol-capped AuNP ink, and it has been previously

Biosensors 2013, 3 12
shown that after IR sintering, there is a residual thiol layer still present on the surface of the
electrodes [19]. The amount varies between the different batches of electrodes. This residual thiol layer
is the source for a lower capacitance observed for pristine gold electrodes, as discussed earlier in this
work, as well as in previously published work [20]. From Figure 6, we see that there is a dispersion in
the capacitance value (increasing capacitance with decreasing frequencies) in the low-frequency
region. This can be attributed to the roughness of the electrodes. An interesting observation was made
as a consequence of the thiolation of the gold electrodes with MBP thiols. Following thiolation, the
gold electrodes were covered by a “dielectric” layer and the capacitance of the structure changed. The
quality of the thiol layers governs the change in the capacitance of the device structure. It was
observed that all the electrodes, previously exhibiting variations due to a varying amount of residual
thiols on the surface, now exhibit perfect dielectric properties with no or very little variation after
formation of the thiol-coverage. Moreover, the saturated capacitance values of the thiol-covered
electrodes in most cases showed steady capacitance values (~200–230 nF) at lower frequencies,
indicating a very good quality of the MBP thiol SAM.
Figure 6. Capacitance as a function of frequency after application of SAM.
Figure 7. Capacitance as a function of frequency after each immobilized layer.
Biosensors 2013, 3 13
Following the MBP thiol coverage, the subsequent streptavidin, bio-CRP antigen and anti-CRP
antibody layers were consecutively grown on the gold electrodes, as described before. The impedance
spectroscopy measurement was done following the formation of each of these layers. Figure 7 shows
the systematic variation of the real capacitance for the growth of each successive layer. There is a clear
capacitance variation observed in the frequency range of 1 Hz–1kHz. The increase in capacitance
cannot be explained using any simple model of equivalent circuit due to the complex nature of the
various layers and their interfaces. If we consider capacitance from the double-layers from each
interface to add up to a simple capacitive series, then a simple calculation shows that the capacitance
for each consecutive layer should decrease the capacitance, not increase it, as seen in Figure 7. The
complex nature of the structure would require detailed analysis of the equivalent circuit, which is
beyond the scope of the article. The important conclusion is that the impedance measurements show a
systematic variation of real capacitance for each consecutive layer growth. This enables the use of the
electrical (impedimetric) method for detecting analytes with hand-held, point-of-care diagnostic devices.
4. Conclusions
We have successfully demonstrated the formation of supramolecular protein layers on inkjet printed
gold electrodes on paper substrates. We have additionally detected the formation of consecutive layers
using an electrical (impedimetric) technique. The formation of the consecutive layers has also been
verified and supplemented by SPR measurements and surface sensitive chemical and topographical
measurements. Even though, the exact composition and scheme of the layers might not remain the
same, but the possibility of building up and detecting supramolecular protein layers on paper and using
impedimetry is demonstrated through this article. This provides a possible route for fabricating
inexpensive, recyclable, point-of-care diagnostic devices.
Acknowledgments
Laboratory of paper coating and converting, Åbo Akademi University, is thanked for providing the
paper substrates. The SALWE/SHOK IMO program (Project Number: 648/10) funded by the Finnish
Funding Agency for Technology and Innovation (TEKES) is acknowledged for financial support.
References
1. Borisov, S.M.; Wolfbeis, O.S. Optical biosensors. Chem. Rev. 2008, 60, 307–318.
2. Sjöwall, C.; Wetterö, J. Pathogenic implications for autoantibodies against C-reactive protein and
other acute phase proteins. Clin. Chim. Acta 2007, 378, 13–23.
3. Berggren, C.; Bjarnason, B.; Johansson, G. Capacitive biosensors. Electroanalysis 2001, 13,
173–180.
4. Katz, E.; Willner, I. Probing biomolecular interactions at conductive and semiconductive surfaces
by impedance spectroscopy: Routes to impedimetric immunosensors, DNA-sensors and enzyme
biosensors. Electroanalysis 2003, 15, 913–947.
5. Guan, J.G.; Miao, Y.Q.; Zhang, Q.J. Impedimetric biosensors. J. Biosens. Bioeng. 2004, 97,
219–226.

Biosensors 2013, 3 14
6. K’Owino, I.O.; Sadik, O.A. Impedance spectroscopy: A powerful tool for rapid, biomolecular
screening and cell culturing monitoring. Electroanalysis 2005, 17, 2101–2113.
7. Daniels, J.S.; Pourmand, N. Label-free impedance biosensors: Opportunities and challenges.
Electroanalysis 2007, 19, 1239–1257.
8. Prodromidis, M.I. Impedimetric immunosensors—A review. Electrochim. Acta 2010, 55,
4227–4233.
9. Tobjörk, D.; Österbacka, R. Paper Electronics. Adv. Mater. 2011, 23, 1935–1961.
10. Nie, Z.; Nijhuis, C.A.; Gong, J.; Chen, X.; Kumachev, A.; Martinez, A.W.; Narovlyansky, M.;
Whitesides, G.M. Electrochemical sensing in paper-based microfluidic devices. Lab Chip 2010,
10, 477–483.
11. Zang, D.; Ge, L.; Yan, M.; Song, X.; Yu, J. Electrochemical immunoassay on a 3D microfluidic
paper-based device. Chem. Commun. 2012, 48, 4683–4685.
12. Dungchai, W.; Chailapakul, O.; Henry, C.S. Electrochemical detection for paper-based
microfluidics. Anal. Chem. 2009, 81, 5821–5826.
13. Määttänen, A.; Vanamo, U.; Ihalainen, P.; Pulkkinen, P.; Tenhu, H.; Bobacka, J.; Peltonen, J.
A low-cost paper-based inkjet-printed platform for electrochemical analyses. Sens. Actuator. B
Chem. 2012, doi: 10.1016/j.snb.2012.10.113.
14. Bollström, R.; Määttänen, A.; Ihalainen, P.; Toivakka, M. Method for Creating a Substrate for
Printed or Coated Functionality, Substrate, Functional Device and Its Use; WO 2010/086511,
PCT/FI2010/050056, August 2010.
15. Bollström, R.; Määttänen, A.; Tobjörk, D.; Ihalainen, P.; Kaihovirta, N.; Österbacka, R.;
Peltonen, J.; Toivakka, M. A multilayer coated fiber-based substrate suitable for printed
functionality. Org. Electron. 2009, 10, 1020–1023.
16. Määttänen, A.; Ihalainen, P.; Bollström, R; Toivakka, M.; Peltonen, J. Wetting and print quality
study of an inkjet-printed poly(3-hexylthiophene) on pigment coated papers. Colloid. Surface. A
2010, 367, 76–84.
17. Ihalainen, P.; Määttänen, A.; Mattinen, U.; Stepien, S.; Bollström, R.; Toivakka, M.; Bobacka, J.;
Peltonen, J. Electrodeposition on PEDOT-Cl film on a fully printed Ag/polyaniline electrode on
paper. Thin Solid Films 2011, 519, 2172–2175.
18. Tobjörk, D.; Aarnio, H.; Pulkkinen, P.; Bollström, R.; Määttänen, A.; Ihalainen, P.; Mäkelä, T.;
Peltonen, J.; Toivakka, M.; Tenhu, H.; Österbacka, R. IR-sintering of ink-jet printed
metal-nanoparticles on paper. Thin Solid Films 2012, 520, 2949–2955.
19. Määttänen, A.; Ihalainen, P.; Pulkkinen, P.; Wang, S.; Tenhu, H.; Peltonen, J. Inkjet-printed gold
electrodes on paper: Characterization and functionalization. ACS Appl. Mater. Interfaces 2012, 4,
955–964.
20. Ihalainen, P.; Majumdar, H.; Määttänen, A.; Wang, S.; Österbacka, R.; Peltonen, J. Versatile
characterization of thiol-functionalized printed metal electrodes on flexible substrates for cheap
diagnostic applications. BBA-Gen. Subjects 2012, doi: 10.1016/j.bbagen.2012.09.007.
21. Hostetler, M.J.; Wingate, J.E.; Zhong, C.-J.; Harris, J.E.; Vachet, R.W.; Clark, M.R.;
Londono, J.D.; Green, S.J.; Stokes, J.J.; Wignall, G.D.; Glish, G.L.; Porter, M.D.; Evans, N.D.;
Murray, R.W. Alkanethiolate gold cluster molecules with core diameters from 1.5 to 5.2 nm: Core
and monolayer properties as a function of core size. Langmuir 1998, 14, 17–30.

Biosensors 2013, 3 15
22. Määttänen, A.; Fors, D.; Wang, S.; Valtakari, D.; Ihalainen, P.; Peltonen, J. Paper-based planar
reaction arrays for printed diagnostics. Sens. Actuator. B Chem. 2011, 160, 1404–1412.
23. Reimhult, E.; Larsson, C.; Kasemo, B.; Höök, F. Simultaneous surface plasmon resonance and
quartz crystal microbalance with dissipation monitoring measurements of biomolecular adsorption
events involving structural transformations and variations in coupled water. Anal. Chem. 2004,
76, 7211–7220.
24. Su, X.; Wu, Y.; Robelek, R.; Knoll, W. Surface plasmon resonance spectroscopy and quartz
crystal microbalance study of streptavidin film structure effects on biotinylated DNA assembly
and target DNA hybridization. Langmuir 2005, 21, 348–353.
25. Yang, N.; Su, X.; Tjong, V.; Knoll, W. Evaluation of 2-D and 3-D streptavidin chips for study
DNA-DNA and protein-DNA interactions. Biosens. Bioeletron. 2009, 24, 2522–2527.
26. Motie, M.; Brockmeier, S.; Potempa, L.A. Binding of model soluble immune complexes to
modified C-reactive protein. J. Immunol.1996, 156, 4435–4441.
27. Shirve, A.K.; Cheetham, G.M.T.; Holden, D.; Myles, D.A.; Turnell, W.G.; Volanakis, J.E.;
Pepys, M.B.; Bloomer, A.C.; Greenhough, T.J. Three dimensional structure of human C-reactive
protein. Nat. Struct. Biol. 1996, 3, 346–354.
28. Thompson, D.; Pepys, M.B.; Wood, S.P. The physiological structure of human C-reactive protein
and its complex with phosphocholine. Structure 1999, 7, 167–177.
29. Lin, S.; Lee, C.-K.; Wang, Y.-M.; Huang, L.-S.; Lin, Y.-H.; Lee, S.-Y.; Sheu, B.-C.; Hsu, S.-M.
Measurement of dimensions of pentagonal doughnut-shaped C-reactive protein using an atomic
force microscope and a dual polarisation interferometric biosensor. Biosens. Bioeletron. 2005, 22,
323–327.
30. Lee, S.-K.; Kim, H.-C.; Cho, S.-J.; Jeong, S.W.; Jeon, W.B. Binding behavior of CRP and
anti-CRP antibody analyzed with SPR and AFM measurement. Ultramicroscopy 2008, 108,
1374–1378.
31. Lindberg, B.; Maripuu, R.; Siegbahn, K.; Larsson, R.; Golander, C.C.; Eriksson, J.C. ESCA
studies of heparinized and related surfaces. J. Colloid Interface Sci. 1983, 95, 308–321.
32. Moulder, J.F.; Stickle, W.F.; Sobol, P.E.; Bomben, K.D. Handbook of X-Ray Photoelectron
Spectroscopy; Perkin-Elmer Corporation: Eden Prairie, MN, USA, 1992.
33. Sousa, S.R.; Moradas-Ferreira, P.; Saramago, B.; Viseu Melo, L.; Barbosa, M.A. Human serum
albumin adsorption on TiO2 from single protein solutions and from plasma. Langmuir 2004, 20,
9745–9754.
34. Weber, P.C.; Ohlendorf, D.H.; Wendoloski, J.J.; Salemme, F.R. Structural origins of high-affinity
biotin binding to streptavidin. Science 1989, 243, 85–88.
35. Silverton, E.W.; Navia, M.A.; Davies, D.R. Three-dimensional structure of an intact human
immunoglobulin. Proc. Natl. Acad. Sci. USA 1977, 74, 5140–5144.
36. Stelzle, M.; Weissmueller, G.; Sackmann, E. On the application of supported bilayers as receptive
layers for biosensors with electrical detection. J. Phys. Chem. 1993, 97, 2974–2981.
37. Pei, R.; Cheng, Z.; Wang, E.; Yang, X. Amplification of antigen-antibody interactions based on
biotin labeled protein-streptavidin network complex using impedance spectroscopy. Biosens.
Bioeletron. 2001, 16, 355–361.
Biosensors 2013, 3 16
Appendix
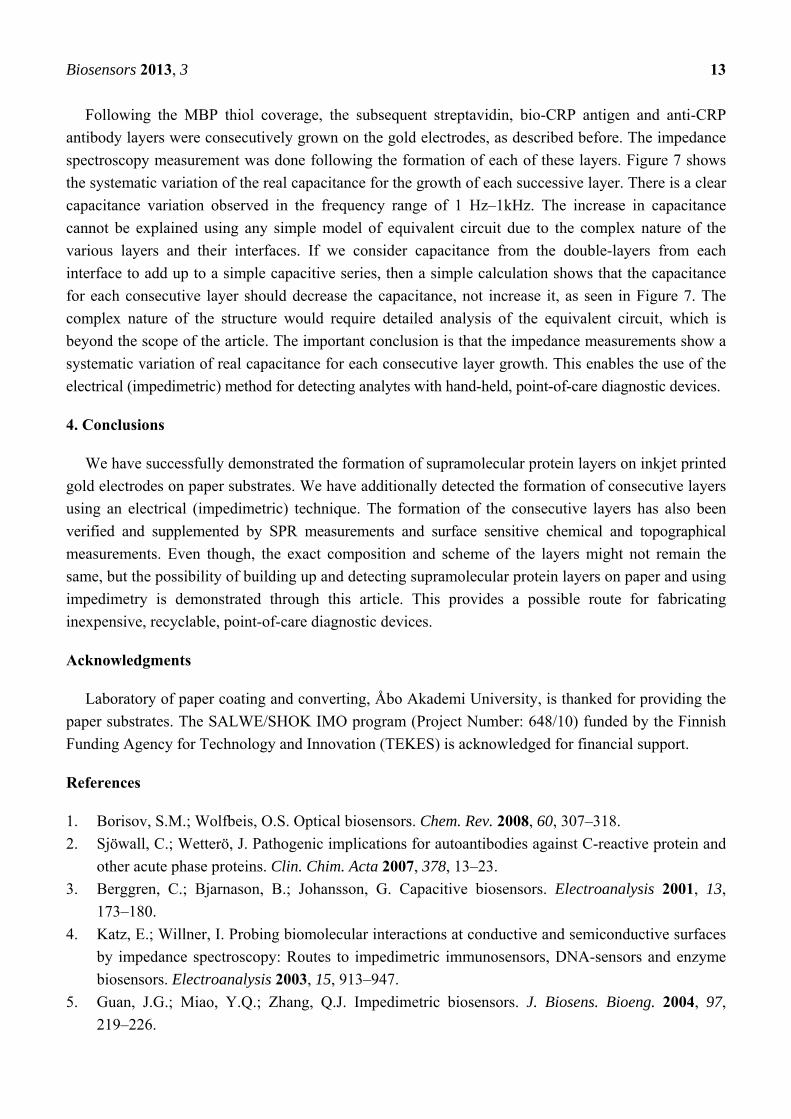
Figure S1. A photograph showing a printed gold electrode on a paper substrate. Also
shown is a drop (40 µL) of buffer deposited over the electrode demonstrating how the
immobilization of proteins and impedance measurement were conducted. The drop is
confined over the target spot by a translucent hydrophobic PDMS layer around the
perimeter of the electrode.
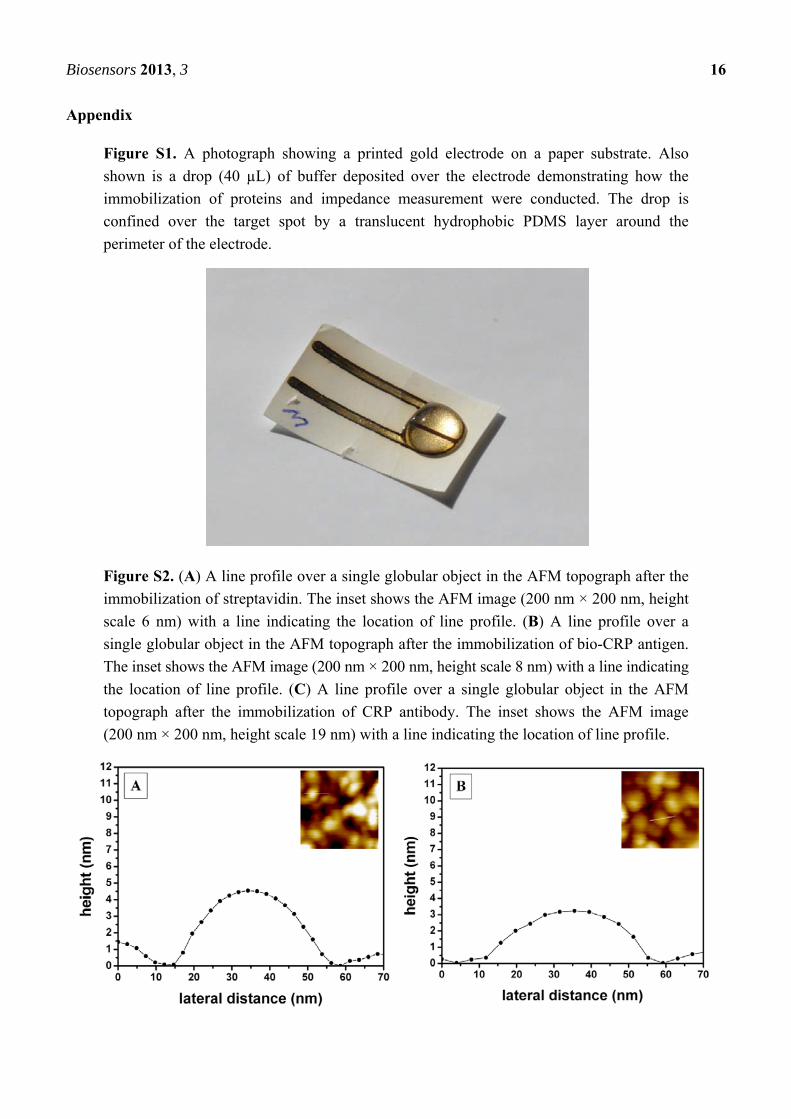
Figure S2. (A) A line profile over a single globular object in the AFM topograph after the
immobilization of streptavidin. The inset shows the AFM image (200 nm × 200 nm, height
scale 6 nm) with a line indicating the location of line profile. (B) A line profile over a
single globular object in the AFM topograph after the immobilization of bio-CRP antigen.
The inset shows the AFM image (200 nm × 200 nm, height scale 8 nm) with a line indicating
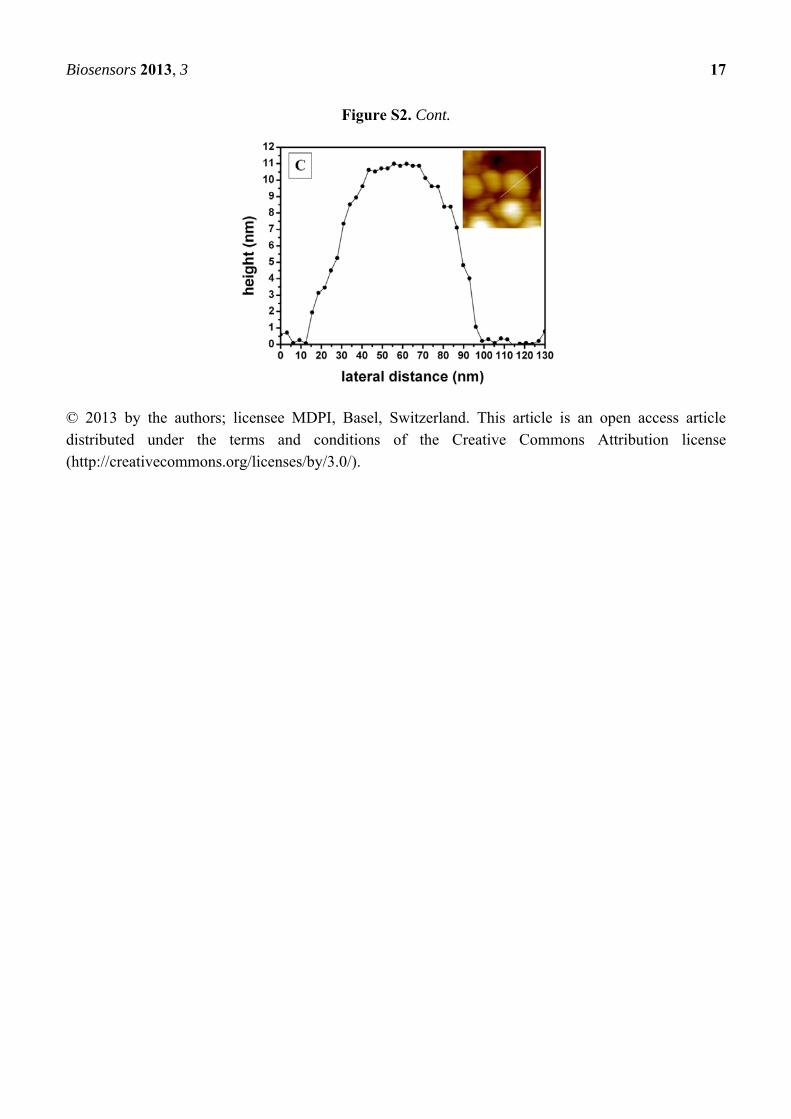
the location of line profile. (C) A line profile over a single globular object in the AFM
topograph after the immobilization of CRP antibody. The inset shows the AFM image
(200 nm × 200 nm, height scale 19 nm) with a line indicating the location of line profile.
Biosensors 2013, 3 17
Figure S2. Cont.
© 2013 by the authors; licensee MDPI, Basel, Switzerland. This article is an open access article distributed under the terms and conditions of the Creative Commons Attribution license (http://creativecommons.org/licenses/by/3.0/).