application of ozonated water technology … · application of ozonated water technology for...
TRANSCRIPT
APPLICATION OF OZONATED WATER TECHNOLOGY FOR IMPROVING QUALITY AND SAFETY OF PEELED SHRIMP MEAT
A Thesis
Submitted to the Graduate Faculty of the Louisiana State University and
Agricultural and Mechanical College in partial fulfillment of the
requirements for the degree of Master of Science
in
The Department of Food Science
by
Amrish Suresh Chawla Bachelor of Technology in Dairy Technology Gujarat Agricultural Univeristy, India, 2002
August 2006

ii
DEDICATION
To my parents Meena and Suresh Kumar Chawla and my sister Shuchi
Chawla for their love, support and encouragement.

iii
ACKNOWLEDGEMENTS
Most useful work is not accomplished by a single person or by chance.
Much effort and devotion from many people has been put into this research to
get it published. I would like to thank all those to whom I owe even a little
time, material and support from my heart.
First of all, I am deeply thankful to Dr. Jon W. Bell my major advisor,
for his support and encouragement during my Masters research. I thank you for
believing in me when I was struggling. I thank you for your patience, vision
and constructively critical eye. I appreciate your time, vast knowledge and
skills in different areas in the writing of this thesis. I would also like to thank
the other members of my committee Dr. Marlene E. Janes, Dr. Witoon
Prinyawiwatkul, and Dr. Zhimin Xu for teaching me so much and encouraging
me along the way
Most importantly, I would like to thank my friends who have stood by
me and have always encouraged me and guided me when I most needed their
support.
I would like thank God for giving me the inspiration and strength. Special
thanks, to my family members for always supporting me and encouraging me.
My appreciation extends to all the authors of references that provided
knowledge, critique, experiences and ides to help this research.
Acknowledgement is also made for the following:
1.) The National Fisheries Institute Scholarship Program and LA Sea Grant
College Program (NOAA Grant No. NA16RG2249) for project funding.

iv
2.) Air Liquide America, LLP, for use of Ozone Sanitation System, Model No.
Model AGW 1500 G.
3.) DelOzone Inc. for technical help with Ozone Sanitation System.
4.) Paul Piazza and Sons. Inc. New Orleans (LA).

v
TABLE OF CONTENTS
DEDICATION....................................................................................................ii
ACKNOWLEDGEMENTS...............................................................................iii
LIST OF TABLES............................................................................................vii
LIST OF FIGURES.........................................................................................viii
ABSTRACT........................................................................................................x
CHAPTER 1. INTRODUCTION..................................................................................1
2. LITERATURE REVIEW.......................................................................4 2.1. U.S. Shrimp Species…………………………..………………...4 2.2. Ozone……………………………...…...….…………...………..4 2.3. Ozone Generation………………..………………………….….13 2.4. Developing Technologies…...…………………………...….….17 2.5. Ozone vs. Chlorine……………..……………………………....17 2.6 Ozone Application in Foods…………………………....…….…18 2.7 Biogenic Amine Analysis…………………………...……….….21 2.8. Sensory Analysis..........................................................................25 2.9 Thiobarbituric Acid Reacting Substances (TBARS) Analysis.....26 2.10 Listeria. in Foods.........................................................................27 2.11 Summary of Ozone.....................................................................28
3. DEVELOPMENT OF A PROCESS TO MEASURE OZONE CONCENTRATIONS IN PROCESSING WATER AT THE POINT OF PRODUCT APPLICATION...........................................................30
3.1. Introduction.................................................................................30 3.2. Materials and Methods................................................................32 3.3. Results and Discussion................................................................35 3.4. Conclusion...................................................................................41
4. PROCESS OPTIMIZATION FOR APPLICATION OF OZONATED WATER IN SHRIMP PROCESSING..................................................43
4.1. Introduction.................................................................................43 4.2. Materials and Methods................................................................48 4.3. Results and Discussion................................................................54 4.4. Conclusion...................................................................................59
vi
5. EFFECTS OF OZONATED WATER TREATMENT ON QUALITY, SHELF LIFE AND SAFETY IN PEELED SHRIMP MEAT....................................................................................61
5.1. Introduction.................................................................................61 5.2. Materials and Methods................................................................63 5.3. Results and Discussion................................................................70 5.4. Conclusion...................................................................................76
REFERENCES..................................................................................................82
APPENDIX : SENSORY QUESTIONNAIRES..............................................93
VITA.................................................................................................................99

vii
LIST OF TABLES
2.1 Summary of the properties of ozone...........................................................29
3.1 Verification of dissolved ozone results from the flow-through sensor with chemical measurement methods..............................................................36
4.1 Means and standard deviations for proximate composition of
commercially peeled shrimp meat (pooled samples)..................................54 5.1 Means and standard deviations for proximate composition of
commercially peeled shrimp meat (pooled samples)..................................70

viii
LIST OF FIGURES
2.1 Oxidation reactions of compounds during ozonation of water...............5
2.2 Basic ozone generator...........................................................................14
2.3 Generation of histamine, putrescine, and cadaverine from their corresponding decarboxylated amino acids..........................................23
3.1 Dissolved ozone (dO3) measurement system using a flow cell
and dO3 sensor......................................................................................33 3.2 Single-pass design to produce ozonated water.....................................37
3.3 Ozone concentration and water temperature leaving single pass design............................................................................................37
3.4 Changes in free chlorine and iron content of ozone treated water........38
3.5 Recirculation design to produce water with increased ozone concentration.........................................................................................40
4.1 Flow diagram of peeled shrimp processing in Louisiana.....................45
4.2 Recirculation setup to produce ozonated water....................................49
4.3 Setup for flow-thru process using a flow cell and dissolved ozone (dO3) sensor...........................................................................................50
4.4 Matrix of concentration and contact times for application of dO3 using soak and spray application..........................................................51
4.5 Aerobic plate counts using soak application at different ozone
concentrations and contact times..........................................................55 4.6 Aerobic plate counts using spray application at different ozone
concentrations and contact times..........................................................56 4.7 Comparison of bacterial reduction (from control) between soak and
spray application at different ozone concentrations and contact times...................................................................................57
4.8 Comparison of Pseudomonas flourescens reduction (from control)
between soak and spray application at different ozone concentrations and contact times..........................................................58

ix
4.9 TBARS values for peeled shrimp soaked and sprayed with ozonated water at different ozone concentrations and contact times......................................................................................................59
5.1 Aerobic plate counts of peeled shrimp soaked in 3ppm ozonated
water for 60 seconds.............................................................................72 5.2 Biogenic amine production in peeled shrimp soaked in 3 ppm
ozonated water for 60 seconds..............................................................72 5.3 TBARS Values of Shrimp Soaked in 3ppm Ozonated Water
for 60 seconds.......................................................................................74 5.4 Shrimp inoculated with Listeria monocytogenes strains soaked
in 3 ppm ozonated water for 60 seconds...............................................77 5.5 Percentage sensory scores of shrimp odor soaked in 3ppm
ozonated water for 60 seconds..............................................................78 5.6 Percentage sensory scores of shrimp appreance soaked in 3ppm
ozonated water for 60 seconds..............................................................79 5.7 Gas Chromatograph of PFP derivatives of untreated day 15
shrimp extract on DB-210 column........................................................80 5.8 Gas Chromatograph of PFP derivatives of untreated day 15
shrimp extract on HP-225 column........................................................81
x
ABSTRACT
Ozone is an effective sanitizing agent against a broad spectrum of
pathogenic and spoilage organisms. Optimization of treatment applications of
ozonated water is needed for increased use in the food industry.
An experimental apparatus and process has been developed to digitally
measure ozone concentrations in processing water at the point of product
application. Two application methods were evaluated. Ozone concentrations
were measured rapidly at the point of product application. Shrimp samples
were either sprayed or soaked for 20, 40 or 60 seconds with similar volumes of
water with dissolved ozone levels of 1, 2, or 3 ppm. Microbial destruction
using aerobic plate counts (APC), and lipid oxidation using the TBARS test,
was measured to determine an optimal treatment.
Lowering the water temperature to 10ºC facilitated the production of
elevated levels of dissolved ozone (dO3), whereas high chlorine levels reduced
dO3. The soaking treatment resulted in greater bacterial reduction than the
spray treatment of peeled shrimp, and application time had little effect at low
concentrations of dO3.
Well handled shrimp samples were then treated within 24 h of harvest
using the optimal treatment of soaking in 3 ppm for 60 s. Peeled shrimp were
sampled at two day intervals to evaluate APC and rancidity and at 3 day
intervals for bioamines (putrescine and cadaverine) using gas chromatography
(GC). Sensory quality changes were evaluated using consumer sensory testing.
A Listeria monocytogenes inoculation study was also conducted.
xi
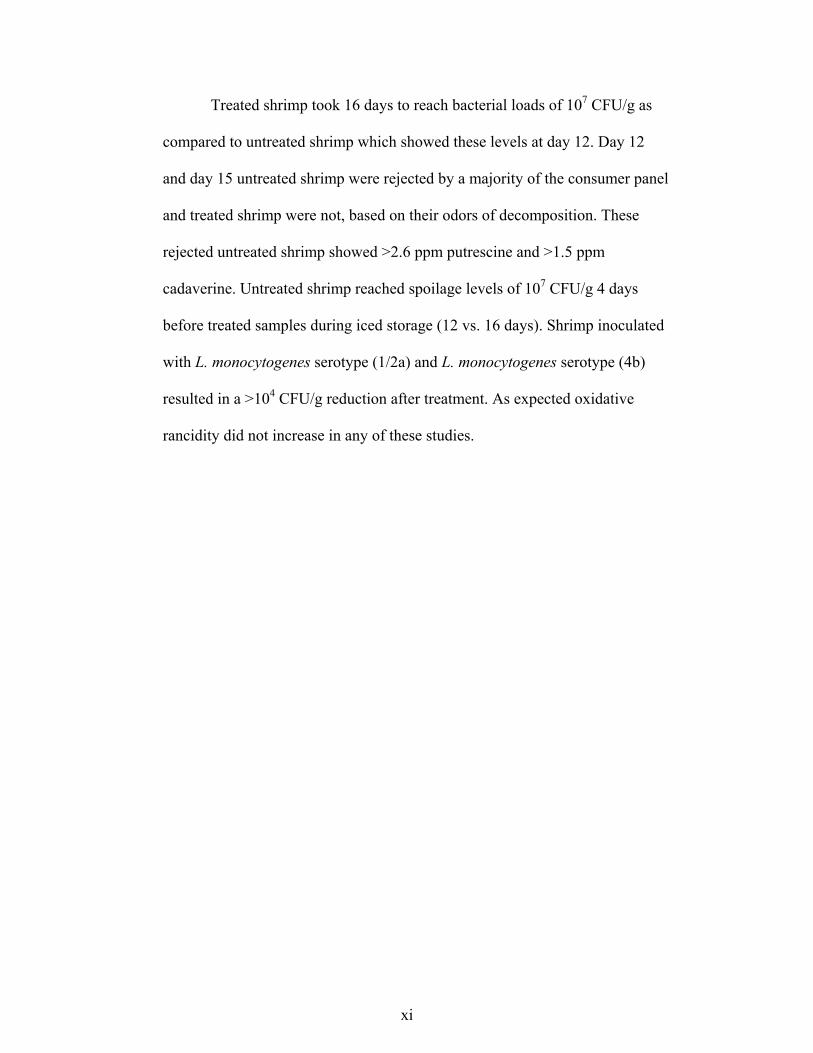
Treated shrimp took 16 days to reach bacterial loads of 107 CFU/g as
compared to untreated shrimp which showed these levels at day 12. Day 12
and day 15 untreated shrimp were rejected by a majority of the consumer panel
and treated shrimp were not, based on their odors of decomposition. These
rejected untreated shrimp showed >2.6 ppm putrescine and >1.5 ppm
cadaverine. Untreated shrimp reached spoilage levels of 107 CFU/g 4 days
before treated samples during iced storage (12 vs. 16 days). Shrimp inoculated
with L. monocytogenes serotype (1/2a) and L. monocytogenes serotype (4b)
resulted in a >104 CFU/g reduction after treatment. As expected oxidative
rancidity did not increase in any of these studies.
1
1. INTRODUCTION
Shrimp has surpassed canned tuna as the most popular seafood
consumed in the U.S.: however, most of this shrimp is imported. The state of
Louisiana leads the nation in shrimp production at over 210 million pounds a
year, and is the second highest producing state of finfish at 1.3 billion pounds
annually (NMFS, 2006). High product quality is a critical priority for seafood
processors. Improvements in product quality, safety, and shelf life result in
increased product reception and consumption, decreased discards and loss, and
protection from regulatory actions. Shrimp is the most economically valuable
fishery in Louisiana, and mechanically peeled and frozen shrimp accounts for
the major product form processed in the state and the Gulf of Mexico region
(Schwab, personal communication, 2005). However the viability of the
domestic shrimp industry is under constant economic pressure from the high
volumes of hand peeled and low cost imported shrimp (Anon, 2004)
Improved product quality is necessary for the domestic industry to
compete with the imported product and support national shrimp industry
marketing initiatives (DeSantis, 2003). The wild shrimp industry is also under
constant threat from aquacultured shrimp as it is of a high quality and readily
available. The high volumes of shrimp landings in the Gulf of Mexico waters
has resulted in the development of high volume mechanical peeling operators.
Due to the variable pre and post harvest conditions of the wild shrimp
fisheries, wild shrimp can develop increased levels of spoilage bacteria. Using
ozonated water in the peeling operations presents an opportunity to reduce

2
bacterial levels and improve the quality and shelf life of peeled shrimp. This
high quality shrimp will present the shrimp industry better chances to compete
with the low cost imports.
Ozone is a USFDA and USDA approved antibacterial agent that can be
applied to food products (FDA, 1982; USDA, 1997). Ozone has seen use in the
food processing industry as gaseous ozone and dissolved in water as ozonated
water. Both have been used as a bactericide on a wide range of food products
including meat, poultry, eggs, raw fruits and vegetables, seafood and fruit
juices, as well as sanitation of product contact surfaces (Guzel-Seydim et al.,
2003; Anon, 2005). Ozone has many advantages as a sanitizer. Gaseous ozone
and ozonated water can be generated on site, at the facility of use. Chemical
reaction of ozone with organic material occurs at very rapid rates and short
reaction times, which effectively prevents microorganisms from developing
tolerance to ozone (Kim, 1998). Many studies have reported the advantages
and superior bactericidal properties of ozone as compared to chlorine (Green et
al., 1993; Kim and Yousef, 1999; Klaiber et al., 2004). Ozone has a short half
life at ambient temperature and does not leave behind residues unlike other
commonly used sanitizers. Ozone is effective against a wide range of bacteria,
viruses, yeast, molds and protozoa(Anon, 2005; Guzel-Seydim et al., 2003).
The effectiveness and susceptibility of microorganisms to dO3 depends upon
the water temperature and pH, and the presence of dissolved compounds (salt,
sugar, minerals and surfactants) and suspended organic matter (Kim and
Yousef, 1999).

3
Despite these advantages, the use of ozonated water technology has not
been widely adopted in the seafood industry. Recent studies of ozonated water
on salmon fillets and roe found increased oxidation during frozen storage of
these high lipid products (Carpo et al., 2004). In addition to incurred capital
and operational costs, seafood processors have received limited understanding
of dO3 solubility, including the effects of temperature and water quality. These
inputs and off-gassing often result in the incorrect measurement and
knowledge of actual ozone concentrations at the point of product application
(Chawla et al., 2006a). Optimized ozonated water time-concentration
treatments have shown significant reduction in aerobic and spoilage bacterial
(Chawla et al., 2006b).
These results suggest that ozonated water technology can be
successfully used as a germicidal agent in seafood processing to extend the
shelf life and quality of wild shrimp in a time when efforts are been made to
eliminate the use of commonly used chlorine due to its ability to form potential
carcinogens on reacting with organic matter (Graham, 1997; Anon, 2005)

4
2. LITERATURE REVIEW
2.1. U.S. Shrimp Species
U.S. shrimp landings consist of cold and warm-water shrimp (Haby et
al., 2002). Due to variation in the water quality of costal bays and estuaries that
are home to juvenile shrimp a wide variation is seen in the domestic landings
(DeSantis, 2003). Cold-water shrimp are landed primarily off the northwest
and northeast coasts of the U.S. and usually account for less than 20% of the
total annual landings of all shrimp in the U.S. However, the majority of
domestic landings are warm-water shrimp, which are landed primarily in the
Gulf of Mexico and South Atlantic (GSA) region(Haby etal., 2002). The
primary species landed in the GSA region include pink shrimp
(Farfantepenaeus duorarum), white shrimp (Litopenaeus setiferus), and brown
shrimp (F. aztecus). Smaller quantities of other species are landed, including
rock shrimp (Sicyonia brevirostris), royal reds (Pleoticus robustus), and
seabobs (Xiphopeneus kroyeri).The warm-water shrimp harvesting industry in
the (GSA) region represents the most economically important component of all
of the domestic commercial seafood harvesting sectors in the United States.
The shrimp industry contributes to local coastal economies on several levels.
Shrimp are offloaded by shore-side handling facilities, which then set in
motion a myriad of economic activities associated with processing, packing,
wholesale distribution and consumer expenditures.
2.2. Ozone
Ozone (O3) is an unstable form of elemental oxygen (O2) and was
discovered in 1839 by a European researcher C.F. Schonbein (Guzel Seydim et

5
al., 2003). It derives its name from the Greek words oxus (acid) and gennan
(generate).Ultra Violet (UV) radiation emitted by the sun having wavelengths
less than 240 nm reacts with molecular ozone in the stratosphere and produces
ozone. It is also formed by the lightening discharge during a thunderstorm, and
is the clean smell attributed to air. It is also produced on the troposphere as an
irritant from the internal combustion engines, where nitrous oxide produced
from combustion of fossil fuels combines with oxygen and produces ozone.
2.2.a. Reaction Mechanism
Ozone has been shown to decompose in water and produce hydroxyl
free radicals (Hoigné and Bader, 1983a, 1983b; Glaze et al., 1987). As shown
in Figure 1.2, ozone can oxidize compounds by the following two methods in
aqueous solutions: direct reaction with molecular ozone or reaction with
hydroxyl free radicals produced during ozone decomposition (Hoigné and
Bader, 1977).
Figure 2.1. Oxidation Reactions of Compounds during Ozonation of Water (Source EPA Guidance Manual, 1999)
Both of these oxidation pathways are inherently different and compete
with each other for the oxidation of the substrate. Aqueous ozone occurs in a
higher concentration than hydroxyl free radicals, under normal conditions of

6
oxidation. However, direct oxidation with aqueous ozone is slow compared to
oxidation with hydroxyl free radicals, which have a faster reaction rate. Direct
oxidation with ozone is important under acidic conditions; oxidation is caused
by hydroxyl free radicals under conditions of high pH, presence of UV
radiation or hydrogen peroxide addition (Hoigné and Bader, 1977). This latter
mechanism is used in advanced oxidation processes such as peroxone, to
increase the oxidation rates of substrates. The spontaneous decomposition of
ozone occurs through a series of steps. The exact mechanism and reactions
associated have not been established, but mechanistic models have been
proposed (Hoigné and Bader, 1983a, 1983b; Glaze, 1987).
Ozone decomposition in water proceeds in a step wise manner
producing the hydroperoxyl (•OH2), hydroxyl (•OH) and superoxide(•O⎯)
radicals (Adler and Hill, 1984; Grimes et al., 1983; Hoigne and Bader, 1975).
It is believed that hydroxyl radicals form as one of the intermediate products,
and can directly react with compounds in the water. The decomposition of
ozone in pure water proceeds with hydroxyl free radicals produced as an
intermediate product of ozone decomposition, resulting in the net production of
1.5 mole hydroxyl free radicals per mole ozone. Ozone forms hydroxyl
radicals and reacts with many compounds naturally occurring in water such as
natural organic matter, organic oxidation by-products, synthetic organic
compounds bicarbonates and carbonate ions. Bicarbonate or carbonate ions,
commonly measured as alkalinity, will scavenge the hydroxyl radicals and
form carbonate radicals (Staehelin et al., 1984; Glaze and Kang, 1988). The
dissociation rate constants of many of these compounds are high, and hence
7
they will react with the hydroxyl radicals before interacting with dispersed
particles such as microorganisms. This stepwise breakdown reaction of ozone
is extremely rapid, leading to the suggestion that the antimicrobial effect of
ozone is only a surface phenomenon (Hoigne and Bader, 1975).
2.2.b. Ozone Measurement
Many methods are available to measure ozone in both gaseous and
aqueous forms. These methods can be classified as physical, chemical, and
physiochemical. The physical methods measure responses such as adsorption
of radiation in the visible, UV or infrared (IR) regions. Adsorption spectra at
552 nm measures reactions with chemical agents such as Bis-
TerpyridineIron(II) in dilute hydrochloric acid solution (Tomiyasu and
Gordon, 1984). Spectrophotometric measurement of ozone bleaching of acid
chrome violet K (ACVK) can also be used (Masschelein, 1977). Chemical
methods measure formation of reaction products when ozone reacts with
chemical reagents such as potassium iodide (KI) or hydrogen iodide (HI). The
physiochemical methods measure the physical effects of ozone reaction with
different reagents such as chemiluminescence and the heat of reaction.
The two most commonly used methods for ozone measurement are UV
adsorption and Indigo colorimetry.
Gaseous ozone absorbs light in the short UV wavelength region with a
maximum absorbance at 253.7 nm (Gordon et al., 1992). In general, the
instrument measures the amount of light absorbed when no ozone is present
and the amount of light absorbed when ozone is present. The meter output is
the difference of the two readings, which is directly related to the actual
8
amount of ozone present. The International Ozone Association (IOA) has
accepted this procedure (IOA, 1989).
The indigo colorimetric method developed by Bader and Hogine (1981)
is the standard method for measuring ozone concentrations in researches with
ozone. The indigo colorimetric method is sensitive, precise, fast, and more
selective for ozone than other methods. Ozone binds across the carbon-carbon
double bond of a sulphonated indigo dye and decolorizes it. There are two
indigo colorimetric methods: spectrophotometric and visual. For the
spectrophotometric procedure the lower limit of detection is 2 mg/L, while for
the visual procedure the detection limit is 10 mg/L. Hydrogen peroxide,
chlorine, manganese ions, ozone decomposition products, and the products of
organic ozonation exhibit less interference with the indigo colorimetric method
than any of the other methods (Langlais et al., 1991).
2.2.c. Antimicrobial Effect of Ozone
Ozone is a potent oxidizing agent that can be used for disinfection in
the food industry (Rice, 1996). Low concentrations of ozone and shorter
contact times are necessary compared to other weaker oxidizers such as
chlorine, mono-chloramine and chlorine dioxide (DeMers and Renner, 1992).
Since ozone is highly unstable, it does not maintain a high residual level and
can be only used as a primary disinfectant (Bader and Hoigen, 1981). This
often requires the use of other disinfectants like UV radiation, pulsed electric
fields or other chemical agents like chlorine, chloramines or chlorine dioxide
in combination with ozone to attain sufficient levels of disinfection in food
products (Kim and Yousef, 1999) A comprehensive review published in 2001

9
has shown the effectiveness of ozone as a germicidal agent against a wide
range of pathogenic organisms like bacteria, virus’s protozoa, fungal and
bacterial spores (Kim and Yousef, 1999). According to one study, the
disinfection efficiency of ozone is not affected by pH. However, as the rate of
decay of the hydroxyl free radicals is faster at higher pH, more ozone is needed
to maintain concentration (Morris, 1975). Ozone decomposition is a complex
function of pH, temperature, concentration of inorganic and organic matter and
humidity (Hoigne and Bader, 1975, 1976)
pH has little effect on the ability of dO3 residuals to inactivate acid fast
bacteria such as Actinomycetes and Mycobacterium (Farooq et al., 1976). The
virucidal efficacy of ozone decreased only slightly in one study as pH was
lowered (Roy, 1979). Several different types of oxidants are formed by the
decomposition of ozone at high pH and they have different reactivities
(Langlais et al., 1991) These secondary oxidants like hydroperoxyl (•OH2),
hydroxyl (•OH) and superoxide (•O⎯) radicals, with their different reaction
rates are responsible for changes in the disinfection efficacy of ozone. The
degree of microbial inactivation remained unchanged when inactivation studies
were carried out at a constant residual ozone concentration and different pH
(5.7–10.1) (Farooq, 1977). Studies conducted with poliovirus 1 and with
rotaviruses SA-11 and Wa have shown decreased virus inactivation by ozone
at alkaline pH (Harakeh and Butler, 1984; Vaughn et al, 1987). Ozone resulted
in increased inactivation of Giardia muris cysts when the pH was increased
from 7-9 (Wickramanayake, 1984a). It is believed that changes in cyst
chemistry facilitated ozone interaction with cyst constituents at higher pH

10
values. However, inactivation of Naegleria gruberi cyst in the same study
showed slower inactivation at pH 9 than at low pH levels, indicating that
inactivation at different pH levels are organism specific.
The solubility of dO3 and its stability decreases as water temperature
increases (Katzenelson, 1974).However, an increase in temperature does not
affect the chemical oxidation and disinfection rates of ozone. While ozone
decomposition increases and its solubility are significantly reduced when water
temperature is raised from 0 to 30ºC, there is virtually no effect on rates of
bacterial disinfection (Kinman, 1975). Ozonated water treatment of
contaminated apples showed no significant reduction in surface E. coli counts
at 4ºC, 22ºC and 40ºC, although the highest concentration of ozone was
recorded at 4ºC (Achen and Yousef, 2001).
Ozone treatments of river waters heavily polluted with organic matter
were investigated. Bacterial levels in such waters were found to increase. It is
suggested that ozonation of organic material in river waters produced small
organic fragments that were readily metabolized by microorganisms (Troyan
and Hanson, 1989). Food systems are rich in organic matter which will
compete with microorganisms for ozone demand, and thus reduce its
disinfection efficiency. The addition of 20ppm soluble starch did not
significantly affect the destruction of gram positive organisms (including L.
monocytogenes, S. aureus) and gram negative organisms(including E. coli and
Salmonella.). However a significant reduction in the bacteria was found in the
presence of 20 ppm bovine serum albumin (Restanio et al., 1995). Residual
levels of ozone in water containing bovine serum albumin were lower than
11
those in water with soluble starch and deionized water. Pure cell suspensions
of P. fluorescens, E. coli O157:H7, L. mesentroids, and L. monocytogenes
showed a 102 to 103 log reduction when subjected to 1 ppm of ozone gas for
less than 10s(Kim, 1998).
Dehydrated cells resulting from low relative humidity (RH) showed
increased resistance to gaseous ozone (Guerin, 1963). Studies conducted with
low ozone levels at variable RH levels have found that at an RH level of 45%,
ozone showed no germicidal potential (Elford and Eude, 1942). Low ozone
concentrations (0.1mg/l), when used at high humidity levels, resulted in
substantial bacterial reductions (Ewell, 1946). Kim and Yousef (1999) found
that 200 ppm ozone produced no effect on the microbial load at aw of 0.85
while upto 105 CFU/g were observed at aw of 0.95.
All bacteria are not present on the surface of foods or in free
suspensions in food systems. Association of bacteria with suspended particles
or sub cellular components may reduce the effectiveness of the ozone
treatment applied to the food product. Studies conducted by Langlais et al.
(1978) indicated that it is necessary to consider criteria such as degree of
agitation and mass transfer to establish the efficacy of ozone as a disinfectant.
The antimicrobial effect of ozone was increased substantially upon application
of sonication to break down clumps of microorganisms (Berg et al., 1964).
However, such an effect was not found in the treatment of fresh lettuce with
ozone by Kim and Yousef (1999).

12
2.2.d. Mechanism of Action
Oxidation reactions are responsible for inactivation of bacteria treated
with ozone (Bringmann, 1954; Chang, 1971). The first point of contact
between ozone and bacteria is the bacterial cell membrane, via oxidation of
amino acids like tryptophan, or by oxidation of cell wall glycoproteins and
glycolipids (Scott and Lesher, 1963; Goldstein and Mcdonagh, 1975). Dave
(1999) found that ozone disrupted the cell walls of Salmonella enteritidis.
Ozone may also disrupt the normal functioning of the cell by reacting with the
slufhydryl groups of enzymes important to the cell metabolism, particularly the
cystein residues (Ingram and Haines, 1949; Chang, 1971). Ozone has been
found to interact with both the purine and pyrimidine bases of nucleic acids
and modify them with thymine being more sensitive than uracil or cytosine
(Giese and Christensen, 1954; Scott and Lesher, 1963; Ishizaki et al, 1981).
More recent work has shown that ozone treatment does not destroy spores by
causing DNA damage, but affects spore germination by damaging the inner
membrane of the spore coat (Young, 2000). Ozone is shown to have produced
single and double-strand breaks in plasmid DNA and to open up circular
plasmid DNA (Hamelin, 1985). Ozone treatment also decreased transcription
activity of plasmid DNA (Mura and Chung, 1990). Ozone has also been shown
to cause mutation in E. coli., however ozone was considered to be a weak
mutagen (Dubeau and Chung, 1982). Ozone has been shown to interact and
modify proteins in the virus capsid, which are used by the virus to attach to the
cell surface (Cronholm et al., 1976; Riesser, 1976). Kim et al. (1980) studied
the inactivation of bacteriophage f2 upon reaction with ozone, and suggested

13
that ozone damaged the phage. This damage resulted in the release of
ribonucleic acid (RNA) and disrupted adsorption to the host pili. Ribonucleic
acid not protected by the phage coat is further sucesseptible to oxidation by
ozone. A similar mode of action was proposed for phage inactivation and
release of deoxyribonucleic acid (DNA) in studies conducted on bacteriophage
T4 (Sproul and Kim, 1982). Studies conducted with the tobacco mosaic virus
(TMV) have shown that ozone attacks both the capsid and RNA. Damaged
RNA forms cross links with the capsid subunits to cause a loss of the viruses
infectivity (Yoshizaki et al., 1988). It was suggested that ozone causes partial
destruction or complete removal of plugs in Naegleria gruberi cysts (Langlais
and Perrine, 1984). Ozone may increase the permeability of Giardia muris
cysts and subsequently damage the plasma membranes and eventually the
other cellular components (Wickramanayake, 1984c)
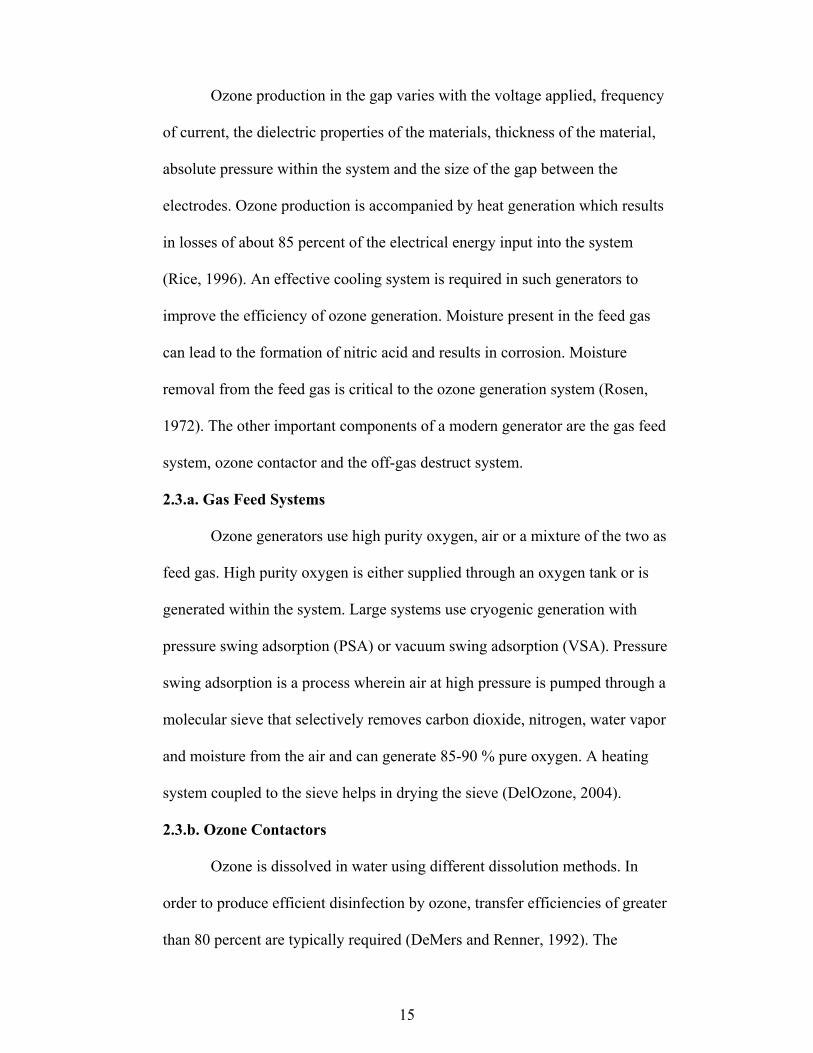
2.3. Ozone Generation
High transmission UV lamps emitting radiation at wavelengths of 185
nm produce low concentrations (0.03 ppm) of ozone (Ewell, 1946). Ozone is
generally formed by combining an oxygen atom with an oxygen molecule.
This reaction is endothermic and requires a considerable input of energy.
3O2 + energy 2O3 + heat
Ozone is very unstable and decomposes quickly to elemental oxygen (Horvath
et al, 1985). Due to its unstable nature, ozone is commonly produced at the
point of application. Synthetic ozone was first produced by Schönbein by
electrolyising sulphuric acid (Langlais et al., 1991). However, the corona
discharge method is the most popular method for generating ozone. Several

14
Oxygen Concentrator
C D o i r s o c n h a a r g e
Water Pump
Air in
Air Compressor
99 % O2
M C i h x a i m n b g e r
Off-gas Ozone Heat Destruct
Ozonated Water Out
Nozzle Injector
Ozone
commercial ozone generators are currently available that produce both gaseous
and ozone dissolved in water. Ozone can also be generated by chemical,
thermonuclear and electrolytic reactions (Rice 1996; Hovarth et al., 1985).
In many ways the corona discharge method replicates the action of
lightening in a thunderstorm in a closed system. Dry air or pure oxygen gas is
passed through a small gap between two dielectric electrodes. These electrodes
can be either concentric circles or parallel plates. When an electric potential is
applied across the electrodes, electrons flow through the narrow gap and
transfer their energy to the oxygen atoms to facilitate ozone formation, as
shown in Figure 1.2.
Figure 2.2 Basic Ozone Generator
15
Ozone production in the gap varies with the voltage applied, frequency
of current, the dielectric properties of the materials, thickness of the material,
absolute pressure within the system and the size of the gap between the
electrodes. Ozone production is accompanied by heat generation which results
in losses of about 85 percent of the electrical energy input into the system
(Rice, 1996). An effective cooling system is required in such generators to
improve the efficiency of ozone generation. Moisture present in the feed gas
can lead to the formation of nitric acid and results in corrosion. Moisture
removal from the feed gas is critical to the ozone generation system (Rosen,
1972). The other important components of a modern generator are the gas feed
system, ozone contactor and the off-gas destruct system.
2.3.a. Gas Feed Systems
Ozone generators use high purity oxygen, air or a mixture of the two as
feed gas. High purity oxygen is either supplied through an oxygen tank or is
generated within the system. Large systems use cryogenic generation with
pressure swing adsorption (PSA) or vacuum swing adsorption (VSA). Pressure
swing adsorption is a process wherein air at high pressure is pumped through a
molecular sieve that selectively removes carbon dioxide, nitrogen, water vapor
and moisture from the air and can generate 85-90 % pure oxygen. A heating
system coupled to the sieve helps in drying the sieve (DelOzone, 2004).
2.3.b. Ozone Contactors
Ozone is dissolved in water using different dissolution methods. In
order to produce efficient disinfection by ozone, transfer efficiencies of greater
than 80 percent are typically required (DeMers and Renner, 1992). The
16
common ozone dissolution methods include; injectors, bubble diffuser
contactors and turbine mixers.
2.3.c. Injector Dissolution
Injector dissolution is commonly used in Europe, Canada and the
United States. It involves dissolution of ozone in water under a vacuum that is
produced in the system by a venturi section along with a high pressure
recirculating water pump. The resulting turbulence enhances ozone dissolution.
2.3.c.i. Bubble Diffuser Contactors
Bubble diffuser contactors are one of the most common ozone
dissolution methods used world wide (Langlais et al., 1991). It offers the
advantages of no moving parts, high ozone transfer rates, operational
simplicity, process flexibility and no additional input energy. However this
method requires the use of large mixing containers and wear and tear of
gaskets in the system.
2.3.c.ii.Turbine Mixers
These systems used either a submerged turbine and motor or a turbine
with external motor for dissolving ozone gas into water. Ozone transfer is
enhanced due to high turbulence resulting in small bubble size (Langlais et al.,
1991).
2.3.d. Off Gas Destruct Unit
Ozone that does not dissolve in water is released as off-gas and is toxic.
This excess ozone is destroyed by directing it through an ozone destruct unit.
These destruct units can be thermal which heats the gas above 350°C, catalytic
which operate at 100°C and prevents moisture buildup, or a combination of the

17
two. The off-gas destruct unit is designed to reduce the concentration to 0.1
ppm of ozone by volume, the current limit set by OSHA for worker exposure
in an eight hour shift.
2.4. Developing Technologies
Ozone is used in combination with freezing to decrease the amount of
antimicrobial agent used and increase microbial inactivation(Giacobbe and
Yuan, 2005; Take and Skhirtladze, 2006). Yuan and Steiner (2005) have
developed a novel way to sanitize and cool food products using ozone and
nitrogen. Ozone has been used in combination with microwaves for the
destruction of prions (Klaptchuk, 2005). In order to achieve higher disinfection
rates, a food sanitation tunnel system has been developed that uses gaseous
ozone in combination with UV radiation, hydro peroxides and super oxides
(Fink et al., 2004). Ozone has been combined with a surfactant to improve
contact with the surface being sanitized (Smith et al., 2002). Ozone has
produce similar reductions of human rotavirus (8-9 log CFU/g) as other non-
thermal processing techniques like high pressure processing (HPP) and pulsed
electric fields(PEF) (Khadre and Yousef, 2002). Increased disinfection
efficiencies to reduce microbial loads, were reported when ozone was
mechanically mixed with hydrogen peroxide (H2O2), chlorine dioxide (CLO2)
and chlorite ions (CLO2 ⎯ ⎯) (Son et al., 2005).
2.5. Ozone vs Chlorine
Widespread use of chlorine as a sanitizer is being reconsidered because
chlorine reacts with natural organic matter (NOM) and bromine to form total
halo methanes (THM) and brominated THM (Sorlini and Collivignarelli,

18
2005). These residual compounds are potential carcinogens. Microorganisms
are known to develop resistance to chlorine (Clark, 2003; Guzel-Seydim et al.,
2003). Ozone and chloramines are being used for water treatment to reduce the
formation of undesirable chloral hydrates, THM and haloaceticacids (Guay et
al., 2005; Janda et al., 2004).
2.6. Ozone Application in Foods
2.6.a. Fruits and Vegetables
Achen et al. (2001) found that bubbling of ozone was more effective in
reducing counts of Escherichia coli O157:H7 innoculated on whole apples.
Koseki and Isobe (2006) have shown that ozone can be effectively used in
washing iceberg lettuce to produce greater kills in bacterial levels. Ozone has
been suggested as an alternative to traditional chlorine in processing fresh cut
lettuce without adversely affecting the sensory quality and antioxidant levels
(Beltran, 2005a). A shelf life study conducted by Zhang et al. (2005) showed
that treatment with low concentrations of ozonated water at 0.08 ppm
decreased bacterial loads in fresh cut celery and improved sensory scores over
the period of the study. Ozone has been suggested as an alternative to thermal
pasteurization in the processing of apple cider and orange juice to produce
reductions to the order of 105 in Escherichia coli O157:H7 and Salmonella
populations (Williams et al., 2005; Steenstrup and Floros, 2004). Ozone was
found to effectively reduce the inoculated populations of Listeria
monocytogenes NCTC 7973 and Escherichia coli P36 in watercress, spinach,
coriander, lettuce and celery seeds (Warriner et al., 2005). Ozone treatment
was shown to produce a 3.3 log reduction in fresh cut potato strips that were

19
vacuum packaged (Beltran, 2005b). A comparative study to determine
inactivation of Escherichia coli O157:H7 and Listeria monocytogenes in fresh
produce using ozone, chlorine dioxide, chlorinated trisodium phosphate (CTP)
and peroxyacetic acid; found 3ppm ozone treatment for 15 s to be most
effective against the pathogens (Rodgers, 2004). Ozone was found to be less
effective as a sanitizer in reducing microbial loads as compared to washing
fresh uncut carrots with chlorine (Klaiber et al., 2004). Enterobacteriaceae
species showed higher reduction as compared to mesophiles and Pseudomonas
upon washing lettuce head and shredded lettuce with ozonated water (Baur et
al., 2004).
2.6.b. Meat and meat products
A study on beef that was heated showed decreased resistance of
vegetative cells and spores of C. perfringens to ozone treatment (Novak and
Yuan, 2004). Novak and Yuan (2003) indicated that microorganisms surviving
ozone treatment where less likely to endanger food safety as compared to the
organisms surviving sublethal heat treatments.
2.6.c. Poultry
Raw shell eggs when exposed to UV radiation followed by ozone
treatment produced > 4.6 log reduction in Salmonella enteritidis populations
(Rodriquez, 2005). Chicken skin inoculated with Salmonella infantis and P.
aeruginosa. showed reductions in initial counts when treated to greater than
2000 ppm gaseous ozone but the indigenous coliforms were not affected by the
treatment (Al-Haddad et al., 2005). Koidis et al. (2000) suggested the use of

20
ozonated water treatment to reduce populations of Salmonella enteritidis on
egg shell surfaces.
2.6.d. Cereal and Grains
Kottapalli et al., (2005) indicated significant reduction in Fusarium
survival rates upon treatment with gaseous ozone. An inoculated study of
alfalfa seeds with Salmonella serotypes found that ozone alone was not
sufficient to reduce bacterial levels and suggested use of a secondary sanitizer
following ozone treatment (Rajowski and Rice, 2004). Another study that used
continuous sparging of alfalfa sprouts with ozonated water found significant
reduction in natural microflora and L.monocytogenes (Wade et al., 2003).
Sharma et al (2002) showed that significant reduction of Escherichia coli
O157:H7 in alfalfa sprouts was obtained by increasing the ozone
concentrations longer contact times did not significantly change bacterial
destruction. Significant reduction in pesticide residues in wheat was achieved
upon treatment with ozone (Zhanggui et al., 2003). Ozone has been shown to
be an effective and permanent method in reducing aflatoxin AFB1, and the
mutagenic potential of AFB1-contaminated corn (Prudente et al., 2002).
2.6.e. Seafood
Crapo et al. (2004) in their studies with Alaska salmon fish fillets and
roe found chlorine to be more effective for controlling bacteria as compared to
ozone, however ozone was more effective as a sanitizing agent for fish
processing surfaces. Intermittent washing and pumping of fish from ship holds
using ozonated water was shown to extend refrigerated shelf life (Koetters et
21
al., 1997). Treating fresh scad with gaseous ozone showed reduced bacterial
levels and improved sensory scores (Silva et al., 1998).
2.6.f. Dairy
Serra et al. (2003) found that ozone was effective in reducing aerial
fungal loads in cheese ripening rooms but not on the cheese surface.
2.7. Biogenic Amine Analysis
2.7.a. Background:
The Food and Drug Administration (FDA) Defect Action Level
Handbook, describes decomposition as the bacterial breakdown of the normal
product tissues and the subsequent enzyme induced chemical changes. These
changes are manifested by abnormal odors, taste, texture, color, etc. (FDA,
1998). Such changes in the chemical and sensory attributes of the product can
be used as quality indicators for commerce and regulation.
Proper handling and storage throughout handling and distribution is
required to maintain the quality and safety of shrimp, a highly perishable
muscle protein product. The quality preservation of shrimp is primarily carried
out by temperature control by refrigeration or freezing on ice. The type of
bacteria that multiply and produce enzymes that degrade shrimp, have been
shown to differ as a function of storage and temperature (Benner et al., 2003).
Spoilage of meats and seafood stored at low temperature is usually
accompanied by production of off-flavor compounds such as ammonia and
amines. These chemicals can be used as quantitative indicators to evaluate the
quality of meats and seafood. The microbial flora, their quantity and storage
temperature play a significant role in determining the quantity of these

22
decomposition metabolites. Determining the relative quantities of these
breakdown products can give an estimation of degree of spoilage of the meat
or seafood product. These compounds may also be used in commerce and
regulation to grade and reject the product (Rawles et al., 1996).
Historically, indole concentrations above 25ug/100g has been used to
confirm decomposition in shrimp (FDA, 1996). However, indole is produced
when shrimp decomposes at high temperatures and may not be produced in
shrimp stored at low temperatures. Lower levels of indole alone did not
ascertain that the shrimp are acceptable. Although indole is a good chemical
indicator of decomposition at higher temperatures, deterioration at low
temperatures may result in shrimp with less than 25ug/100g of indole that fails
sensory examination and is clearly decomposed. The difference in spoilage
pathways due to thermal exposure presents the need to investigate alternative
chemical indicators for shrimp decomposition. Diamines, putrescine and
cadaverine, formed in shrimp under conditions of both high and low
temperature spoilage have been studied as spoilage indicators. Studies using a
modified method of extraction and column conditions for shrimp, have shown
that canned and raw shrimp failing sensory evaluation contained greater than
4.8 ppm putrescine and greater than 1.3 ppm cadaverine (Rogers et al., 2003).
2.7.b. Bioamine Production
Different biogenic amines, as shown in Figure 1.3, are typically
produced by the decarboxylation of amino acids (Rice, 1976). The
decarboxylation reactions can proceed through endogenous(naturally
occurring) or exogenous(microbial enzymes) pathways (Rawles et al., 1996).

23
However, research has shown that the main source of bioamines is through
microbial decomposition (Wendakkoon et al., 1992).
Figure 2.3. Generation of histamine, putrescine, and cadaverine from their corresponding decarboxylated amino acids.
The term biogenic amines refers to the nonvolatile amines such as
cadaverine, putrescine, spermidine, spermine, tyramine, tryptamine, and
histamine produced post mortem in fish and shellfish products facilitated by
growth of bacteria in fish (Maga, 1978; Coutts et al, 1986; Yen et al.,1991;
Rawles et al., 1996). Biogenic amines are low molecular weight organic bases
with either aliphatic, alicyclic or heterocyclic structures (Davidek and Davidek,
1995). The decarboxilation of the amino acid histidine found in high levels in
the tissues of scombroid fishes produces histamine (Frank, 1985). Histamine
24
acting synergistically with putrescine and cadaverine is believed to cause
scombroid poisoning ( Bjeldanes et al., 1978). Histamine content is used as a
marker to indicate degradation of fish (Mietz et al., 1978). Consumption of
decomposed scombroid fish can lead to histamine fish poisoning (Arnold et al.,
1978) and hence the detection of biogenic amines is important to prevent the
sale of decomposed fish.
2.7.c. Gas Chromatography and Amine Analysis
Gas chromatography (GC) has been one of the most widely
investigated and applied techniques in the field of analytical chemistry since
the early 1970’s (McNair, 1998; Grob, 2004). Gas chromatography is a
versatile investigative tool because it is simple, fast, reproducible and
relatively inexpensive as compared to other methods of investigation (McNair,
1998; Grob, 2004). Gas chromatography is widely used to separate organic
compounds that are volatile and semi-volatile in nature. It is used to analyze a
wide range of products including pesticide residues, flavors, colors,
pharmaceutical drugs, etc. (Grob, 2004).
GC has three main components: a carrier gas (mobile phase), a separating
column (stationary phase) and the analyte. The carrier gas is usually inert
hydrogen or helium that is used to carry the analyte through the stationary
column, heat is used to vaporize the analyte compound to facilitate travel
through the column, where it interacts with the liquid stationary phase
(McNair, 1998; Grob, 2004). The analyte separates and elutes from the
stationary phase depending on its solubility relative to the stationary phase.
The eluting analyte enters a detector that produces an electrical response. The
25
electrical signal is processed by a data system, usually a computer that then
generates an image displaying the analyte peaks which is called a
chromatogram. The computer can then determine the peak height or area under
the peak, which is then used to quantify the amount of the analyte (McNair,
1998; Grob, 2004).
Compounds that contain nitrogen (primary, secondary tertiary and
aliphatic amines) are difficult to analyze directly by GC, because a significant
amount of these basic amines is usually adsorbed onto the acidic columns.
Decomposition of the amines in the systems also of concern (Kataoka, 1996).
These difficulties in biogenic amine detection can be reduced if they are
derivitized with a suitable agent (Kataoka, 1996). The derivitization step offers
several advantages, as it improves the volatility of amines that facilitates GC.
Analysis increases the selectivity and sensitivity of detection, enhances the
over all separation (AOAC, 1999) and reduces tailing thus improving the peak
shape (Kataoka, 1996; Yen et al., 1991). Kataoka (1996) has published a
comprehensive review describing several methods that can be used to
derivitize biogenic amines such as acylation, silylation, and carbamate
formation.
The use of G.C. for the detection analysis and quantification of
biogenic amines is of particular interest in the food industry.
2.8. Sensory Analysis
Ranking is one of the simple discriminative difference tests commonly
used in sensory evaluation of foods. It is of ordinal type scale and used to
compare several samples on the basis of a single or specific character (IFT,

26
1981) such as overall preference. It is used to screen one or two of the best
samples from a group of samples. It is also useful in sorting or reducing the
number of test samples to manageable number when large numbers of products
are to be tested. Another application of ranking test is its usage in recruiting
panelist for descriptive analysis which requires ascertaining the ability of
panelists to discriminate four basic tastes. Ranking can be used for evaluating
the influence of changes in ingredients, processing techniques, packaging, etc.
on food sensory properties (Petrukhina and Kriukova, 2003).
Simplicity, rapidity and provision of testing several samples at once are
merits of ranking tests. However, results of this test itself yield only ordinal
data and it lacks equality in distance. Thus the results of the rank test exhibit
only the direction of the differences and not the size of the differences between
samples. Further, statistical analysis of rank tests results in very complicated as
it does not fit into normal distribution.
The rank data obtained from the test can be analyzed with Kramer Test
(Kramer et al.,1974), Friedman non-parametric statistical test with
Randomized Block Design (RBD) and Fishers Least Significant Difference
(LSD) technique and Wilcoxon Rank Sum test.
2.9. Thio-barbituric Acid Reacting Substances (TBARS) Test
Lipid oxidation in fish results in the formation of aldehydes, ketones
and fatty acids and is known to cause losses in quality due to formation of off
flavors (Pearson et al., 1983). Lipid oxidation in fish is based on several factors
such as the fat content, type of fatty acids present, distribution of fat in the
body, degree of unsaturation of fat, external factors like exposure to light and

27
heat, ultraviolet radiation and presence of chemical accelerators (Khayat and
Schwall, 1983). Addition of a highly reactive molecule such as ozone is of
concern as it would be expected to increase the rate at which this oxidation
would occur. The Thio-Barbituric Acid test (Tarladgis et al., 1960) is
commonly used in the food industry to detect lipid oxidation. A modified
method by Lemon (1975) has been used in this study.
2.10. Listeria in Foods
L. monocytogenes is a Gram positive food borne pathogen that can
grow over wide temperature ranges from 1 to 45ºC. It can grow in high salt
environments and can tolerate up to 10 % NaCl. The current US. Regulatory
policy requires absence of L. monocytogenes in 25 g of a Ready to Eat food
sample. L. monocytogenes is wide spread in the environment and is found in
soil, water, and sewage and decaying vegetation. Humans, pets, raw
agricultural commodities, vegetables, fish, dairy products are common carriers
of this organism (Ryser and Marth, 1999). It has been isolated from a wide
variety of seafood processing environments (Dillon and Patel, 1992). Listera is
found in a wide variety of food processing environments like poultry, meats,
vegetables, dairy products and fish (Eklund et al., 1995; NACMCF, 1991). L.
monocytogenes is able to survive at refrigeration temperatures and post
processing contamination with this organism is a serious concern in the food
industry (Dillon and Patel, 1992; Eklund et al., 1995; Jahncke et al., 2004)
Ozone has been successfully used to sublethaly damage L.
monocytogenes cells in an inoculated study (Lee D, Martin Se et al. 1998).
Ozonated water has been shown to significantly reduce L. monocytogenes

28
levels (Restaino et al., 1995). Planktonic and biofilm cells of L.
monocytogenes were found to be completely destroyed upon exposure to
ozone (Robbins et al., 2005).
2.11. Summary of Ozone
Ozone has been used effectively as a sanitizing agent in the food
processing industry both as gaseous ozone and dissolved in water to reduce
microorganisms on a wide range of food products and contact surfaces (Rice,
1982; Kim and Yousef, 1999; Guzel-Seydim et al., 2003). In recent years
ozone in combination with other sanitizers and treatments has been used to
target a broader range of microorganisms having food safety concerns. Some
of the industries where ozone has been used are.

29
Table 2.1 Summary of the properties of ozone.
Advantages • More effective than chlorine, chlorine dioxide and
chloramines for inactivation of viruses, bacteria,
protozoa, bacterial spores and cysts and fungi
• Requires short contact times
• Decomposition by product is oxygen
Disadvantages • Is less effective in mediums that have high pH,
temperature and organic solids
• Ozone generation systems are expensive
• Leaves no residuals and hence must be used with
a secondary sanitizer for effective and long term
disinfections
• Is highly corrosive and needs special operating
conditions
Safety • Several agencies have fixed the maximum
exposure to ozone no more than 0.1 mg/l by
volume in an eight hour work shift (OSHA,
ANSI/ASTM, ACGIH, AIHA)
• No person should be exposed to a concentration
of 0.3mg/l by volume for more than 10 minutes
(ANSI/ASTM)
• No person should be exposed to a concentration
of 0.3 mg/l by volume for up to 15 minutes
(ACGIH)

30
CHAPTER 3
DEVELOPMENT OF A PROCESS TO MEASURE OZONE CONCENTRATIONS IN PROCESSING WATER AT THE POINT OF PRODUCT APPLICATION
3.1. Introduction
Sanitizers are used in food processing operations to decontaminate product
contact surfaces and to reduce the number of spoilage and pathogenic
microorganisms. Commonly used sanitizers include quaternary ammonium,
iodine or bromine, and chlorine or chlorine compounds. Although effective
when used properly, a main concern with abundant use of chlorine is the
accumulation of residues in the environment (Green et al., 1993). Chlorine can
react with naturally occurring aquatic humus compounds in streams and rivers
to form potentially carcinogenic compounds such as trihalomethanes (THM)
and haloacetic acids (HAA) (Garcia et al., 2003; Guzel-Seydim et al., 2003).
High concentrations of chlorine can be effective against viruses, but bacteria
can build up resistance to repeated use of lower concentrations of commonly
used sanitizers (Green et al., 1993).
Gaseous ozone and ozonated water has been used in the food industry for
sanitation of product contact surfaces, as well as for the treatment of milk,
meat products, gelatin and other food products. Ozone is also used for artificial
ageing of alcoholic beverages, cider manufacture, odor control and medical
therapy (Kim, 1998).
Ozone has many advantages as a sanitizer. Gaseous ozone and
ozonated water can be generated on site, at the facility of use. Chemical
reaction of ozone with organic material occurs at very rapid rates and short

31
reaction times, which effectively prevents microorganisms from developing
tolerance to ozone (Kim, 1998). Many studies have reported the advantages
and superior bactericidal properties of ozone as compared to chlorine (Green et
al., 1993; Kim and Yousef, 1999; Klaiber et al., 2004). The effectiveness and
susceptibility of microorganisms to dO3 depends upon the water temperature
and pH, and the presence of dissolved compounds (salt, sugar, minerals and
surfactants) and suspended organic matter (Kim and Yousef, 1999).
Despite these advantages, ozonated water is not widely used to sanitize
processing and food surfaces in the seafood industry. Ozone is a powerful
oxidant and an effective sanitizer, but can be toxic and cause human health
concerns with improper use. Ozone toxicity in humans is expressed as
irritation in the eyes, nose and throat. Off-gassing, the release of gaseous ozone
from the gas-water mixture, at higher temperatures can be a human health
concern. This off-gassing can also result in reduced ozone levels in the water
actually applied to product and surfaces during processing. Off-gassing can
lead to errors in quantifying the amount of ozone used in bacterial destruction
studies.
The objective of this research is to develop a process to measure dO3
concentration in processing water at the point of product application, as
opposed to within the ozone generation system itself. This experimental design
will then facilitate further investigation and optimization of microbial
destruction and changes in quality of peeled shrimp meat processed with
ozonated water.

32
3.2. Materials and Methods
3.2.a. Ozone Generation
Ozonated water was generated using a DelOzone (San Luis Obispo,
CA, 93401 USA)-AirLiquide (Houston, TX, 77056 USA) Infinity series
corona discharge dO3 generator (Model AGW 1500SL). This system uses
concentrated oxygen (90-95% pure) as the input gas and a nozzle injection
system (Mazzi injectors) for mixing ozone with water. The system produces a
water flow rate of 12.6 lpm (liters per minute) and has an ozone output range
of 10-25 g/hr (grams per hour).
3.2.b. Ozone Measurement
Dissolved ozone concentrations were measured with a flow-through
process, using an Analytical Technology, Inc. (Model A 15/64) (Collegeville,
PA, 19456 USA) dO3 sensor (Figure. 3.1).
The sensor was inserted in an acrylic flow cell assembly to maintain
constant flow rate and pressure across the sensor membrane and continuously
measure dO3 concentrations. The sensor has two operating ranges, and the
higher range setting (0–20.00 ppm dO3) was selected for our studies. The dO3
sensor utilizes a polarographic membrane element. The sensor measures ozone
concentrations directly on the principle of a Clark oxygen electrode. The
electrode consists of two half-cells separated by a salt bridge. A platinum and a
silver electrode are separated by an insulating material placed in a concentrated
solution of potassium chloride. Ozone concentrations are displayed digitally on
a backlit liquid crystal display.

33
The ozone sensor requires a constant pressure over the polarographic
membrane to accurately measure dO3 concentrations. This constant pressure
was produced by enclosing the sensor in the flow cell assembly connected to
the funnel.
Figure 3.1: Dissolved Ozone (dO3) Measurement System Using a Flow Cell
and dO3 Sensor Water collected in the funnel is directed through the flow cell and past the
sensor at the rate of 20 ml/s (milliters per second). The sensor has a response

34
time of 90% in 45 seconds and an automatic temperature compensation
function from -1.7°C to 49°C.
The sensor was calibrated daily with High Range Hach Acuvac Kits (Hach
Indigo Method 8311) (Loveland, CO, 80539 USA) for lower concentrations
(0–1.5 ppm dO3), and with an indigo blue colorimetric method (Bader et al.,
1982) for higher concentrations (1.5–3 ppm dO3).
Ozone gas escaping into the atmosphere from the gas water mixture was
observed using an Ecosensor Ozone Monitor (Model A-21ZX) (Santa Fe, NM,
87505 USA). This is a HMOS (heated metal oxide semiconductor) sensor that
quickly measures ambient ozone levels from 0.02-9.99 ppm.
3.2.c. Water Temperature and Quality Parameters
Water temperature was measured using an EXTECH Instruments Big
Digit, Type K Single Input Thermometer (Model 421501) (Waltham, MA,
02451 USA). Total dissolved solids (TDS) were measured using a OAKTON
Instruments TDS tester (Vernon Hills, IL, 60061 USA). Free chlorine was
measured using Hach DPD Acuvac® free chlorine test kits (0–2.5 mg/l free
chlorine). The nitrate and nitrite content was measured using the Hach nitrate–
nitrite test kit (Model NI–12). The iron and manganese content was measured
using a Simultaneous ICP - OES (Inductively Coupled Plasma-Optical
Emission Spectrometer) (Model Vista-MTX) (Varian Inc., Palo Alto, CA,
94598 USA).

35
3.2.d. Statistical Analysis
One way ANOVA and Student’s t values were calculated using the
JMPin® software, Copyright © 1989-2000 SAS Institute Inc. (Cary, NC, 27513
USA).
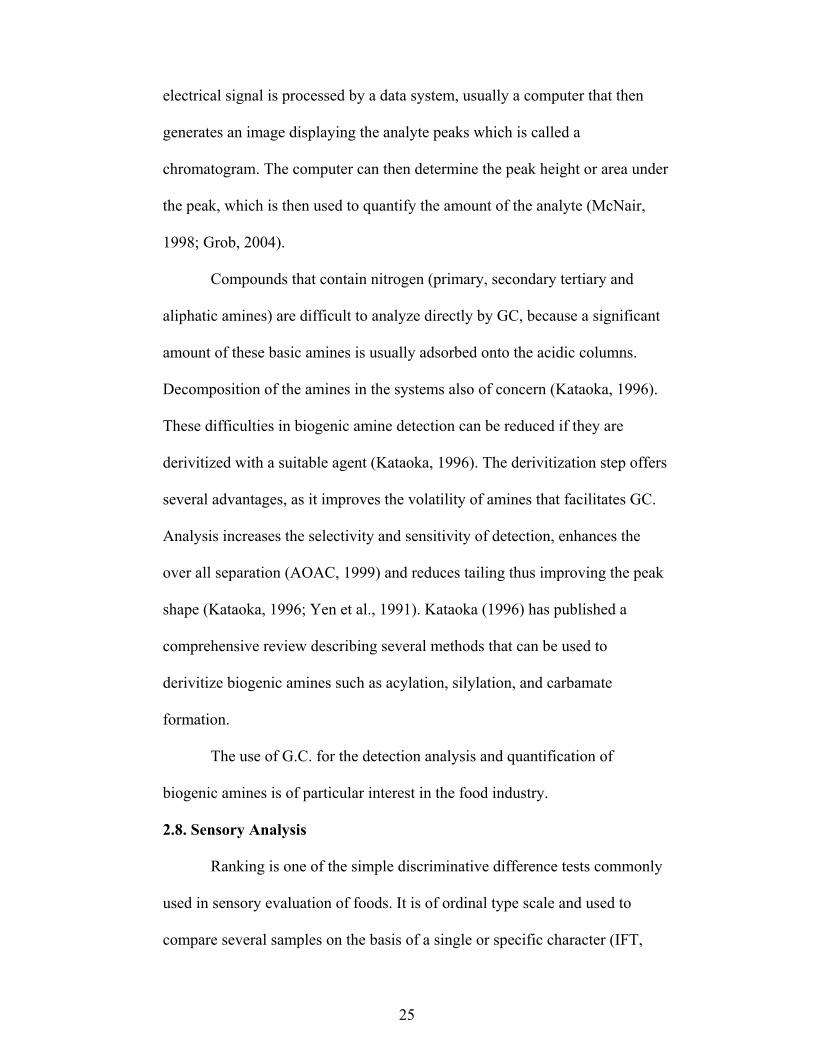
3.3. Results and Discussion
Ozone concentration was digitally measured at the point of product
application using the flow-through sensor and flow-cell (Figure. 3.1). Identical
processing water samples were measured for ozone concentrations using
chemical methods. The sensor readings were verified with Acuvac Hach kits
and the indigo-blue colorimetric method. The mean values of ozone
concentrations compared using ANOVA and student’s t values from all
methods of measurement did not differ significantly at the 95% confidence
level (Table 3.1).
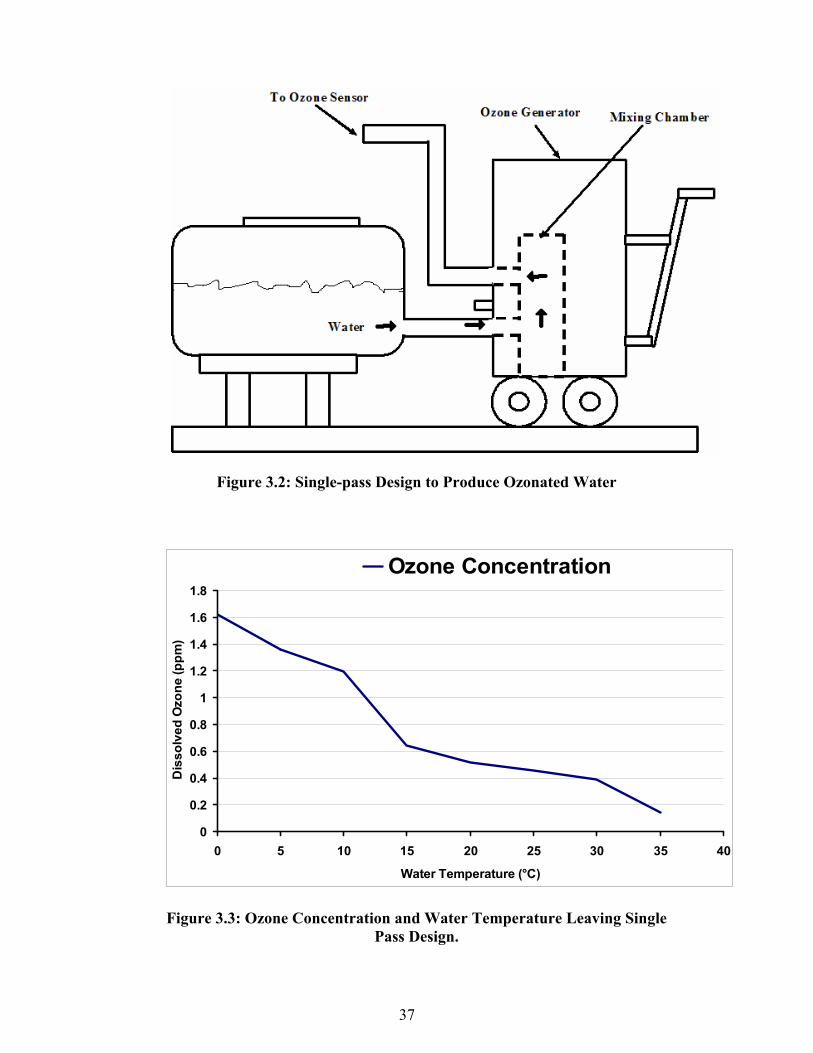
The effect of water temperature on dO3 concentrations was measured
using a single pass design (Figure. 3.2). Water temperature in a 450 liter
polyethylene tank was controlled with ice. dO3 in water (0°C-35°C) was
measured after a single pass through the ozone generator (Figure. 3.3). dO3
concentration increased with decreasing water temperature. This increase was
greatest when the processing water was chilled to 10°C. This result suggests
that chilling the processing water to 10°C offers a practical and realistic
opportunity for improved performance of dO3 generation systems in seafood
processing plants. In addition, off-gassing of ozone into the atmosphere during

36
Table 3.1: Verification of Dissolved Ozone Results from the Flow-through Sensor with Chemical Measurement Methods
* Accu Vac Hach kits could measure ozone concentrations only up to 1.5 ppm.
Water Temp Ozone Concentration (ppm)
ATI-Sensor Hach-Kit Indigo-Blue
°C Digital Chemical Chemical
0 1.61 NA* 1.64
5 1.35 1.35 1.41
10 1.19 1.15 1.21
15 0.64 0.65 0.64
20 0.52 0.50 0.53
25 0.46 0.50 0.48
30 0.38 0.35 0.39
35 0.14 0.15 0.14
37
Figure 3.2: Single-pass Design to Produce Ozonated Water
0
0.2
0.4
0.6
0.8
1
1.2
1.4
1.6
1.8
0 5 10 15 20 25 30 35 40
Water Temperature (°C)
Dis
solv
ed O
zone
(ppm
)
Ozone Concentration
Figure 3.3: Ozone Concentration and Water Temperature Leaving Single Pass Design.

38
these trials was more readily observed at the higher water temperatures while
monitoring the processing area with the Ecosensor.
The single pass design was also used to evaluate the effect of water
quality parameters on dO3 concentration. Water quality parameters measured
included pH, TDS, nitrates, nitrites, free chlorine, iron and manganese content.
Increased ozone concentrations did not affect the water pH, and very little
change was seen in the manganese, nitrites and TDS content (data not shown).
There was a substantial decrease in the free chlorine content of water after
ozonation (Figure. 3.4).
0
0.01
0.02
0.03
0.04
0.05
0.06
0.07
0.08
0.09
0.1
1.651.371.240.630.510.480.360.14
Dissolved Ozone (ppm)
Iron
(ppm
)
0
1
2
3
Free
chl
orin
e (p
pm)
Untreated Fe Treated Fe UnTreated Cl2 Treated Cl2
Figure 3.4: Changes in free chlorine and iron content of ozone treated water
Changes in iron content at higher ozone levels was also indicated. These ionic
species participate in the initiation stage of ozone decomposition. The soluble

39
ferrous ions are oxidized by ozone to form the insoluble ferric ions. Similarly,
the hypochlorite ions are oxidized to form chlorates and chlorides. These ions
are involved in the formation of free radicals, such as the superoxide radical
ion (O2-) and the hydroperoxide radical (+HO2). These free radicals lead to
formation of a hydroxyl (˙OH) ion which is highly reactive and consumes an
ozone (O3) molecule, thus reducing the concentration of dO3 in water
(Staehelin and Hoigene, 1985).
Dissolved ozone concentration was measured in the water exiting the
system after a single pass through the ozone generator. The highest ozone
concentration produced was 1.6 ppm in water at 1°C. A recirculation system
was then designed to generate ozone concentrations of 3 ppm (Figure. 3.5).
Water temperature of 10°C was maintained using ice. The ozone concentration
was increased via recirculation of the water through the ozone generator. Initial
measurements of dO3 concentration were performed by immersing the dO3
sensor, enclosed in a protective PVC tube, into the recirculation tank.
However, these measurements were found to be highly variable in different
areas of the tank. The sensor requires water flow and a constant pressure across
the sensing membrane. Insufficient water movement and difference in water
levels in different tank locations resulted in the varied sensor measurements.
A process to transport the ozonated water past the sensor in the flow
cell was designed to measure dO3 in water at the point of product application
(Figure. 3.5). A 0.5 hp submersible pump was placed in the recirculation tank
to
40
Figure 3.5: Recirculation design to produce water with increased ozone concentration
deliver the ozonated water to the flow cell. The turbulence created by the
submersible pump decreased the ozone concentration in the water being
pumped out of the tank. This reduction emphasized the importance of
measuring ozone concentration in the water at the point of application, and not
in the recirculation system itself. Continuous recirculation of the water through
the ozone generator produced elevated dO3 levels in the water.
Two different product application treatments will be studied, soaking
and spraying. For the soak treatment, ozonated water was pumped from the
recirculation tank into containers, and samples will be immersed in these
containers for different time intervals. For the spray treatment, a low pressure

41
high volume nozzle is fitted to the discharge end of the submersible pump for
spraying of ozonated water on the product surface.
An ozone concentration of 3 ppm was selected as the upper level for
eventual product treatment. This 3 ppm concentration was selected based on
practical constraints encountered in seafood processing plants, including
recirculation time requirements, water quality limitations and off-gassing
concerns. The time required to achieve 3 ppm dO3 concentration was 90
minutes in 10°C water. Longer concentration times would prove impractical in
most seafood processing facilities. Higher ozone concentrations may produce
detrimental quality effects in the treated food product. High ambient water
temperatures may lead to increased off-gassing, which would create human
health and safety concerns. Off-gassing was observed for both initial spray and
the soak treatments, and continued experiments with shrimp meat samples will
be conducted in a controlled environment. Greater off-gassing was observed
for the spray application.
3.4.Conclusion
Dissolved ozone concentration in processing water at the point of
product application was quantitatively and rapidly measured using a flow-
through sensor. This system will be used to optimize ozonated water treatment
of peeled shrimp meat. dO3 is commonly measured within the generator
system during industrial application. These measurements are valid for the
ozone dissolved in water within the generator, but will indicate higher
concentrations than for the water that is actually applied to the product and

42
process surfaces. Colder processing water temperature resulted in increased
dO3 levels and decreased ozone off-gassing from the water.
Achieving increased ozone levels in processing water at the point of
application presents an opportunity for improved product sanitation during
seafood processing. The use of higher ozone levels will require active control
of off-gassing from processing water. To optimize and increase the use of
ozonated water in the seafood industry, water should be pre-chilled and off-
gassing must be contained. This control should be designed into the entire
processing and application system.

43
CHAPTER 4
PROCESS OPTIMIZATION FOR APPLICATION OF OZONATED WATER IN SHRIMP PROCESSING 4.1. Introduction
Consumption of fish and shellfish in the U.S. has steadily increased to 16.6
pounds per person in 2004. Imports accounts for over 80 percent of the seafood
consumed in the U.S., and shrimp reached a record 4.2 pounds of shrimp per
person in 2004 to surpass canned tuna as the most consumed seafood type (NMFS,
2006). Annual domestic landings of shrimp have remained mostly steady over the
past decade, near the 200 million pounds harvested in 2004, while shrimp exports
have grown to exceed 1 billion pounds (NMFS, 2006).
The majority of shrimp in the U.S. are harvested from Gulf of Mexico and
South Atlantic (GSA) waters. Louisiana fishermen account for more than 40% of
domestic shrimp landings, reaching 133 million pounds with an estimated worth of
1.6 billon dollars in 2004 (NMFS, 2006). The majority of these shrimp are
mechanically peeled and frozen in Louisiana, with additional processors located in
Alabama, Texas, and Mississippi. Shrimp generate the greatest economic value of
all domestic commercial fisheries in the U. S. (NMFS, 2006) and the industry
contributes to many components of local coastal economies.
Shrimp are harvested primarily by trawl gear on vessels with either ice storage
holds or brine freezing equipment. In Louisiana, the majority of shrimp are
harvested by trawling in-shore and near-shore waters, and are chilled and stored on
board in ice. These trips range from overnight to 10-14 days. Significant volumes
of shrimp are also brine frozen on board off-shore vessels. Iced and frozen shrimp
are unloaded at shore-side dock facilities, and transported to processing plants for

44
mechanical peeling, packing, and primarily wholesale distribution (Figure 1).
Additional volumes are packaged as headless with shells on and without peeling.
This traditional wild harvested and mechanically processed shrimp industry is
competing with the growing volume of farm-raised and hand peeled shrimp
imports, which are now typically manually processed and frozen within 24 hours of
harvest. Application of practical technologies to improve product quality and shelf
life is a critical need and key component of the domestic, wild harvest shrimp
industry efforts to compete with imported, farm-raised shrimp.
The successful application of ozone technology provides an opportunity to
improve product quality for the mechanically peeled shrimp industry. The USFDA
and USDA have amended food additive regulations to provide for the safe use of
ozone in gaseous and aqueous forms as an antimicrobial agent on food, including
seafood (FDA, 1982; USDA, 1997). Ozonated water has been used in a range of
food processing facilities as a surface sanitizer (Guzel-Sydim, 1996). Although
chemical sanitizers, including quaternary ammonium, iodine, and chlorine, are
commonly used to sanitize food processing surfaces, they are not approved for
direct application to seafood products. While chlorine has been the sanitizer of
choice for seafood processors, there is a growing concern of adverse environmental
effects with the widespread use of chlorine and a preference to gradually phase out
chlorine use from food processing plants (Birks, 2003; Garcia et al., 2003).
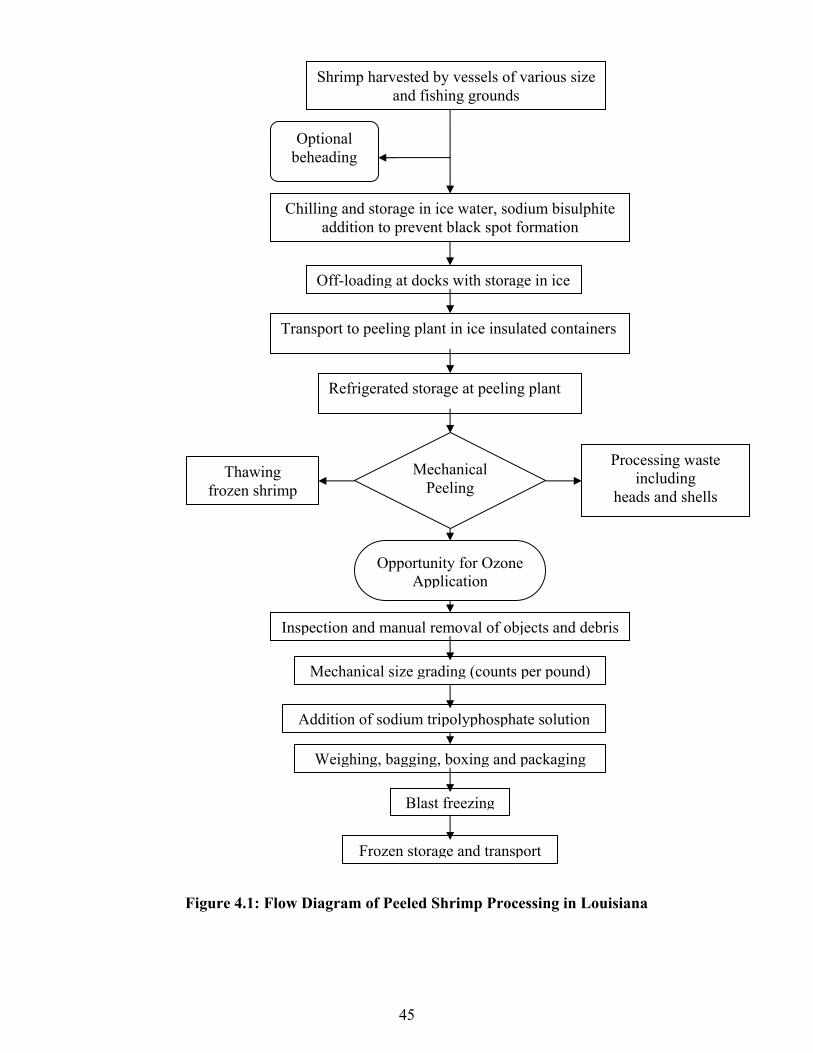
45
Figure 4.1: Flow Diagram of Peeled Shrimp Processing in Louisiana
Shrimp harvested by vessels of various size and fishing grounds
Chilling and storage in ice water, sodium bisulphite addition to prevent black spot formation
Off-loading at docks with storage in ice
Transport to peeling plant in ice insulated containers
Refrigerated storage at peeling plant
Optional beheading
Inspection and manual removal of objects and debris
Mechanical Peeling
Processing waste including
heads and shells Thawing
frozen shrimp
Opportunity for Ozone Application
Mechanical size grading (counts per pound)
Addition of sodium tripolyphosphate solution
Weighing, bagging, boxing and packaging
Blast freezing
Frozen storage and transport
46
Ozone (O3) is a form of elemental oxygen (O2) discovered in 1839 by the
European researcher C.F. Schonbein (Guzel–Seydim et al., 2003). Ozone is very
unstable at atmospheric conditions and decomposes quickly to elemental oxygen
(Horvath et al., 1985). Ozone is a powerful oxidizer and ranks fifth in
thermodynamic oxidation potential behind elemental fluorine. Ozone has been
shown to deactivate a large number of organisms, including bacteria, fungi, yeast,
parasites and viruses, and can also oxidize natural organic compounds as well as
synthetic substances, such as detergents, herbicides and composite pesticides
(Graham, 1997; Guzel-Seydim et al., 2003). Ozone has been used in the food
processing industry both as gaseous ozone and dissolved in water to reduce bacteria
on a wide range of food products and contact surfaces, as well as converting green
tea to black tea (Crapo et al., 2004; Kim and Yousef, 1999; Guzel-Seydim et al.,
2003).
Ozone has been studied at various stages of seafood processing. Use of
ozonated ice aboard fishing vessels has been shown to extend the shelf life of
whole fish by 3-5 days (Rice et al., 1982). Ozonated water produced a substantial
reduction in bacterial populations on stainless steel contact surfaces (Dosti and
Guzel-Seydim, 2005). Intermittent washing and pumping of fish from ship holds
using ozonated water was shown to extend refrigerated shelf life (Koetters et al.,
1997). Treating fresh scad with gaseous ozone showed reduced bacterial levels and
improved sensory scores (Silva et al., 1998) . However, recent studies with
ozonated water on salmon fillets and roe have indicated a decrease in frozen shelf
life due to oxidation of fatty acids during storage (Crapo et al., 2004). Systems to
generate ozonated water are commercially available. These turn-key systems now
47
contain features to destroy excess ozone for improved safety, and can be easily
fitted to available water and electrical sources for ozonated water generation and
application (DelOzone, 2004).
Despite these known advantages, the use of ozonated water has not been
widely adopted in the seafood industry. Quality and temperature of the water
available to the seafood processor can have a significant impact on the ozone levels
produced by these ozonated water systems. Impurities in water are known to
promote decomposition of dissolved ozone (dO3) and reduce its efficiency
(Staehelin and Hoigne, 1985). Water temperature greatly influences the solubility
of ozone in water, which increases with decreasing temperature. Recent work in our
laboratory has shown the need to reduce the water temperature of ambient
processing water in southern Louisiana to produce increased levels of dO3 (Chawla
et al., 2006).
Most commercial systems measure dO3 levels in the water within the ozone
generating system. Off-gassing of this dO3 from the water exiting the system, and
before reaching the food product, can greatly reduce the amount of dO3 that
actually contacts the product surface. An experimental measurement system had
been developed to determine dO3 concentration in processing water at the point
product application and contact (Chawla et al., 2006).
The goal of this research was to compare the bacterial destruction
performance of two different application methods, three dO3 concentrations, and
three treatment durations of ozonated water on peeled shrimp meat, and to select an
optimal application for further iced shelf life and Listeria destruction studies.

48
4.2. Materials and Methods
4.2.a. Sample procurement
Mechanically peeled white shrimp (Penaeus setiferus) harvested from
Gulf of Mexico waters were procured from a local shrimp processing plant.
Medium shrimp, 50-60 count per pound, were removed from the processing
line after peeling and before tri-polyphosphate addition and transported in ice
to the Food Processing & Technology Pilot Plant at the LSU AgCenter in
Baton Rouge, LA. The shrimp were stored in ice before sampling and
processing.
4.2.b. Ozone generation
Ozonated water was generated using a DelOzone (San Luis Obispo,
CA, 93401 USA)-AirLiquide (Houston, TX, 77056 USA) Infinity series
(Model AGW 1500 G) corona discharge dO3 generator. A closed-loop re-
circulation system was constructed (Figure 4.2). This system recircluated water
through the ozone generator and increased the dO3 concentrations to the three
levels used in the study. Ozonated water was then transferred using a 1/2 hp
submersible pump from the recirculation tank for use and measurement.
4.2.c. Ozone measurement
Dissolved ozone concentration was measured using a Model A 15/64
dO3 sensor (Analytical Technology, Inc. Oaks, PA, 19456 USA) inserted into
an acrylic flow-cell and connected to a flow-through system (Figure 4.3).

49
Figure 4.2: Recirculation Setup to Produce Ozonated Water
Water to Ozone Sensor
Submersible Pump Recirculating Water
Ozone Generator
Mixing Chamber

50
Figure 4.3: Setup for Flow-thru Process Using a Flow cell and dO3 Sensor
Dissolved Ozone Sensor
Flow Cell
Ozonated Water In
Out

51
Water enters the funnel and travels through the flow cell past the
Clarke-Oxygen electrodes of the ozone sensor. dO3 concentration (ppm) are
shown on the sensor digital display (Chawla et al., 2006). These ozone
concentrations were verified by chemical methods, using Hach dO3,
AccuVac® Kits (Hach Company, Loveland, CO 80539) and the indigo blue
titration method (Bader, 1982).
4.2.d. Sample Treatment
A matrix of the different treatment combinations is shown in Figure
4.4. Two different application types, soaking and spraying, were compared.
Three different dO3 concentrations 1 ppm, 2 ppm and 3 ppm were generated in
10ºC and used for each application type. Shrimp samples were soaked or
sprayed for 20, 40 and 60 s for each concentration.
Figure 4.4: Matrix of Concentration and Contact Times for Application of dO3 using Soak and Spray Application
3 ppm 2 ppm 1 ppm
SPRAY SOAK
40 Seconds
60 Seconds
20 Seconds
40 Seconds
60 Seconds
20 Seconds
40 Seconds
60 Seconds
20 Seconds

52
To increase ozone production and control solubility, water temperature was
maintained at 10°C. Each treatment (spray and soak for all combinations) used
19.3 l of water to 0.45 kg of shrimp, based on estimated usage at a local shrimp
peeling facility. Three replicate processing trials were carried out for each
treatment, and all treatment combinations for each trial were conducted on the
same day.
Samples for each spray treatment were aseptically placed in a single
layer on a sterile mesh. dO3 concentration of the spray water was measured
immediately before spraying, and shrimp meat samples were sprayed from a
fixed height of 26 cm to receive complete coverage for the specific time
interval. Treated and control (non-ozonated water) samples were then
aseptically transferred to sterile Whirl-pack bags and stored in ice for
subsequent microbial and chemical analysis.
Samples for each soak treatment were dropped into a 38.5 l high
density polyethylene HDPE tub containing the ozonated water and soaked for
the specific time interval. dO3 in the soak water was measured immediately
before filling the tub. Shrimp samples were then bag aseptically bagged and
stored as the spray samples.
4.2.e. Microbial Analysis
Microbial analysis included Aerobic Plate Counts (APC) and
Pseudomonas fluorescens counts. Each Whirl-pack bag containing the control
or treated samples were placed in a stomacher (Seward STO 80, Cincinnati,
OH 45222), serialy diluted to 1/10 with phosphate buffer solution (PBS) and
comminuted. The stomached sample was then serially diluted in PBS and
53
plated on APC Petrifilms (3M Corp., St. Paul, MN ) and then incubated at
37°C for 24 hours (Ginn, 1986). Dilutions were also surface-plated onto
Pseudomonas F agar for Pseudomonas fluorescens enumeration and incubated
at 35°C for 24 hours (King et al., 1954).
4.2.f. Chemical Analysis
Proximate analysis was carried out to determine the moisture, protein,
fat and ash content of the shrimp samples, carbohydrate content was assumed
to be negligible. Moisture and fat content was determined with a CEM
microwave moisture/fat analyzer (CEM Corp., Matthews, NC 28106). The
total nitrogen content was determined using a PrimacsSN - Protein - Nitrogen
Analyzer (Skalar Inc., Norcross, GA 30071), which uses the Dumas
combustion method. Protein content was determined by multiplying the total
nitrogen content by 6.25. Ash content was determined by combustion in a
Muffle furnance at 450ºC. TBARS test to determine lipid oxidation was done
on the remaining, undiluted, stomached samples from the microbial analysis.
TBARS test was used to detect malonaldehyde levels using the Thiobarbituric
Acid Reacting Substances (Lemon, 1975) Fifteen gramsof shrimp was digested
with 30 ml of an extraction solution containing 7.5 % trichloroacetic acid,
propyl gallate and ethylenediaminetetraacetic acid. The homogenate was
separated by centrifuging the samples at 2000rpm for 15 minutes. 5 ml of the
extract was then mixed with 5 ml of TBA reagent (0.02 M thiobaribituric acid
in water) and heated in boling water bath for 40 min. The solution was cooled
and color development was measured at 530 nm using a spectrophotometer.
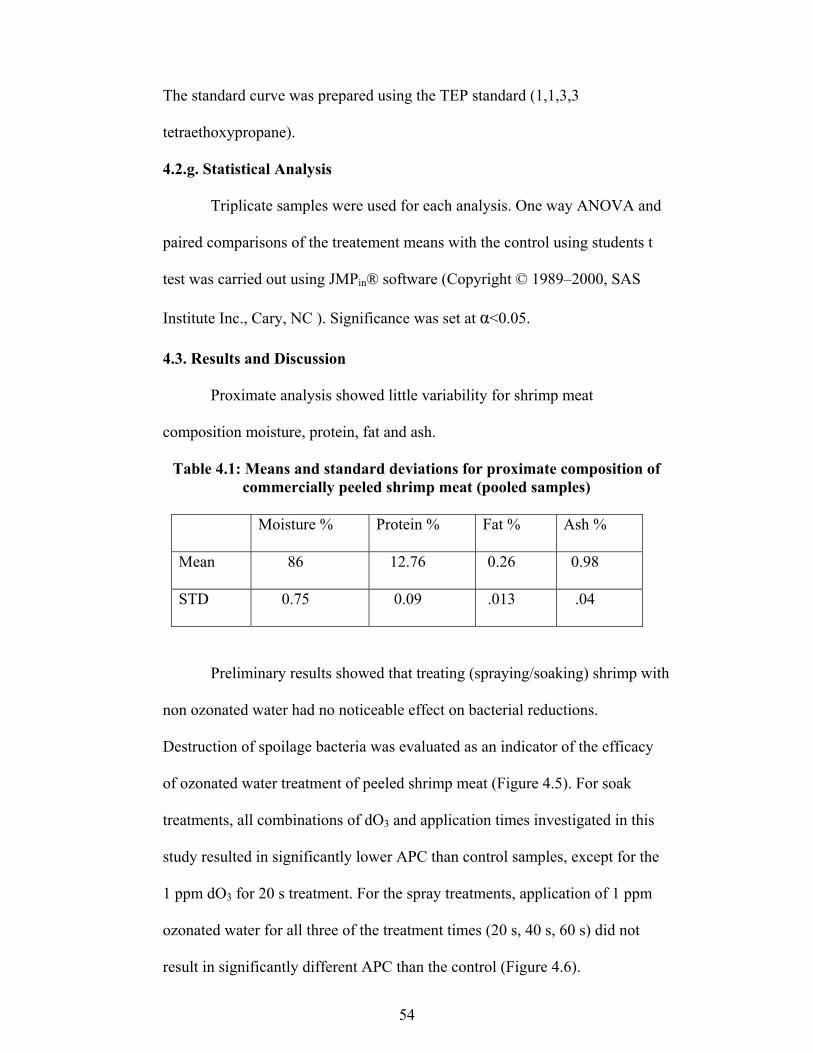
54
The standard curve was prepared using the TEP standard (1,1,3,3
tetraethoxypropane).
4.2.g. Statistical Analysis
Triplicate samples were used for each analysis. One way ANOVA and
paired comparisons of the treatement means with the control using students t
test was carried out using JMPin® software (Copyright © 1989–2000, SAS
Institute Inc., Cary, NC ). Significance was set at α<0.05.
4.3. Results and Discussion
Proximate analysis showed little variability for shrimp meat
composition moisture, protein, fat and ash.
Table 4.1: Means and standard deviations for proximate composition of commercially peeled shrimp meat (pooled samples)
Moisture % Protein % Fat % Ash %
Mean 86 12.76 0.26 0.98
STD 0.75 0.09 .013 .04
Preliminary results showed that treating (spraying/soaking) shrimp with
non ozonated water had no noticeable effect on bacterial reductions.
Destruction of spoilage bacteria was evaluated as an indicator of the efficacy
of ozonated water treatment of peeled shrimp meat (Figure 4.5). For soak
treatments, all combinations of dO3 and application times investigated in this
study resulted in significantly lower APC than control samples, except for the
1 ppm dO3 for 20 s treatment. For the spray treatments, application of 1 ppm
ozonated water for all three of the treatment times (20 s, 40 s, 60 s) did not
result in significantly different APC than the control (Figure 4.6).

55
Spraying shrimp meat samples with 2 ppm and 3 ppm dO3 did
significantly reduce aerobic spoilage bacteria. Soaking peeled shrimp meat in
ozonated water resulted in greater destruction of spoilage bacteria, with
significantly greater APC reductions for most treatments, than equivalent
ozonated water spray applications (Figure 4.7).
For each application type, treatment with higher dO3 for the same
amount of time resulted in greater reduction of spoilage bacteria (Figure 4.7).
For all treatment groups except spraying with 2 ppm, there was little to no
hh
gcdefbcdefbcde
efbcd
aa
0
1
2
3
4
5
6
7
8
Control A20 A40 A60 B20 B40 B60 C20 C40 C60
A = 1 ppm; B = 2 ppm; C= 3 ppm : (20 = 20 s, 40 = 40 s, 60 = 60 s)
Log
CFU
/g
Figure 4.5: Aerobic Plate Counts Using Soak Application at Different
Ozone Concentrations and Contact Times

56
cbb
aaaa
d d d
0
1
2
3
4
5
6
7
8
Control A20 A40 A60 B20 B40 B60 C20 C40 C60
A = 1 ppm; B = 2 ppm; C= 3 ppm : (20 = 20 s, 40 = 40 s, 60 = 60 s)
Log
CFU
/g
Figure 4.6: Aerobic Plate Counts Using Spray Application at Different Ozone Concentrations and Contact Times
increased reduction between 40 s and 60 s of application. For all groups except
spraying at 1 ppm, 40 s and 60 s of treatment resulted in significantly greater
APC reduction than 20 s. Additionally, for soaking, increasing the dO3
concentration by 1 ppm and treating for only 20 resulted in similar microbial
reduction to soaking at the lower concentration for 40 s and 60 s (Figure 4.7).
Soaking the peeled shrimp meat samples in 3 ppm ozonated water for
40 s and 60 s resulted in the greatest reduction in APC levels (Figure 4.7). This
data also indicates that longer soak times above 60 s would not significantly
increase destruction of spoilage bacteria. However, increased reduction of
spoilage bacteria does result with increased concentration of dO3 in the
treatment water. Increasing this dO3 level above 3 ppm may result in an
increased destruction of bacteria on the peeled shrimp meat. Our experience in
producing the dO3 concentrations used in this study suggest using 3 ppm as the

57
top limit, due to water conditions and off-gassing concerns expected to be
encountered in the commercial shrimp facilities in the Gulf of Mexico region.
0
1
2
3
4
A20 A40 A60 B20 B40 B60 C20 C40 C60
A = 1 ppm; B = 2 ppm; C= 3 ppm : (20 = 20 s, 40 = 40 s, 60 = 60 s)
Log
CFU
/g
Spray Soak
Figure: 4.7 Comparison of Bacterial Reduction (from control) between Soak and Spray Application at Different Ozone Concentrations and Contact Times
The highest levels of P. fluorescens destruction were also found for
soaking in 3 ppm for 60 s treatment (Figure 4.8). Although initial
Pseudomonas. levels were higher in the shrimp samples; the increased
destruction at the highest dO3 treatment was not as significant as the APC
reduction. Gram negative bacteria like Pseudomonas. are more prone to injury
than destruction by small doses of ozone (Kim, 1998).

58
0
1
2
3
4
5
A20 A40 A60 B20 B40 B60 C20 C40 C60
A = 1 ppm; B = 2 ppm; C= 3 ppm : (20 = 20 s, 40 = 40 s, 60 = 60 s)
Log
CFU
/g
Spray Soak
Figure 4.8: Comparison of Pseudomonas flourescens Reduction (from control) between Soak and Spray Application at Different Ozone Concentrations and Contact Times
Due to the strong oxidative strength of ozone, the shrimp samples were
evaluated for lipid oxidation using the TBARS test. Proximate analysis of
shrimp compositon indicated < 0.3 % fat in shrimp (Table 4.1). A significant
difference in the TBARS values was not observed between the control and the
treated samples immediately after treatment for all treatment combinations
investigated (Figure 4.9).
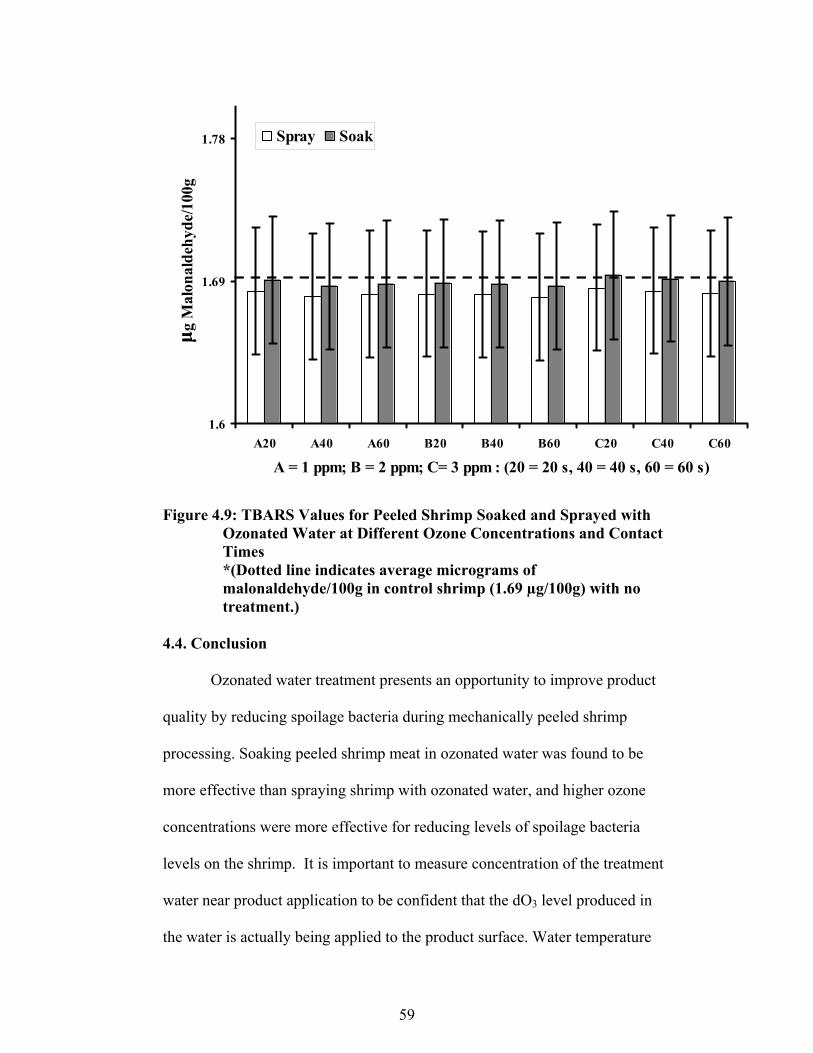
59
1.6
1.69
1.78
A20 A40 A60 B20 B40 B60 C20 C40 C60
A = 1 ppm; B = 2 ppm; C= 3 ppm : (20 = 20 s, 40 = 40 s, 60 = 60 s)
µ g M
alon
alde
hyde
/100
g
Spray Soak
Figure 4.9: TBARS Values for Peeled Shrimp Soaked and Sprayed with Ozonated Water at Different Ozone Concentrations and Contact Times *(Dotted line indicates average micrograms of malonaldehyde/100g in control shrimp (1.69 µg/100g) with no treatment.)
4.4. Conclusion
Ozonated water treatment presents an opportunity to improve product
quality by reducing spoilage bacteria during mechanically peeled shrimp
processing. Soaking peeled shrimp meat in ozonated water was found to be
more effective than spraying shrimp with ozonated water, and higher ozone
concentrations were more effective for reducing levels of spoilage bacteria
levels on the shrimp. It is important to measure concentration of the treatment
water near product application to be confident that the dO3 level produced in
the water is actually being applied to the product surface. Water temperature
60
will significantly affect the dO3 concentration and decreasing water
temperature to 10ºC or below will facilitate generating and maintaining the
desired dO3 level. The application of ozonated water did not increase lipid
oxidation in the shrimp immediately after treatment.
Soaking peeled shrimp meat in water with 3 ppm dO3 for 60 s resulted
in the highest reduction of spoilage bacteria of the treatments studied, and will
be used to investigate the effects on product quality and shelf life during
storage and Listeria destruction.

61
CHAPTER 5
EFFECTS OF OZONATED WATER TREATMENT ON QUALITY, SHELF LIFE AND SAFETY IN PEELED SHRIMP MEAT 5.1. Introduction
Shrimp has replaced canned tuna as the most popular seafood
consumed in the U.S. This increased consumption has been driven by high
volumes of low cost imports, as domestic production has remained steady.
Louisiana leads the nation in shrimp production with over 63 % of the
domestic landings of 210 million pounds harvested in 2004 (NMFS, 2006).
Shrimp is the most economically valuable fishery in Louisiana, and
mechanically peeled and frozen shrimp accounts for the major product form
processed in the state and the Gulf of Mexico region (Schwab, personal
communication 2005). However the viability of the domestic shrimp industry
is under constant economic pressure from the high volumes of hand peeled and
low cost imported shrimp (Anon, 2004).
Improved product quality is necessary for the domestic industry to
compete with the imported product and support national shrimp industry
marketing initiatives (DeSantis, 2003). The high volumes of shrimp landings in
the Gulf of Mexico waters has resulted in the development of high volume
mechanical peeling operators. Due to the variable pre and post harvest
conditions of the wild shrimp fisheries, wild shrimp can develop increased
levels of spoilage bacteria. Using ozonated water in the peeling operations
presents an opportunity to reduce bacterial levels and improve the quality and

62
shelf life of peeled shrimp. This high quality shrimp will present the shrimp
industry better chances to compete with the low cost imports.
Ozone is a USFDA and USDA approved antibacterial agent that can be
applied to food products (FDA, 1982; USDA, 1997). Commercial ozone units
can generate ozone using available water and power (DelOzone, 2004). Ozone
has a short half life at ambient temperature and does not leave behind residues
unlike chlorine. Ozone is effective against a wide range of bacteria, viruses,
yeast, molds and protozoa (Anon. 2005; Guzel-Seydim, 2004). Ozone has seen
use in the food processing industry as gaseous ozone and dissolved in water as
ozonated water. Both have been used as a bactericide on a wide range of food
products including meat, poultry, eggs, raw fruits and vegetables, seafood and
fruit juices, as well as sanitation of product contact surfaces (Guzel-Seydim et
al., 2003, Anon, 2005). Ozonated water has been shown to reduce levels of
Listeria monocytogenes on food contact surfaces (Moore G, 2000). L.
monocytogenes serotype (1/2a) and L. monocytogenes serotype (4b) have been
isolated from seafood processing environments (Rorvik, 2000). Ozone has also
been shown to be effective in reducing Listera levels on the surfaces of
strawberries, cantaloupes, lettuce, beef carcasses, alfalfa sprouts and seafood
(Jahncke, 2004; Reagan et al., 1996; Rodgers et al., 2004; Warriner et al.,
2005).
Despite these advantages, the use of ozonated water technology has not
been widely adopted in the seafood industry. Recent studies of ozonated water
on salmon fillets and roe found increased oxidation during frozen storage of

63
these high lipid products (Carpo et al., 2004). In addition to incurred capital
and operational costs, seafood processors have received limited understanding
of dO3 solubility, including the effects of temperature and water quality. These
inputs and off-gassing often result in the incorrect measurement and
knowledge of actual ozone concentrations at the point of product application.
A previously determined optimal time-concentration ozonated water treatment
(Chawla et al., 2006) was used to investigate effects of ozonated water on raw
product quality, shelf life and safety of peeled shrimp meat during iced storage.
5.2. Materials and Methods
5.2.a. Sample procurement and treatment
Medium white shrimp (Litopenaeus setiferus), and brown shrimp
(Farfantepenaeus. aztecus), 36 – 40 count stored in ice slush was landed and
transported on ice to the Food Processing Technology Pilot Plant (FPTPP),
Louisiana State University, Agricultural Center, LA, within 24 hours after
harvest from Louisiana state waters. The untreated shrimp were then hand
peeled and stored on ice until treatment or sampling. Ozonated water was
generated at 10ºC and concentrations measured using apparatus and procedures
developed by Chawla et al. (2006). The peeled shrimp were divided into two
equal groups and one group was treated using by soaking in 3ppm ozonated
water for 60 seconds. Shrimp meat samples from both the untreated and treated
control groups were stored in Ziploc® bags on ice for the duration of the shelf
life study. Storage ice was changed periodically to maintain shrimp
temperature. Shrimp meat samples were removed from both the groups at two

64
day intervals for immediate microbial and chemical analysis. Additional
samples were removed at three day intervals and frozen in liquid carbon
dioxide tunnel freezer (AirLiquide, Houston, TX, 77056 USA), and stored at –
15°C until thawing for the consumer sensory study.
5.2.b. Shelf Life Study
5.2.b.i. Aerobic Plate Counts (APC)
Triplicate samples of peeled shrimp meat were removed from ice
storage every two days throughout the three week study to determine Aerobic
Plate Counts (APC) using the standard Petri film method (AOAC, 1999). The
Petri films were incubated at 37°C for 48 hours before enumeration and the
results were expressed as CFU/g.
5.2.b.ii. Proximate Analysis
Proximate analysis was carried out to determine the moisture, protein,
fat and ash content of the shrimp samples, carbohydrate content was assumed
to be negligible. Moisture and fat content was determined with a CEM
microwave moisture/fat analyzer (CEM Corp., Matthews, NC 28106). The
total nitrogen content was determined using a PrimacsSN - Protein - Nitrogen
Analyzer (Skalar Inc., Norcross, GA 30071), which uses the Dumas
combustion method. Protein content was determined by multiplying the total
nitrogen content by 6.25. Ash content was determined by combustion in a
Muffle furnace at 450ºC.

65
5.2.b.iii. TBARS
Triplicate samples of peeled shrimp meat were removed from iced
storage at two day intervals and analyzed for malonaldehyde levels using the
Thiobarbituric Acid Reacting Substances (TBARS) test to determine lipid
oxidation (Lemon, 1975). Fifteen grams of shrimp was digested with 30 ml of
an extraction solution containing 7.5 % trichloroacetic acid, propyl gallate and
ethylenediaminetetraacetic acid. The homogenate was separated by
centrifuging the samples at 2000 rpm for 15 minutes. 5 ml of the extract was
then mixed with 5 ml of TBA reagent (0.02 M thiobaribituric acid in water)
and heated in boiling water bath for 40 min. The solution was cooled and color
development was measured at 530 nm using a spectrophotometer. The standard
curve was prepared using the TEP standard (1,1,3,3 tetraethoxypropane).
Moisture and fat content was determined with a CEM microwave moisture/fat
analyzer (CEM Corp., Matthews, NC 28106).
5.2.c. Bioamines
The following bioamines were analyzed: putrescine and cadaverine. All
standard amine mixtures were prepared using 0.1 N HCL. Fluorinated anhydride
derivatives of amines were created using pentafluropropionic (PFP) anhydride as
the derivitizing agent. The derivitization procedure was based on the methodology
of Rogers et al. (2003). To a 1ml aliquot of hexanediamine internal standard
working solution varying volumes of putrescine-cadaverine standard working
solutions were added in a test tube along with 0.5 ml 1 N HCL. This mixture was
dried by nitrogen flushing at 50 - 60ºC. To the dried residue 1 ml ethyl acetate and

66
300 µl PFP anhydride was added and the mixture was heated at 50ºC for 30 min.
Within two hours after removal from water bath the resulting mixture was purified
using solid phase extraction as described by Rogers et al. (2003). The final effluent
collected from the solid phase extraction in 50% ethyl acetate-toluene solvent is
stable for at least 3 months when stored refrigerated in dark. Two micro liter of this
solution was injected into the GC.
5.2.c.i. GC Condtions
A gas chromatograph - Finnigan/Tremetrics Model 9001 (Waltham,
MA 02454), with 63Ni electron capture detector was used with the following
instrument modification for bioamine detection.
A DB-210 (30m*0.23 mm id*0.25 µm, 50% Trifluoroproply-
methylpolysiloxane) column and a HP-225 (30m*0.32 mm id*0.25 µm, 50%
CNPrPh ME Siloxane) column with the following temperature conditions were
used for putrescine and cadaverine derivatives. Temperature (ºC) injection port
270ºC, detector 350ºC, column uses helium as carrier gas with flow 3.0
ml/min; detector purge gas nitrogen 45 ml/min; detector makeup gas nitrogen
15 ml/min. Equipped with auto sampler CTC A200SE (Leap Technologies,
Chapel Hill, NC). LabQuest Chromatography Data System was used to control
instrumentation and integrate results (Finnigan Corp, Austin, TX)
Cold trapping was used to focus analytes on column initially with
column oven at 80ºC for one minute, increase temperature (20ºC/min) to
190ºC without hold, final increase temperature (8ºC/min) to 240ºC hold for 15
min., to get sharper resolution of peaks. Retention times of

67
pentafluoropropionic (PFP) derivatives on the DB 210 column were 8.36, 9.18,
and 9.79 and on the HP 225 column were 10.04, 10.70, and 11.15 respectively
for putrescine, cadaverine, and hexanediamine.
5.2.c.ii. Calibration Curves
Calibration curves were prepared by serially diluting a 1mg/ml solution
of putresciene and cadaverine standard stock solution. The concentrations of
bio amines used to prepare the standard curve were 0.5 µg/g, 1.0 µg/g, 2.0
µg/g, 5.0 µg/g, 10.0 µg/g and 0.25 µg/g, 0.5 µg/g, 1.0 µg/g, 2.5 µg/g, 5.0 µg/g
for cadaverine and putrescine respectively. Each of these solutions were
derivitized and the fluorinated derivatives were analyzed by GC using the
electron capture detector as mentioned earlier. The peak areas were calculated
and calibration curves were constructed based on triplicate runs of the standard
solutions.
5.2.c.iii. Shrimp Extraction
Triplicate samples of peeled shrimp meat were removed from ice
storage every three days and analyzed for putrescine and cadaverine
concentrations according to the Association of Official Analytical Chemists
(AOAC) Official Method 996.07 as modified by the FDA for shrimp using the
improved extraction solvent (75% methanol + 25% 0.4N HCL in 0.5% KCL)
(AOAC 1999; Rogers et al., 2003). Ten grams of shrimp was weighed and
transferred to a blender bowl, to this shrimp 60 ml of 75% methanol + 25%
0.4N HCL in 0.5% KCL was added and the mixture was blended at high speed
for 2 minutes. This slurry was then transferred to a 100 ml volumetric flask
68
rinsing the blender and the lid with the same extraction solvent and adding the
rinses to flask. The mixture was heated to 60ºC in a water bath for 15 min and
then allowed to cool at room temperature. The volume was made up by
diluting with the extraction solvent. This mixture was then chilled in an ice
bath for > 45 min. The methanol extracts were then filtered through coarse
filter paper. Five ml of this extract along with 1ml internal standard solution
and 0.5 ml HCL was then evaporated to dryness by nitrogen flushing and
heating at 50ºC. After all solvents were evaporated 2-3 ml of 75% methanol
was added and the mixture was dried again. To the dried residue of methanol
extract 300µl of PFP anhydride and 1 ml of ethyl acetate was added and the
mixture was heated to 50ºC for 30 min in a water bath. The resultant mixture
turned yellow and was purified using solid phase extraction within 2 hours, as
described by Rogers et al. (2003).
5.2.d. Consumer Sensory Study
The consumer sensory study was conducted at, LSU campus, Baton
Rouge, LA. On the morning of the consumer testing frozen samples were
removed from frozen storage and thawed to 10°C in a cooler. Each of the 254
consumers were presented with 12 coded raw shrimp samples 30 g each to
evaluate appearance and odor of the ozonated water treated and untreated
samples over two days. Each consumer, was provided with a scale and
descriptors, that was based on the National Marine Fisheries Service scale for
grading raw frozen shrimp (NMFS, 1993), and graded the samples on a four
point basis (4 = pass, 3 = borderline pass, 2 = borderline fail, 1 = fail).

69
5.2.e. Listeria Inoculation Study
Culture Growth Conditions
Listeria monocytogenes strain (serotype ½ a) and Listeria monocytogenes
strain (serotype 4b) obtained from the Centers for Disease Control, Atlanta
(CDC), GA., U.S.A., that was originally isolated from the blood of an infected
individual, was used during this study (CDC, 2002). The Listeria
monocytogenes cultures were grown for 18 hours in Brain Heart Infusion Broth
(BHI) (Difco, Detroit, Mich., U.S.A.) at 37oC. The pure cultures were stored
at -70°C and sub cultured twice in BHI Broth at 37°C for 24 h before being
used. Shrimp, brine frozen at sea were locally procured and hand peeled and
frozen until inoculation. The peeled shrimp samples were divided into two
groups containing 1000g of shrimp each and irradiated with UV radiation for
15 minutes on both sides. The 18 h L.monocytogenes cultures were decimally
diluted to 106 in phosphate-buffered saline (PBS). One milliliter of each L.
monocytogens culture individually dispensed from the pipette was inoculated
on each of the two groups of UV treated shrimp. The inoculums were allowed
to air dry on the shrimp samples for 25 minutes under a laminar flow hood.
Each of the two shrimp groups inoculated with the two strains of Listera was
then split into halves containing 500g each. One half of each strain inoculated
group was soaked in water for 60s (control) and the other half was soaked in 3
ppm ozonated water for 60s (treated). After treatment L. monocytogenes counts
were determined by making 1:1 dilutions of shrimp with PBS, stomaching for
2 min, making serial dilutions and plating the dilutions on Oxford agar with a
70
selective supplement (20 mg/liter each of cycloheximide, colistin sulphate,
acriflavine, cefoyetan, and fosfomycing; Oxoid, Hampshire, England). The
plates were then incubated for 48 h at 37ºC and the results were expressed as
CFU/g.
5.2.f. Statistical analysis
Triplicate samples were used for each analysis. One way ANOVA and
paired comparisons of means using students t test was carried out with JMPin®
software (Copyright © 1989–2000, SAS Institute Inc., Cary, NC). Significance
was set at α<0.05.
5.3. Results and Discussion
Proximate analysis showed little variability for shrimp meat
composition moisture, protein, fat and ash.
Table 5.1: Means and standard deviations, for proximate composition of commercially peeled shrimp meat (pooled samples)
Moisture % Protein % Fat % Ash %
Mean 85 13.85 0.24 0.91
STD 0.51 0.29 .013 .04
Figure 5.1 shows the Aerobic Plate Counts of the treated and untreated
shrimp samples stored on ice for a period of 18 days. Day 0 treated and
untreated shrimp showed similar counts. This can be attributed to the fact that
day 0 shrimp were of a high quality and correspond to < 48 hrs after
harvesting, that were rapidly cooled with ice and maintained at that
temperature under strict experimental conditions. An increase in bacterial

71
levels can be seen as the study progressed. Earlier work done in this laboratory
with shrimp purchased from a commercial peeling plant showed a significant
difference of 3 log CFU/g in bacterial loads between treated and untreated
shrimp. Ozone treated shrimp showed significantly lower counts as compared
to untreated shrimp on days 2, 4, 6, 8, 10 and 12. Treated shrimp took 14 days
to reach a bacterial load of 106 CFU/g where as the untreated shrimp took 10
days to reach a similar bacterial load. As can be seen from Figure 5.1 the
treated shrimp took a total of 16 days to reach bacterial loads greater than 107
CFU/g as compared to 12 days taken by untreated shrimp. The ozone treatment
seems to have delayed the lag phase of growth of aerobic bacteria on shrimp.
These results indicated that low initial loads of bacteria seen in treated
shrimp were a result of controlled handling of shrimp during this study
however one can expect higher bacterial loads in shrimp after mechanical
peeling and thus more opportunity for bacterial destruction with ozonated
water treatment of commercial shrimp.
Biogenic amine formation in shrimp increased from < 1 ppm of
putrescine and cadaverine in treated and untreated shrimp on day 0 to 5.2 ppm
putrescine and 3 ppm cadaverine in untreated shrimp on day 15 Figure 5.2.
Putrescine levels in shrimp increased at a faster rate as compared to the
cadaverine levels in treated and untreated shrimp with the highest level of
purtescine observed for day 15 untreated shrimp.

72
2.5
3.5
4.5
5.5
6.5
7.5
8.5
0 2 4 6 8 10 12 14 16 18
Days on Ice*Control samples were soaked in potable water for 60 seconds.
Log
CFU
/gOzone Control*
Figure 5.1: Aerobic Plate Counts of Peeled Shrimp Soaked in 3ppm Ozonated Water for 60 seconds
0
1.7
3.4
5.1
6.8
1 2 3 4 5 6Day 0 Day 3 Day 6 Day9 Day 12 Day 15 Days on Ice
*Control samples were soaked in potable water for 60 seconds.
Bio
geni
c A
min
es (p
pm) Putrescine-O3 Treated Putrescine-Control*
Cadaverine-O3 Treated Cadaverine-Control*
Figure 5.2: Biogenic Amine Production in Peeled Shrimp Soaked in 3 ppm Ozonated Water for 60 seconds

73
The putrescine levels in treated shrimp increased as the study advanced
but at a rate slower than the untreated shrimp. This can be attributed to the
differences in lag phase of the treated and untreated shrimp as indicated by the
aerobic plate counts (Figure 5.1). Lack of significant differences in the treated
and untreated shrimp may be attributed to the fact that different bacteria
produce biogenic amines at different rates and show variable destruction rates
and susceptibility to ozonated water treatment. The location of bacteria within
the tissue may also play a role in destruction by ozone and hence the extent of
bioamine produced.
Previous studies on the shelf life of shrimp stored at 0 C have shown
that shrimp that failed sensory evaluation contained putresciene at > 4.8 ppm
and cadaverine at > 1.3 ppm. For our study shrimp failing sensory evaluation
fall between days 12 and 15, these shrimp samples also exhibit high bacterial
counts as indicated by Figure 5.1.
No significant change in the TBARS value was observed between the
untreated and the treated samples over the period of the study Figure 5.3. Due
to the low levels of fat in the shrimp samples (<0.25 %) lipid oxidation as a
result of the use of ozonated water for processing shrimp is not a concern.

74
0.2
0.4
0.6
0 3 6 9 12 15Days on Ice
*Control samples were soaked in potable water for 60 seconds.
mg/
100g
Mal
onal
dehy
de
O3 Treated *Control
Figure 5.3: TBARS Values of Shrimp Soaked in 3ppm Ozonated Water for 60 seconds
The ordinal rank data from the consumer sensory study was analyzed
using PROC FREQ in SAS and computation of the Friedman statistic was
done using GraphPad Prizm®. The Friedman non-parametric statistical
analysis utilizing RBD can be used to analyze rank data It is more powerful
than Kramer test or Wilcoxon Rank Sum test as it eliminates unwanted sources
of variability (O Mahony, 1986). The Friedman test for odor and appearance
data indicates that the ozone treated shrimp and the untreated shrimp on
different days of iced storage are significantly different in preference. Post
tests included Dunn’s Multiple Comparison Test done using the GraphPad
Prizm software (Motulsky, 2003). The comparison of means of the treated and
untreated shrimp showed no significant difference in appearance and odor on
different days of storage on ice. The ordinal rank data from the four point scale

75
was extrapolated to two ordinal values of Pass (consisting of ranks 3 and 4 of
the four point scale) and Fail (consisting of ranks 1 and 2 of the four point
scale). The ozone treated shrimp did not exhibit odors attributed to the fail’
class for the period of storage on ice Figures 5.5a. The untreated shrimp
exhibited odors of the fail class on day12 and day 15 Figure 5.5c. Untreated
shrimp that exhibited odors of the fail class showed putrescine levels > 3 ppm
and cadaverine levels of >2 ppm in day 12 and day 15 of storage on ice Figure
5.5. However ozone treated shrimp held on ice on day 15 showed > 3 ppm
cadaverine but was classified as pass grade, indicating that consumers were
more sensitive to rise in cadaverine levels as compared to rise in putresciene
levels even though both bioamines are formed on at low temperature
decomposition of shrimp (Rogers et al., 2004). The APC in untreated shrimp
increased at a rate faster than the ozone treated shrimp Figure 5.1, however the
consumers were not able to predict the growth of bacteria in shrimp on the
basis of appearance Figures 5.6 b and 5.6d but they were able to do so on the
basis of increase in spoilage odors Figure 5.5 c and 5.5d. The shrimp that were
classified as failing sensory quality on the basis of decomposition odors
showed APC of > 107 CFU/g. It can also be noted from Figures 5.5 and 5.6
that the consumers consisting of the student population of LSU were able to
differentiate between the ozone treated and untreated shrimp on the basis of
decomposition odors but not on the basis of appearance, indicating that
appearance alone is not a suitable sensory criteria to indicate spoilage of
shrimp as a result of bacterial growth.

76
Peeled shrimp soaked in 3ppm ozonated water for 60 sec and
inoculated with L. monocytogenes serotype (1/2a) showed significant
reduction of up to 4.6 logs CFU/g and inoculated with L. monocytogenes
serotype (4b) showed significant reduction of up to 4.7 logs CFU/g as
compared to control samples soaked in potable water for 60 seconds. (Figure
5.4). Ozonated water treatment is an effective means to eliminate the threat of
Listeria. in shrimp processing environments. During the inoculation studies it
was observed that Listeria adhered well to the shrimp shells more as compared
to the peeled meat.
5.4. Conclusion
Ozonated water is an effective bactericidal agent and can improve the
quality and safety of peeled shrimp meat. Further work needs to be done to
evaluate the efficacy of ozonated water in improving quality and safety of
mechanically peeled shrimp processed in a commercial environment. Shelf life
of shrimp stored in ice based on bacterial loads was slightly extended by
soaking in 3 ppm dO3 for 60 seconds.
Bioamine production was not found to be reduced by the treatment, but
consumer sensory scores did indicate higher acceptability of ozone treated
shrimp samples at the end of the shelf life study. These conclusions are based
on the results for treating well handled and controlled shrimp samples with,
very low initial bacterial loads. Commercial processing operations will usually
encounter shrimp with much higher bacterial levels, thus greater initial
bacterial reduction can be expected due to ozonated water treatment.

77
This may also result in reduction of spoilage bacteria, improved sensory scores
and decreased bio amine content.
Additional work is needed to confirm these results with ozonated water
systems designed for commercial shrimp peeling processes.
01234
56789
O3 Treated *Control O3 Treated *Control Listeria monocytogenes 1/2 a Listeria monocytogenes 4b
*Control samples were soaked in potable water for 60 seconds
Log
CFU
/g
Figure 5.4: Shrimp Innoculated with Listeria monocytogenes Strains Soaked in 3 ppm Ozoanted Water for 60 seconds

78
0
10
20
30
40
50
60
70
1 2 3 4 5 6
0 3 6 9 12 15 Days on Ice
% S
enso
ry S
core
0
1
2
3
4
5
6
Bio
amin
es (p
pm)
Pass Fail Putrescine Cadaverine
a (O3 Treated)
0
10
20
30
40
50
60
70
1 2 3 4 5 60 3 6 9 12 15 Days on Ice
% S
enso
ry S
core
2.5
3.5
4.5
5.5
6.5
7.5
8.5
Log
CFU
/g
Pass Fail APC
b (O3 Treated)
0
10
20
30
40
50
60
70
1 2 3 4 5 60 3 6 9 12 15 Days on Ice
% S
enso
ry S
core
0
1
2
3
4
5
6
Bio
amin
es(p
pm)
Pass Fail Putrescine Cadaverine
c (*Control)
0
10
20
30
40
50
60
70
10 3 6 9 12 15 Days on Ice
% S
enso
ry S
core
2.5
3.5
4.5
5.5
6.5
7.5
8.5
9.5
Log
CFU
/g
Pass Fail APC
d (*Control)
Pass = Grades (1 + 2) Fail = Grades (3 + 4) APC = Aerobic Plate Counts. *Control Samples were soaked in potable water for 60 seconds. Figure 5.5: Percentage Sensory Scores of Shrimp Odor Soaked in 3ppm
Ozonated Water for 60 seconds

79
01020304050607080
1 2 3 4 5 60 3 6 9 12 15 Days on Ice
% S
enso
ry S
core
0
1
2
3
4
5
6
Bio
amin
es (p
pm)
Pass Fail Putrescine Cadaverine
a (O3 Treated)
01020304050607080
1 2 3 4 5 60 3 6 9 12 15 Days on Ice
% S
enso
ry S
core
2.53.54.55.56.57.58.59.5
Log
CFU
/g
Pass Fail APC
b (O3 Treated)
010203040506070
1 2 3 4 5 60 3 6 9 12 15 Days on Ice
% S
enso
ry S
core
0
1
2
3
4
5
6
Bio
amin
es (p
pm)
Pass Fail Putrescine Cadaverine
c (Control)
0
1020
3040
5060
70
1 2 3 4 5 60 3 6 9 12 15 Days on Ice
% S
enso
ry S
core
2.5
3.54.5
5.56.5
7.58.5
9.5
Log
CFU
/g
Pass Fail APC
d (Control) Pass = Grades (1 + 2) Fail = Grades (3 + 4) APC = Aerobic Plate Counts. *Control Samples were soaked in potable water for 60 seconds. Figure 5.6: Percentage Sensory Scores of Shrimp Appearance Soaked in
3ppm Ozonated Water for 60 seconds
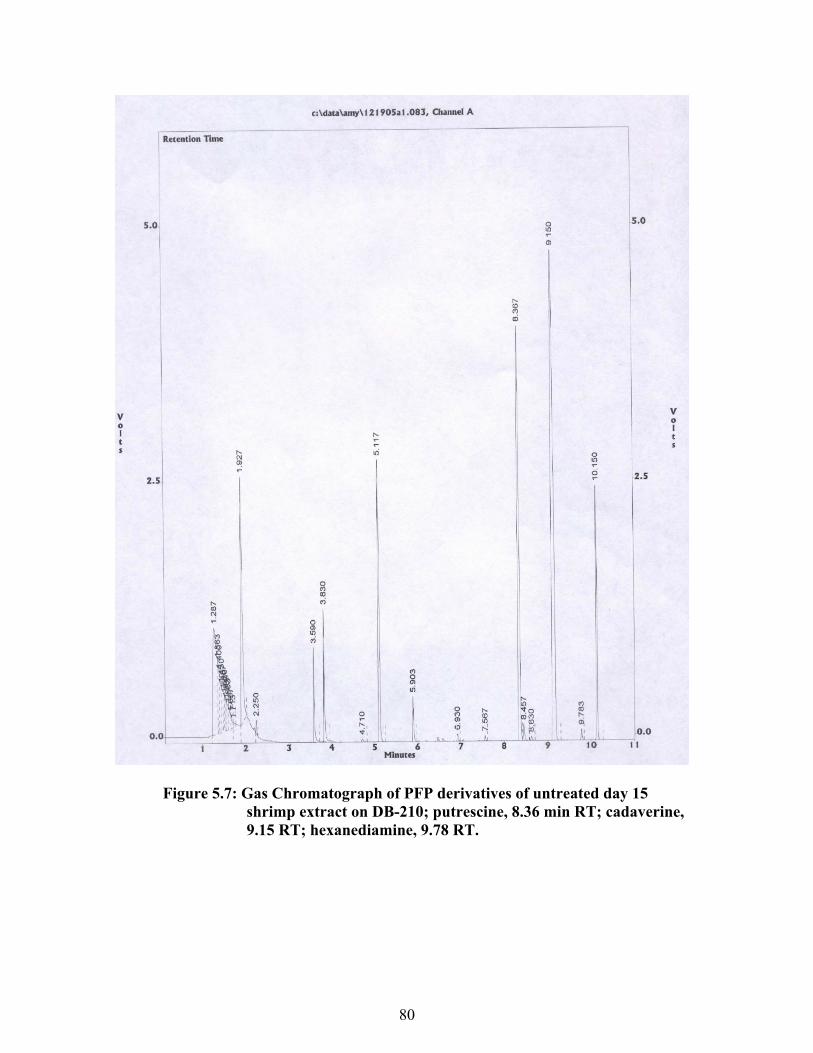
80
Figure 5.7: Gas Chromatograph of PFP derivatives of untreated day 15 shrimp extract on DB-210; putrescine, 8.36 min RT; cadaverine, 9.15 RT; hexanediamine, 9.78 RT.

81
Figure 5.8: Gas Chromatograph of PFP derivatives of untreated day 15
shrimp extract on HP-225; putrescine, 10.03 min RT; cadaverine, 10.69 RT; hexanediamine, 11.14 RT.
82
REFERENCES
Achen M, Yousef AE. 2001.Efficacy of ozone against Escherichia coli O157:H7 on apples. J Food. Sci. 66(9): 1380-1384.
Al-Haddad KSH. Al-Qassemi RAS. Robinson. RK. 2005. The use of gaseous ozone
and gas packaging to control populations of Salmonella infantis and Pseudomonas aeruginosa on the skin of chicken portions. Fd. Control. 16(5): 405-410.
Arnold SH, Brown WD. 1978 Histamine toxicity from fish products. Adv Food Res
23:113-54. Adler GA; Hill GR. 1984. Kinetics and Mechanism of Hydroxide ion catalyzed ozone
decomposition in aqueous solution. J Am. Chem. Soc. 72: 1950p. Anon. 2004. Shrimp wars. World Food Regulation Review 14(1): 19-20. Anon. 2005. FAQs on ozone. Food. Rev 32(9): 43-44. [AOAC] Assn. of Official Analytical Chemists. 1999. Official methods of analysis of
AOAC Intl. 16th e.d. Gaithersburg. Md. AOAC. Intl. Bader, H. and Hoine J. 1982. Determination of Ozone in Water by the Indigo Method.
A Submitted Standard Method, Ozone: Sci. Eng. 4:169. Baur S. Klaiber R. Hammes WP. Carle R. 2004. Sensory and microbiological quality
of shredded, packaged iceberg lettuce as affected by pre-washing procedures with chlorinated and ozonated water. Innov. Food Sci. Emerg. Technol. 5(1):45-55.
Beltran D, Selma M, Tudela JA. Gil MI. 2005a. Ozonated water extends the shelf life
of fresh-cut lettuce. J Agri Food Chem 53(14): 5654-5663. Beltran D, Selma M, Tudela JA. Gil MI. 2005b. Effect of different sanitizers on
microbial and sensory quality of fresh-cut potato strips stored under modified atmosphere or vacuum packaging. Post Harvest Biol Tech 37(1): 37-46.
Benner RA Jr., Staruszkiewicz WF, Otwell WS. and Rogers PL. 2003. Evaluation of
putrescine, cadaverine, and indole as chemical indicators of decomposition in penaeid shrimp. J Food Sci 68: 2178-2185.
Berg G, Chang SL, Harris EK. 1964. Devitalization of microorganisms by Iodin. Virol
22:469-481.

83
Bjeldanes LF, Schutz DE, Morris MM. 1978. On the aetiology of scombroid poisoning:cadaverine potentiation of histamine toxicity in the guinea pig. Food.Cosmetics. Toxicol. 16:157-159.
Bringmann G. 1954. Determination of the Lethal Activity of Chlorine and Ozone on
E. coli. Food. Hyg 139:130-139. Birks, S. 2003. Ozone Technology gets a Clean Break. Food Manuf 78(9): 63-64. Carpo C, Himelbloom B, Vitt S, Pedersen L. 2004. Ozone efficacy as a bactericide in
seafood processing. J of Aquatic Food Prod Tech 13(1): 111-123.
[CDC] Center for Disease Control. 2002. Multistate outbreak of Listeriosis. MMWR 49 (50),1129– 1130.
Chang SL. 1971. Modern concept of disinfection. J Sanit Eng Div Am Soc Civ Eng
97:689-707. Clark JP. 2003. New developments in sanitation help keep food plants clean. Food
Tech 57(10): 81-82, 87. Chawla A, Bell JW. 2006a. (Unpublished Data). Chawla A, Bell JW, Janes ME. 2006b. Development of a process to measure ozone
concentration in processing water at the point of product application. Ozone Sci Eng 26: 1-4
Coutts RT, Baker GB, Pasutto FH. 1986 Foodstuffs as sources of psychoactive amines
and their precursors Adv Drug Res 15:169-175. Cronholm LS.1976. Enteric virus survival in package plants and the upgrading of the
small treatment plants using ozone. Research Report No. 98, Water Resour Res Inst, Univ of Kentucky, Lexington, KY.
Dave SA. 1999. Efficacy of ozone against Salmonella enteritidis in aqueous
suspensions and on poultry meat. MSc. thesis. Columbus, Ohio, The Ohio State University. P 26-68.
Davidek T and Davidek J. 1995. Biogenic amines. In: Natural toxic compounds of
foods. J. Davidek. (ed.) pp.108-123. CRC Press. Boca Raton. Fl. DeMers LD, Renner RC. 1992. Alternative disinfection technologies for small
drinking water systems. AWWARF and AWWA, Denver, CO. DelOzone, 2004 Anti-Microbial Technology for the 21st Century. DVD-ROM. San
Luis Obispo, CA, 93401 USA.

84
DeSantis J. 2003. At Fulton Market, Gulf shrimp fight for seat at the table. Houma
Courier. Houma, LA. Dosti B, and Guzel-Seydim ZB. 2005. Effectiveness of ozone, heat and chlorine for
destroying common food spoilage bacteria in synthetic media and biofilms. Int. J. of Dairy Tech. 58(1): 19-24.
Dillon RA, Patel TR. 1992. Listeria in seafoods: A review. J Food Prot 55: 1009-
1015. Dubeau H, Chung YS. 1982. Genetic effects of ozone: Induction of point mutation and
genetic recombination in Saccharomyces cerevisiae. Mutat Res. 102:249-259. Elford WJ, Eude J. 1942. An investigation of the merits of ozone as an aerial
disinfectant. J Hyg 42: 240-265. Eklund MW, Poysky EJ, Paranjpye RN, Lashbrook LC, Peterson ME, Pelroy GA.
1995. Incidence and sources of Listeria monocytogenes in cold-smoked fishery products and processing plants. J. Food. Prot. 58: 502-508.
[EPA] 1991.Alternatinve disinfectants and oxidants guidance manual. Available from
http://www.watercache.com/docs/ozone-uv.pdf. Accessed 12/29/2005. Ewell AW. 1946. Recent ozone investigation. J. Appl. Phys 17:908-0911. Farooq S. 1976. Kinetics of inactivation of yeasts and acid-fast organisms with ozone.
Ph.D. Thesis, University of Illinois at Urbana-Champaign, IL. Farooq S.1977. The effect of ozone bubbles on disinfection. Ozone Sci. Eng.
9(2):233. FDA. Food and Drug Administration. 1982. GRAS Status of Ozone. Fed. Reg.
47:50209-502010. [FDA] Food and Drug Administration. 1996. Compliance policy guide (CPG)
7108.11. FDA Food Enforcement Handbook. 2nd e.d. p 99-100. Washington. D.C.: CRC Press LLC
[FDA] Food and Drug Administration. 1998. The food defect action levels.
Washington. D.C.: FDA. Available from: http://www.cfsan.fda.gov/~dms/dalbook.html. Accessed Jan 2006.
Fink RG., Ellis W, Pearsal C. 2004. Food surface sanitation tunnel. US 248671.
85
Frank HA. 1985. Histamine forming bacteria in tuna and other marine fish. Histamine in marine products; production of bacteria , measurement and prediction of formation. Pan. BS, James D. (ed.) pp. 2-3. FAO Fisheries Technical Paper 252.
Garcia, A, Mount, J.R, Davidson, P.M. 2003. Ozone and Chlorine Treatment of
Minimally Processed Lettuce. J of Food Sci. 68(9): 2747 – 2751. Giacobbe FW, Yuan JTC. 2005. Cold shock method improvements. US 519679. Giese AC, Christensen E. 1954. Effects of Ozone on Organisms. Physiol. Zool.
27:101. Ginn, R E, Packard, V., and Fox, T L. 1986.Enumeration of Total Bacteria
and Coliforms in Milk by Dry Rehydratable Film Methods:Collaborative Study. J.Assoc Off Anal Chem 69 (3): 527-531.
Glaze WH, Koga M, Cancilla D. 1987. The chemistry of water treatment processes involving ozone, hydrogen peroxide, and ultraviolet radiation. Ozone Sci. Eng. 9(4):335.
Glaze WH, Kang JW. 1988. Advanced oxidation processes for treating groundwater
contaminated with TCE and PCE: Laboratory Studies. Am Water Works Assoc J 88(5):57- 63.
Goldstein BD, McDonagh EM. 1975. Effect of Ozone on cell membrane protein
fluorescence in vitro studies utilizing the red cell membrane. Environ Resour 9:179-186.
Gordon G, Cooper WJ, Rice RG, Pacey GE. 1992. Disinfectant residual measurement
methods, 2nd ed. AWWARF and AWWA, Denver, CO. Graham DM. 1997. Use of ozone for food processing. Food. Tech. 51: 72-75. Greene AK, Few BK, Serafini JC. 1993. A Comparison of ozone and chlorination for
the disinfection of stainless steel surfaces. J. Dairy Sci. 76:3617-3620 Grimes HD, Perkins KK, Boss WF. 1983. Ozone degrades into hydroxyl radical under
physiological conditions. Plant Physiol 72: 1016–1020. Grob RL, Barry EF. 2004. Modern practice of gas chromatography. 4th ed. John Wiley
& Sons, inc. Hoboken, New Jersey. Guay C, Rodriguez M, Serodes J. 2005. Using ozonation and chloramination to reduce
the formation of trihalomethanes and haloacetic acids in drinking water. Desalinatn 176(1-3): 229-240.

86
Guerin B. 1963. Doctor of Pharmacy thesis at University of Paris. Quoted in RK. Hoffman. 1971. Toxic gases chapter 4, p. 255-258. Inhibiton and destruction of the microbial cell. W. B. Hugo(ed) Academic pres, New York.
Guzel-Seydim ZB. 1996. The Use of Ozonated Water as a Cleaning Agent in Dairy.
Thesis. Processing. Suleyman demirel University, 32260 Cunur, Isparta, Turkey.
Guzel-Seydim ZB, Greene AK, Seydim AC. 2003. Use of ozone in the food industry.
Swiss Soc of Food Sci and Tech. 37: 453 – 460. Haby M, Miget R, Falconer L, Graham G. 2002. A review of current conditions in the
Texas shrimp industry, an examination of contributing factors and suggestions for remaining competitive in the global shrimp market. Extension Economics Staff Paper, TAMU-SG-03-701. 26 p.
Hamelin C. 1985. Production of single- and double-strand breaks in plasmid DNA by
ozone. Int J Radiat Oncol-Biol-Phys. 11(2):253–257. Harakeh MS, Butler M. 1984. Factors influencing the ozone inactivation of Enteric
viruses in effluent. Ozone Sci. Eng. 6:235-243. Hoigné J, Bader H. 1975. Ozonation of water: role of hydroxyl radicals as oxidizing
intermediates. Sci. Vol. 190. pp. 782. Hoigné J, Bader H.1977. The role of hydroxyl radical reactions in ozonation processes
in aqueous solutions. Water Res. 10:377-386. Hoigné J, Bader H. 1981. Colorimetric method for the measurement of aqueous ozone
based on the decolorization of indigo derivatives. In: Ozonization Manual for Water and Wastewater Treatment. W.J. Masschelein (ed.) John Wiley and Sons. Inc., New York.
Hoigné J, Bader H. 1983a. Rate constants of reaction of ozone with organic and
inorganic compounds in water - I. Non-dissociating Organic Compounds. Water Res. 17:173- 183.
Hoigné J, Bader H. 1983b. Rate constants of reaction of ozone with organic and
inorganic compounds in water - II. Dissociating Organic Compounds. Water Res. 17:185-194.
Hovarth M, Bilitzky L, Huttner J. 1985. Field of utilization of ozone. p. 257-316. in R.
J. H. Clark (ed.). Ozone . Elsevier Science Publishing Co., Inc. New York. IFT Sensory Evaluation Division. 1981. Sensory Evaluation Guide for testing food
and beverage products. Food. Tech. 35(1):50.

87
IOA (International Ozone Association). 1989. Photometric measurement of low ozone
concentrations in the gas phase. Standardisation Committee-Europe. Ingram M, Haines RB. 1949. Inhibiton of bacterial growth by pure ozone in the
presence of nutrients. J Hyg. 47:146-158. Ishizaki K, Shinriki N, Ikehata A, Ueda T. 1981. degradation of nucleic acids with
ozone. I. Degradation of nucleobases, ribonucleosides and ribonucleoside-5’-monophosphates. Chem Pharm Bull. 29:868-872.
Janda. V, Pech P, Pechova M. 2004. Disinfection of water and its undesirable by-products. Chem Tech 50(11-12): 335-340.
Jahncke ML, Collette, Hicks D, Wiedmann M, Scott VN, Gall K. 2004. Treatment
options to eliminate or control growth of Listeria monocytogenes on raw material and on finished product for the smoked fish industry. Food. Prot Trends 24(8): 612-619.
Kataoka H. 1996. Derivatization reactions for the determination of amines by gas
chromatography and their applications in environmental analysis. J Chromatogr. 733(1) 19-34.
Katzenelson E. 1974. Inactivation Kinetics of viruses and bacteria in water by use of
Ozone. Am Water Works Assoc J 66:725-729. Khadre M.A, Yousef AE. 2002. Susceptibility of human rotavirus to ozone, high
pressure, and pulsed electric field. J of Food Prot 65(9): 1441-1446. Khayat A. and Schwall D. 1983. Lipid oxidation in seafood. Food Technol. 37:130-
140. Kim CK. 1980. Mechanism of Ozone Inactivation of Bacteriophage f2. Appl. Environ.
Microbiol. 39:210-218. Kim, J-G. 1998 Ozone as an Antimicrobial Agent in Minimally Processed Foods.
Ph.D. Thesis. The Ohio State University, Coulmbus, OH. 247 p.
Kim JG, Yousef AE. 1999. Application of ozone for enhancing the microbiological safety and quality of foods: a review. J of Food Prot 62: 1071-1087.
King, E.O., Ward, M.K., and Raney, D.E. 1954 Two simple media for the
demonstratoin of pyocyanin and fluorescein. J Lab Clin Med 44; 301-307. Kinman R.N. 1975. Water and Wastewater Disinfection with Ozone: A Critical
Review. Crit Rev Environ Contr. 5:141-152.
88
Klaiber RG, Baur S, Magel L, Hammes WP and Carle R. 2004 Quality of shredded, packaged carrots as affected by different washing treatments, J. Food. Sci. 69(4):161-166.
Klaptchuk P. 2005. Apparatus and method for destroying prions with a combination of
microwaves and ozone. CA 2435033. Koetters, J., Prahst, A., Skura, B., Rosenthal, H., Balck, E.A. and Rodigues-Lopez, J.
1997. Observations and Experiments on Extending Shelf Life of Rockfish (Sebastes spp.) Products with Ozone. J Appl Ichthyol. 13: 1-8.
Koidis P. Bori M. Vareltzis K. 2000. Efficacy of ozone treatment to eliminate
Salmonella enteritidis from eggshell surface. Arch. Meat Fish Dairy Sci. 51(1): 4-6.
Koseki S, Isobe S. 2006. Effect of ozonated water treatment on microbial control and
on browning of iceberg lettuce (Lactuca sativa L.). J Food. Prot 69(1): 154-160.
Kottapalli B, Wolf-Hall CE, Schwarz P. (2005). Evaluation of gaseous ozone and
hydrogen peroxide treatments for reducing Fusarium survival in malting barley. J Food. Prot 68(6): 1236-1240.
Kramer A, Kahan G, Cooper D, and Paravasilion A, 1974. A non-parametric ranking
method for the statistical evaluate of sensory evaluation. Chem Senses 1:121-133.
Langlais B, Perrine D. 1986. Action of Ozone on Trophozoites and Free Amoeba
Cysts, Whether Pathogenic of Not. Ozone Sci. Eng. 8(3):187-198. Langlais B, Reckhow DA, Brink DR (editors). 1991. Ozone in Drinking Water
Treatment: Application and Engineering. AWWARF and Lewis Publishers, Boca Raton, FL.
Lee ., S. E. Martin, Yoon H, Park Y, Kim C. 1998. Metabolic sites of ozone injury in
Listeria monocytogenes. Food Sci and Technol 7(3): 201-204. Lemon, D W. 1975. An improved TBA test for rancidity. Env. Canada:New Series
Circular No. 51:24-27. Maga J.A.1978 Amines in foods. Crit Rev Food. Sci Nutr. 10(4):373-403. Masschelein WJ. 1977. Spectrophotometric determination of residual ozone in water
with ACVK. Am Water Works Assoc J 69:461-462.
89
McNair, HM; Miller JM.1998. Basic Gas Chromatography, John Wiley & Sons: New York.
Mietz JL, Karmas E. 1978. Polyamine and histamine content of rockfish, salmon,.
lobster, and shrimp as an indicator of decomposition. J Ass Off Anal Chem 61(1):139-145.
Moore G, Griffith C. (2000). Bactericidal properties of ozone and its potential
application as a terminal disinfectant. J Food Prot 63(8): 1100-1106. Morris, JC. 1975. Aspects of the Quantitative Assessment of Germicidal Efficiency.
Disinfection: Water and Wastewater. J.D. Johnson (ed). Ann Arbor Science Publishers, Inc., Ann Arbor, MI.
Motulsky HJ. 2003. Prizm 4 Statistics Guide - Statistical analysis for laboratory and
clinical researchers. GraphPad Software Inc., San Deigo, CA. ww.graphpad.com.
Mura C, Chung YS. 1990. In vitro transcription assay of ozonated T7 phage DNA.
Environ. Mol Mutagen 16:44-47. NACMCF. 1991. Listeria monocytogenes. Recommendations by the National
Advisory Committee on Microbiological Criteria for Foods. International J. Food Microbiol. 14:185-246.
NMFS. 2006. Personal communication. Silver Springs, MD: National Marine
Fisheries Service, Fisheries Statistics Division. http://www.st.nmfs.gov/st1. NMFS. 1993 Inspectors Guidelines for Grading Fresh or Frozen Shrimp 28 p. Novak J S, Yuan JTC, 2003. Viability of Clostridium perfringens, Escherichia coli,
and Listeria monocytogenes surviving mild heat or aqueous ozone treatment on beef followed by heat, alkali, or salt stress. J of Food. Prot. 66(3): 382-389.
Novak J S, Yuan JTC, 2004. Increased inactivation of ozone-treated Clostridium
perfringens vegetative cells and spores on fabricated beef surfaces using mild heat. J of Food. Prot 67(2): 342-346.
O’Mahony M. 1986. Sensory Evaluation of Food: Statistical Methods and Procedures.
Marcel Dekker. Inc. New York. NY. Pearson A M. Gray J I. Wolzak A.M. and Horenstein N A. 1983. Safety implications
of oxidized lipids in muscle foods. Food Technol 37:121-129.

90
Petrukhina. IO., Kriukova. YV. 2003. A sensory analysis. Practical application of the method of ranking when replacing raw materials suppliers. Pishch Promst Moscow. 2003(4): 38-40.
Prudente AD Jr, King KJ, 2002. Efficacy and safety evaluation of ozonation to
degrade aflatoxin in corn. J of Food. Sci. 67(8): 2866-2872. Rawles DD, Flick GJ,1996 Biogenic amines in fish and shellfish. Adv. Food Nutr.
Res. 39: 329-365. Rajowski K. Rice EW. 2004. Effect of alfalfa seed washing on the organic carbon
concentration in chlorinated and ozonated water. J Food Prot. 67(4): 813-817. Reagan JO, Acuff GR. (1996). Trimming and washing of beef carcasses as a method
of improving the microbiological quality of meat. J Food Prot 59(7). Restaino L, Frampton EW, Hemphil JB, Palnikar P, 1995. Efficacy of ozonated water
against various food-related microorganisms. App Environ Microbiol 61(9). Rice RG, Farguhar JW, Bollyky LJ.1982. Review of the Applications of Ozone for
Increasing Storage Times of Perishable Foods. Ozone Sci Eng 4: 147-163. Rice RG. 1996. Ozone Reference Guide. Electric Power Research Institute, St. Louis,
MO. 78. Rice SL. Koehler PE. 1976 Biologically active amines in food: a review J Milk Food
Technol 39:166-169. Riesser VW. 1976.Possible Mechanisms of Poliovirus Inactivation by Ozone. Forum
on Ozone Disinfection, EG. Fochtman RG, Rice MEL, Browning (ed), pp. 186-192, International Ozone Institute, Syracuse, NY.
Robbins JB, Fisher CW, Moltz AG, Martin SE, 2005. Elimination of Listeria
monocytogenes biofilms by ozone, chlorine, and hydrogen peroxide. J Food. Prot 68(3): 494-498.
Rodgers SL, Cash JN, Siddiq M, Ryser ET. 2004. A comparison of different chemical
sanitizers for inactivating Escherichia coli O157:H7 and Listeria monocytogenes in solution and on apples, lettuce, strawberries and cantaloupe. J Food. Prot 67(4): 721-731.
Rodriguez-Romo LA,Yousef AE, 2005. Inactivation of Salmonella enterica serovar
Enteritidis on shell eggs by ozone and UV radiation. J of Food. Protection 68(4): 711-717.

91
Rogers PL, Staruszkiewicz WF, Otwell WS, Benner RA Jr. 2004. Putrescine, Cadaverine, and Indole Production by Bacteria Isolated from Wild and Aquacultured Penaeid Shrimp Stored at 0, 12, 24, and 36 C. J Food. Protect 67: 124-133.
Rorvik LM, Aase B, Alvestad T, Caugant DA. 2000. Molecular epidemiological
survey of Listeria monocytogenes in seafoods and seafood-processing plants. App Environ Microbiol 66(11): 4779 – 4784.
Rosen HM. 1972. Ozone generation and its relationship to the economical application
of ozone in wastewater treatment, P. 101-122. IN F.L. Evans, III (ed), Ozone in water and wastewater treatment. Ann Arbor Sci. Publish., Inc, Ann Arbor, Mich.
Roy, D. 1979. Inactivation of Enteroviruses by Ozone. Ph.D. Thesis, University of
Illinois at Urbana-Champaign. Ryser ET. and Marth EH. (eds.). 1999. Listeria, Listeriosis, and Food Safety, 2nd ed.,
Marcel Dekker, Inc., N.Y. 630 pp. SAS. Statistical Methods: Analysis of Variance. SAS Institute, Cary, NC. (1999-
2000). Serra R. Abrunhosa L. Kozakiewicz Z. Venancio A. Lima N. 2003. Use of ozone to
reduce molds in a cheese ripening room. J Food Prot. 66(12): 2355-2358. Schwab D. 2005 Unpublished data. New Orleans, LA: Paul Piazza and Sons, Ltd. Scott DBM, Lesher EC. 1963. Effect of Ozone on Survival and Permeability of
Escherichia coli. J Bacteriol 85:567-576. Sharma RR. Demirci A. Beuchat LR. Fett WF. 2002. Inactivation of Escherichia coli
O157:H7 on inoculated alfalfa seeds wtih ozonated water and heat treatment. J Food Prot. 65(3): 447-451.
Silva da, M.A., Gibbs, P.A. and Kirby, R M. 1998. Sensorial and Microbial Effects of
Gaseous Ozone on Fresh Scad(Trachurus trachurus) J. App. Micro. 84: 802-810.
Smith D.M, D. S. Winger, Brown JN, 2002. Cold water disinfection of foods. INC.
EPFSS. US 420372. Son H, M. Cho. Kim J. Oh B. Chung H. and Yoon J. 2005. Enhanced disinfection
efficiency of mechanically mixed oxidants with free chlorine. Water Res 39(4): 721-727.
92
Sorlini S. and Collivignarelli C. 2005. Trihalomethane formation during chemical
oxidation with chlorine, chlorine dioxide and ozone of ten Italian natural waters. Desalinatn 176(1-3): 103-111.
Sproul, OJ. and Kim CK. 1982. The Mechanism of Ozone Inactivation of Waterborne
Viruses. Water Sci. Technol. 14:303-314. Staehelin J. Bühler RE. and J. Hoigné. 1984. Ozone decomposition in water studies by
pulse radiolysis. 2 OH and HO4 as Chain Intermediates. J. Phys. Chem. 88:5999-6004.
Staehelin J. Hoigne J. 1985. Decomposition of Ozone in Water in the presence of
Organic Solutes Acting as Promoters and Inhibitors of Radical Chain Reactions, Env. Sci. Tech. 19:1206-1213.
Steenstrup LD. Floros JD. 2004. Inactivation of E. coli O157:H7 in apple cider by
ozone at various temperatures and concentrations. J Fd Process. Preserv. 28(2): 103-116.
Take K. and Skhirtladze L. 2006. Novel synergistic rapid-sanitization method. US
590712. Tarladgis BG. Watts BM. and Younathan MT. 1960. A distillation method for the
quantitative determination of malonaldehyde in rancid foods. J. Am. Oil Chem. Soc. 37:44.
Tomiyasu H, and Gordon G. 1984. Colorimetric determination of ozone in water
based on reaction with bis-(terpyridine)iron(II). Anal Chem. 56:752-754. Troyan, J.J. and S.P. Hansen. 1989. Treatment of microbial contaminants in potable
water supplies technologies and costs. Noyes Data Corp., Park Ridge, NJ. [USDA]. Code of Fed. Reg. 1997 Title 9. Part 381.66 Poultry Products; Temperatures
and Chilling and Freezing Procedures. Office of the Federal Register National Archives and Records Administration, Washington, DC.
Vaughn JM, Chem YS, Lindburg K, Morales D. 1987. Inactivation of Human and
Simian Rotaviruses by Ozone. Appl Env Microbiol 53:2218-2221. Wade WN. Scouten AJ. McWatters KH. Wick RL. Demirci A. Fett WF. Beuchat LR.
2003. Efficacy of ozone in killing Listeria monocytogenes on alfalfa seeds and sprouts and effects on sensory quality of sprouts. J Food Prot. 66(1): 44-51.
93
Warriner KF. Ibrahim F, Dickinson M, Wright C. and Waites WM. 2005. Seed decontamination as an intervention step for eliminating Escherichia coli on salad vegetables and herbs. J of the Sci. of F. Agric 85(13): 2307-2313.
Wendakkoon CN.and Sakaguchi M. 1992. Effects of spices on growth and biogenic
amine formation by bacteria in fish muscle. Quality Assurance in the Fish Industry. Huss HH. Jakobsen M. and Liston J (ed). 30:305-313. Elsevier, Amsterdam.
Wickramanayake, G.B. Rubin AJ. and Sproul OJ. 1984a. Inactivation of Naegleria and
Giardia cysts in Water by Ozonation. J Water Pollut Contr Fed. 56(8):983-988. Wickramanayake, G.B. 1984c. Kinetics and Mechanism of Ozone Inactivation of
Protozoan Cysts. Ph.D. dissertation, Ohio State University, Columbus, OH. Williams RC. Sumner SS. and D.A. Golden. 2005. Inactivation of Escherichia coli
O157:H7 and Salmonella in apple cider and orange juice treated with combinations of ozone, dimethyl dicarbonate, and hydrogen peroxide. J Food. Sci. 70(4): 197-201.
Yen GC. and Hsieh CL. 1991. Simultaneous analysis of biogenic amines in canned
fish by HPLC J Food. Sci 56: 158-160. Young R. (2000). Rethinking sanitation. Food. Eng 72(6): 91-94. Yoshizaki T. Miura K . Ueda T. 1988. Mechanism of inactivatin of tobacco mosaic
virus with ozone. Water Res. 22(7): 933-938. Yuan JTC. Steiner EF. 2000. Method of disinfecting a foodstuff using gaseous ozone. US
159095. Zhang L, Lu Z, Yu Z. and Gao X. 2005. Preservation of fresh-cut celery by treatment
of ozonated water. Food. Control 16(3): 279-283. Zhanggui, Q. Xiaoping Y. and Xia W. (2003). Trials of ozone reducing pesticide
residues in grain. Grain Storage 32(3): 10-13.

94
APPENDIX : SENSORY QUESTIONNAIRES RESEARCH CONSENT FORM I, _________________________, agree to participate in the research entitled
“Consumer Acceptance of Ozone Treated Shrimp,” which is being conducted by Dr.
Jon Bell, Assist. Professor of the Department of Food Science at Louisiana State
University, phone number (225) 578-5188.
I understand that participation is entirely voluntary and whether or not I participate
will not affect how I am treated on my job. I can withdraw my consent at any time
without penalty or loss of benefits to which I am otherwise entitled and have the
results of the participation returned to me, removed from the experimental records, or
destroyed. Two hundred consumers will participate in this research. For this particular
research, about 15-minute participation will be required for each consumer.
The following points have been explained to me:
1. In any case, it is my responsibility to report prior participation to the investigators
any allergies I may have.
2. The reason for the research is to gather information on consumer sensory
acceptability of ozone treated shrimp samples. The benefit that I may expect from it is
a satisfaction that I have contributed to solution and evaluation of problems relating to
such examinations.
3. The procedures are as follows: Twelve coded samples will be placed in front of
me, and I will evaluate them by normal standard methods and indicate my evaluation
on score sheets. All procedures are standard methods as published by the American
Society for Testing and Materials and the Sensory Evaluation Division of the Institute

95
of Food Technologists.
4. Participation entails minimal risk: As I do not have to ingest the samples but only
evaluate them for their appearance and odor.
5. The results of this study will not be released in any individual identifiable form
without my prior consent unless required by law.
6. The investigator will answer any further questions about the research, either now
or during the course of the project.
The study has been discussed with me, and all of my questions have been answered. I
understand that additional questions regarding the study should be directed to the
investigators listed above. In addition, I understand the research at Louisiana State
University AgCenter that involves human participation is carried out under the
oversight of the Institutional Review Board. Questions or problems regarding these
activities should be addressed to Dr. David Morrison, Associate Vice Chancellor of
LSU AgCenter at 578-8236. I agree with the terms above.
_______________________________ ________________________________
Signature of Investigator Signature of Participant
Date: __________________________ Witness: _________________________

96
Sensory Quality Indicators – Raw Shrimp
Grade Appearance and Texture
Odor
4 High Pass Translucent, Shiny, Firm, Resilient Moist, Shell Translucent
Fresh Ocean Air, Clean Seaweed, Pond water
3 Mid Pass to Borderline Pass
Sl. Opaque, Sl. Shiny, Sl. Firm, Sl. Resilient, Sl. Opaque shell Slight Mod. Opaque, Sl.. Dull, Surface Dry, Moderately Soft, Sl. Varied Color, Faded, Sl. Yellow Pink or Gray, Shell Sl. Pitted
Neutral Mod. Fishy, Cardboardy, Oxidized, Sl. Musty Sl. Sulfur

97
Sensory Quality Indicators – Raw Shrimp 2 Borderline
Fail to Mid Fail
Opaque, Cooked Appearance, Dull, Sticky, Grainy, Soft, Sl. Mushy, Yellowish, Brownish, Sl. Gray, Pitted Shell Mod-Strong Opaque, Mod-Strong Yellow, Mod-Strong Gray, Mod. Mushy, Grainy, Sl. Pasty, Sl. Slimy
Sl. Sour, Sl. Cheesy, Sl. Rancid, Sl. Yeasty, Mod. Strong fishy, Sl. Indole, Sl. Taint, Sl. Sickly Sweet Sl. Ammonia, Sl. Musty/Moldy Mod. Sour, Sl. Fecal, Mod Rancid, Painty, Mod. Cheesy, Mod. Pungent, Mod Ammonia, Mod. Taint, Mod. Sickly Sweet, Mod. Musty/Moldy

98
Sensory Quality Indicators – Raw Shrimp 1 Strong
Fail Strongly Opaque, Cooked Appearance, Strongly Gray, Strongly Mushy, Grainy, Pasty, Strongly Dry, Strongly Slimy.
Strongly Sour, Cheesy, Butyric, Mod-Strong Fecal, Strongly Putrid, Str. Ammonia, Str. Rancid, Painty, Str. Fermented, Str. Pungent, Str. Taint, Str. Sickly Sweet, Mod. Musty/Moldy
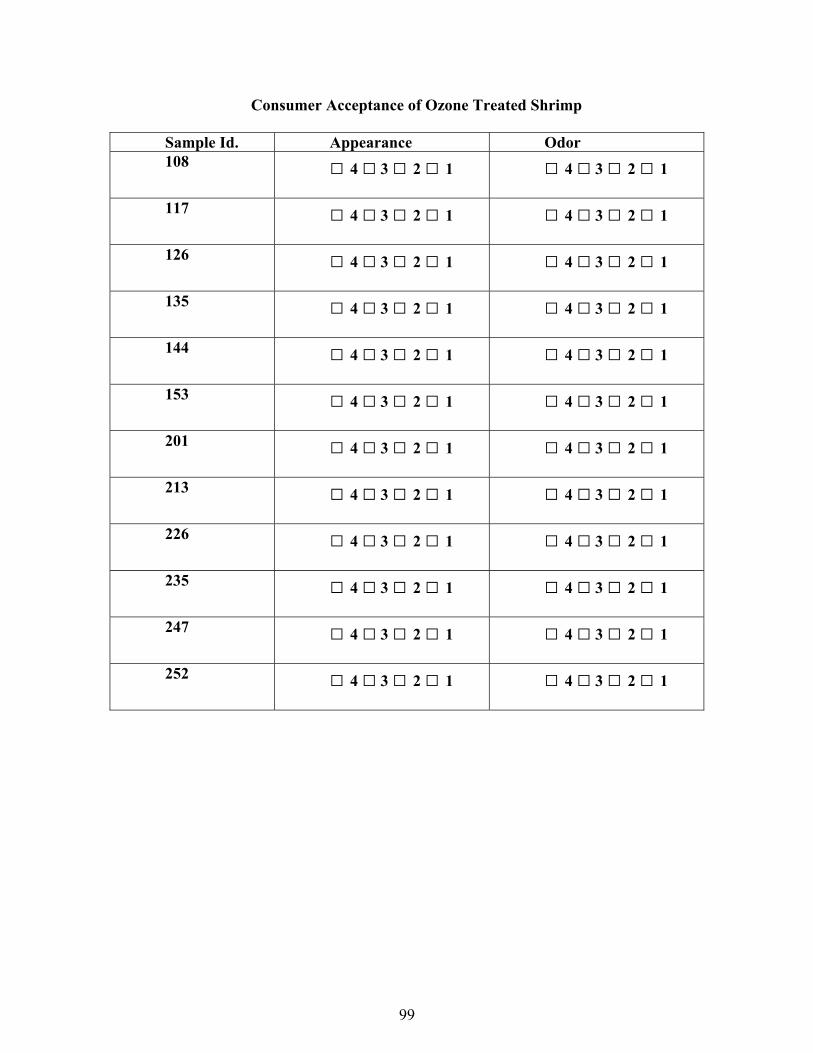
99
Consumer Acceptance of Ozone Treated Shrimp Sample Id. Appearance Odor 108 □ 4 □ 3 □ 2 □ 1
□ 4 □ 3 □ 2 □ 1
117 □ 4 □ 3 □ 2 □ 1
□ 4 □ 3 □ 2 □ 1
126 □ 4 □ 3 □ 2 □ 1
□ 4 □ 3 □ 2 □ 1
135 □ 4 □ 3 □ 2 □ 1
□ 4 □ 3 □ 2 □ 1
144 □ 4 □ 3 □ 2 □ 1
□ 4 □ 3 □ 2 □ 1
153 □ 4 □ 3 □ 2 □ 1
□ 4 □ 3 □ 2 □ 1
201 □ 4 □ 3 □ 2 □ 1
□ 4 □ 3 □ 2 □ 1
213 □ 4 □ 3 □ 2 □ 1
□ 4 □ 3 □ 2 □ 1
226 □ 4 □ 3 □ 2 □ 1
□ 4 □ 3 □ 2 □ 1
235 □ 4 □ 3 □ 2 □ 1
□ 4 □ 3 □ 2 □ 1
247 □ 4 □ 3 □ 2 □ 1
□ 4 □ 3 □ 2 □ 1
252 □ 4 □ 3 □ 2 □ 1
□ 4 □ 3 □ 2 □ 1
100
VITA
Amrish Suresh Chawla, was born in the historical city of Meerut in the state of
Uttar Pradesh, India, on July 6th 1980. He then moved to Mumbai, the business
capital of India, for his primary education and later to the cultural city of
Baroda for completing his secondary education.
He joined the B.Tech Dairy Technology program at the S.M.C. College of
Dairy Science,, situated in the milk capital of India, in the city of Anand in
1998. This institute is recognized as a center of excellence by the apex Indian
governmental body – Indian Council of Agricultural Research (ICAR). He
graduated with a first class in 2002.
After graduation he joined Vasudhara Dairy, Billlimora, India as a Quality
Control and Production Supervisor. Here, he worked on establishing a food
microbiology laboratory and upgrading the key systems of food sanitation and
safety in the plant. He was also part of the product development, ISO and
HACCP certification teams.
In January 2004, Amrish started working on his master’s degree at Louisiana
State University at the Department of Food Science, under the guidance of Dr.
Jon Bell. He is a candidate for that degree and will start working as a Research
Associate with LSU upon graduation.