application of modern network theory to analysis of … · application of modern network theory ......
TRANSCRIPT

NASA
d m -9 0
d
TECHNICAL NOTE
APPLICATION OF MODERN NETWORK THEORY TO ANALYSIS OF MANNED SYSTEMS
by John C. Fakan
Lewis Research Center
N A T I O N A L AERONAUTICS A N D SPACE A D M I N I S T R A T I O N W A S H I N G T O N , D. C. OCTOBER 1970 i i ! i
<6 ,
https://ntrs.nasa.gov/search.jsp?R=19700032588 2018-07-01T04:24:46+00:00Z

TECH LIBRARY KAFB, NM
~~ .
17. Key Words ( S u g g e s f e d b y A u t h o t r s ) )
Modern Network Theory Manned Sys tems
0332777
18. Distribution Statement
Unclassified - unlimited
- 2. Government Accession No. i -
-
I . Report No. NASA T N D-6034 .~
4. T i t l e and Subtitle APPLICATION OF MODERN NETWORK THEORY T O ANALYSIS OF MANNED SYSTEMS
19. Security Clasr i f . (of this report)
-
7. Author(s1
- ~~ John C. F a k a n 9. Performing Organization Name and Address
Lewis R e s e a r c h Center National Aeronaut ics and Space Adminis t ra t ion Cleveland, Ohio 44135
20. Security Classif. (of this page) 21. No. of Pages 22. P r i c e *
2. Sponsoring Agency Name and Address
National Aeronaut ics and Space Admini st rat ion Washington, D. C. 20546
-- . .
15. Supplementary Notes
3. Recipient's Catalog No.
5. Report Date October 1970
6. Performing Organization code
8. Performing Organization Report No.
E-5612 IO. Work Unit No.
129-02 1. Controct or Grant No.
13. Type of Report and Period Covered
Technical Note
14. Sponsoring Agency Code

APPLICATION OF MODERN NETWORK THEORY TO
ANALYSIS OF MANNED SYSTEMS
by John C. Fakan
Lewis Research Center
SUMMARY
The techniques of Modern Network Theory are modified and expanded t o provide a generalized methodology for the analysis of systems that contain man as a functioning part .
system, by characterizing the phenomenological appearance of man in each of his func- tional roles , i s described. human parameters a r e discussed, and a se r i e s of physiological measurements a r e de- scribed which indicate that human heart ra te can provide a useful measure of total work output in the engineering sense.
A sample man-machine system modeled af ter an experience of two men involved in a representative system of this type is presented, along with a s e r i e s of resul ts which demonstrate the recovery response of this system of stochastic perturbations such as an event which prevents sleep during one of the system "nights. l 1
is included in the appendix.
the analysis of urban renewal, finance, and social behavior problems as well as anal- yses of proposed manned planetary expeditions.
An approach to the formulation of the systems equations that describe a human sub-
The problems associated with metering of the significant
A FORTRAN IV computer program developed for the analysis of this type of system
Further possible uses for the generalized methodology are suggested, including
INTRODUCTION
The success of the Apollo Program in landing man on the Moon i s most certainly only the first of what wi l l be a series of manned expeditions t o the Moon and the planets. Other types of missions which may be considered in the future include in the following:
(1) Manned orbiting research laboratories

(2) Permanent manned lunar scientific bases (3) Manned operations for the recovery of lunar natural resources (4) Manned planetary exploration (e. g. , to M a r s and Venus) (5) Permanent planetary colony (e. g . , on Mars, Venus, and/or Ganymede) Inherent in every one of these missions is a requirement for determining in advance,
and with some degree of reliability, that the mission can actually succeed in the sense not only that wi l l the human subsystem survive but a l so that the objectives of the mission wi l l be met.
By their very nature, systems that contain man as a functioning part a r e quite com- plex, Even the development of basic life-support systems has been so complex that in- tuition backed up by much previous experience i s about all the designer has to work with. When considering a system in which man i s not just a f f s u m p f f for the life-support sub- system but ra ther a functioning part of the overall system, the complexity of the system quickly exceeds the intuitive grasp of the human mind. Analytical techniques for study- ing and designing these missions a r e therefore not merely desirable, but may be es- sential.
The most advanced studies of manned missions reported in the l i terature (e. g. , refs . 1 to 3) have employed empirical methods. puter mission-study compression t imes of about 1000, and can handle a great number of subsystem functions, they a r e at present limited to treating man merely as an on-off function. spond with "design' f performance under emergency situations, o r when their physio- logical or psychological state i s impaired for med-ical o r other reasons. Furthermore, man has an irrational characterist ic of being an unreliable judge of his own capacity for physical o r mental tasks, and often exerts himself t o the point of cri t ical exhaustion in a heroic spiri t . From this brief definition of the analysis problem, it i s c lear that an adequate methodology for manned-mission analysis must meet these minimum re- quir ement s:
Although such methods provide com-
Even astronauts well trained in particular tasks cannot be expected t o re -
Treatment of man as a subsystem in a complex, interrelated, total system Description of man as a subsystem with variable performance and limited re -
se rve capacity for each task function Compatibility with medical-diagnostic monitoring information and extensive
medical case-history data, to provide accurate projections of task-ability capacity
Adaptability to programming for high-speed digital computers Fast convergence to optimal solutions for normal base-line missions, for stochastic perturbations of system performance due to internal or external conditions, and for stochastic subsystem failure
particularly in the event of impairment of crew performance Allowance for adaptive reprogramming of the mission during the actual mission,

In addition to meeting these fundamental requirements, the methodology should both ex- p re s s and define a clear basic philosophy for manned-mission analysis, and should have an assured potential for growth. Network Theory (hereinafter called MNT) already meets most of these requirements, and that there is every indication that the theory can be augmented and extended to meet the remainder of the requirements.
envisioned as a primitive s tep in adapting MNT to the analysis of man-machine systems. It w a s intended that some progress be made in extending the bas ics of MNT to encompass systems having man as a subsystem o r component.
The resu l t s of this research investigation are reported he re in a sequence best suited t o understanding on the par t of readers who have not specialized in network anal- ysis. Discussions of the techniques of MNT i s available, t o some extent, in the l i tera- ture , and the reader who des i res t o review these techniques is directed to references 4 to 6.
The work to be reported here has shown that Modern
In initial formulation, the research reported in this report and in reference 4 w a s
M A N A S A SUBSYSTEM
Whenever man employs any agent as a tool t o mediate the accomplishment of a task, a man-machine system exists. This definition is so broad that, in general, all of man's works can be listed under the heading of man-machine systems. Even in such an ab- s t rac t idea as the message an a r t i s t at tempts to pass on t o the viewers of his work is contained all the essentials of a man-machine system. In this case the system functions through an interplay between the device produced by the a r t i s t and those character is t ics of man that relate how he "sees" and interprets the inputs t o his senses.
In the less abstract man-machine systems (e. g . , manned interplanetary missions systems) , the main problem i s to reduce the system to a mathematically defined set of interrelated subsystems. problem in itself.
with the exception of a few simple situations, have appeared insurmountable. cipal reason for this l ies in the apparently overwhelming complexity of man. quite c lear that no device produced by man to date even begins to approach the human being in overall complexity. Nonetheless, various phases of human performance can be understood to some degree, as evidenced, for example, by the science of anthropome- tries as applied to the design of the many machines which a r e constructed for use by man, and by the very significant amount of work that has been done on the measurement of particular character is t ics of man. the technique of treating man as a black-box feedback element in various servosystems.
The "machine" par t of these sys tems does not constitute a
The problems associated with the mathematical treatment of man a r e many and, The prin- It s eems
A large amount of progress has a lso been made in
3

Environmental inputs /i ~-
Machine outputs
Machine funct ions
Figure 1. - Block diagram of typical man-machine system.
Man's role as a subsystem in modern day complex space systems has developed f rom both empirical and scientific considerations. man car r ied out the guidance function and, in general, stabilized the system. In the de- velopment of present day space-flight systems, man's role h a s evolved from that of a stabilizing feedback element to that of a systems manager and a task-performing entity. Figure 1 is a block diagram as modified from reference 7 that may be helpful in visualiz- ing man's role in a functioning man-machine system. the human subsystem i s suggested by block diagrams of this type. In every instance, man appears as a set of subsystems each coupled with other subsystems of the set of machine subsystems. This is, of course, an overly simplified picture since the human subsystems a r e a lso interconnected, but it does allow for the formulation of an approach (and the human interaction can also be included eventually). considered as a set of task-performing subsystems each of which is describable phenom- enologically, an MNT analysis wi l l be possible. t ems will be suggested by each of the various ro les that man assumes as a part of the overall system.
In ear ly man-machine flight systems,
A possibility for an approach to
In other words, if man is
The formulation of the human subsys-
Approach
The methodology that wi l l produce a mathematically analyzable human subsystem must be based upon knowledge of the character is t ics of that subsystem and how it depends
4

upon other human and/or machine subsystems. of a physical-task-performing subsystem. Involved in this case a r e man's structural , muscular, and metabolic characterist ics.
A s i s pointed out in reference 4, a pair of variables must be defined for each sub- system for MNT analysis, and further, the variables need not represent the actual c las- s ica l variables which have been historically affixed t o man's characterist ics. of the freedom allowed by this point, it w a s felt that a good choice of variables would be ones that were heretofore unencumbered by formal definition but s t i l l within possible reach of a set of realist ic measurement (metering) techniques. The through-variable chosen for use in this subsystem i s called Q and i s defined as '?the ability to perform tasks. ? ? (While in some circumstances "task" might appear to be "work, I ' it should not be s o read. ) The across-variable chosen i s called M and is defined as "the motiva- tion or driving force that re la tes to the flow of Q through an elemental representation of a task. 7 t Note that by "motivation'? the author does not mean to imply the specific defin- itions associated with the t e rm by psychologists and others, but rather a more general idea that may become more clear in the later discussion.
Because the Q and M parameters a r e pure inventions of the author, they may be defined in any way whatever that f i ts the overall requirements of the MNT techniques. Thus it can be assumed that the requirements relating to subsystem variable pa i r s a r e met by definition, and that what remains is to define the components that make up the subsystem and to determine metering techniques that wi l l allow measurement of the variables in a manner consistent with the summation requirements on variable pa i r s (ref. 4) .
Consider, for instance, man in the role
Because
Formulation of a Model
In the case of man in the role of a physical-task-performing subsystem, it would be expected that certain assumptions can be made to facilitate the formulation of the model used to represent this subsystem. storage device is not unlike other energy storage devices. task performance, Q will have the character is t ics of energy. ) That i s to say, the gain and loss of Q in the human subsystem will behave according to an exponential law. Secondly, it is clear that for many types of tasks the "flow" of Q through that task element will be independent of M over some range. The implication here is that for these tasks the human element, or Q storage device, will have more ability than that required to just perform the task.
These character is t ics a r e not unlike certain types of response found in many other subsystems, and because of a background in e lectr ical engineering it is difficult for the
F i r s t of all , it w i l l be assumed that man as a Q (For the case of physical
5

author to avoid comparisons with a s imilar ly behaving electr ical analog which wi l l be used as an aid in establishing the system analysis program for a sample man-machine system. This sample w a s used t o tes t the ideas presented herein and further to establish the fidelity which could be achieved by a simple attempt a t an analysis of a nonsimple problem. There is no intended implication that physical task performance in a man- machine system can be analoged t o an electr ical subsystem. The electrical c i rcui t ry to follow is used only as an aid to thought in the formulation of the model.
Consider that man in the role of a Q storage device resembles somewhat the elec- t r i ca l capacitor in the role of a charge s torage device. Similarly, the flow of e lectr ical charge through an electr ical res is tance and the resultant dissipation of electrical energy
(after transformation t o thermal energy) can be thought to resemble the "flow" of Q through a representative task with a resultant dissipation, or using up, of this task- performing ability. (Note that the variable Q is not otherwise related to the q that will stand for e lectr ical charge. )
one simple task might resemble the following schematic sketch of an electrical circuit: A highly simplified example of a man-machine system in the form of one man and
where C i s a capacitor and R a resis tor . The electr ical system equation for this a r - rangement would be
where q(t) is charge remaining in the capacitor a t t ime t , q 0 i s the initial charge (at t = 0), C is the value of the capacitor, and R the value of resistance.
The voltage V(t) a c r o s s the res i s tor a t any t ime t is given by
The intended implication is that Q and M of the man-machine system w i l l behave similarly to the q and V of the electrical circuit. Thus, by considering the general
6

properties of a man-machine system in the light of s imi la r arrangements of e lectr ical circuitry, a set of mathematical relations may be evolved that can be utilized for the analysis of such man-machine systems, provided that the proper parameter values for man can be determined and included in the relations.
The previous capaci tor-resis tor network w a s t o demonstrate the equation form for a "task performance" situation. Another role to be played by man in the same type of system is one wherein man would reacquire Q (through sleep o r rest). following schematic sketch whereby the capacitor is being charged by the combination of a charge source with voltage V (a battery, for example) and an electr ical res i s tor R:
Consider the
R
The value of charge contained in the capacitor at any t ime t (assuming no initial charge) i s given by
which becomes upon integration
q(t) = cv [1 - exp(- L)] RC
(4)
The basic form of either equation (3) or (4) can be used to represent the resting o r sleeping state for man, where the equivalent values of V and R would be those appro- priate for each man (one set for sleep and another for res t ) .
role of performing a task. the usual type of task that man would address himself to, since the implication is that all of the man's M i s required by the task and he i s thus working a t a maximum and ever
The very f i r s t circuit in this se t of examples w a s intended t o resemble man in the However, the task represented by th i s circuit is not at all
7

.. . . . . . . __
Time, t
Figure 2. - Plots of t he functions. The numbers refer to the equation numbers that apply to each region.
8
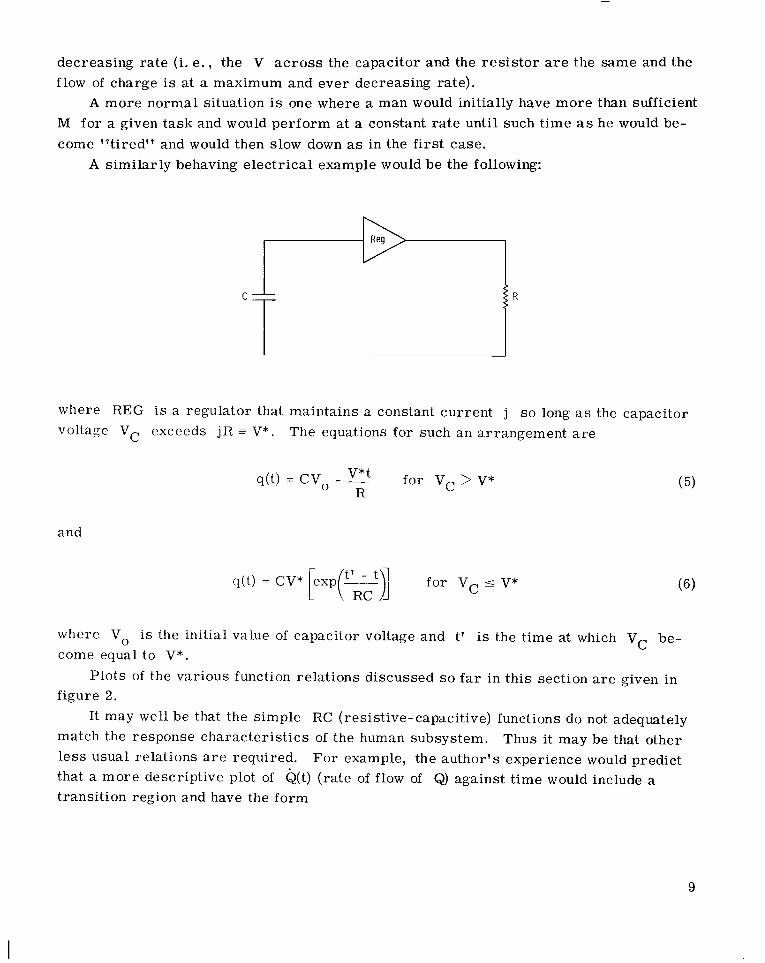
decreasing ra te (i. e . , the V a c r o s s the capacitor and the r e s i s to r are the same and the flow of charge is a t a maximum and ever decreasing rate).
M for a given task and would perform a t a constant rate until such t ime as he would be- come 'vtired" and would then slow down as in the first case.
A more normal situation is one where a man would initially have more than sufficient
A similarly behaving electr ical example would be the following:
cT w I
R
where REG is a regulator that maintains a constant current j so long as the capacitor voltage Vc exceeds jR V*. The equations for such an arrangement a r e
v* t q(t) = CV - - for vC > V* O R
and
(5)
where Vo is the initial value of capacitor voltage and t' is the t ime at which Vc be- come equal to V*.
Plots of the various function relations discussed s o far in this section are given in figure 2.
It may well be that the simple RC (resistive-capacitive) functions do not adequately match the response character is t ics of the human subsystem. Thus it may be that other l e s s usual relations a r e required. For example, the author 's experience would predict that a more descriptive plot of Q(t) ( ra te of flow of &) against t ime would include a transition region and have the form
9

0 Time, t
with the resulting Q(t) against t relation:
t
where the functions for t' < t < t" could be simulated in a number of ways; a s , for example, i f the parameter equivalent to the electr ical C were allowed t o vary as a function of time. The response in the regions 0 < t < t ' and t > t '? would sti l l be as given by the relations in equations (5) and (6), respectively.
performance system might be as shown in figure 3 where the depicted components repre- sent the man-machine equivalent components ra ther than the usual electrical compo- nents. The a r rows drawn through the components indicate that they may be varied either as a function of t ime o r as a function of some other parameter .
The ability t o vary the value of the so-called capacitor representing the Q storage device in the figure allows for the simulation of a number of character is t ics that can be important in a man-machine system. For instance, i f a subject is performing a task f o r a sufficiently long period that he does not have sufficient M to perform a t the de- s i red level and an emergency situation suddenly a r i s e s , a decrease of the equivalent C of the Q storage device wi l l cause an increase in M which may well be sufficient to increase Q t o the desired level. However, af ter the value of M again falls to the level required, the subsequent falloff of Q wi l l be a t a higher ra te than before the emergency. In the author's experience, this is not unlike the response attributed to the release of
In th i s manner, a simplified schematic fo r a man-machine physical-task-
10

+ I solation
Awake Asleep
Q source Q (sleep) Q c
Figure 3. - Schematic representation of one man in a simple man-machine system. Condit ion shown: Performance of Task 2.
Qct,
Qbase
Normal falloff of ,,\ Q wi th "fatigue" 2'
Postemergency Q falloff
.- 'emergency
Figure 4. - Response of simulated man-machine system to an emergency situation.
adrenalin in a subject faced with this type of problem. scribed i s shown in figure 4.
A plot of the response just de-
Pa r a mete.r Va I ues
With the relations established in the preceding section and with the MNT techniques as described in reference 4, it would now be possible to establish a system equation set for the analysis of a given man-machine system. However, without appropriate values
11

for the various parameters involved, nothing much could be accomplished by an a t - tempted analysis.
measurements made on human subjects. A s w a s pointed out ear l ier , a large amount of such measuring has already been done and is available for use, although not always in a form suitable for the analysis of man-machine sys tems from an engineering approach to an actual system. However, much can be gained from a study of a general set of situa- tions that would then be applicable to more specific situations which would la ter a r i s e in the analysis of actual systems.
Consider, for example, the type of human performance data available in reference 8 that pertains to the energy costs involved in the performance of various tasks, as deter- mined by a measurement of the oxygen consumption of various subjects during the per- formance of these tasks , of which table I is an example.
Most certainly, parameter values for human subsystems must come f rom actual
Since the values given a r e
TABLE I. - OXYGEN COSTS O F ACTIVITIES
Activity I
Asleep: Sleeping. men over 40 Sleeping. men aged 20 to 40 Sleeping. men aged 15 to 20
Resting: Lying fully relaxed Sitting at r e s t
Very light activity - seated: Writing
Typing
Light activity - standing: Washing clothes Scrubbing
Moderate activity: Rowing fo r p leasure Cycling a t 8 to 11 mph Chopping wood Army d r i l l
Heavy activity: Swimming b reas t s t roke at 1 . 6 mph Digging Rowing with two oars at 3. 5 mph
Oxygen con sumption.
kg /hr
0.018 .023 . 0 2 3
.023
.032
.032
. 0 4 1
.068
.082
.091
. l o o
. l o 9
. 127
.145
. 159 * 195
~~
Energy ex- penditure
Btu/hi
260 2 80 300
290 400
4 30 550
890 1130
1190 1360 1480 1690
1950 2120 2620
~
J / h r
76.2 82.0 87. 9
85.0 117.2
126.0 161.2
260.8 331.1
348.7 398. 5 433.6 495.2
571.4 621.2 797.0
. .
Work ra t e ,
W
76. i 82. I 87. E
85. C 117.2
126.0 161.2
260.9 331.2
348. 8 398. 6 133. 8 195.3
571. 5 521.4 167. 9
12

constants, it is c lear that they represent only the steady-state case fo r constant-rate task performance and not the general case where the performance would be as shown in the last section. Also, it is seen that no indication of any idea such as "recovery" of task-performance ability is given by such data. We can, however, through energy bal- ance techniques, determine a suitable se t of Q-cost and Q-gain r a t e s f rom the data given. A f i r s t assumption wi l l be that given sufficient dietary intake the ability to per- form physical tasks wi l l be a unique function of the work-rest-sleep history of a subject.
The plots of figure 5 (as modified from ref . 8) show that men of astronaut s ize can
/
1. 5 r s 3 -
2 -
Average daily heat output. Btu
I 15
I 1 10
Average daily heat ou tpu t . J
(a) Oxygen costs and body size.
I 0 4
I 8
I 6
I 4
I 2
I 0
Heat output, Jlday
(b) Cost of t issue maintainence.
F igure 5. - Metabolic parameters for humans.
1 3

be expected t o expend about 15 000 Btu's of energy pe r day, of which about half is ex- pended t o maintain the body. take place over the ent i re 24 hours of every day. Its value on a per-hour basis will thus be about 290 Btu per hour. The light activity that might be performed continuously over an 8 hour work day has a value of approximately 1000 Btu per hour (table I). for the sake of simplicity, in this type of task performance w e assign a scale t o Q such that one unit of Q corresponds t o 1 Btu of energy, then the total expenditure of Q in a typical day for a typical subject of astronaut s ize and weight would be as follows:
This basal r a t e of energy expenditure will be assumed t o
If,
24 Hours a t 290 units/hr E 7 000 units/day 8 Hours a t 1000 units/hr = 8 000 units/day Total Q expenditure = 15 000 units/day
Since all of this Q must be regained through sleep and r e s t , it is now possible t o es t imate the average AQ values for these two functions. If the typical subject is as- sumed to s leep for 8 hours each day leaving 8 hours for r e s t ,
+ 8 X AQrest = 15 000 units/day X A Q s ~ e e p
If, for the sake of a unique solution, the s leep ra te is assumed to be twice the r e s t ra te ,
AQsleep = 1250 units/hr
and
AQrest = 625 units/hr
The Q balance required over a full day to maintain a steady-state condition is thus satisfied, that is,
AQ.H. 1 1 +C A Q ~ H ~ = o i i
where AQi is the ra te for tasks performed, A . is the ra te for sleep and r e s t , and Hi and H. a r e the hours of t ime each event is performed. All AQi wi l l be negative since
J they represent a loss of Q from the subject.
9
14

Metering
In order t o analyze a subsystem, it is most desirable to be able t o determine the values of the various var iables of the subsystem by some convenient metering technique. In electrical , mechanical, hydraulics, and other areas, the conception and development of me te r s has grown with the discipline itself, and with minor changes in use and inter- pretation of existing m e t e r s it is possible to provide metering techniques that a r e com- patible with the MNT methodologies in the analysis of subsystems from each of these areas. In the analysis of human subsystems, this is not a t all the case. there a r e really no Q m e t e r s o r M m e t e r s in existence. The problem is not s o much a lack of me te r s as such, but really one of metering the appropriate variables in a man- ne r consistent with the requirements.
system, it is mandatory that at least one of the two variables of the Q, M pair be measurable in some sense. (If a subsystem element has been defined and one of the var iables measured, the other variable can, in general , be derived by calculation. ) In an attempt at determining the value of the standard physiological var iables as a measure of the desired variables, a search of the l i terature w a s undertaken.
A most c lear resul t of this search w a s that there a r e large amounts of data that indicate that performance of muscular work resu l t s in measurable changes in such physiological parameters as respiratory rate , heartbeat ra te and volumetric ra te , ox- ygen consumption rate, carbon dioxide expiration, and others. Of these, heart ra te is by far the most easily measured and interpreted. that the l i terature indicates the existence of a rather simple functional relation between this parameter and total body work. Total body work i s measured by gas analysis tech- niques that measure oxygen consumption and carbon dioxide production. The gas anal- ys i s technique produces a measurement that would seem to be a good metering bas is for the Q variable. However, the complexity of the analysis and the effect of the apparatus on human subjects makes the technique appear most undesirable, especially for prelim- inary work.
A further argument for the heart ra te measurement is that, although gas analysis may provide a more accurate measure of total internal work, the parameter of interest is actually work done on the environment, o r "external work. '' Measurements reported in reference 9, for example, would indicate that either oxygen consumption ra te o r hear t ra te would be suitable for making preliminary measurements on the correlations that might exist between either parameter and the external work (or &> for a subject.
were made on a smal l sample of subjects over a ra ther extended period of time. The equipment utilized for these measurements consisted of a n electrocardiac monitor, a
Of course,
If an analysis of a man-machine system is to be made and compared with an actual
Another advantage of hear t ra te is
A s e r i e s of measurements of heart ra te as a function of physical task performance
1 5

Figure 6. - View of exercise physiology laboratory showing some of t h e equipment used in t h i s study.
, , . , . . , .,
- - 7 - --
Figure 7. - Pen-type physiological data recorder.
16
I
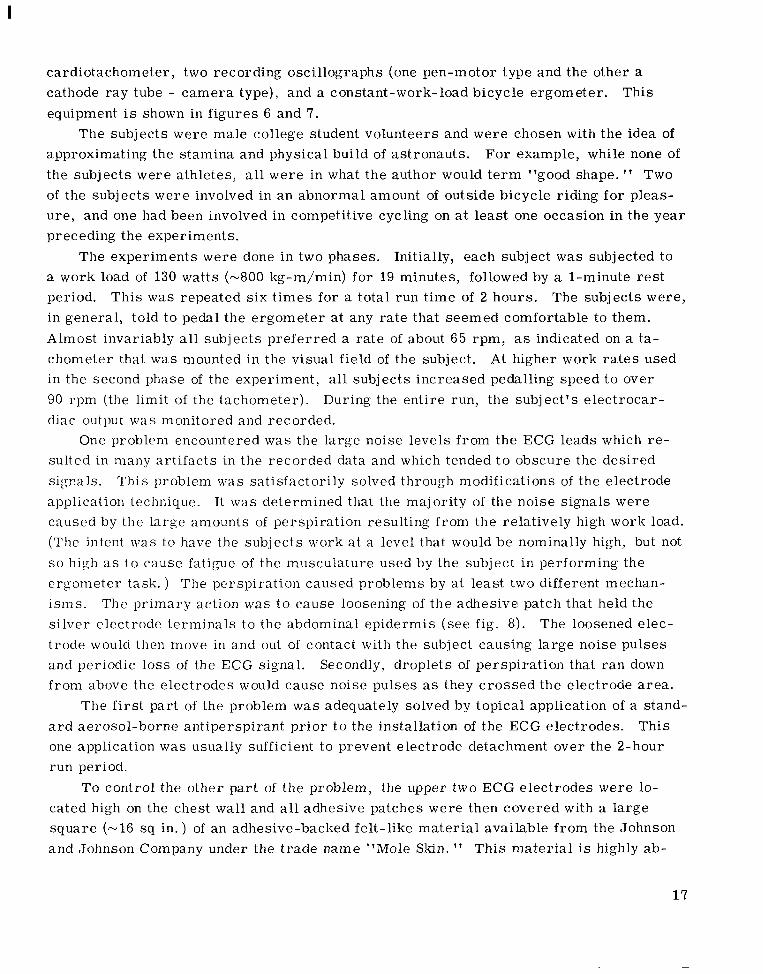
cardiotachometer, two recording oscillographs (one pen-motor type and the other a cathode ray tube - camera type), and a constant-work-load bicycle ergometer. equipment is shown in figures 6 and 7.
The subjects were male college student volunteers and were chosen with the idea of approximating the stamina and physical build of astronauts. the subjects were athletes, all were in what the author would t e r m "good shape. " Two of the subjects were involved in an abnormal amount of outside bicycle riding for pleas- ure , and one had been involved in competitive cycling on a t least one occasion in the year preceding the experiments.
Initially, each subject w a s subjected to a work load of 130 watts (-800 kg-m/min) for 19 minutes, followed by a 1-minute r e s t period. in general , told to pedal the ergometer a t any rate that seemed comfortable to them. Almost invariably a l l subjects preferred a ra te of about 65 rpm, as indicated on a ta- chometer that w a s mounted in the visual field of the subject. At higher work r a t e s used in the second phase of the experiment, a l l subjects increased pedalling speed t o over 90 rpm (the limit of the tachometer). During the entire run, the subject 's e lectrocar- diac output was monitored and recorded.
sulted in many ar t i facts in the recorded data and which tended t o obscure the desired signals. application technique. caused by the large amounts of perspiration resulting from the relatively high work load. (The intent was to have the subjects work a t a level that would be nominally high, but not so high a s to cause fatigue of the musculature used by the subject in performing the ergometer task. ) The perspiration caused problems by a t least two different mechan- isms. s i lver electrode terminals to the abdominal epidermis (see fig. 8). trode would then move in and out of contact with the subject causing large noise pulses and periodic loss of the ECG signal. Secondly, droplets of perspiration that ran down from above the electrodes would cause noise pulses as they crossed the electrode a rea .
a r d aerosol-borne antiperspirant pr ior t o the installation of the ECG electrodes. This one application w a s usually sufficient to prevent electrode detachment over the 2-hour run period.
cated high on the chest wall and a l l adhesive patches were then covered with a large square (-16 sq in . ) of an adhesive-backed felt-like mater ia l available f rom the Johnson and Johnson Company under the t rade name "Mole Skin. " This mater ia l is highly ab-
This
For example, while none of
The experiments were done in two phases.
This w a s repeated s ix t imes for a total run t ime of 2 hours. The subjects were,
One problem encountered w a s the large noise levels from the ECG leads which re -
This problem was satisfactorily solved through modifications of the electrode It w a s determined that the majority of the noise signals were
The pr imary action was t o cause loosening of the adhesive patch that held the The loosened elec-
The f i r s t part of the problem w a s adequately solved by topical application of a stand-
To control the other part of the problem, the upper two ECG electrodes were lo-
17

140 m
L
Figure 8. - Electrode placement on test subject.
Ergometer speed
I
Ergometer (relat ive]
I m i n 4 I
peed (relat ive)
F iyure Y. - Typical data record pr ior to modification of ECG electrode mount ing procedure
18

sorbent and adequately prevented problems of the second type.
of motion in the performance of the ergometer task, a fur ther precaution w a s taken to ensure the stability of this electrode. This w a s done by loosely wrapping a nonadhesive elast ic bandage (called an "Ace" bandage) around the subject 's waist so as to cover and hold this electrode.
The resulting signals were then exceptionally free of ar t i facts and were completely
A s the electrode in the region of the subject 's waist w a s subjected t o a large amount
analyzable. Figures 9 and 10 are "before and after" samples of the improvement, as represented by the pen recorder output of hear t rate as measured on a beat-to-beat bas i s by the cardiotachometer.
Ergometer speed (relat ive) h
++ m
2 120 130 t Figure 10. - Ar t i fact - f ree data record made possible by modified ECG electrode mount ing proce-
dure.
Tests on four different subjects were then run almost daily over a period of approx- imately 3 months. subject 's ra te would climb to some value while under the physical s t r e s s of the ergome- t e r task within the f i r s t minute o r sooner and would not significantly vary from this value until the task w a s stopped for the 1-minute r e s t period. The repeatability for each sub- ject over the entire t ime of the f i r s t phase of the experiment w a s very high and only one of the subjects showed signs of "training" over the f i r s t 10 runs, as indicated by a fas te r cardiovascular response t o the onset and termination of the task. fers to an increase in efficiency with experience. )
subjects is displayed in figure 11.
the heart ra te data, that occurs shortly a f t e r the beginning of the task and while the in- c r ease in the ra te is s t i l l ra ther high. The appearance of this dip is reminiscent of the response of regulated systems that a r e controlled by two regulators, one which i s fast
Samples of the heart ra te data obtained showed that an individual
(Training r e -
A typical example of the rapid cardiovascular response observed in some of the tes t
An unexplained phenomenon observed in these experiments w a s a notch o r dip, in
19

Ergometer speed, (relat ive)
- Pen differential
60 L- Fiyure 11. - Heart rate a s a funct ion (ll time for work rate change from O to 130 watts
but coarse and another which takes over when the desired value i s approached and then exer t s the fine control of the regulated parameter . A search of the l i terature did not reveal any explanation o r corroboration of this effect, but this may be expected since the heart ra te is ra re ly measured on a beat-to-beat bas i s and the anomaly clearly would not show up in measurements made in the usual manner (i. e . , averaging over some fraction of a minute).
loads from ze ro to near maximal (as determined from ref. 9) and the heart ra te w a s again recorded (e. g. , fig. 12). Observations were also made on the standard Lead 11 ECG pattern in an attempt at determining i f any other effects of the s t r e s s would show up and perhaps be useful in the analysis of the individuals working capacity. that the t ime of cardiac diastole (the t ime during which the ventricles fill) is drastically shortened a t high heart r a t e s , which probably places at least one l imit on the maximum work rate for an individual subject.
In the second phase of the experiment, the subjects were s t ressed a t various work
It was observed
Also, during this s e r i e s of runs, the subjects were asked to pedal a t a number of different speeds over a range from 20 to 90 rpm with the work load maintained constant a t some value. Without exception, there w a s no detectable change in heart ra te noted as a function of ergometer speed. (A later s e r i e s of runs during which the subject wore an actual Gemini space suit pressurized to a value just g rea te r than half the 3 .6 psi nor-
20

Ergometer speed (relat ive) - 160
100
60
I 4 1 - Pen differential
Figure 12. - Heart rate as funct ion of t ime for work change from 100 to 0 to 300 watts
mally encountered during Gemini flights showed a marked effect of pedalling speed on heart ra te . This w a s due, of course, to the large amount of res is tance encountered in merely bending the legs of the suit against the pressure differential a c r o s s the suit fabric. )
tained.
extremely high degree of correlation exists between an individual subject 's heart ra te and the amount of ergometer work being performed. that the data show a strong l inear relation, which is always desirable in any metering technique.
The heart ra te for no work (i. e . , resting) for each subject w a s observed t o be sub- stantially higher during the half-hour period following the work session as compared to the prework rate as measured after attachment of the electrodes but preceding any e r - gometer activity. This effect w a s as expected, but the resting r a t e s observed through- out the experiment were found to be remarkably constant. It appears as if the human cardiovascular subsystem h a s two values of resting heart rate; one value not related
A computer program w a s written to perform a statist ical analysis of the data ob- A small sample of typical resu l t s is shown in figure 13.
From the resul ts obtained in this s e r i e s of experimental runs, it can be seen that an
It is also ra ther interesting and useful
21
I

Work rate, W
/
1
/
I
Figure 13. -Hear t rate as funct ion of work rate data wi th computer-calculated regression l ine.
22

'L
1%
16C
140
12c
100 c .- E --- m c
B 3c ai - m I 130 c L m
I
160
14i
1. is
100
30
/ /
P'
1 I Work rate, W
Figure 13. - Concluded.
to the performance of work, and a higher ra te maintained while the body i s making up the so-called "oxygen debt" incurred when the muscles use metabolic mater ia ls faster than they a r e supplied.
values used in the analysis of the data, since these values showed an extremely high correlation with the work data. jects along with the prework heart rate.
pected and clearly indicates the need for analytical techniques that allow for the inclu- sion of individuality. It w a s a l so noted that smal l differences could be found in the r e -
6
The zero-work heart ra te values, measured af ter the task performance were the t
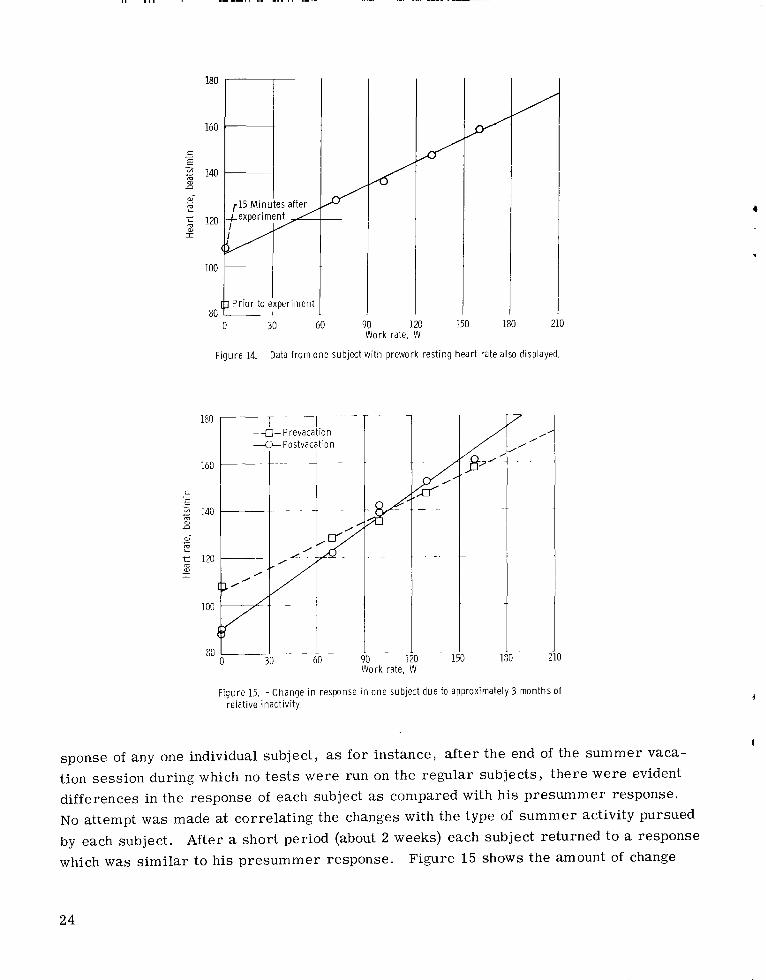
Figure 14 displays the data obtained with one of the sub-
The differences in response displayed by different individuals is certainly not unex-
23
.. . ... . .... 1-1, .,. -..., .-.- 1 , 1 1 1 I
r liG a,
/
c 30 60 90 120 150 180 210 Work rate, W
Figure 14. - Data f rom one subject w i th prework rest ing hear t rate also displayed.
180
160
c .- E 2 140 m a
d F c
2 120 a, I
100
8G
-1 ~ .~ - - Prevacation - Postvacation
4Y
i r k rate,
7 /'
/ /
0
Figure 15. -Change i n response i n one subject due to approximately 3 months of relat ive inactivi ty.
sponse of any one individual subject, as for instance, after the end of the summer vaca- tion session during which no tests were run on the regular subjects, there were evident differences in the response of each subject as compared with his presummer response. No attempt w a s made at correlating the changes with the type of summer activity pursued by each subject. After a short period (about 2 weeks) each subject returned to a response which was s imilar to his presummer response. Figure 15 shows the amount of change
24
displayed by one of the subjects who attended c lasses during the summer session and re- duced his physical activity somewhat over this period.
5000 ft) and because of the limited scope of this phase of the overall program, there a r e , of necessity, certain limitations to the value of the particular data. The bicycle ergometer w a s the only device available that could provide a known work input or task- performance rate for a human subject. Because of the nature of this task (i. e . , invol- vement of the large muscles of the body and the pneumo-cardiovascular system), it is hoped that the resul ts are indicative of general situations involving nonmaximal physical task performance.
Because of the location of the laboratory used fo r these experiments (altitude about
.I
I
ANALYSIS OF A MAN-MACHINE SYSTEM
The preceding sections have described a methodology for the analysis of manned systems in general, and have demonstrated that the human subsystem i s a l so "meter- able" in the engineering sense, at least for one important human function. It would ap- pear that nonhuman subsystems a r e , for all practical purposes, at a state where anal- y s i s by MNT techniques i s both possible and feasible at this t ime. It would appear that human subsystems a r e not nearly as amenable to this same methodology, due to a lack of information and perhaps to oversimplification, as a r e the other subsystems to be found in any typical man-machine system.
clude man a s a nontrivial subsystem but depend upon simplified human subsystem param- e te rs . a sample system w a s conceived and set up for analysis on a digital computer. The intent was to require the performance of more than one task by the human subsys- tem according to some prearranged schedule and to then observe the response of the overall system with the passage of time.
In an attempt at evaluating the usefulness of man-machine systems analyses that in-
Descriptio n
In considering various existing man-machine systems that would fit the scope and intent of this research, the author learned of a feat undertaken b y two men which seemed to meet the requirements. a boat ac ross the Atlantic Ocean from Cape Cod to England in a period of 92 days. activit ies of these two men over the course of a typical day a r e quite well defined as clearly each w a s either sleeping, rowing, or engaged in a period of relative inactivity.
Reference 10 descr ibes this project in which two men rowed The
An estimate of the average amount of work done by each man w a s possible since the
25

total distance traveled w a s known, as w a s the t ime for the completion of the journey. Certain assumptions were made which greatly simplify the analytical procedures and indeed made the analysis possible. were identical with respect t o the task performance parameters that were used in the analysis. Secondly, it w a s assumed that, given sufficient dietary intake, the ability t o perform tasks (i. e . , the amount of Q contained by the human subsystem) is a function only of the sleep-rest-work history of the subsystem. Thus, Q is regained through s leep and res t , and is dissipated in the performance of one simplified muscular task.
tem:
The first of these assumptions was that the two men
In the initial analysis program, the following constraints were imposed on the sys-
(1) Ordinary 24-hour days are to be considered. (2) Both men sleep at ?'night" for 8 hours. (3) During the 16-hour "dayt1 either one o r the other of the men is rowing while the
(4) All pertinent parameters are independent of time. Although the boat rowing venture w a s used as the "model" for this sample man-
machine system, an almost complete lack of actual data f rom reference 10 precluded any analysis of the actual mission. tion of two identical men rowing an idealized boat within the l imits imposed by the as- sumptions and the constraints, and to then determine through consideration of the r e - sul ts if the approach would have any mer i t in analyzing and predicting the performance of s imilar real systems.
other res t s .
The intent w a s merely to analyze the idealized situa-
System Equations
The ideas developed in the section MAN AS A SUBSYSTEM and those in reference 4 Figure 16 were utilized in forming the system equations for this man-machine system.
is a schematic of the system model used. (Fig. 16 i s not a t rgraphl ' in the MNT sense since the apparent ver t ices have properties and would actually be elements of the sys- tem graph. A graph of the system appears in fig. 17.) Time period A 1 means that man number 1 i s working (denoted by the A) and that this i s the f i r s t work shift of the d.ay (denoted. by the 1). Thus E l means that man number 2 i s working, and again this is the first shift (or work period). Condition C puts both men to ?'sleep. The ele- mental equations used were adapted from those derived in the section MAN AS A SUB- SYSTEM, namely,
(1) Sleep and rest : equation (4) with appropriate values for the parameters t o dif- ferentiate between s leep and r e s t
(2) Work: equations (5) and (6)
26

Time period Conducting paths 1 2 3 4 5 6
A1 1 0 0 1 0 ' 0 81 0 1 1 0 A 2 1 0 0 1 32 0 1 1 0 1
Elements Function +- 1 ;:;; 1 Q storage I 2,3,4 Task selection 5.8, 11, 12 Q source (sleep) 6,9,13,14 Q source (rest)
Work task
Figure 17. - Graph used for establishing system equation for two- man boat-rowing man-machine system. (Unprimed numbers refer to man 1, primed numbers refer to man 2.
Figure 16. - Simplified schematic of man-machine system.

These equations were not employed directly, either in their differential or integral forms. the increase in Q to be expected in a fixed t ime interval as a function of the prevailing values of all the parameters a t the s ta r t of the t ime interval. crude approximation
For digital computer solutions, the simplest approach is one which specifies
One could justify as a
where dQ/dt is obtained from the differential form of equations (3) t o (6). However, the use of equations of the preceding form can also be justified by another argument. Remembering that the electrical analogs used t o derive the initial set of equations were intended only a s analogs, it can be hypothesized that the man-system equations a r e such that equations of the form
exactly represent the behavior for a particular value of the t ime interval. In the analysis, the values of t spaced by 6-minute intervals ( l / l O hr) were chosen. The sleep/rest equation was taken as
where 4Q(t1, t2) is the change in Q(t) over the interval t l to t2, A and B a r e con- stants, and Q(tl) is the value of Q a t the time t l (the beginning of the interval).
For the work task, the following equation form w a s u s e d
28

where C, D, E, F, G, H, and J a r e constants, and again AQ(tl, t2) and a t 1 ) a r e as previously described. form of the equation as well.
a lso includes a transition region (as discussed ear l ier) to smooth the change from one function to the other. When J is chosen to be equal to F, equation (8) is fully equiva- lent t o equations (5) and (6).
Initial runs of the computer program showed that, indeed, the response of such an idealized system could be determined by the methodology described herein and, despite the simplifications invoked, the resu l t s were definitely nontrivial.
Because of the availability of a considerably larger and faster digital computer than the one used for the f i r s t set of analyses, it w a s decided t o elaborate on the system equations to allow for the inclusion of other pertinent parameters as they become avail- able. For instance, it w a s felt that "learning" or improvement in the performance of a task with practice w a s a significant phenomenon and should be allowed for in the sys- tem equations. Also, tha t character is t ic of man to become inefficient over a longer period of t ime (due to what might be called "boredom, should certainly be included. tion (7) became
Note that in this equation Q(tl) affects not only the A Q but the
Equation (8) is actually a bit more elaborate than equations (5) and (6) because i t
*
or for some other reason) Therefore, the systems equations were modified and equa-
where the difference is that the "constants" a r e no longer constant, in the sense that they can now vary with the passage of t ime in any of five different ways . w a y s a r e shown for An in the following sketch:
These five
29

I I I I I 1111 1111. . I , 1111.1.1.1 . ., ... ..__-._-.--
where A, is the initial value of A. r e la t i on:
Values of An are determined by the following
where cy and are parameters that are chosen to produce the desired shape in the t ime response curve (curves 1 t o 5) in the preceding sketch.
The work-performance equation (eq. (8)) becomes
for Q(tl) > Fn
4
where other modifications from equation (8) a r e due to boundary conditions such as
Q(t) 2 0 for a l l t
which resu l t s in
- Gn = cn for all t Hn
Gn > 0 for a l l t
The values for the "constants" a r e determined by the following relation: t
pn = Po + CYp exp(Ppt) (11)
where P i s any of the parameters A to H and CY and p a r e provided as required to shape each of the parameters as required. a continuous variable. )
(Note that t is a "counter" ra ther than
30

A new digital computer program w a s then written which utilized the more flexible equations and which a l so included the following advantages over the previous program:
(1) Up to eight men may be included. (2) Up t o 10 tasks may be included. (3) Each man i s an "individual. 1 1
(4) No restr ic t ions are put on the scheduling of tasks (including rest-s leep tasks). Advantages 1 and 2 are not really limited as indicated and can be easily increased to any reasonable value, consistent with the capacity of the particular computer being used, by a simple modification of the program.
tions, is given in the appendix.
d
I- This computer program, along with a description of the various parameter defini-
Resul ts
A set of tes t cases for various sets of data input with CY, 13 w a s run to tes t the program and to demonstrate the inherent response of the two-man rowing system de- scribed ear l ier . sponding to the expected "steady-state" system performance with 4-hour work shifts and
Figure 18 shows a plot of the computer output data for inputs cor re-
t
36
30
24
Q 18
12
6
0
240
180 13
126
GO
AQ
0
-60
-120
-180 0
\ \
...
J
I I\
i '\ I; I
2-
'\
I
1 2 3 Time, days
Figure 18. -Typical system response w i th 4 -hour work shifts.
31

over a period of 3 days. For the sake of clarity, the individual at) values have been omitted from the plot, but these values do appear in the computer output.
For example, when each man begins row- ing for the first t ime on any day, he displays a constant AQ value for the first 2 hours or so. This implies that for the prescr ibed value of M (i. e. , he is rowing only be- cause it is his turn and there is no requirement fo r maintaining any particular ra te of speed) the man has more than sufficient Q for the task. output that is consistent with becoming tired. who has just previously been rowing gets more "good" from his sleep. The total amount of work done by the men in any day is the integral of the AQ curves (i. e . , the areas) in the negative AQ region.
It w a s noticed during the many computer runs that the choice of Q(to) (i. e . , the initial value of Q for a man) could be made quite a rb i t ra r i ly and after a few "days" the value of Q(t) upon "waking" would have approached a stable value (provided, of course, that all CY and p were zero). This led to the idea that some kind of "basic system response" could be determined by, for instance, initializing Q(t) a t zero and then observing the manner in which Q(t) each morning approached i t s asymptote.
Such a run w a s made, and a plot of this data over a 3-day period i s shown in fig- ure 19. This plot shows that the response of this system on a day-to-day basis is ra ther fast.
The responses are as would be expected.
He then displays a dropoff in Note fur ther that upon retiring, the man
Although no attempt w a s made to do so, it might be useful to define a pa-
3(
2:
x
Q(t) 15
10
5
0
- 1 I I I i
1 2 4 Time, days
Figure 19. - Q(t) total at t h e start of each day, showing basic recovery r e s p n s e of man-machine system.
32

r ame te r that re la tes this particular response as a basic system response characterist ic. When it became c lear , through acceptable system behavior, that reasonable values
for the various input parameters had been selected, it w a s decided to fur ther test the system recovery response from a perturbation caused by some type of unscheduled phe- nomenon. This took the form of a "storm" which w a s conjured up at the beginning of the 8-hour night and which lasted for the entire 8-hour s leep session. The effect on the crew was to be that neither man could recover Q by ei ther s leep o r r e s t because of some supposed smal l t a sks which were continuously performed, such as tying down gear and keeping from falling out of the tossing boat. At the end of the s torm (and of the sleep period), the two men returned t o their usual schedule.
The recovery of the system can be gleaned from the computer output, a plot of which appears in figure 20. Again the Q(t) values for the individual men have not been shown because of the complexity of the plot. It is seen that the total output for the two men in the day following the s leepless night is substantially less than fo r a normal day. Also, it is interesting t o note that with no extra sleep during the next night the recovery as indicated by the Q(t) values is within 7 percent of being complete. One additional hour of sleep would have been sufficient to make up for the lost 8 hours. The difference, of course, shows up in the decreased output during the t ime when both men were working while at low Q levels.
These resu l t s a r e not a t all inconsistent with the author 's own experience.
! 8 -AQ, man 1 I\ AQ, man 2 I'
0 total :' I \ - - - - - - -
6,
0 2 Time, days
Figure 20. - System response with no sleep d u r i n g f i rs t night.
1 3
33

FUTURE POS S I BlLlTlES
The resu l t s of the preceding analysis immediately bring t o mind many other inter- esting possibilities as regards extensions t o the particular man-machine system which w a s hypothesized for the purpose of demonstrating the methodology. would a l so be possible with the improved computer program t o study the effect of "naps" during the daytime period. and the number of tasks to be performed and then perhaps studying the effects of the particular choice of crew talents as a function of the scheduling of the tasks. fects on the system of par t ia l o r total loss of one or more crew members due t o sick- ness , injury, o r other cause might be studied.
task performance schedule for any given crew composition. One cr i ter ion for optimi- zation would be to maximize the area under the negative portion of the A Q curves and thus maximize the total work done by the given crew. There a r e , of course, other w a y s of defining the optimal performance of even this simple system.
planetary expedition system provides a rich source of new ideas for study by these techniques. Earth 's nearest planetary neighbors in the foreseeable future, and some methodology for the analysis of the man-machine systems proposed t o perform these visits must be formulated before these missions can really be seriously considered.
The Apollo Program w a s car r ied out only af ter a tremendous amount of costly and most necessary preliminary study which included both the Mercury and the Gemini pro- grams. Nonetheless, there presently exists no analytical procedure for the analysis of complete man-machine systems of this kind. Rather, the development of these systems has had to depend upon a combination of experience, intuition, and whole-hearted coop- eration on the part of the specialists in the many disciplines that a r e , of necessity, in- volved in these studies. The author believes that mission analyses patterned af ter that described in this report can be expected to provide a significant increase in the effi- ciency with which information from every source i s utilized. Also to be expected is an increased ability for evaluating the effects of various possible perturbations on the planned performance of a system, which would thus allow the determination of a mean- ingful "reliability factor" for such systems.
Another advantage inherent in any analytical methodology that utilizes digital com- puters i s the tremendous t ime compression available because of the microsecond-per- operation speeds of these devices. machine space-flight systems could well be expected t o result in time compression
For instance, it
Another extension might be enlarging the size of the crew
Or the ef-
It would a l so be quite possible with a slightly modified program t o optimize the
An extension of the ideas of the analysis presented in the last section t o a manned
As w a s suggested in the INTRODUCTION7 man wi l l visit at least the
The programs that might represent typical man-
34

I- I I I I1 I 1
factors of about 1000, which would allow, for example, the study of a 2-year Mars mis- sion in less than a day.
Because of the absence of any requirement for the tangible existence of the ideas represented by the MNT variables, many other possibilities exist for the use of MNT techniques as, for example, analyzing problems in such areas as urban renewal, f i - nance, social behavior, and others which heretofore have been we l l outside the domain of the system analyst. comes a perfectly valid MNT system variable. of command, I ' a n organizational chart bears a striking resemblance to a special MNT subgraph known as a "tree, ' I thus making i t an easily studied structure. And the idea of "command" might surely be made a valid through variable.
and it is certainly outside the abil i t ies of the author to provide such a list. the light of the ideas and proposals that have been included, many other, and perhaps more significant, ideas should present themselves to the reader .
When properly defined and scaled, such an idea as "desire" be- Also, considering the ideas of a "chain
A long l ist of possible uses for the ideas presented in these pages could be prepared, However, in
CONCLUSIONS
In view of the resul ts obtained in the analyses by Modern Network Theory of the assortment of examples presented in this report , and after consideration of the tech- niques used to obtain these resul ts , certain significant conclusions can be stated:
Modern Network Theory analysis techniques, and there i s no apparent reason that would preclude the analysis of Man in toto by these same techniques, provided only that suf- fi c ient defining information and metering technology be c om e s available.
2. Human hear t ra te , when measured and interpreted in certain ways, constitutes a reasonable and useful metering parameter for defining physical-task-performance output. Measurements made as a par t of this investigation show a sufficiently high correlation to allow detection of differences, not only between different human subjects but in individual performance variations as well.
3. Man-machine systems, of themselves, present no inherent character is t ics that
1. Man in the role of a physical-task-performing subsystem is amenable to the
1 preclude their analysis by these techniques, provided that sufficient information, con- sistent with the desired level of system-to-equation fidelity, is available.
yields resu l t s that can be both useful and significant. 4. The analysis of even highly simplified man-machine sys tems by these techniques
: F
35

5. Because of the broad implications of the ideas presented, it can be concluded that the suggested applications of these techniques is by no means exhaustive.
Lewis Research Center, National Aeronautics and Space Administration,
Cleveland, Ohio, May 1, 1970, 129-02.
36

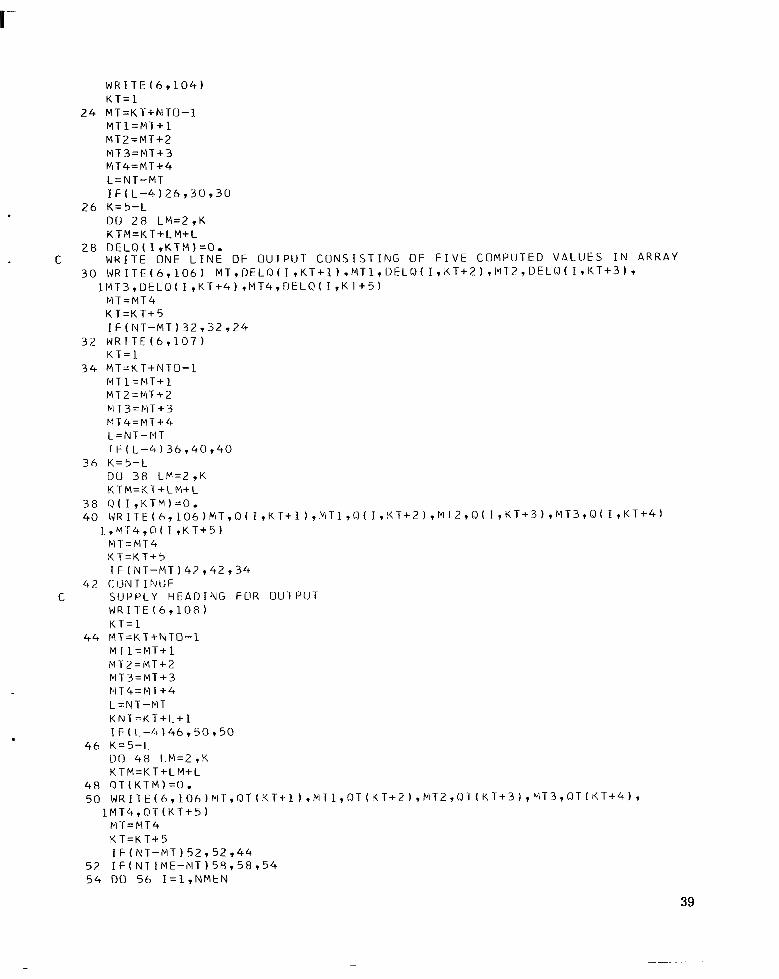
APPENDIX - PROGRAM FOR ANALYSIS OF MAN-MACHINE SYSTEMS
The final digital computer program used t o study the man-machine system discussed in the last section is listed in this appendix.
The system equations that are solved by this program have been derived from the graph displayed in figure 17. This graph is the resul t of appropriate modifications to the network of figure 16 t o include two men involved with three tasks (i. e., sleep, res t , and work).
character is t ics for each man, a definition of each of the t a sks to be included, and a schedule that ass igns every man t o the appropriate task for each t ime interval, wi l l analyze and compute the performance parameters Q(t) and AQ(t) for each man and a l so at) total for the system. These computed values wi l l be listed in tabular form under appropriate identifying headings by the computer.
Following the listing is a sample data set for the same conditions that were ana- lyzed by an ear l ie r and more restr ic t ive computer program. This data set w a s used t o check the performance of the final version of the program by comparison of the r e - su l t s with those previously obtained.
The general nature of the program allows for broad application to a variety of manned systems. If the program is to be used to study and t o modify a given system in earnest , it is recommended that some type of computer-driven plot routine be used t o aid in appreciating the character of the output.
The program, when provided with input data that defines appropriate performance
Plots of some of the output appear in figures 18 to 20.
F I N A L P R O G R A M F O R T H E A N A L Y S I S OF M A N / M A C H I N E S Y S T E M S I N V O L V I N G I N D I V I D U A L M E N A N D A L L f l W I N G F O R B O T H L E A R N I N G A N D L O S S O F " M O T I V A T I O N " b I I T H T I M E .
P R O G R A M L A N G U A G E I S F O R T R A N I V W I T H C O N T R O L S T A T E M E N T S S I J I T A B L E F O R U S E O N AN I B M M O D E L 360/67 D I G I T A L C O M P U T E R .
/ / S T E P E X E C F O R T R A N H / / C O M P I L E . S O U R C E D D :* C A = T H E S L E E P / R E S T A S Y M P T O T E . C B = T H E S L E E P / R E S T I N V E R S E K A T E . C C = T H E " B A S E L O A D " D Q / D T F O R A T A S K . C D = Q ( T ) F O R O I U S E l O F I N E F F I C I E I \ I C Y . C E = I N V E R S E R A T E OF I N C R E A S E A B O V E B A S E R A T E T O C O M P E N S A T E F O R C I N E F F I C I ENCY.
C H = I N V E R S E R A T E O F D E C R E A S E D U E T U F A T I G U k . C G = O ( T ) F O R ONSET OF "FATIGUE".
D I M E N S I O N A 0 ( 1 0 ~ 8 ) ~ ~ ~ ~ ( 1 0 , 8 ) ~ D O ( ~ ~ ~ 8 ~ ~ ~ ~ ~ ~ ~ ~ ~ 8 ) ~ ~ ~ ~ ~ ~ ~ 8 ~ ~ ~ ~ ~ ~ ~ ~ ~ ~ ~ ~ B E T A ( ~ O ~ ~ ) ~ A L P H A ( ~ ~ ~ ~ ~ ~ ~ T ~ ~ ~ ~ ~ ~ ~ ~ ~ ~ ~ ~ ~ ~ ~ T D ~ ~ ~ ~ ~ ~ ~ ~ ~ ~ ~ ~ N J ( 1 0 1
C N M E N = N U M B E R O F MEN I N S Y S T E M . C N R E S T = N I J M B E R O F Q R E C O V E R Y M O D E S A V A I L A B L E . C NWORK = N U M B E R OF W O R K I N G T A S K S T O B E P E R F O R M E D .
37

C N T I M E = N U M B E R O F 1 / 1 0 H O U R T I M E U N I T S P R O G R A M I S T O A N A L Y Z E . R E A D ( 5 9 1 0 0 ) N M E N 9 N R E S T t N W O R K t N T I M E N T A S K = N R E S T + N W O R K
C I S U B S C R I P T R E F E R S T O T H E MEN. C J S U B S C R I P T R E F E R S T O T H E T A S K S .
DO 2 I z l t N M E N DO 1 J z l t N T A S K
C R E A D I N I T I A L V A L U E S O F P A R A M E T E R S . 1 R E A D ( 5 9 1 0 1 )
R E A D ( 5 . 1 0 1 ) ( A L P H A ( I t K ) t K = l y 6 ) 2 R E A D ( 5 1 1 0 1 ) ( E E T A ( I T K ) T K = ~ T ~ )
R E A D ( 5 9 1 0 1 ) ( Q ( I T ~ ) T I = ~ T N M E N )
A O ( 1, J ) 960 ( I t J 1 T D O ( I t J 1 tEO( I t J ) tGO( I t J ) T H O ( I t J 1
OTU=O. DO 3 I = 1 T N M E N Q T O = Q T O + O ( I T 1 ) 3 N T = O
K T = O 5 N T O = N T + l
6 R E A D ( 5 ~ 1 0 0 ) N P T ( N J ( I ) ~ I = ~ T N M E N ) DO 2 0 N T P = l r N P K T=K T + 1 N T = N T + l O T ( K T + l ) = O . D O 2 0 I z l T N M E N
C N J ( I ) = C U R R E N T T A S K A S S I G N M E N T F O R M A N I J=NJ ( I ) X N T = N T I F ( . ! - N R E S T ) R , R T 9
C C O M P O T E C U R R E N T V A L L I E S O F S L I F P / R E S T P A R A M E T E R S 8 A = A ( I ( I t J ) + A L P H A ( I T l ) ’ ~ ~ t X P ( H E T A ( I p l ) ‘ ~ X N T )
e=HIl( I T J ) + A L P H A ( 1 7 2 1 g ’EXP( B E T A ( 1 9 7 )g ’XNT 1 D E L O ( I T K T + ~ ) = ( A - O ( I T K T ) ) / R GO T O 1 5
C C O M P U T E C U R R E N T V A L U E S O F WORK P A R A M t l E K S 9 [)=DO ( I y J ) + A L P H A ( I 3 1 Z’E X P ( B E T A ( I 7 3 i = X N T )
G = G O ( I T J ) + A L P H A ( I , ~ ) ~ ~ X P ( ~ E T A ( I T ~ ) ~ X N T ) H = H [ ~ ( I T J ) + A L P ~ A ( I T ~ ) ~ E X P ( ~ E T A ( I T ~ ) ~ X N T ) C = G / H
C T E S T O ( T ) T O D E T E R M I h l F C O N D I T I O I \ I O F M A N NOW W O R K I N G A T T A S K I F ( O ( I t K T ) - D ) 1 0 ~ 1 0 ~ 1 4
10 IF(o( I 7 K ’ r I - G ) 1 2 , 1 2 1 1 1 1 1 E = E O ( I T J + A L P H A ( I 7 4 1 ’:EX P ( 6 E T A ( I 7 4 1 * X N T 1
C I F G O ( T ) D D E L O ( I , K T + l ) = ( O ( I T K T ) - D ) / E - C GO T U 1 5
C I F O ( T ) G 1 2 D t L O ( I 1 K T + l ) = - Q ( I , K T ) / H
GO T O 1 5 C I F I F O ( T ) D
14 I ) E L O ( I t K T + 1 )= -C 1 5 Q ( I ~ K T + l ) = O ( I t K T ) + D E L O ( I I K T + 1 )
O T ( K T + l ) = O T ( K T + l ) + O ( I T K T + l ) C R E P E A T F O R N P T I M E P E R I O O S
2 0 C O N T I N U E I F ( M T I M E - N T ) ~ ~ T ~ ~ T ~ ~
2 1 I F ( K T - 2 4 0 ) 6 ~ 2 2 ~ 2 2 C W R I T E O U T I N I T I A L A N D F I N A L V A L l l E S O F T I M E A N D I N I T I A L V A L l J E O F 0 T O T A L
2 2 W R I T E ( 6 r l 0 2 ) N T O t N T t O T ~ ~ 00 4 2 I = l t N M E N
C W R I T E CIUT NUMGER OF MAN A N D H I S I N I T I A L V A L U E O F 0 ~ ‘ R I T E ( ~ T ~ O ~ ) I T O ( I T ~ )
38
I -
WR I T E ( 6 9 104 ) K T = 1
2 4 M T = K T + N T O - l M T 1 =FIT+ 1 M T 2 = M T + 2 M T 3 = MT + 3 M T 4 = M T + 4 L = N T - M T I F ( L - 4 ) 2 6 y 3 0 , 3 0
2 6 K = 5 - L DO 28 L M = 2 9 K K T M=K T + L M+ L
2 8 D E L O ( I r K T M ) = O . C W R I T E O N E L I N E O F O U T P U T C O N S I S T I N G O F F I V E C O M P U T E D V A L U E S I N A R R A Y
3 0 I I R I T E ( 6 7 106 M T 9 D E L 0 ( I 9 K T + 1 9 FIT 1 9 0 E L 8 ( I 9 K T + 2 ) 9 1’1 T ? 9 D E L (3 ( I 9 K T + 3 1 9
l M T 3 ~ 0 E L Q ( I , K T + 4 ) ~ M T 4 ~ ~ E L ~ ( I ~ K T + 5 ) PI T = M T 4 K T = K T + 5 I F ( N T - M T ) 3 2 r 3 2 , 2 4
32 W R I T E ( 6 r l 0 7 ) K T = 1
3 4 M T = K T + N T O - l Ivl T 1 = M T + 1 M T 2 = M T + 2 PIT 3 = ClT + 3 M T 4= M T + 4 L = N T - [VI T ! F ( L - 4 ) 3 6 9 4 0 9 4 0
3 6 K z 5 - L DU 3 8 L M = 2 7 K K T M=K T +L M+ L
3 8 ( 3 ( I , K T M ) = O . 40 W R I T E ( 6 , 1 0 6 ) M T y 0 ( I ~ K T + l ) ~ M T l ~ ( J ( I ~ K T + ~ ) , ~ T Z I O ( I , K T + 3 ) r M T 3 r Q ( I t K T + 4 )
I . , Y T 4 , 0 ( I 9 K T + 5 ) M T = CI T 4 K T = K T + 5 I F ( N T - M T 142 9 42 9 34
4 2 C O N T I N U E C S U P P L Y H E A D I N G F O R O U T P U T
W R I l E (6 ,108 1 K T = 1
44 M T = K T + N T O - 1 M T 1 = M T + 1 M T 2 = M T + 2
E.1 T 4 = FIT + 4 L =N T - M T K N T = K T + L + l
M T 3 = r - i ~ + 3
I F (L -4 ) 4 6 9 5 0 750 46 K = 5 - L
DO 4 8 L M = 2 9 K K T M = K T + L M + L
48 O T ( K T M ) = O . 50 l ~ R I T E ~ 6 ~ 1 0 6 ~ ~ l T ~ 0 T ~ K T + l ~ ~ ~ I T l ~ ~ T ~ ~ T + 2 ~ ~ ~ l T 2 ~ 0 T ( K T + 3 ~ ~ ~ l T 3 ~ 0 T ~ K T + 4 ~ ~
1 M T 4 , O T ( K T + 5 ) PI T = M T 4 K T = K T + 5 I F ( N T - P I T 1 5 2 9 52 944
52 I F ( N T I M E - h I T ) 5 8 , 5 8 9 5 4 54 DO 56 I = l r N M E N

5 6 0 ( I 7 1 1 =O ( I 9 K M T 1 QTCI=OT ( K N T G O T O 5
5 8 C A L L E X I T 100 F O R M A T ( Z O I 4 ) 101 F O R M A T ( 8 F l O . O ) 102 F O R P l A T ( 3 0 H l C O M P U T A T I O N S F O R T I M E P E R I O D S T I ~ T ~ H T ~ ~ T I ~ ~ ~ X ~ ~ ~ H I N I T I A L
1 V A L U E O F T O T A L O ~ F l 0 . 3 / 1 103 F O R M A T ( ~ H L M A N T I ~ T ~ X I ~ ~ H I N I T I A L V A L U E OF O = T F 1 0 . 3 ) 104 F O R M A T ( 5 4 H O D E L T A 0 F O R E A C H T I M E P E R I O D - F I V E V A L U E S P E R L I N E / ) 106 F I I R M A T ( 1 H ~ 5 ( 4 X ~ I 4 ~ F 1 2 . 3 ) ) 107 F O R M A T ( l H 1 , / / 4 h H 0 F O R E A C H T I M E P E R I O D - F I V E V A L l J E S P E R L I N E T / ) 1 0 8 F O R M A T ( l H 1 , / / 5 3 H T O T A L 0 F O R E A C H T I M E P E R I O D -- F I V E V A L U E S P E R L
1 I N E , / ) S T O P END
/ :::
C I N P U T D A T A F O R T Y P I C A L R U N
/ / E X E C I I T E . D A T A DD 6 2 2
1 6 0 0 0 . 1 6 0 0 0 .
0 .0 0.0 0.0
16000 . 1 6 O O 0 .
0.0 0 * O 0.0
12500. 40 3 40 1 4 0 3 40 1 80 2 40 3 40 1 40 3 4 0 1 80 2 40 3 40 1 4 0 3 40 1 8 0 2 / *
1 7 2 0 200.0
70.0 0.0 0.0 0.0
200 . 0 70.0
0.0 0.0 0.0
12500 . 1 3 1 3 2 1 3 1 3 2 1 3 1 3 2
0.0 0.0
10000. 0.0 0.0 0.0 0.0
1 0 0 0 0 . 0.0 0.0
0 00 0.0
55 .0 0.0 0 00 0.0 0.0
55 .0 0.0 0.0
0 * 0 0.0
10000, 0.0 0.0 0.0 0 * 0
10000 . 0.0 0.0
0.0 0.0
5 5 .O 0.0 0 .o 0.0 0 *o
55.0 0 00 0.0
40

REFERENCES
1. Christie, K. V. ; and Shepphird, F . H. : Simulation Technique for Extended- Duration Manned Space Missions. Paper 67-206, A I M , Jan. 1967.
2. Smith, Richard M. : Analysis and Design of Space Vehicle Flight Control Systems. Vol. X: Man in the Loop. NASA CR-829, 1967.
3. Anon. : Mission Engineering Study of Electrically Propelled Manned Planetary Vehicles. Vol. I. Rep. ANSO Doc. No. 6300-213, General Electr ic Co. (NASA CR-89338), May 5, 1967.
4. Fakan, John C. : Application of Modern Network Theory to Analysis of Zomplex Systems. NASA T N D-5511, 1969.
5. Maxwell, L. M. ; and Reed, M. B.: The Theory of Graphs: Basis of Network Theory. Pergamon Press, 1969.
6. Seshu, Sundaram; and Reed, Myril B. : Linear Graphs and Electrical Networks. Addision-Wesley Publ. Co . , 1961.
7. Fraser, T. M. : Philosophy of Simulation in a Man-Machine Space Mission System. NASA SP-102, 1966.
8 . Webb, Paul, ed. : Bioastronautics Data Book. NASA SP-3006, 1964.
9. Wahlund, Roger: Determination of the Physical Working Capacity. Acta Medica Scandinavica, Stockholm, 1948.
10. Ridgway, J. ; with Atwater, J. : We Rowed Across the North Atlantic. Saturday Evening Post, Nov. 5, 1966, p. 31.
NASA-Langley, 1970 - 5 E - 56 12 41

NATIONAL AERONAUTICS AND SPACE ADMINISTRATION WASHINGTON, D. C. 2054G
OFFICIAL BUSINESS FIRST CLASS MAIL
POSTAGE AND FEES. PAID NATIONAL A E R O N A ~ ~ ~ C S AND
POSTMASTER: If Undeliverable (Section 158 Porral Manual) Do Nor Return
”The aesoizni{tical and space actizities of the Uiaited Stntes shall be coizdncted so as to coiztsibzcte . . . t o the expnnsion of hiittian knorul- edge of pheuoiiieiza iia the atntosphere ami space. T h e Adiuiizistratiou rhall psoi’ide fos the widest prncticable diad nppropriate disseiiiimtioia of iizforuintion concesniiig its actizjities nizd the resdts thereof.”
-NATIONAL AERONAUTICS AND SPACE ACT OF 1958
NASA SCIENTIFIC AND TECHNICAL PUBLICATIONS
TECHNICAL REPORTS: Scientific and technical information considered important, complete,:and a lasting contribution to existing knowledgg!; ;; . ,
TECHNICAI: NOTES: Irfformation less broad in scope but.nevertheless of. importance as a contribution to existing knowledge.
TECHNICAL MEMORANDUMS: Inforination receiving limited distribution because of preliminary data, security classifica- tion, or other Basons.
CONTRACTOR REPORTS: Scientific and technical information generated under a NASA contract or grant and considered an important contribution to existing knowledge.
-r .
TECHNICAL TRANSLATIONS: Information published in a foreign language considered to merit NASA distribution in English.
SPECIAL PUBLICATIONS: Information derived from or of value to NASA activities. Publications include conference proceedings, monographs, data compilations, handbooks, sourcebooks, and special bibliographies.
TECHNOLOGY UTILIZATION PUBLICATIONS: Information on technology used by NASA that may be of particular interest in commercial and other non-aerospace applications. Publications include Tech Briefs, Technology Utilization Reports and Notes, and Technology Surveys.
/
Details on the availability of fhese publications may be obtained from:
SCIENTIFIC AND TECHNICAL INFORMATION DIVISION
NATIONAL AERONAUTICS AND SPACE ADMINISTRATION Washington, D.C. 20546
.