application of metabolomics for discrimination and...
TRANSCRIPT

Application of metabolomics for discrimination and sensory predictive
modeling of food products
Sastia Prama Putri Assistant Professor
Department of Biotechnology, Graduate School of Engineering Osaka University, JAPAN
December 1, 2015 APRSAF-22, Bali, Indonesia
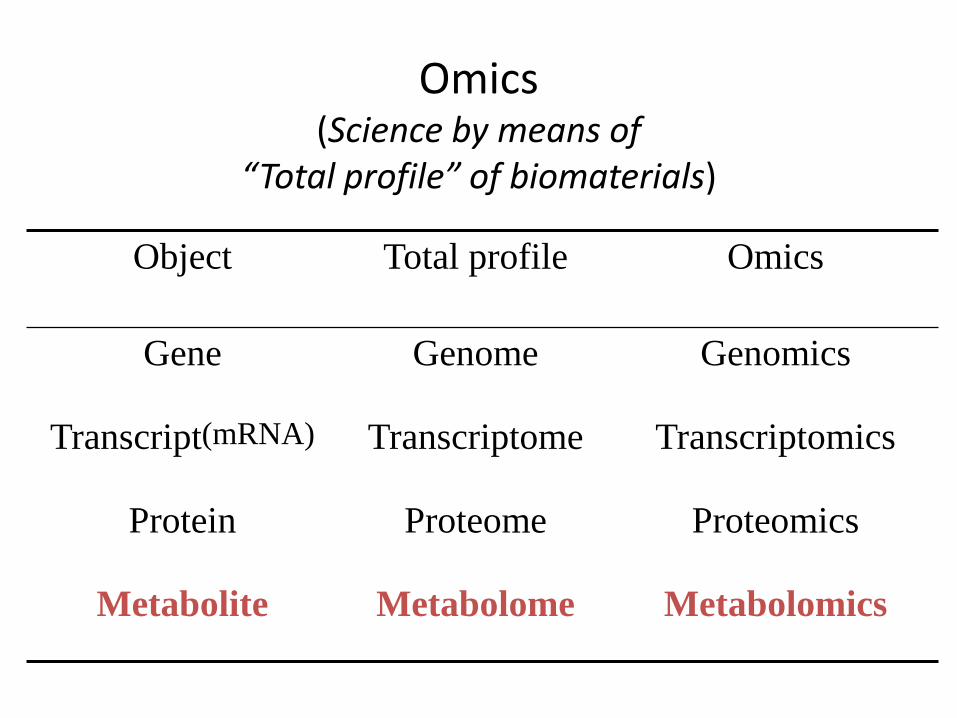
Omics (Science by means of
“Total profile” of biomaterials)
Object Total profile Omics
Gene Genome Genomics
Transcript(mRNA) Transcriptome Transcriptomics
Protein Proteome Proteomics
Metabolite Metabolome Metabolomics
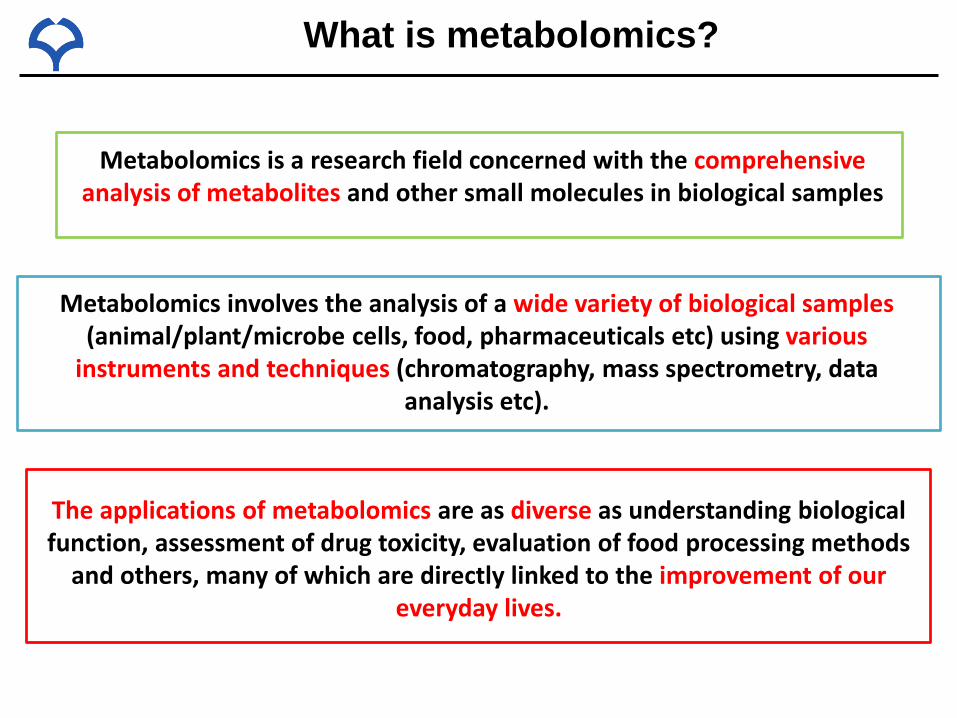
Metabolomics is a research field concerned with the comprehensive analysis of metabolites and other small molecules in biological samples
Metabolomics involves the analysis of a wide variety of biological samples (animal/plant/microbe cells, food, pharmaceuticals etc) using various
instruments and techniques (chromatography, mass spectrometry, data analysis etc).
The applications of metabolomics are as diverse as understanding biological function, assessment of drug toxicity, evaluation of food processing methods
and others, many of which are directly linked to the improvement of our everyday lives.
What is metabolomics?

①Biomaterials
②Sampling
sugar
organic acid amino acid
lipid terpenoid
phenolics
alkaloid ③Pre-treatment
④Analysis ⑤Matrics formation
代謝産物x1
・・・ 代謝産物xn
No.1 x11 ・・・ x1n
・ ・ ・
・ ・ ・
・ ・ ・
No.m xm1 ・・・ xmn
⑥Data Mining
“Metabolomics”is an interdisciplinary research between Bioscience,Analytical chemistry and Informatics
⑦Feadback

Metabolomics in food science
5
FOOD Chemical pools consisting of thousands of metabolites and its interaction in a form of solid, semi-solid and liquid matrix
Metabolomics Exhaustive profiling of metabolites
R O
NH2
OH
O HO
HO OH
OH
DNA mRNA Protein Metabolite
Final readouts of metabolism
Physiological Phenomenon
Determination of the ratio of chemical
constituents
Seeking specific marker
Global (physical & chemical) analysis
Food quality evaluation
Wishart, Trends Food Sci Technol, 2008, Cordella et al, J Agric Food Chem, 2002

The power of metabolomics
Kopi Luwak Regular coffee
~ ¥ 3000/100gr ~ ¥ 300/100gr
Biological samples
Extraction & Derivatization Methanol,
water, chloroform = 5/2/2
Methoxyamine hydrochloride & MSTFA
Metabolite measurement (GC/MS, GC/FID)
Peak table list (sample vs metabolite) Data preprocessing
Seeking specific marker (and its expandability)
Discriminative
Determination of the ratio of chemical
constituents
Predictive Informative
Multivariate data analysis

Data mining by multi-variate analysis
E
D B
F
G
C
A
Complicated Phenotype Metabolome analysis
A B
C
D E F
G
Cluster separation depending to phenotype
a b c d e f g h i j k l A B C D E F G Metabolome Matrix
Metabolite Level
x1
x2
x3
x4
y
t1
t2
Explanatory variate (X)
Latent Structure (T)
Response (Y)
Metabolome Data Compaction
Phenotype
Metabolome based Prediction of Phenotype
Concept of predictive metabolomics

Metabolic profiling of food
8
http://www2.fukusaki-lab.com/

9 など
Basically, there are 4 steps for research using technique of metabolic profiling 1. Sample preparation 2. Acquisition of food quality data such as sensory evaluation 3. Acquisition of components data 4. Data analysis by using multivariate analysis
O
H
HO
H
HO
H
H
OHHOH
OH
H3C OH
Food
Taste
Flavors
Grades
Sugars
Alcohols
Amino acids
Palatability etc. etc.
Analysis of relation between functions and components
Functions Components
Sensory analysis (Quality evaluation) Analysis by instruments
H2N
O
OH
Research of food

10
Koji-mold Aspergillus oryzae
Yeast Saccharomyces cerevisiae
starch protein
lipid brown rice polished rice steamed
Sugars Amino acid Fatty aicd
Alcohol Sugars
Amino acid Fatty acid
Ester
Aroma Tastes
A B
C D E F
G
instrumental analysis
Statistics Analysis Flavor attributes are modeled by means of instrument and statistics analysis
Sensory evaluation
About research
Components profiling of Sake (Japanese rice-wine) Sake, a Japanese rice wine brewed with koji and yeast, is a traditional alcoholic beverage. Various components are generated in fermentation process and contribute to flavor. The
history of the research about sake is long but it has uncleared abut the relationship between components and sake flavor such as “Kire” or “ smoothness”

High rank green tea contains epicatechins.
Multivariate analysis Ranking sample
1 Green tea A
2 Green tea B
3 Green tea C
・ ・
・ ・
64 Green tea X
or or or
Green tea
Predicted ranking Obs
erve
d ra
nkin
g
It is possible to predict green tea ranking by instruments
Prediction of green tea ranking by instruments
Sensory analysis
Analysis by instruments
R2=0.833
NMR FT-IR LC/MS GC/MS Epicatechin
OH
OH
HO OOH
OH
Pongsuwan, W., et. al., J. Agric. Food Chem., 55, 2, 231-236(2007) Tarachiwin, L., et. al., J. Agric. Food Chem., 55, 23, 9330-9336 (2007) Ikeda, T., et. al., J. Agric. Food Chem., 55, 24, 9908-9912 (2007) Pongsuwan, W., et. al., J. Agric. Food Chem., 56, 22, 10705-10708 (2008) 11
A set of ranked green tea samples from a Japanese commercial tea contest was analyzed with the aim of creating a reliable quality-prediction model. In addition, metabolites that play an important role in green tea’s grade classification were identified.

Sensory test of Green Tea by skilled panelist
Taste Aroma
Color

exclude ribitol & solvent:PCA-3:Loadings
19.99 29.991 39.989Variable
-0.2
-0.0
0.2
Lo
ad
ing
s
Theanine
Quinate
Sucrose
Ribose
-20 0 20
Factor1
-20
0
20
Fa
cto
r2
Yama 1Yama 2
Yama 3
Yama 4Yama 5
LGT 1
LGT 2
LGT 3
LGT 4LGT 5
Low High
(Factor1)
(Fa
ctor
2)
Fructose
Mannose
Arabinose
Loading plot of PC1 (factor 1)
High grade tea and Low grade tea are clearly separated by GC/MS based PCA analysis.
PCA score plot
Yellow: high amount in high grade tea Orange: high amount in low grade tea
Comparison of high grade green tea and low grade one

Identification of discriminant marker
Multivariate data analysis (PCA, OPLS/DA)
GC/MS-based metabolic profiling of civet (Luwak) coffee Luwak coffee made from coffee berries that
have been eaten by Asian palm civet or Luwak.
Luwak coffee acclaimed as the world’s most expensive coffee, owing to unique flavor and unexpected processing.
However, practical method for authentication is not available.
Secreted coffee bean
Coffee berry
Luwak
Objective To develop rapid and robust method for the authenticity assessment of civet (Luwak) coffee
Strategy
Metabolic profiling
(GC-Q/MS)
Validation of applicability of discriminant marker to distinguish various commercial coffee products
Marker
original imitation
blend Roast bean
Ground coffee bean
Raw bean (washed & dried)
U Jumhawan, et. al., J. Agric. Food Chem., 61, 33, 7994-8001 (2013)

Results and Discussion Validation of the applicability of discriminant marker
15
Samples were well-clustered in PCA generated by projecting discriminant marker candidates as inclusion list
Sample replication (n) = 3 Scaling = Pareto −−− Authentic Kopi Luwak
Principal component analysis for validation
Adulteration coffee
Regular coffee
Coffee blend
Kopi Luwak

Analysis of the relation between taste and components of soy sauce
Sensory analysis
Metabolome data
Multivariate analysis
Projection to Latent Structure (PLS)
Intensity of each attribute
Soy sauces
• Prediction of each intensity from metabolome data
• Identification of highly correlated compounds dipeptide etc. Organic
acids Amino acids
OH
O
OH
Umami Sweetness Saltiness
etc.
H2N
O
OH
16
Low-molecular hydrophilic compounds
O
H2 N
OHN
OH
GC/MS&LC/MS
Yamamoto, et. al., J. Biosci. Bioeng., 114, 170-175 (2012) Yamamoto, et al., J. Biosci. Bioeng (in press)

Metabolomics contribution to banana research
17
Metabolites changes in banana ripening process under microgravity condition Sampling
GCMS-QP2010 Ultra (Shimadzu)
Sample return to earth
results
feedback
Banana in different stage
UHPLC-UV (Shimadzu)
Key metabolic steps in banana ripening process
Dynamicity of
metabolite changes of banana ripening process in space environment
Monosaccharide, sugar alcohol, organic acid, fatty acid, amino acid Sugar, nucleic acid,
protein, fatty acid Waring Blender
WSB 33E
CBEF(1G)
CBEF(Micro-G)

Publications on food research

19
• Ono D, Bamba T, Oku Y, Yonetani T, Fukusaki E., “Application of Fourier transform near-infrared spectroscopy to optimization of green tea steaming process conditions. J Biosci Bioeng. 2011 Sep;112(3):247-51. Epub 2011 Jun 2.
• Jumtee, K., Bamba, T. and Fukusaki, E. "Fast GC-FID based metabolic fingerprinting of Japanese green tea leaf for its quality ranking prediction." J Sep Sci 32(13): 2296-2304.(2009) Epub ahead of print on 2009/06/30
• Pongsuwan, W., Bamba, T., Harada, K., Yonetani, T., Kobayashi, A. and Fukusaki, E. "High-Throughput Technique
for Comprehensive Analysis of Japanese Green Tea Quality Assessment Using Ultra-performance Liquid Chromatography with Time-of-Flight Mass Spectrometry (UPLC/TOF MS)." J Agric Food Chem 56(22): 10705-10708.(2008)
• Ikeda, T., Altaf-Ul-Amin, M., Prvin, A. K., Kanaya, S., Yonetani, T. and Fukusaki, E. "Predicting Rank of Japanese
Green Teas by Derivative Profiles of Spectra Obtained from Fourier Transform Near-Infrared Reflectance Spectroscopy." Journal of Computer Aided Chemistry 9: 37-46.(2008)
• Pongsuwan, W., Bamba, T., Yonetani, T., Kobayashi, A. and Fukusaki, E. "Quality Prediction of Japanese Green Tea
Using Pyrolyzer Coupled GC/MS Based Metabolic Fingerprinting." J Agric Food Chem. 56(3): 744-750 (2008) • Ikeda, T., Kanaya, S., Yonetani, T., Kobayashi, A. and Fukusaki, E. "Prediction of Japanese green tea ranking by
fourier transform near-infrared reflectance spectroscopy." J Agric Food Chem 55(24): 9908-9912.(2007) • Tarachiwin, L., Ute, K., Kobayashi, A. and Fukusaki, E. "(1)H NMR based metabolic profiling in the evaluation of
Japanese green tea quality." J Agric Food Chem 55(23): 9330-9336.(2007) • Pongsuwan, W., Fukusaki, E., Bamba, T., Yonetani, T., Yamahara, T. and Kobayashi, A. "Prediction of Japanese
green tea ranking by gas chromatography/mass spectrometry-based hydrophilic metabolite fingerprinting." J Agric Food Chem 55(2): 231-236.(2007)
Green tea
20
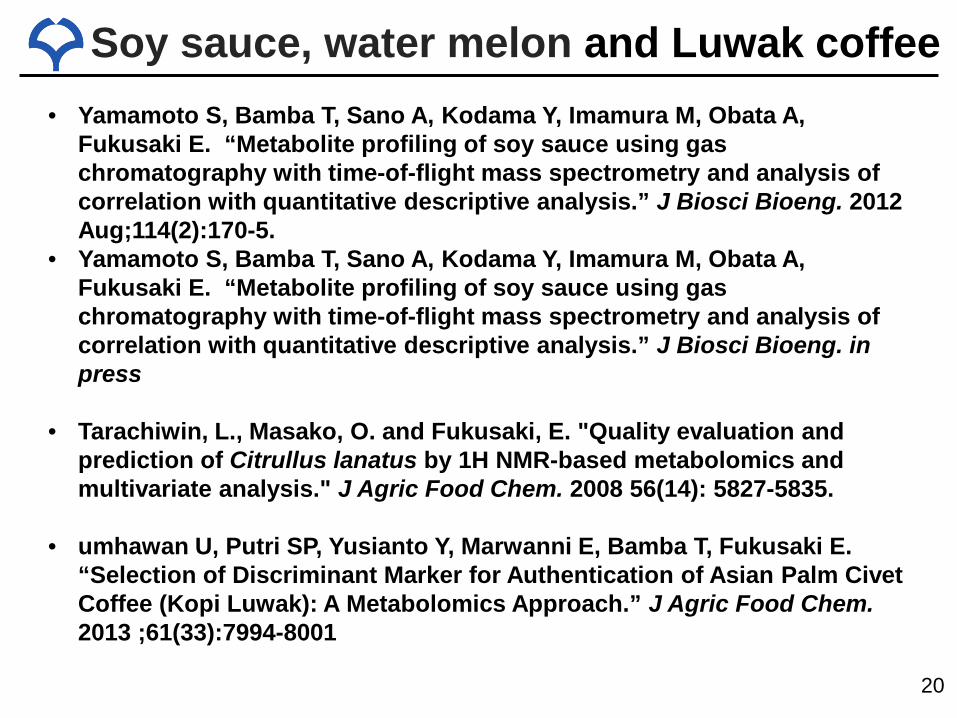
• Yamamoto S, Bamba T, Sano A, Kodama Y, Imamura M, Obata A, Fukusaki E. “Metabolite profiling of soy sauce using gas chromatography with time-of-flight mass spectrometry and analysis of correlation with quantitative descriptive analysis.” J Biosci Bioeng. 2012 Aug;114(2):170-5.
• Yamamoto S, Bamba T, Sano A, Kodama Y, Imamura M, Obata A, Fukusaki E. “Metabolite profiling of soy sauce using gas chromatography with time-of-flight mass spectrometry and analysis of correlation with quantitative descriptive analysis.” J Biosci Bioeng. in press
• Tarachiwin, L., Masako, O. and Fukusaki, E. "Quality evaluation and prediction of Citrullus lanatus by 1H NMR-based metabolomics and multivariate analysis." J Agric Food Chem. 2008 56(14): 5827-5835.
• umhawan U, Putri SP, Yusianto Y, Marwanni E, Bamba T, Fukusaki E. “Selection of Discriminant Marker for Authentication of Asian Palm Civet Coffee (Kopi Luwak): A Metabolomics Approach.” J Agric Food Chem. 2013 ;61(33):7994-8001
Soy sauce, water melon and Luwak coffee

21
• Ochi, H., Naito, H., Iwatsuki, K., Bamba, T. and Fukusaki, E.: Metabolomics-based component profiling of hard and semi-hard natural cheeses with gas chromatography/time-of-flight mass spectrometry, and its application to sensory predictive modeling. J. Biosci. Bioeng., 113, 751–758(2012)
• Ochi, H., Bamba, T., Naito, H., Iwatsuki, K. and Fukusaki, E.: Metabolic fingerprinting of hard and semi-hard natural cheeses using GC/FID for practical sensory prediction modeling. J. Biosci. Bioeng., 114, 506 – 511 (2012)
• Ochi, H., Bamba, T., Naito, H., Iwatsuki, K. and Fukusaki, E.: Monitoring the ripening process of Cheddar cheese based on hydrophilic component profiling using gas chromatography-mass spectrometry. J. Dairy. Sci., 96, 12, 7427-7441 (2013)
Cheese

Final Remarks
Metabolomics is a very useful tool for various fields of science and engineering
It is up to you where and how to use this new technology. Use your imagination and you will get
new and exciting discovery using metabolomics

23
Thank you for your kind attention