application of investment appraisal techniques by small
TRANSCRIPT

Journal of Economics and Sustainable Development www.iiste.org
ISSN 2222-1700 (Paper) ISSN 2222-2855 (Online) DOI: 10.7176/JESD
Vol.10, No.14, 2019
6
Application of Investment Appraisal Techniques by Small and
Medium Enterprises (SMEs) Operators in the Tamale Metropolis,
Ghana
Tijani Yakubu Ndanyenbah1* Alhassan Zakaria2 1.Tree Aid Ghana. P.O Box ER 217, Tamale, Ghana.
2.Bagabaga College of Education, Tamale, Ghana
Abstract
The small and medium enterprise (SME) sector deficiency in adherence to best operational practices has been discovered to be one of the major causes of investment failures and the dwindling growth in productivity of the sector. Among these best operational practices that the SME sector is asserted to be deficient in practice is investment appraisal to predict investment profitability and success. Nevertheless, there are divergent findings of existing research works on whether SME operators practice investment appraisals or not. This research therefore examined the application of the basic Investment Appraisal Techniques (IATs) by SME operators in the Tamale Metropolis. The descriptive and referential research design technique was used. The simple random sampling technique was also used to collect data from 400 SME operators with the use of structured questionnaires. The data gathered was analysed with the use of SPSS tool to perform multinomial regression and Chi-square Test (X2) analysis. The research found that SME operators in the Tamale Metropolis had significant knowledge in the various basic IATs. There was also a significant application level of the IATs by the SME operators. Although the SME operators demonstrated significant knowledge and application level in the various IATs, it was discovered that they did not use the theoretical mathematical formulae of the IATs in appraising their investments. It was also discovered that operator’s knowledge in an IAT had insignificant influence on its’ application by the operator. The choice of the IATs by the SME operators was found to be significantly influenced by the SME Operator’s gender, educational level and risk behaviour and the investment size and the business or industry type. However, regulation or legal requirement was found to have insignificant influence on the choice of IATs by the SME operators. Keywords: Investment Appraisal Techniques, discounted cash flow techniques, non-discounted cash flow techniques, Accounting Rate of Return, Capital Asset Pricing Model, Cost Benefit Analysis, Discounted Cash Flow, Expected Rate of Return, Internal Rate of Return, Net Present Value, Payback Period, Profitability Index, Return on Capital Employed, Value-at-Risk. DOI: 10.7176/JESD/10-14-02 Publication date:July 31st 2019 1.0 INTRODUCTION
The goal of every investment in the business environment is to maximise wealth of owners and the firm’s value within a specified time period (Levy & Post, 2005). However, the achievement of this goal is mostly surrendered by a lot of uncertainties which can only be averted through adherences to best practices and theories in the business environment (Agyei-Mensah, 2010). Bank Negara Malaysia (2003) revealed in a case study it conducted on Small and Medium Enterprises (SMEs), that for SMEs to survive in the business environment in the long term, the key elements that they should adopt are prudent financial management and best operational practices. Best practices of investment would ensure that available resources of business entities are efficiently and effectively used to provide optimum return for investors and the SMEs firm value appreciation (SME Corporation Malaysia, 2011). In affirmation to the importance of adherence to best practices in business, Hassan et al. (2012) stressed that good financial management is essential to every establishment’s success and without it an establishment is set for a failure from the outset.
Titman et al. (2010) defined financial management as a strategy of ensuring addition of economic value. Azhar et al. (2010) elaborated this by explaining that financial management includes financial planning and control, financial accounting, financial analysis, management accounting, investment appraisal or capital budgeting, and working capital management. It is therefore obvious that adherence to best operational practices is an essential risk management factor and among these risk management practices in investment is the application of the investment appraisal techniques (IATs) to predict the viability and success of an investment asset (Mamo, 2014).
To facilitate stronger and sustainable business or investment growth, decisions on how to allocate resources are very essential, hence require a systematic, analytical, and thorough approach as well as sound judgment. The possibility of an investment not attaining its objective(s) has therefore facilitated the development of strategies by authorities in the field of finance and economics geared towards eliminating or minimising the effect of these risks on investments. According to Mamo (2014), among these measures to combating risks on investment is the application of IATs in predicting the survival and profitability of an investment asset before resources are

Journal of Economics and Sustainable Development www.iiste.org
ISSN 2222-1700 (Paper) ISSN 2222-2855 (Online) DOI: 10.7176/JESD
Vol.10, No.14, 2019
7
committed. In support of Mamo (2014), Imegi et al et al. (2015) elaborated that the complexity of contemporary business environment has made the application of the traditional investment appraisal techniques ineffective in managing these uncertainties and therefore would need more sophisticated risk management models. Although the mathematical investment appraisal models have received much recognition in theory to be effective for investment risk management, there are other approaches to investment appraisal. That is apart from the statistical approach to investment appraisal as supported by the statistical or graphical school of thought, investment can also be appraised qualitatively normally referred to as ‘gut feeling’ as supported by the intuitionist school of thought and the integration of both approaches as supported by the integration approach school of thought.
These schools of thought have created unending debate on the best approach to investment appraisal. Nevertheless, this research focused on the statistical approach to investment appraisal. The dynamism characteristics of risk have continued to influence the redevelopment of existing risk management models and design of new ones to match existing investment risks. Therefore, as recommended by Imegi et al et al. (2015), there is the need for authorities to regularly review the existing models to make them relevant to contemporary investment situations. Huang and Pearce (2015) however cautioned that even though IATs are essential in investment decision making, their use does not necessarily ensure success of selected projects, because investment success is subject to various uncertainties which are usually difficult to all the time use statistical information to predict. Nevertheless, according to Kilubi (2016), there are some long standing proven theories and best practices in the investment field which when are adhered to or put into practice could mitigate the adverse effect of these uncertainties to investment wealth creation. Pandey (2010) and Peterson and Fabozzi, (2002) explained that the common risk management techniques used in the investment environment range from basic statistical models such as the PayBack Period (PBP) and Accounting Rate of Returns (ARR) or Return on Capital Employed (ROCE) techniques to the discounted cash flow techniques such as the Net Present Value (NPV), Internal Rate of Return (IRR) and Profitability Index (PI) and among others. According to Guerrero (2007), beyond these traditional IATs are models such as sensitivity analysis, cost-benefit analysis, stochastic models and among others used to make further analysis of investments in a highly risky or volatile economy. The investment field is gradually moving away from the trading of physical investment assets to electronic and human networking which risks are very difficult to predict hence need more sophisticated risk management models.
1.1 Problem Statement
The failure and dwindling growth of investments in the SME sector has been largely associated to the informality characteristics of the sector in business operations. That is, the SME sector is well known not to be adherent to best business or investment practices. Their operations and financial management are less regulated and operators hardly adhere to best practices. According to Nancy B. et al (2014), majority of SME operators are noted to have no formal basic education and therefore hardly understand or utilise propounded theories in business. Although this assertion continues to be debated among stakeholders, the informal characteristics of the sector is globally accepted (Agyei-Mensah, 2010).
Notwithstanding the sector’s informality characteristics, the sector has attracted many research works due to its’ potential in contributing to global economic development if the challenges to the sector growth are identified and addressed. One of the long standing mixed research findings in the SME sector is the sector’s operators adherence to the use of the IATs to appraise investment. Some of these research works discovered that SME operators do apply the various IATs in their investment appraisals whereas others research results debunked the assertion. This mixed finding on the application of the IATs by SME operators to assess investment profitability and success had aroused the interest for this research work to assess the application of the IATs among SME operators in the Tamale Metropolis to either confirm or contrast the existing research findings on the problem and to also provide reliable information for stakeholders to guide them in decision making and policies formulations.
Although there had been similar research works on the application of IATs by SMEs operators in other countries, there is no previous research in literature on the application of IATs by SMEs operators in the Tamale Metropolis of Ghana. The Tamale Metropolis in recent time has been discovered to be the fastest growing economy in West Africa with the SME sector showing a rapid growth in terms of numbers (Fuseini et al, 2017). It is therefore worth conducting this research problem at the metropolis to help to early address any challenge that may impede investments successes.
1.2 Research Objectives
The general objective of the research was to investigate the knowledge and application level of the IATs by SME operators in investment decision making. To achieve this overall objective, the research sought to achieve the following specific objectives;
1. To assess the knowledge level of the SME operators in the Tamale Metropolis in the various basic investment appraisal techniques.
2. To determine whether SME operators in the Tamale Metropolis apply investment appraisal techniques in

Journal of Economics and Sustainable Development www.iiste.org
ISSN 2222-1700 (Paper) ISSN 2222-2855 (Online) DOI: 10.7176/JESD
Vol.10, No.14, 2019
8
their investment decisions. 3. To determine the factors that influence the choice of investment appraisal techniques by SME operators
in the Tamale Metropolis.
1.3 Research Questions
In order to achieve the research objectives, the research sought answers to the following questions: 1. What is the knowledge level of SME operators in the Tamale Metropolis in the various investment
appraisal techniques? 2. What are the investment appraisal techniques used by SME operators in the Tamale Metropolis? 3. What are the significant factors that influence the choice of investment appraisal techniques by SME
operators in the Tamale Metropolis?
1.4 Research Hypotheses
The following hypotheses were tested with the Chi-Square (X2) Statistical Test model to give a scientific conclusion to the research findings. H0i: SME operators in the Tamale Metropolis are not knowledgeable in the various investment appraisal techniques. HAi: SME operators in the Tamale Metropolis are knowledgeable in the various investment appraisal techniques. H0ii: SME operators in the Tamale Metropolis do not apply investment appraisal techniques in investment decision making. HAii: SME operators in the Tamale Metropolis apply investment appraisal techniques in investment decision making. H0iii: The choice of an investment appraisal technique by SME operators is not influenced by the gender, educational level and risk tolerance of the owner or manager, investment size, industry type and policy requirement. HAiii: The choice of an investment appraisal technique by SME operators is influenced by the gender, educational level and risk tolerance of the owner or manager, investment size, industry type and policy requirement. 1.5 Significance of the Study
The findings of this research work provide useful information to stakeholders in the field of finance on the knowledge level and the application of the various investment appraisal techniques in the SME sector. Stakeholders such as the financial institutions, government and nongovernmental organisations would also be guided by the findings to fashion out financial policies to enable SMEs operators to adhere to best operational practices. Financial institutions particularly can leverage on the results to insist on SMEs to use IATs to appraise investments before loans are approved for them. Government and non-governmental organisations can also inculcate IATs application in their training or skills development programmes. The improvement of the SME sector operations as asserted by International Labour Organisation (ILO) (2009) report, will improve the productivity of the sector to contribute more to national Gross Domestic Product (GDP) for economic advancement. Academicians can also rely on the results from this research to develop investment appraisal models to suit the understanding and needs of the SME operators to improve upon best investment practices in the SME sector. The findings from the study contribute greatly to filling the research gap in the literature on SME operators’ knowledge and application of the IATs and the factors that influence the choice of the IATs by the SME operators in the Tamale Metropolis. 2.0 LITERATURE REVIEW This section reviewed relevant theories and research works from articles, reports, books, journals and among others on investment, the approaches to investment appraisal, application of Investment Appraisal Techniques (IATs) and their impact on investment performance and among others. 2.1 Investment
Investment can be described as any business activity or decision which involves the commitment of resources with the goal of maximizing the value of the resources committed within a specified period. Investment activities involve strategic decisions and capital spending plan. These includes financing, products development, acquisitions and divestitures, large infrastructure project, staff training and development, research and development, risk management strategies and among others. According to Warren Buffett, investment is the process of laying out money now with a calculated hope to receive more money in the future (Robert, 2004). In fact, every activity of a business organization involves investment with the optimum goal to maximize its’ shareholders (owners) wealth and add value to the firm. Even if the organization is not for profit motive, it will only undertake activities or projects which are cost efficient or have value for money. Therefore, knowing this ultimate goal of investment, most business organisations especially in the formal sector commit huge sum of

Journal of Economics and Sustainable Development www.iiste.org
ISSN 2222-1700 (Paper) ISSN 2222-2855 (Online) DOI: 10.7176/JESD
Vol.10, No.14, 2019
9
resources in cash, time and human resource to ensure that good investments are identified and implemented or undertaken to maximise shareholders’ wealth and the firm’s value.
The types of investment to undertake as asserted by Levy et al (2005) depend on the objectives and constraints of the investor. According to Levy et al (2005), although the prediction of an investment instrument future profitability through the use of IATs is a best investment practice, a good investment decision does not necessarily require the prediction of investment future state, but identifying the objective and risk tolerance of the investor could be very helpful in making the best investment decision. Levy et al (2005) statement does not mean that the use of investment appraisal techniques is irrelevant, but that the choice of IATs is largely influenced by objective of the investment or the organisation and the investor behaviour to risk. For instance, if an investment is appraised to have a positive NPV but is highly risky, such an investment may be rejected by a risk averse investor even though by the rule of the appraisal technique such an investment should have been accepted. Another scenario is where the objective of the investment is to carry out a social responsibility of the company, in this scenario such an investment can still be undertaken even if it has no financial returns to the company.
Therefore, it should be noted that investors have different purposes in mind when investing in any type of investment asset available to them. Some investors are speculators who are willing to invest in investment assets with bigger risks but promise a higher return. Although such investors are considered risk lovers, they do so with a well calculated risk taking level. Other investors have definite goals in mind and therefore will only invest in assets that will definitely achieve them the desired goals. These investors mostly choose risk free assets which do not give higher returns but just to preserve the value of the investment against future unfavourable market conditions. Investors in this category are referred to as risk averse. The other category of investors is the risk neutral. They are much cautious of the risk associated to an investment returns and will only undertake investment with a minimal risk level. Therefore, as indicated by the International Federation of Accountant (2012), even after the outcome of investment appraisal, the decision as to whether to implement an investment is greatly enhanced by going beyond financial and sustainability analysis by considering the investor constraints as well. 2.2 Evolution of Investment
Investment practices have been in existence over decades now. However, the practice of investment has gone through some major transformations to conform to generational needs and technology. Investment in this 21st century is becoming more complex and sophisticated due to the complexity of contemporary business operations. This has therefore resulted in the development of more sophisticated risk management strategies or models by stakeholders in the business environment to help to minimise investment failures. Financial engineering role has been well recognised in investment assets designs and risk management tool development in the 21st century investment environment.
Although there is no generally accepted origin of investment by researchers and authorities, there seems to be a concentrated agreement of Mesopotamia. According to Norton and Jesse (2016), the evidence of investment came to light between 3000 and 500 BC, when ancient Mesopotamia and the other distant societies were noted for practising investment. It was only the elite in society that had the privilege to engage in investment which was limited to agricultural lands and estates. As the society begins to learn and understand the benefits of investment, the practice began to speedily spread across empires in a more organised and unique approaches that continue to advance the investment industry till now. The continuous paradigm shifts of investment have propelled authorities in the field of finance and investment to improve on the traditional investment management approaches and develop new and more sophisticated statistical models such as the advance discounted cash flow, the Brownian motion, Ito’s lemma, the Black-Sholes, Monte Carlos Simulation, Linear Programming models, sensitivity models and among others to accommodate the contemporary investment activities risks (Renee et al, 2016).
2.3 Investment Process Investment management processes as stated by Levy et al (2005) is cyclical process throughout an investment asset maturity period. It is therefore a best practice in investment for investments to go through these processes to minimise risk and maximise returns. The figure 1.1 below summarises the relationship between various stages involved in investment decision making.

Journal of Economics and Sustainable Development www.iiste.org
ISSN 2222-1700 (Paper) ISSN 2222-2855 (Online) DOI: 10.7176/JESD
Vol.10, No.14, 2019
10
Figure 1.1. The Investment Process
Source: Levy et al (2005).
However, the detail stages involved in investment decision making are discussed below. 2.3.1 Strategic Planning The first process in investment decision making is the strategic decision making stage. The strategic planning stage in investment is where top management or board of directors formulate policies, investment portfolios and risk management strategies to guide the organisation’s investments decision making. At this stage, the types of investment, the amount to invest, the acceptable risk and return rates, acceptable durations of investments and among others are considered. 2.3.2 Identification of Investment Opportunities At this stage, individuals’ departments or the whole organisation search for lucrative investment opportunities which are within the strategic plan. It should however be noted that, although it is recommended that all investment opportunities should be within the strategic plan, in a situation where an investment is found to be very lucrative and can help to achieve the organisation’s goal but is not within the strategic plan, such an investment can be updated in the strategic plan to enable its’ approval and implementation. When lucrative investments are identified by the operational level, proposals are submitted to the board or top management for review and further evaluation. 2.3.3 Preliminary Screening of Projects There is the possibility that all investments proposal submitted to top management for reviewed could be profitable but due to scarcity of funds to implement all of them, top management has to make further screening of the investment projects taking into account the organisation’s policies and goal, margin of profitability, riskiness of the project, legal requirement, human resource capacity and among others. The proposal will then be ranked in scale of preference and capital available rationed for their implementation. Less preferred proposal can be rejected or shifted to subsequent years where possible. The preliminary screening could be a quantitative analysis or judgmental or both base on the school of thought of the organisation or management. 2.3.4 Projects Appraisal The research discussions seek to focus on this stage. This stage is where screened investments are assessed either quantitatively or qualitatively to predict their viability and profitability before the decision to committee resource into them is taken.
The quantitative approach is where the various statistical investment appraisal techniques or models are used to predict the viability and profitability of the selected investment proposals. For instance, a project which test negative in most of the techniques gives a clue to management that such a project has a high probability of not been viable or profitable and vice versa.
The qualitative investment appraisal approach is where all non-statistical factors that can influence the project are considered in the investment appraisal process. These factors cannot be quantified or valued in monetary terms but their influence on an investment can be observed or felt or ascertain through experience or cases of study. Examples of these factors are environmental impact, government or political policies, weather conditions, consumer behaviour, competition, raw material, human resource and among others. 2.3.5 Investment Decision Making After the appraisal stage in the investment process, there is the need for a decision to be undertaken from the outcome of the appraisal. This decision in most cases is to accept or reject. Thus after the quantitative or qualitative appraisal of the investment assets, the investor will then decide on which investment asset will help to achieve the objective. Although the theoretical principle guiding the decision stage is to accept (i.e. option to acquire) or reject (i.e. option to abandon), in practice the following options could be further considered; the option to switch, option to expand or contract and the option to upgrade. In all these available options, the common guiding principle is to maximise wealth by minimising risk.
1. Investor
Characteristics
3. Investment Strategy
Development2. Investment Assets
4. Investment Strategy
Implementation
5. Investment Strategy Monitoring

Journal of Economics and Sustainable Development www.iiste.org
ISSN 2222-1700 (Paper) ISSN 2222-2855 (Online) DOI: 10.7176/JESD
Vol.10, No.14, 2019
11
2.3.6 Project Implementation and Monitoring Once an option is chosen at the decision stage, available resource is committed into the investment asset and the performance of the asset regularly monitored to early identify setbacks and address them to avert investment failure. 2.3.7 Post-implementation Evaluation or Audit The post-implementation evaluation stage is the last stage in the cyclical investment process. It is where the project is being evaluated after its’ maturity or lifespan to find out whether investment goal has been achieved or not and what caused the failure or success to help management to make very good decision in subsequent similar projects. 2.4 Relevance of Theories in Investment
The business environment since its’ ancient time of barter trading to its’ transformation to currency, electronic and human networking business transactions has been directly or indirectly regulated by established theories, principles, best practices and cases of study (Levy et al., 2005). In fact, without these theories and principles as revealed by Levy et al. (2005), there will not be a business at the first place since these theories, principles and established cases of study form the foundation of business operation systems. Business is a contract and therefore operates on terms and conditions which are rooted from theories, principles, best practices or cases of study. These theories, principles, best practices and cases of study continue to go through modifications and development to suit the changing business environment. Among these established theories and practices in the business environment is the application of IATs to evaluate and predict the viability and profitability of an investment asset or project (Peterson & Fabozzi, 2002).
IATs are the statistical processes or mathematical models use to assess the future viability and profitability of an investment asset or project. They are considered as investment risk management tools which expand from basic to sophisticated models such as Payback Period (PBP), Internal Rate of Return (IRR), Net Present Value (NPV), Accounting Rate of Return (ARR), the Profitability index (PI) to sensitivity and stochastic or stimulation analysis models (Peterson & Fabozzi 2002). The use of these techniques is considered to be a best practice in investment since it helps to predict whether an intended investment will succeed or not within the possible uncertainties and the available risk mitigation measures. Each of the IATs is uniquely developed to appraise specific investment assets and to achieve a particular investment objective and therefore their effectiveness will always depend on their appropriate application (Constantinides et al, 2003). For instance, the discounted techniques are most appropriate for capital investments since they are more advanced to accommodate the risk associated with these types of investments. The PBP technique is also appropriate for an investor with the objective of recouping the amount invested as fast as possible to avert risk associated with long term investment. Also the stochastic models are appropriate for the prediction of stock prices which behaviours are very volatile and could change many times within a minute. Although Harris (2003) agrees with Constantinides et al (2003) assertion, the researcher added that the effectiveness of these techniques largely depends on the state of the financial system in an economy; hence if the financial system of an economy is weak or volatiles, these techniques will in most cases not give accurate predictions and therefore advised that since investment involves huge sum of money and other resources which when committed, become very difficult to reverse, it is prudent to always make the right decision at the beginning to avert wasting these resources on unprofitable investment assets and the IATs are proven by both theory and empirical evidence to be vital in guiding good investment decision making. 2.5 Investment Portfolio Theory
When an organisation is faced with many lucrative investment assets, there is the need to pool similar investment asserts to a common class for easy management. This aims at minimising the variances (risks) in order to optimise returns. Investment portfolio is the combination of two or more investment type with similar characteristic and treats them as one investment asset. However, in order to get a successful investment portfolio, there is always the need to assess or appraise the various identified investment assets through the use of statistical models such as the expected rate of returns (ERR) or the internal rate of return (IRR), Cost of Capital, Payback period (PBP), net present value (NPV), profitability index (PI) among others to predict the assets which favourably satisfied the applied models concept. When the investment assets go through the appraisal stage and the viable ones are determined and capital available can finance them, then the selected investments assets are grouped by on similar characteristics and put in a ‘basket’. Each of these groups becomes the investment portfolio of the business entity. 2.5.1 Markowitz’s Investment Portfolio Theory
The Markowitz Portfolio Theory was developed in 1952 which explains how investors can diversify unsystematic risk with a well-developed investment portfolio. The theory explains that for investor to diversify unsystematic risk, investment portfolio ought to be developed which the theory referred to as the envelope curve. Within this envelope curve are the set of investment portfolio choices available to the investor. This is illustrated in the diagram below.

Journal of Economics and Sustainable Development www.iiste.org
ISSN 2222-1700 (Paper) ISSN 2222-2855 (Online) DOI: 10.7176/JESD
Vol.10, No.14, 2019
12
Figure 1.2. The Markowitz Investment Portfolio Envelope Curve
Source: Watson and Head (2007).
The curve is represented by AEFCDG. Investor can make combination of investment assets within the curve to form investment portfolios that will minimise risk and maximise returns. Although all assets in the envelope are appraised to be viable, those along the curve AEF are considered to be more efficient. This portion of the curve is referred to as the efficient frontier. This is because, along that arc or the curve, a small increase in risk results in higher returns on investment. On the other hand, assets along AG are less efficient since the rate of risk at this portion is higher than the returns on the portfolio.
With this investment portfolio theory, the research sought to test the knowledge and application level of the basic IAT by the SME operators in the Tamale Metropolis to assessing the viability of investments for better investment portfolios construction in the SME sector. 2.6 Investment Portfolio Construction
To construct investment portfolio, there is the need to set up constraints which will safe guard the achievement of optimisation. That is, constructing a portfolio having a minimum variance for a given level of return. For example,
a construction of a simple portfolio with an objective of optimisation will be; Z = 1-∑ �������� , where Z is the total
risk and Wi are the weight of the assets in the portfolio. This explains that the risk of a portfolio is the function of the variances and covariance of the assets and that of the variance of a single asset is the same as the covariance of an asset itself and the variance is a square unit of measurement making the objective function a quadratic function. Also, some portfolios have linear objective functions. Thus such portfolios will
normally need the establishment of constraints which are then formulated and expressed in a functional form to achieve the portfolio objective. For instance, the constraints could be that (i) some funds should be invested in each asset, (ii) all the funds available must be fully invested in the portfolio, (iii) minimum risk level to achieve minimum return must be achieved and among others. With this example, the various constraints will be expressed as; Wi >0 indicating that all assets in the portfolio must have a weight or an amount invested in them
∑ ������ =1. Thus the sum of each asset weight must be equal to 1. Meaning all the available investment should be
invested in the portfolio. R>=0.10. Thus the portfolio must earn a minimum return of 10% or greater. With this portfolio, the optimisation function is a linear function referred to as Linear Programming.
In investment portfolio construction, the following functions could be used; the Kuhn-Tucker condition, Quadratic programming, Vector Transposition, Lagrange Multipliers and the Capital Asset Pricing Model (CAPM). However, the relevant function to this research study is the CAPM. The CAPM is the most common portfolio construction function. It is also referred to as Linear Programming and it expresses the expected return of an asset as a linear function of the risk-free rate of return, the expected market returns and the degree of systematic risk exhibited by the asset. Thus with the CAPM, the expected return of an asset is expressed as; E(r1) = rf + βi(E(rm)
– rf. Where E(r1) is expected rate of return of asset, rf is risk-free rate of return (government treasury bills rate), βi is a measure of systematic risk of the asset and E(rm) being the expected market rate of return of the asset.
Now when each of the assets is combined in a portfolio, the weight average of E(r1) and βi of each asset is

Journal of Economics and Sustainable Development www.iiste.org
ISSN 2222-1700 (Paper) ISSN 2222-2855 (Online) DOI: 10.7176/JESD
Vol.10, No.14, 2019
13
combined. For instance, assuming a portfolio of two assets (a and b) with weights Wa and Wb, expected rate of return E(ra) and E(rb) and systematic risk of βa and βb. With this, the portfolio expected rate of return E(rab) will be Wa E(ra) + Wb E(rb). Similarly, if the portfolio is expressed in CAPM, it will be; E(rab) = Wa [rf + βa(E(rm) – rf)] + Wb [rf + βb(E(rm) – rf)]
Therefore, the objective function of the portfolio will be; Wa [rf + βa(E(rm) – rf)] + Wb [rf + βb(E(rm) – rf)] >=0.1.
2.7 Investment Appraisal Approaches
The assertion of the IATs been the best approach to investment appraisal has intensively been debated by three schools of thought. The divided views on the effective ways to appraise investment have therefore made it very difficult for general acceptance of the best approach to appraise investment. However, the statistical approach seems to be widely accepted in theory but debatable in industry practice. Although the application of the IATs (statistical approach) in investment appraisals has been considered as best investment practice, due to its complexity in usage, most investors do not use this approach to appraise investments. Research has revealed that most SME operators rely on gut feeling and non-scientific approaches to guide their investment decisions making. The gut feeling theory to investment appraisal as support by the behaviourist or the intuitionist school of thought, explains that there are some essential features that influence investment performance which cannot be statistically assessed with the various IATs hence the reliance on the use of only statistical models for investment appraisals could give partial information and mislead investment decision making. This school of thought therefore advocates for the consideration of the investors experience, skills, passion, objective and observation as a best practical approach to assessing investment success (Allen et al, 1998). The intuitionists’ school of thought argued that business success does not necessarily depend on assigned figures but rather the investor’s experience, skills, passion, and among others. They argument that the statistical approach is just estimates of figures which has no practical control on investment and in most case very difficult to be understood and used by most investors. The intuitionist school of thought also argues that the statistical approach lacks objective judgment and could be full of mathematical or arithmetical errors or statistical misinterpretation which could mislead strategic decision making in investment. Pablo (2012) quoting Christine Harper’s reaction to David X. Li’s investment formula, known as a Gaussian copula function which stroked the financial system in the 1980s as a result of mathematical error in the Value-at-Risk (VaR) formula stated that:
“The risk-taking model that emboldened Wall Street to trade with impunity is broken and everyone is
coming to the realization that no algorithm can substitute for old-fashioned due diligence. VaR has failed
to detect the scope of the market’s collapse. The past months have exposed the flaws of a financial
measure based on historical prices” That is the VaR formula which was developed to help investors to predict the investment market behaviour
produced misleading information to investors hence caused most investors to loss investments when the formula failed to predict the collapse of the market in US. This statement made by Christine Harper’s statement clearly affirms to the fact that statistical information is not all the time accurate and hence could not be a bench mark for guiding investment decision making.
Also, the collapse of Enron Company in the USA in 2001 was also discovered to be as a result of financial information manipulations by the company which deceived investors to assess the company as profitable and those who relied on this masked statistical information to undertake investment decisions lost huge sum of their investments when the company was forced to liquidate due to insolvency. Royal Ahold, a Dutch retail group was also disclosed in 2003 to have manipulated its accounts to report increase earnings by hundreds of millions of dollars which deceived credit-rating agencies to give the company a favourable credit risk rate which attracted a lot of investor to the company’s bonds issued. Bondholders of the company suffered a great loss when it was actually uncovered that the company had some liquidity problems (Levy et al, 2005). Warren Buffet, one of the world’s most successful investor, therefore puts it right by stating that “mathematical manipulations of investments are financial weapon mechanisms of mass destruction, carrying dangers that, while now latent, are potentially lethal” (Stulz, 2004). In support of the shortcomings of the statistical approach, Malkiel (2003) disclosed that most investments with favourable predicted real rate of return turn to face survival crises after implementation. This he attributed to the volatility and randomness of underlying economic variables which the traditional statistical models cannot accurately evaluate or predict.
Pham (2013) also added that the common causes of small firms’ failures are overtrading as a result of working capital management problem, lack of raw materials, limited management or technical talent and rigid statistical assumptions. He therefore concluded that investment decision making could be improved significantly if emphasis is placed on asking the appropriate strategic questions which will result in better assumptions to guide decision making rather than absolutely relying on sophisticated investment measurement techniques outcomes. In the research of Brink et al. (2003), it was also disclosed that the low turnover of SMEs in South Africa was as a result

Journal of Economics and Sustainable Development www.iiste.org
ISSN 2222-1700 (Paper) ISSN 2222-2855 (Online) DOI: 10.7176/JESD
Vol.10, No.14, 2019
14
of factors such as small market size, low demand, lack of sufficient knowledge on competitors, poor location of business and high level of illiteracy among the owners or managers, hence the use of investment appraisal techniques were found to be insignificant in the failure of investments. Huang and Pearce (2015) also asserted that angel investors are found of taking investment decision based on passion and experience which in most cases have proven to be effective in investment decision making. Pech et al (2009) explanation to investment portfolios behaviour also affirmed that, although mathematical data influence portfolio management, the human nature or behaviour in investment speculation and spontaneous optimism largely influence best portfolio management and investment success. Therefore, based on these arguments, it could be deduced that the human behavioural factors count a lot in assessing investment success and therefore could not be undermined in investment decision making. In fact, every rational investor is an optimist and it is out of optimism that propels an investor to take an investment decision.
The statistical or graphical school of thought believes that investment is best appraised with statistical data since it produces empirical information for further probing and testing to give vivid or pictorial guide or direction in decision making. The statistical school of thought therefore criticises the intuitionist ideology to be unscientific and therefore is irrelevant in business decision making, since business is science and its’ activities must be able to go through scientific testing or processes. In support of the statistical school of thought in investment appraisal, Glasserman (2013) stated that the mathematical theory of derivatives pricing is both elegant and remarkably practical. Olawale et al (2010) also debunked the assertion that invest appraisal techniques are only theoretically important. They argued that the non-application of investment appraisal techniques can caused one to undertake unprofitable investment decision. Sangster (1993) also disclosed that successful companies in the formal sector are found using sophisticated statistical investment appraisal methods as compared to the small and medium enterprises (SMEs) were investment decision is mostly based on gut of feeling. Kadondi (2002) confirmed Sangster (1993) assertion, when he also revealed that the rampant failure of small companies in Kenya is as a result of the use of simple appraisal methods such as Pay Back Period (PBP) and Accounting rate of return (ARR) which do not give comprehensive guide to decision making while large companies with high net profit margins were discovered to be using complex and sophisticated appraisal models like NPV, IRR and stochastic models like Monte Carlo Model, Black Sholes Model among others. These arguments in support of the use of statistical data to guide investment decision therefore indicate that for a successful investment planning, one needs to give prior attention to strategic analysis, comprehensive investment goals establishment, and investment risk management among others which have statistical data support.
The indecisive approach to investment between these two schools of thought resulted in the creation of a third school of thought referred to as the integration school of thought. This school of thought recommends the integration of the statistical and intuitionist schools of thought ideologies to guide investment decision making. As asserted by Sadler-Smith (2004), the integration will produce comprehensive information to guide good investment decision making. 2.8 Statistical Investment Appraisal Approaches
Investment assets can be statistically pre-appraised (before implementation) or post-appraised (after implementation). The pre-appraisal of investments helps to predict the viability of intended investment and to mitigate possible risk associated with the use of the various IATs whereas the post-appraisal is carried out to assess whether investment objective(s) is or are achieved or not within a specific period of time with use of the various performance ratios such as (i) profitability ratios (i.e. Return on capital employed (ROCE), Net profit margin, Net asset turnover, Gross profit margin, Earning before interest, tax depreciation and amortisation (EBITDA)), (ii) Activity Ratios (i.e. Debtor days or Debtors ratio, Creditor days or Creditors ratio, Stock days or turnover, Cash conversion cycle, Fixed asset turnover, Sale/net current assets), (iii) Liquidity Ratios (i.e. Current ratio, Quick ratio), (iv) Gearing Ratios (i.e. capital gearing ratio, Debt/Equity ratio, Interest cover and interest gearing) and (v) Investor Ratios (i.e. Return on equity, Dividend per share, Earning per share, Dividend cover, Price/earnings ratio, Payout ratio, Dividend yield, Earning yield).
Pre-appraisal of investment assets involves the determination of optimal capital structure, stock evaluation and capital budgeting. However, this research work is focused on the capital budgeting appraisal of investment. 2.8.1 Optimal Capital Structure Approach of Investment Appraisal
As indicated earlier, the optimum goal of every investor is to find ways and means to minimise investment cost and associated risks to help to maximise the expected returns on investment. To achieve this investment goal, one needs to know the costs associated to other sources of financing and how to combine or mix these sources of finance to obtain an optimal capital structure through the application of approved statistical models which include the IATs examined in this research work. The importance of optimal capital structure of investment like other investment theories has been a subject of heated debate in the academia. The debate had resulted in the development of some capital structure theories which are discussed below.

Journal of Economics and Sustainable Development www.iiste.org
ISSN 2222-1700 (Paper) ISSN 2222-2855 (Online) DOI: 10.7176/JESD
Vol.10, No.14, 2019
15
2.8.1.1 The Traditional Capital Structure Theory
Although the traditional capital structure theory is believed to be the pioneer among the various capital structure theories, its concept was developed out of intuition view. That is, it has no theoretical or empirical bases but of common sense. The theory upon two attempts to prove that capital structure has no influence on cost of capital with the use of the net income approach which assumed that creditors and shareholders perceived that debt adds no risk to their investment hence the cost of debt and equity remain the same irrespective of the capital mix. When this assumption of the traditional theory could not stand against time, it again introduced the net operating income approach which assumed that creditor do not react to high gearing and therefore the level of debt in capital structure has no effect on the cost of capital. Finally, the traditional approach was introduced to modify the two failed assumptions. This last approach of the traditional capital structure theory then agreed that more debts add risks to both creditors and shareholders hence there is the need for optimal capital structure where the weighted average cost of capital is minimised. 2.8.1.2 Miller and Modigliani (M&M) Optimal Capital Structure Theories Miller and Modigliani are believed to be the pioneers of capital structure theory which then triggered the other capital structure theories of investment. Miler and Modigliani earlier argument on capital structure was that capital structure of an investment was irrelevant in determining the average cost of capital with the assumptions that there is a perfect market condition, an economy of no tax, risk free debt capital and no transactional costs and therefore whether an investment is financed with debt only or equity only or both, the cost of capital and investment value will remain the same. They therefore indicated that the market value of an investment depends on its expected performance and commercial risk and not its capital structure. Upon counter reactions from other researchers, they later revised their view on the no tax economy and took into account the implication of tax on debt into their model. With this model, they explained that since there is tax relief on debt interest, when more debt is introduced in a capital structure, the tax relief gain from the debt interest payment will compensate for part of the capital cost hence reducing the capital cost by some margin. This therefore changed their previous assertion and they concluded that a capital structure with more debt reduces cost of capital and add value to investment, hence capital structure mix determination is very important in the maximisation of investment worth. However, in respect to these theories, in real investment, capital structure tends to be based on practical considerations than theories. 2.8.1.3 Pecking Order Theory of Optimal Capital Structure
The Pecking Order Theory believed that optimal capital structure should be in order of preference than just a manipulated mix. It therefore suggested that in financing decision, the internal sources of finance should be prioritised and after it is exhausted, debt can be the next option before equity financing. The theory explained that internal source of finance like retained earnings has no cost to capital as compared to debt and equity and between debt and equity, debt financing is much cheaper due to tax relief on debt interest, less transactional cost involved, small debt can be acquired, it has no dilution on ownership. 2.8.2 Stock Investment Evaluation Approach
Stock or share is the ownership right to an investment or a firm’s resources and decision making. Stock or equity capital can therefore be considered as the foundation of every organisation’s financial structure since the commencement of every organisation has ownership which is acquired by the sacrifice or commitment of one’s resources. However, in order to determine whether it worth to acquire a share of an investment asset or not, best practice demands that appraisal of that particular asset is done to determine its price, returns, dividend, risk, cost of equity and among others before decision is taking. These are what stock evaluation seeks to achieve in investment appraisal. Stock evaluation is only suitable for appraising assets trading in the stock market. 2.8.3 Capital Budgeting Approach
Ideally, investors should undertake all investment opportunities that would enhance their wealth and the firms value but because of scarcity of the resources to sometimes pursue all these investment projects, best practices demand that management scrutinise those investments through the use of capital budgeting techniques to determine which investment will yield the most return within a given period. Capital budgeting is the process of assessing potential investment assets profitability and survival within a specific period of time. These assets normally involve hunger sum of capital and are of long term duration. Such investment assets include projects such as building, fixed asset purchase or development or manufacturing and long-term business establishment. Capital budgeting is also known as investment appraisal which involves the application of the IATs such as net present value, internal rate of return, payback period, profitability index and among others to evaluate and predict the profitability and survival of an investment asset. 2.9 Investment Appraisal Techniques (IATs)
Investment appraisal is one of the processes or best practices in investment which has been noted to be very essential in predicting the viability of investment assets. This stage of investment process aims at mitigating any associated risk to an investment asset. According to Pandey (2010), investment appraisal is an important process for investment success since viability and profitability centre on the accuracy of predicting the investment future

Journal of Economics and Sustainable Development www.iiste.org
ISSN 2222-1700 (Paper) ISSN 2222-2855 (Online) DOI: 10.7176/JESD
Vol.10, No.14, 2019
16
behaviour. Therefore, the ability to give accurate prediction of the future behaviour of an investment asset is what IATs seek to achieve. IATs are statistical investment appraisal models developed to give quantitative assessment of investment assets future viability and profitability. They range from basic to sophisticate depending of the volatility of the investment asset. These IATs range from basic to more sophisticated models and applicable depending on the asset volatility. They are Net Present Value (NPV), Internal Rate of Returns (IRR), Accounting Rate of Return (ARR) or Return on Capital Employed (ROCE), Modified internal rate of return, Adjusted present value, Profitability index (PI), Equivalent annuity, Payback period (PBP), Discounted PBP and among others.
However, the establishment of statistical data to feed into the various statistical models to appraise an investment asset is always a challenge in practice since it is very difficult to accurately estimate the cash flows and the risks of an investment asset (Saghi-Zedek, 2016). Nevertheless, with experience and the use of primary or secondary data, one can estimate these elements for the appraisal models. Another way to identify cash flows of an investment to aid the appraisal process is by considering all relevant avoidable or incremental costs and benefits of the project. Avoidable cost and benefits are those which can be influenced by the project. 2.9.1 Non-Discounted Appraisal Techniques
Non-discounted IATs are those techniques that do not consider the time value of money. Rather, these techniques use the nominal cash flows and accounting profits in appraising investment projects. Among these techniques are payback period and accounting rate of return or return on capital employed 2.9.1.1 The Pay Back Period Technique
The Payback period (PBP) method tells the duration it is expected to take to recover the principal investment from the net cash flows of an investment asset or project. Although research has revealed that it is the most popular investment appraisal method used by businesses and individuals especially in the small and medium enterprises (SMEs) due to its simplicity, it has been tested over the years and found to be suffering from serious shortcomings (Adeniyi et al, 2012). Due to the weaknesses of the PBP method, Watson and Head (2007) stated that it should not be regarded as one of the investment appraisal techniques for decision making but should rather be used to screen and rank investment for further appraisal to be conducted. Thus the method provides quick insight in how fast an initial investment can be recouped to avert risk. Most managers see risk as time-related and therefore the longer the recoupment period, the greater the chance of failure (risk).
Notwithstanding its wide application, as disclosed by Adeniyi et al (2012), the method ignores the time value of money and thereby giving equal weight to cash flows irrespective of the time period they occur. It also ignores all cash flows after the payback period, hence cannot be used to evaluate mutually exclusive projects since it does not give comprehensive evaluation of projects. Profitable projects with a long term cash inflows are mostly sacrificed for projects with immediate cash inflows which may not be as profitable as the long term project. Although the discounted payback period method which is an advanced approach to the application of the PBP method factors in time value of money, it does not consider risk factors such as inflation, Interest rates, exchange rates among others which could influence the future viability and profitability of investments.
The decision rule applied in the PBP technique is to accept investment asset/project if its’ payback period is equal to or less than the predetermined investment period. Therefore, even if an investment is profitable but has long term cash inflows after the investment period are normally rejected with the application of this method. The PBP Technique formula depends on the nature of the project cash inflow. Where the cash flow is even, the formula is; Payback Period = Initial Investment
Annual cash inflows
Where the cash flow is unequal over the project duration, the appropriate formula is; Payback Period = Average Cash Outflow
∑cash inflows
2.9.1.2 The Return on Capital Employed (ROCE) Technique
The ROCE investment appraisal technique is also referred to as Return on Investment (ROI) or Account Rate of Return (ARR). This investment appraisal technique aims at estimating a favourable return on investment that a project should produce. The return of a project is deemed favourable if the computed value of return on the investment (ROI) exceeds the target rate of return of the business. If there are multiple projects appraised, the project with the higher ROCE/ROI/ARR above the targeted rate of return should be considered first and the others then followed in order of acceptance if capital is available. The ROCE is calculated as the estimated annual or the average net profit of the project life span divided by the capital employed or net investment. Thus ROCE = Earnings Before Interest and Tax (EBIT) X 100%
Capital Employed
Apart from the ROCE simplicity in calculation, as a Discounted Cash Flow (DCF) technique, it considers cash flows in the entire life span of a project. The weakness in this investment appraisal technique is that, it ignores the time value of money by assuming that a cedi today will be the same in years to come. It uses estimated accounting profit to predetermine the rate of return of an investment which could be manipulated to suit the investor interest.

Journal of Economics and Sustainable Development www.iiste.org
ISSN 2222-1700 (Paper) ISSN 2222-2855 (Online) DOI: 10.7176/JESD
Vol.10, No.14, 2019
17
It also ignores the impact of risks on project viability and among others. 2.9.2 The Discounted Cash Flow (DCF) Technique
The discounted cash flow technique applies the concept of time value of money. Thus it explains that an amount of money spent today is worth more than the same amount spent tomorrow due to economic uncertainties associated with the future. Therefore, as indicated by Dixit et al (1994), for an amount to be unspent today must be secured against the uncertainties tomorrow to enable it to achieve the same satisfaction when spent tomorrow. Therefore, money is invested now just because there is the hope to maximise its’ value in the future and this is what the DCF technique seek to achieve. This trade-off is achieved with the compensation (returns) the owner of the resource is to receive for deciding not to spend today but to give the opportunity to someone else to spend today. The accuracy of the trade-off will depend on the sophistication of the model used to determine the return that will not make the future value of the resource worthless.
Unlike the PBP method, the discounted cash flow technique considers both the timing of cash flows, and the total amount of cash flows in an investment life span. It also helps to determine expected rate of return (ERR) or the internal rate of return (IRR) to guide investment financing decisions. Thus if the cost of financing a viable investment/project is higher than the project ERR or IRR, such financing option is not favourable and therefore may need to be negotiated for a lower rate or rejected and an alternative financing pursued. As a corporate objective, every investment seeks to maximize shareholders’ wealth and therefore an investment with IRR less than the cost of capital should be rejected (Welkazi & Sharpiro, 2000). According to Welkazi and Sharpiro (2000), the DCF is advance than PBP and the ROCE techniques and is proven to be vital in guiding to make successful capital budgeting decisions.
Notwithstanding the advance nature of the DCF technique, as indicated by Adeniji et al (2012), the DCF gives one-time appraisal of a project and therefore a project with more than one-year cash flow is limited in the use of the DCF techniques, hence such projects ought to be appraised in separate years. For this reason, a project which might have had a positive NPV or an IRR greater than the cost of capital in the subsequent periods may not be noticed with the use of DCF technique if those years are not appraised.
The rules in the application of the DCF techniques for investment decision making as stated in Henshaw and Smith (2000) are; if the net present value (NPV) of an investment is positive, it means that the investment’s net cash inflows will yield a return (IRR) in excess of the cost of capital of that investment and therefore such a project should be approved for implemented if the targeted rate of return of the firm is the cost of capital. On the other hand, if the NPV is negative, it indicates that the net cash inflows of the investment will yield an IRR less than the cost of capital and in such cases; the project should not be undertaken. However, where the NPV is exactly zero, it means that the investment net cash inflows will yield a return (IRR) exactly to the cost of capital rate; hence the project is worth undertaken. 2.9.2.1 The Net Present Value (NPV) Technique
In most investment appraisals, the estimated costs and benefits are normally spread over a number of years, and each option is likely to have very different cost or benefit profile. In order to compare the options, it is necessary to convert these profiles to a common measure. This is done by ‘discounting’ the stream of annual costs and benefits to produce a Discounted Cash Flow (DCF) as discussed above. The total of these discounted cash flows over the appraisal period is what is referred to as the Net Present Value (NPV).
The net present value (NPV) is a discounted cash flow technique which measures in absolute figures the discounted cash flows of a project life span by taking into consideration the time value of money. Thus the NPV discounts both cash outflows and inflows of a project using an obtained rate of return or cost of capital to predetermine the viability or profitability of a project. The discounted cash outflows (i.e. present value of cash outflows) are subtracted from the discounted cash inflows (i.e. present value of cash inflows) to obtain the NPV of the project. The NPV figure ascertained indicates the returns of the investment in absolute figures. The NPV ascertained could be a positive or negative value. As a rule, in the use of the NPV method for investment decision making is a positive NPV indicates that the project is viable and profitable to be undertaken whereas a negative NPV value reveals unprofitability of the project and therefore it should be rejected. If the NPV result is zero, it means that the discounted cash inflow is equal to the discounted cash outflow and therefore the project will yield a return exactly to the cost of capital, hence is worth undertaking since all operational cost can be covered by the cash inflows of the project. Although in such situation it is assumed that the project will not make any profit, it is still a prudent investment decision to undertake such projects if it has the potential of making profit in the subsequent years if management experiences are put into play. Thus management many be able to turn that project into a profitable one in the subsequent years as a result of the previous work experiences they might have acquired in the implementation of the project. Unforeseen favourable economic indicators such as drastic reduction in debt financing interest, fall in inflation, favourable investment policies by government and among others can also overturn an investment assessed unprofitable today to be profitable tomorrow.
As revealed by Kadondi (2002), the NPV is one of the advance investment appraisal techniques since it has the objective of wealth maximization, and takes into account time value of money and all cash flows of a project

Journal of Economics and Sustainable Development www.iiste.org
ISSN 2222-1700 (Paper) ISSN 2222-2855 (Online) DOI: 10.7176/JESD
Vol.10, No.14, 2019
18
life span. For this reason, Modigliani and Miller (1958) argued that firms should treat financing and dividend decision in investment as irrelevant and rather focus on the result of NPV technique for investment decisions since it has an advance analytical framework which provides a rational basis for collective investment decision making. Nevertheless, the NPV technique ignores the impact of risk on project evaluation. It also does not give the actual rate of return of a project but gives an absolute value which can mislead decision making. The NPV function is expressed as;
Where: Ci = Net cash flows i = Duration of the project r = Rate of discount or cost of capital T= Holding period -Co= Initial Investment or Cash Outflows. 2.9.2.2 The Internal Rate of Return (IRR) Technique
The IRR is also a DCF technique which objective is to ascertain a rate of return which when used as a discount factor should produce a zero NPV. In simple terms it tries to ascertain a rate of return on an investment which will be equal to the cost of financing that investment. This method therefore equips the investor to effectively bargain for a favourable cost of capital not exceeding the IRR range. Therefore, the IRR is the rate within which a borrower of funds is prepared to accept as cost of capital and the lender also satisfied to accept as an expected rate of returns on the funds lent. This therefore means that if the project IRR calculated is less than the cost of capital of the investment, the project will not be able to generate enough net cash flow to pay off the debt with its’ cost and therefore is not profitable and should be rejected or an alternative financing with lower cost or equal to the IRR should be looked for. On the other hand, if the IRR calculated is greater than the cost of capital, it indicates that the project will generate excess net cash flow to pay off the amount invested with its cost and therefore as a rule, such project should be pursued with that financing source. The internal rate of return (IRR) can be expressed as;
Or; IRR= NPV1-NPV2 X 100
NPV1
Where: NPV1 = the NPV using the cost of capital as a discounting factor. NPV2 = the NPV of an estimated rate above or below the cost of capital (which ever will make the NPV2 negative). 2.9.2.3 The Profitability Index (PI) Technique
This investment appraisal method is also a discounted cash flow technique used to ascertain a ratio of the sum of the present values (PVs) of cash inflows of a project to its’ initial investment which is then compared with a bench mark ratio of 1 to determine the viability or profitability of a project.
Thus it measures the ratio of net cash inflow the investment will produce per cedis invested. Meaning if a cedi is invested today, what will be the ratio of the cedi invested to the net cash flow of the investment now? Will it be 1:1, 1: x (where x>1) or 1:x (where x<1)? If ration is 1:1, it means net cash flow of the investment will cover

Journal of Economics and Sustainable Development www.iiste.org
ISSN 2222-1700 (Paper) ISSN 2222-2855 (Online) DOI: 10.7176/JESD
Vol.10, No.14, 2019
19
exactly the amount invested, where ration is 1: x (where x>1) means the net cash flow of the investment will be higher than the amount invested by that number of times and where the ratio is 1: x (where x<1), means that the net cash flow of the investment will be lower than the amount invested by the number of times it is lower.
The investment decision rule in the application of this technique is that, if PI calculated is greater than 1, it means the project is profitable and should be accepted. If the projects are many, capital rationing should be applied to rank them in order with the project with the highest PI prioritised. Where the project(s) PI is or are less than 1, they should be rejected for unprofitability. On the other hand, if PI is or are greater than 1, it means the project will yield higher returns and should be accepted. Project(s) with PI equal to 1 should be accepted since it will yield a return equal to the cedi invested.
The PI technique has a similar calculation of the ROCE and a similar interpretation of the IRR and NPV and therefore in most cases resulting in the same investment decision. As revealed by Lamido (2002), the PI technique does not reveal the profitability of a project in absolute figures as in the case of NPV and therefore could mislead investment decision. The PI technique is also suitable for investment decision making if the project has a cash outflow at time zero and cash inflows in the subsequent periods. This means that projects with higher cash inflows in the long run are likely to be ranked low in investment decision making. The PI function is expressed as; PI= ∑ Cf(1+r)-n
I
Or PI = NPV + I
I
Where: Cf = cash inflows r = Discount rate n = Duration of the project I = Initial Investment or cash outflow. 2.10 Knowledge and Application Level of IATs by SMEs Operators
Although both theory and research seems to be quite agreeing to the positive impact of adherence to best practices of financial management on investment, the knowledge level of the SME operators in these best practices is currently one of the problems facing small firms. Therefore, to ensure the survival of investments and rapid growth of the sector, operators’ adequate knowledge in best practices of finance among which is the application of IATs is very essential. According to Abereijo et al (2005), information asymmetry arising from SMEs inadequate knowledge in some financial management strategies such as accounting records, financial statements preparation, capital budgeting and among others made it very difficult for creditors and investors to assess the creditworthiness of potential SMEs. However, the most unknown and least practiced financial management tool among SME operators is the application of IATs (Harris, 2003). Notwithstanding these assertions of the SMEs operators not or having inadequate knowledge in IATs, researches such as Imegi et al (2015), Munyao (2010), Tagliavini (2001) and among others revealed that SME operators do apply the basic IATs in investment appraisals but hardly apply the sophisticated ones. It can therefore be deduced from these research findings that SME operators are knowledgeable and do apply the IATs in appraising their investments.
However, there has been intensive research in both developed and developing economies on whether the SME operators adhere to best operational and financial management practices or not. Research on this has revealed mixed findings. As the argument of whether the SME sector do use IATs or not, there is an emerging literature describing how the SME sector operators practice investment. According to Katabi and Dimoso (2016), the SME sector appraise investments but does it in a way quite different from theory and sometimes very difficult to align with existing theories. There has not been any specific theory of investment tailored to the SME sector but the existing theories are for general investment practices hence the difficulty of the SME operators to apply them. According to Agyei-Mensah (2010), there is no theory associating the size of a company and complexity of an investment approach but in practice, research has revealed that there is an association of business size and the approach of investment. For instance, Imegi et al (2015) disclosed that the formal sector businesses use complex investment techniques as compared to the SMEs. In support of this assertion, Tagliavini (2001) revealed that the application of simple management accounting techniques is more users friendly and cost-effective to SMEs than the complex ones.
Berger et al (1998), in contrast to these assertions revealed that almost SMEs in the UK use advance investment techniques and therefore a company size has much little influence on the choice of an appraisal technique but the management style of the chief executive. In support of Berger et al (1998), Bell et al (2004), asserted that both the formal and informal business sectors in the UK apply the various investment techniques regardless of the formality of the business. A research conducted in Kenya to find out the extent to which capital
Journal of Economics and Sustainable Development www.iiste.org
ISSN 2222-1700 (Paper) ISSN 2222-2855 (Online) DOI: 10.7176/JESD
Vol.10, No.14, 2019
20
budgeting techniques are applied by corporations, revealed that the techniques are applied in both the private enterprises and the public entities to determine profitability (Munyao, 2010). Kadondi (2002) also studied 28 companies in Nairobi to determine the techniques mostly used to appraise investments and uncovered that majority (31%) use the PBP method and 27%, 23% use NPV and IRR respectively. In a similar research conducted by Khakasa (2009) in Kenya but specifically in the banking industry revealed the use of more sophisticated techniques such as risk analysis, cost-benefit analysis, competition analysis, return on investment, and discounted payback period. The least used techniques were the internal Rate of Return, computer based techniques and the Net Present Value. The Cost Benefit Analysis (CBA) method recorded 92% usage indicating the method highly used in the banking industry and followed by PBP and ROI with 60%, NPV with 8% and the IRR disclosing 0% usage. These research findings therefore have a common conclusion that the application of the IATs has no positive correlation between the size or complexity of firms or investments.
Although research continues to uncover new factors or support existing findings on the choice of investment appraisal approach by business organisations, the guiding principles in the choice of an investment appraisal technique as indicated by Alkaraan and Northcott (2006) are the investment type and objective of the investor. 2.11 Impact of IATs application on Investment Performance
The positive impact of the use of IATs on investment performance continues to be debated by research although they are proven in theory to be very good risk management tools. Klammer (1973), a research conducted in America disclosed that, although most businesses in America adopt sophisticated capital budgeting methods in appraising projects, the sampled companies’ financial performance did not show a consistent significant association with the techniques they used. The research rather revealed that factors such as marketing, product development, and executive recruitment and training, labour relations, reward structure etc. had a greater impact on the companies’ profitability. Haka et al. (1985) also found that in the short run, the application of sophisticated techniques have significant positive impact on firm’s market performance but as it extends to the long run, these techniques become insignificant in the relative market performance of the firm. Thus when there is a switch from the traditional investment appraisal methods to sophisticated ones, the effect in the long term is always economic stress on the firm instead of success since more cost would be needed in research and development and hiring of experts in the application of those sophisticated models. The application of the sophisticated models could also mislead a firm to undertake a very risky investment which could cause financial havoc to the firm. Haka et al. (1985) therefore concluded that the use of sophisticated capital budgeting techniques as asserted by theory and research, does not in practice have superior impact on investment performance. Mooi et al (2001) and Gilbert (2005) conducted in different time periods and geographical locations also uncovered that sophisticated capital budgeting practices do not have significant effect on a firm’s performance.
Although the findings of Haka et al (1985), Mooi et al (2001), Gilbert (2005) and others are quite mind blowing since they contradict theory, it is not absolutely perplexing since such contradictions are encouraged and do exist in research. Factors such as time period, geographical location, sample size, sample elements and research methodology can result in different findings on a particular research problem. However, the issue of concern is that those who asserted to the insignificance of sophisticated investment models to investment performance contradict investment theory which assert to the positive correlation between the use of sophisticated investment models and investment success prediction (Levy et al, 2005).
In contrast to the insignificance of IATs on investment performance, there are also empirical findings that support the positive or significant impact of IATs on investment performance. For example, Moore and Reichert (1989) in America, Kadondi (2002) in Kenya, Berger et al (1998) in UK, Adam and Macgregor (2000), and Mooi et al (2001) all discovered that companies that use sophisticated appraisal techniques show above average financial performance and therefore concluded that the application of sophisticated investment models have significant positive impact on investment success than the basic ones. These researches eluded that firms using modern inventory management techniques and Internal Rate of Return (IRR) recorded superior financial performance than those using the traditional methods like the Pay Back Period (PBP) method and Accounting Rate of Return (ARR). Yao et al., (2006) revealed that a high rate of businesses in Netherlands (89%) and China (49%) use investment techniques such as the NPV and IRR and those firms have shown a superior financial performance. Olawale et al. (2010) conducted in South Africa’s SMEs also disclosed that the use of the traditional or naïve investment appraisal methods like the PBP and ARR do not have significant association with a firm performance but sophisticated techniques like the discounted cash flow techniques showed a significant positive impact on firm’s performance. 2.12 Nature of SMEs
It should be noted that a standard international definition of SME does not exist, however authors and authorities continue to make some attempts to give a common definition but most of those definitions could not stand against the test of time as the sector continues to change in features. In fact, until the sector is clearly segmented and given specific identity, this definitional problem will continue to exist. However, there are existing definitions that try to

Journal of Economics and Sustainable Development www.iiste.org
ISSN 2222-1700 (Paper) ISSN 2222-2855 (Online) DOI: 10.7176/JESD
Vol.10, No.14, 2019
21
look at SMEs by infrastructure, labour type and skills, capital and production size, regulatory requirement, technicality of operations, ownership, and location and among others. The definition of SMEs by size has attracted varied views among researchers. Storey (1994) stated that in some economies all firms may be regarded as small, whilst in others, there may be no small firm at all if the entity, labour and capital or production sizes are used as definitional features. This therefore makes it very difficult to use size to generalize SMEs definition.
The Bolton Committee (1971) also attempted to use the capital size to define SMEs by indicating that for a firm to be classified as SME, it should have a relatively small market share and its’ financing been personalized. The economic and statistical definitions attempted by the Bolton Committee revealed some weaknesses and therefore cannot be used as generally accepted definition. The differences in national policies, regulations and economic fluctuations could cause firms which fall within the committee economic and statistical definitions to be either included or exclude as SMEs. For instance, in a research conducted by Gelb et al (2008) on 7 southern and eastern African countries SMEs database, revealed that there were some large business enterprises which in actual fact ought to be classified as larger enterprises.
The European Commission (EC) also describes SMEs base on the number of employees. Thus firms with 0 to 9 employees are referred to as micro enterprises, 10 to 99 employees are small enterprises and 100 to 499 employees called medium enterprises. The EC definition therefore means that SMEs are firms that have less than 500 employees. With this definition by EC, most business especially in developing country which are seen as companies are likely to be classified as SMEs. The International Conference of Labour (ICL) in an attempted to give a comprehensive definition to SMEs stated that SMEs comprise;
“Units engaged in the production of goods or services with the primary objective of generating
employment and incomes to the persons concerned. These units typically operate at a low level of
organisation, with little or no division between labour and capital as factors of production and on a small
scale. Labour relations, where they exist, are based mostly on casual employment, kinship or personal
and social relations rather than contractual arrangements with formal guarantees”.
This definition describes SMEs as business entity with the objective of creating jobs and wealth for the owners and labour and operation relations are mostly done in an informal way. The weakness of this definition however is the possibility of classifying early stage companies as SMEs since most companies at this growth stage exhibits some of the features in the definition. Also every business organisation creates jobs and has the objective to maximise owners’ wealth, hence the use of job creation and profit motive as specific features for SMEs could be misleading.
The International Labour Organisation (ILO) (2009) also defines SMEs as unregistered firms where the owner is an individual or a household whose capital is not separable from that of the firm and for which there is not reliable accounting that could permit retracing the operations of the firm. The short falls in this definition is it concentration on sole proprietorship businesses. There are other forms of business which are classified as SMEs by other definitions but if aligned to ILO definition will not be described as such. Examples are partnership business, cooperative, associations and among others.
According to Ayyagari et al. (2011), SMEs dominate in global business establishments with an estimated percentage of 95 enterprises across the world. Japan has the highest SMEs globally, accounting for over 99% of total enterprises in Japan (Economist Intelligence Unit, 2010). India in 2008 had about 13 million SMEs, equivalent to 80% of all the country’s businesses (Ghatak 2010). In South Africa, SMEs are estimated about 91% of business entities (Abor & Quartey, 2010). According to Nyamekye et al (2009), the SME sector is twice that of the formal sector globally and is still estimated to grow by five and half (5.5) times that of the formal in the 21st century. 2.13 SMEs in Ghana
As revealed by Aryeetey (2001), SMEs got attention in Africa after a group of Africa Economic Research Consortium (AERC) researched into the continent’s financial markets in 1989. The history of SMEs in Ghana can be traced back to its’ colonial capitalism era in the then Gold Coast (Owusu et al, 2015). SMEs in Ghana are categorized into urban and rural enterprises which comprises petty, micro, small scale and medium scale businesses which are either primary or secondary producers, wholesalers, retailers, intermediary service providers or consumers (Kayanula & Quartey, 2000, GSS, 2017). As there is still no generally accepted definition for SME due to its heterogeneous features, authorities in Ghana continue to make attempts to get a holistic definition for SMEs in the country. However, the commonly used features to describe the sector in Ghana are the number of employees, regulation, business size and ownership (Kayanula & Quartey, 2000). The Ghana Statistical Service (GSS) considers firms with fewer than 10 employees and do not keep proper accounting records managed by a professional as SMEs and businesses with more than 10 employees as medium and large-sized enterprises (Kayanula & Quartey, 2000).
The National Board for Small Scale Industries (NBSSI) and Ghana Enterprise Development Commission (GEDC) also use both the “fixed asset and number of employees” as criteria to define SMEs. NBSSI and GEDC describe firms with not more than 9 workers, and have plant and machinery (excluding land, buildings and vehicles)

Journal of Economics and Sustainable Development www.iiste.org
ISSN 2222-1700 (Paper) ISSN 2222-2855 (Online) DOI: 10.7176/JESD
Vol.10, No.14, 2019
22
not exceeding 10 million Ghanaian cedis as SMEs. With NBSSI and GEDC definition of SMEs, it should be noted that the process of valuing fixed assets poses a problem since fixed assets valuation depends on the market value which may not be the same across economies and even could be volatile within an economy, hence using this as criteria to identify an SME may result a firm been classified as SME today and the next time not seen as such and vice versa. Secondly, the continuous depreciation of the local currency as against major trading currencies often makes such definitions out-dated. The use of employee number could also result in the inclusion of businesses which are not SMEs or exclude SMEs (Kayanula & Quartey, 2000). Notwithstanding this difficulty in identifying SME firms, this research work adopted the GSS definition of SMEs to identify SMEs for the data collection. This definition was adopted because of its’ clarity and also portrays the nature of most SMEs in the country.
The SME sector continues to grow rapidly year by year even though it was predicted to disappear after the restoration of the economy from the great economic depression Nancy et al (2014). Nancy et al (2014) attributes this growth in the sector to the formal sector not been able to create sufficient jobs and to meet the market demand, hence pushes many people SME sector due to its simplicity of operations. The Ghana Statistical Services (GSS), report on the Integrated Business Establishment Survey (IBES) in 2015 revealed that there are 3,383,206 SME establishments representing about 60% of business establishments in the country. This comprises 2% Agriculture, 18% Industry and 80% Service SME businesses. The report also disclosed that the SMEs sector employs over 80% of the country’s workforce meanwhile contribute abysmally low in terms of productivity to the country’s GDP. Nevertheless, a report by the Friedrich Ebert Stiftung in 2016 disclosed that over 80% of SMEs in Ghana were willing to pay tax if they make profit or earn income (Christian, 2017). This therefore indicates that if the SME sector is productive, its contribution to GDP will improve since they will pay more tax and export produce to improve the country’s balance of payment. 2.14 Constraints of SMEs Productivity
Although SMEs continue to help in economic growth acceleration and job creation in developing countries, there are some bottlenecks that affect SMEs full potential to economic development. According to the Organization for Economic Co-operation and Development (OECD) (2009a) the sector contributes an average of 25% to global GDP and 33% to GDP of developing countries.
Quartey (2015) revealed that the causes of this low productivity in the sector include financing problem, lack of best operational and financial management practice, lack of managerial skills, inadequate or lack of equipment and technology, loose regulatory measures and among others. A research conducted by Carsamer (2012) in Ghana on promoting entrepreneurial development among SMEs through financial management, revealed that SMEs financial management and investment practices are below average as they do not have basic knowledge in best financial management, accounting and investment risk management.
Richard (1998) also reported that the most important internal problems identified by small firms in the US relate to inadequate capital, cash flow management and inventory control. Steel and Snodgrass (2008) also discovered that the productivity differential between formal and SME businesses is mainly due to unequal access to public services. Gelb et al. (2009) also revealed that formal sector firms are on average more productive than SMEs due to the difference in the quality of the business environment and the enforcement of rules at each sector. The formal sector is more regulated and operates in a conducive environment than the SMEs. 2.15 Conceptual Framework
Based on the research objectives to be achieved and the hypotheses formulated for testing, the research constructed a conceptual framework as presented in Figure 2.1. Figure 2.1: Research Conceptual Framework
Source: Researcher Construct (2018)
The SME operator’s knowledge level in the IATs will influence application of the IATs by the SME operator and the choice or application of an IAT is influenced by certain factors as presented in Figure 2.1. However, the factors this research examined their level of influence on the choice of the IATs included the SME operator’s gender, educational level, risk tolerance as well as the size of investment, industry type and policy or regulatory requirements. METHODOLOGY
This section of the research work explained the research design, the approach of the research, the research sampling
SME Operators Knowledge in IATs
Choice or Application of IATs by SME Operators
Factors influencing IATs Choice.

Journal of Economics and Sustainable Development www.iiste.org
ISSN 2222-1700 (Paper) ISSN 2222-2855 (Online) DOI: 10.7176/JESD
Vol.10, No.14, 2019
23
technique and how data was collected to answer the research questions and to test the hypotheses to draw scientific conclusion on the research findings. 3.1 Research Design
The research used the descriptive research design. This research design was preferred because is suitable for research which seeks to describe the relationship between variables without influencing the variables in any way but just collect data on the variables in their natural state by observing or issue of questionnaires which are then analysed and described as found. Therefore, since this research used questionnaires to gather the data to describe the relationship among the variable, the descriptive research design was more suitable. 3.2 Population of the Study
According to the Ghana Statistical Services (GSS) Report on the Integrated Business Establishment Survey (IBES) in 2015, there were about 183,375 SMEs business establishments in the Northern Region of Ghana (representing 5.4% of SMEs business establishments in the country). About 60% (i.e. 110,025) of the SME establishments in the Northern Region were located in the Tamale Metropolis. Therefore, since the research was conducted in the Tamale Metropolis, the 110,025 SME establishments in the Northern Region was adopted as the research population. 3.3 Sampling Technique or Design
Because the research sought to provide scientific results and to establish empirical literature, the random sampling technique was used to select elements or respondents for the search data collection. This sampling technique gives non-zero chance to all elements in the population to be selected in the research sample in order to prevent bias in the selection of respondents and to also enable general interpretation of the research findings. 3.4 Sample Size
Due to time and resources constraints, it was not possible to involve the total population of the research for data gathering. However, in order to maintain the scientific objective of the research work, the Taro Yamane function was used to ascertain the sample size for the research. The Taro Yamane function is one of research sample statistical models used to determine a smaller and representative sample size from large research population size. The Taro Yamane function is expressed as below: n = N
1+N(e2)
Where: ‘n’ is the sample size ‘N’ is the research population size ‘e’ is the allowable margin of error (0.05) Therefore, with the use of this sampling function, the research sample size was ascertained as below; n = 110,025
1+110,025 (0.05)2
n= 399
The sample size determined for the research was 399 respondents which was rounded up to 400 respondents. 3.5 Data Collection
The research used structured questionnaire to randomly collect primary data from the 400 respondents for analysis. 3.5.1 Data Collection Instrument
The research used opened and closed-ended structured questionnaires to gather the primary data. The structured questionnaire instrument was preferred because it minimised the gathering of stray data to avoid deviation in data analysis. The instrument also makes it easy to analyse data quantitatively. The questionnaires were randomly administered to only the senior manager or owner of each selected SME. The managers or owners of SMEs are normally responsible for investment and other strategic decisions making and therefore were suitable to provide the data needed for the research.
Due to the large sample size involved, two people were trained to assist in administering the questionnaires. Respondents were directly guided through the questionnaires to enable them to clearly understand each question and to provide appropriate response. The questionnaire administered had two sections; section ‘A’ which comprised open-ended and close-ended questions to gather data on the independent variables. The section ‘B’ of

Journal of Economics and Sustainable Development www.iiste.org
ISSN 2222-1700 (Paper) ISSN 2222-2855 (Online) DOI: 10.7176/JESD
Vol.10, No.14, 2019
24
the questionnaire was in a Likert questions format which gathered data on the dependent variables. Although Berger et al (1998) asserted that the structured questionnaire instrument is technical and therefore is not suitable for data collection in the SMEs sector like the focus group discussion, structured questionnaire instrument was successfully used by Kadonli (2002) and Olawale et al (2010) on SMEs and Munyao (2010), Musonye (2015) and Imegi et al et al (2015) used it in the formal sector business establishments. However, to avert this technical constraint or challenge in the use of the structured questionnaire instrument, the questionnaire went through peer reviews, pre-test and final review and approval by the supervisor. The respondents were also directly guided to understand each question to enable them to accurately respond to the questions. 3.6 Data Analysis
The primary data was analysed and used to test the research hypotheses. To ensure high validity and reliability of the research data and results, the data gathered first went through descriptive and inferential statistical analyses. The descriptive statistical analysis helped to test the reliability and validity of the data at the earlier stage to determine whether to collect more data or to use the available data, whereas the inferential statistical analysis was used to further test the data validity and reliability before the final test on the hypotheses with the use of Chi-Square(X2) and Multinomial Logistic Regression model is done to enable the research hypotheses to be interpreted. The research had a descriptive hypothesis with 2-tailed test of multiple variables. That is independent and dependent variables. The independent variables of the research were:
i. gender of the owner or manager (Gr) ii. educational level of the owner or manager (Ed) iii. risk tolerance or behaviour of the owner or manager (Rt) iv. investment size (Iz) v. policy or regulatory requirement (pq)
whereas the dependent variables were the investment appraisal techniques (i.e. PBP, ROCE, NPV, IRR and PI). 3.7 Statistical Test Tools
The research used the IBM SPSS Statistical software to perform multinomial logistic regression and Chi-Square (X2) Test to analyse the data to establish scientific results for the testing of the research hypotheses. 3.7.1 Multinomial Logistic Regression Model
The Multinomial Logistic Regression Model was used to determine the variances of the independent variables on the dependent variables. This helped to explain the level of influence that the independent variables had on the dependent variables as expressed below: PBP, ROCE, NPV, IRR, PI = βo+β1Gr+β2Ed+β3Rt+β4Iz+β5Pq+ϵ
or PBP= βo+β1Gr+β2Ed+β3Rt+β4Iz+β5Pq+ϵ
ROCE= βo+β1Gr+β2Ed+β3Rt+β4Iz+β5Pq+ϵ
NPV= βo+β1Gr+β2Ed+β3Rt+β4Iz+β5Pq+ϵ
IRR= βo+β1Gr+β2Ed+β3Rt+β4Iz+β5Pq+ϵ
PI = βo+β1Gr+β2Ed+β3Rt+β4Iz+β5Pq+ϵ
Where: βo is regression coefficients. β1Gr is the effect of owner or manager gender on the choice of investment appraisal technique. β2Ed is the effect of owner or manager educational level on the choice of investment appraisal technique. β3Rt is the effect of owner or manager risk tolerance level on the choice of investment appraisal technique. Β4Iz is the effect of investment size on the choice of investment appraisal. Β5Pq is the effect of policy requirement on the choice of appraisal investment technique. ϵ is error term. 3.7.2 Chi-square (X2) Statistical Test
The Chi-square (X2) Statistical Test as expressed below was used to test the research hypotheses. X2 = Ʃ(Οƒ- ℓƒ)2
ℓƒ
Where; X2 = chi-square Οƒ = observed frequency ℓƒ = expected frequency.
The Chi-squared (X2) Test is a statistical hypothesis test model used to determine whether there is a significant difference between the expected frequencies and the observed frequencies in one or more variables and also sets a bench mark for hypothesis acceptance or rejection. Thus the Null hypothesis (H0) will be accepted if the X2 value computed is less than the tabular value of X2, otherwise H0 will be rejected and the alternative hypothesis (HA)

Journal of Economics and Sustainable Development www.iiste.org
ISSN 2222-1700 (Paper) ISSN 2222-2855 (Online) DOI: 10.7176/JESD
Vol.10, No.14, 2019
25
been accepted. 3.8 Ethical Considerations
The consents of the respondents were asked for before data was gathered from them. The purpose, benefits and confidentiality of information of the research were explained in the first page of the questionnaire and again orally read and explained to respondents. 3.9 Limitations
Due to finance and time constraint for the research to adopt a survey method or to widen the sample size across all the ten regions of Ghana, a small sample size of 400 SMEs was involved for the data collection for analysis and interpretation. It would have been better to involve all SMEs in Ghana or sample SMEs across the ten regions of the country to form the sample frame.
It was also very difficult collecting data from the SME operators for the fear of them disclosing their business ideas or been taxed in the future. This therefore made the researcher and his assistants spent about five weeks instead of the planned two weeks to get SME operators willing to respond to the questionnaires. DISCUSSIONS
This part of the research presents the results obtained from the analysed data and a thorough discussion of the results. Although the chapter was devoted for discussions of results of the research objectives, the data gathered and analysed on the various demographics of the respondents had also been discussed to reveal relevant information or findings to readers and add to literature. The results on the demographics of respondents were presented first whiles the rest of the sections in this chapter presented results on the research objectives. 4.1 Demographics of Respondents
This section discussed the results on the demographics of respondents. The demographics of respondents mainly comprise information that does not particularly address the research objectives but which is relevant to the understanding of the results and provide relevant information for readers. The demographic details of respondents gathered in the research included the respondent’s gender, level of education, risk behaviour, SME industry type and capital or investment size or requirement of the SMEs. 4.1.1 Gender Composition of SME Operators
The result in Table 4.1.1 below shows the gender distribution of respondents who participated in the research. It could be observed that, out of the 400 SME operators who took part in the research, 178 respondents (representing 44%) were males whiles 222 operators (representing 56%) were females. This indicated that majority of SME operators in the Tamale metropolis were females. Table 4.1.1: SME Operators Gender Distribution
Gender Number Percentage (%)
Male 178 44 Female 222 56 Total 400 100
Source: Field Data (2018)
The research result on the gender distribution of SME operators agreed with the results of GSS (2015) IBES report that showed that there were more females in the SME sector in Ghana than males. This phenomenon also clearly revealed the demonstration of females’ effort of becoming economically active in generating sustainable income to support their families. Therefore, as stated in Ndanyenbah (2017), the female populate who are noted to be vulnerable in economic resource possession especially in developing economies still contribute much to wealth creation and social development and therefore if they are given the needed access to economic resources, they could contribute much to economic development. Empowering the SME sectors to improve in best operational practices and capital for investment would also go a long way to help in achieving the Millennium Development Goals (MDG) 1 and 3 of eradicating extreme poverty and hunger and promote gender equality and women empowerment. 4.1.2 Educational Level Distribution of the SME Operators
The result on the educational level of SME operators as presented in Figure 4.1.1 revealed that out of the 400 respondents who responded to the question on educational level of SME operators, 104 respondents (26%) had only primary education and of this number, 36% were males whiles 64% were females. The number of respondents who had Junior High School education was 65 (16.25%) made up of 38% males and 62% females. Again, out of 96 respondents (24%) who had Senior High School level of education, 58% were males whiles 42% were females. The results also revealed that the number of respondents that had tertiary education was 69 (17.25%) of which males were 64% and females were 36%. The results further revealed that 66 (16.5%) of the respondents had no formal education which comprised 24% males and 76% females.

Journal of Economics and Sustainable Development www.iiste.org
ISSN 2222-1700 (Paper) ISSN 2222-2855 (Online) DOI: 10.7176/JESD
Vol.10, No.14, 2019
26
With a closer look at the educational distribution, it could be deduced that as the educational level increases, the number of female operators’ decreases while males increase. This trend is quite a worrying phenomenon to investment management in the SME sector since majority of the operators were females and because the sector is becoming more complex and riskier, it would need operators with a higher educational level to successfully manage investment in this contemporary SME sector. There is therefore, the need for policies to be developed to assist or encourage the female populates to attain higher education to enable them acquire adequate skills and knowledge to properly manage investments in the sector. The contemporary SME sector is becoming more and more sophisticated and semi-formal, and therefore needs operators with adequate formal education to enable them understand and adhere to best basic practices of business operations such as proper records keepings, investments appraisal or assessment, financial management and among others. Figure 4.1: SME Operators Educational Level Distribution
Source: Field Data (2018)
The results also revealed that SME operators with primary educational background dominated the SME sector with the operators having junior high school level of education being the least. Although the analysis also disclosed a significant number of operators not having formal education, the general trend of formal educational level of the SME operators in the Metropolis gave a positive signal for proper management of investments but could have been much better if the female operators who are more in the sector had dominated also in the higher educational level. Although the research generally disclosed a good trend of formal educational level in the sector, the high number of operators with primary education and no formal education at all is a threat to the rapid growth of the sector since this level of education is not adequate enough to enable operators to successful manage investment. 4.1.3 SME Industry Distribution
The research also gathered data on the number of operators in the various SME sectors as classified by the Ghana Statistical Service (GSS). The GSS classified SMEs into three main sectors, namely; the services SME sector, agricultural SME sector and the manufacturing and processing SME sector. The results from data gathered on the size of each sector are presented in Table 4.1.2. Table 4.1.2: SME Industry Distribution
SME Industry Service Agriculture Manufacturing &
Processing
Male 105 (26%) 34 (8%) 18 (4%) Female 210 (53%) 22 (6%) 11 (3%) Total 315 (79%) 56 (14%) 29 (7%)
Source: Field Data (2018) The results depicted that the services industry dominated the SME sectors with 315 (79%) operators which
comprised 105 males and 210 females. The agriculture sector also had 56 (14%) respondents with 34 being males and 22 being females. The manufacturing or processing sector recorded the least respondents of 29 (7%) with 18 males and 11 females.
The discovery of the service SME sector dominating affirmed the GSS report on IBES that the service SME dominated in the country’s SME sector. However, the agriculture and manufacturing or processing SME sectors recorded much less patronage with the manufacturing or processing SME sector being the least patronised. It is not uncommon to find services such as hairdressing, barbering salons, mechanic shops, food services, provision shops, retailers and among others conspicuously located in most parts of Ghana and in particular in the Tamale Metropolis. The service sector dominance could be attributed to the small capital required to start business and the
37
25
56
44
16
67
40 40
25
50
0
10
20
30
40
50
60
70
Primary School Junior High and
Equivalent
Senior High and
Equivalent
Tertiary Level No Education
Fre
qu
ency
Level of Education
Male
Female

Journal of Economics and Sustainable Development www.iiste.org
ISSN 2222-1700 (Paper) ISSN 2222-2855 (Online) DOI: 10.7176/JESD
Vol.10, No.14, 2019
27
less technicality involved in operating. The dominance of the male operators in the agriculture and the manufacturing or processing SME sectors clearly confirmed what is practically on the ground. The low patronage of operators in the agriculture and the manufacturing or processing SME sectors could be as a result of the huge capital required for investment and the technicalities involved. The seasonal business operation of the agriculture sector in the north of the country could also be a contributing factor of the low patronage of investors.
This trend of investment in the SME sector therefore unveiled that the sector contributes less to industrialisation as asserted by Quartey (2015), sectors (i.e. agriculture and manufacturing or processing) which promote industrialization were found to be less patronised. In a sound economy, the primary production sector (agriculture) should be able to produce more inputs (raw materials) to feed the processing and manufacturing industry to retain wealth through export which will then improve the domestic service industry. Therefore, if the agriculture and manufacturing sectors are empowered to grow, they will be able to improve domestic component of the service sector with their produce and thereby minimising the dominance of the foreign importation. When the economy is able to attain this stage, all economic factors such as inflation, exchange rate, interest rate, balance of payment, GDP and among others would be favourably improved or stabilised. 4.1.4 SME Operators Risk Behaviour
As part of studying the demographics of respondents, the research also sought to assess the risk behaviours of the SME operators. This was aimed at providing information to stakeholders on the investor types in the SME sector to guide policies and investment products development. An investor’s risk attitude influences investment decision making and therefore knowing the risk profile of SME operators could greatly help stakeholders to avert passing bad policies and risking scarce resources. The research measured the risk behaviour of the operators by using ten different questions in the data collection instrument. The first three questions described risk-averse investor whiles the next three questions described risk-loving investor. The last four questions were used to determine risk-neutral investor. As presented in Table 4.1.3 below, those who chose more of (i)-(iii) were considered as risk-averse investors whereas those who selected more of (iv)-(vi) were risk-loving. Finally, respondents who chose more of (vii)-(x) were considered risk-neutral investors. The analysis presented in Table 4.1.3 recorded a total of 63 frequency of responses of (i)-(iii) by the respondents with a mean of 21 and a standard deviation of 29.5. The frequency of choice for (iv)-(vi) was also 264 with a mean value of 88 and standard deviation of 124.5. The last four questions (vii-x) recorded a frequency of 73 responses with a mean of 24.3 and a standard deviation of 34.4. Table 4.1.3: SME Operators Risk Behaviour
No. Risk Behaviour Freq. Cum.
Freq.
Mean Std
Dev.
(i) I only undertake business if I will not lose my money or resource 45 63
21
29.7
(ii) I normally consider the previous success of the business or similar business before I decide whether to enter into such business or not.
11
(iii) I do not take business that may fail even if it is profitable or has high returns
7
(iv) I always do business that will give me more profit or returns 142 264
88
124.5
(v) If a business ever failed but has the potential of given me more profit or returns in the future, I will do that business
100
(vi) How long it will take a business to give me more profit or returns is not important to me so far as the business is profitable.
22
(vii) Although I will do business that gives more profit, I will not do such a business if I could lose my money.
28 73
24.33
34.4
(viii Although I will not do business that could make me lose my money, if it is profitable I will do it.
25
(ix) I normally try my luck in doing business 7 (x) I am not all that afraid to lose my money in doing business 13 Total 400
Source: Field Data (2018)
The results therefore revealed that most of the operators were risk-loving since it recorded the highest mean number of 88. The result therefore affirmed the assertion of Nancy et al. (2014) that the SME sector is very risky and will only be attractive to risk-loving investors.
Since there is a parallel relation between risk and returns as explained by dividend theory, it therefore implied that investments in the SME sector has higher returns with all other factors been held constant. Stakeholders such as the financial institutions should be guided by these results in their credit portfolio development for the SME sector. For instance, since the sector is dominated by risk-loving investors, the most suitable financial assistance for investors in the sector should be medium to long term credit facilities.

Journal of Economics and Sustainable Development www.iiste.org
ISSN 2222-1700 (Paper) ISSN 2222-2855 (Online) DOI: 10.7176/JESD
Vol.10, No.14, 2019
28
4.1.5 SME Sector Capital Requirement or Size
The research also gathered data on the size of capital required or used by SME operators in the Tamale Metropolis. As presented in Table 4.1.4, 135 (representing 34%) operators invested or required capital size ranging GHS1-10,000. 50 (13%) respondents also indicated that they invested capital ranging GHS10,001-20,000. 73 (representing 18%) indicated to have invested GHS20,001-30,000. 78 operators (representing 20%) also invested capital size of GHS30,001-40,000 whiles the least capital invested or required for investment was GHS40,001-50,000 represented 38 (10%) respondents. This analysis was aimed to identify the investment size or capital required for investment in the SME sector in the Tamale Metropolis. Table 4.1.4: SME Sector Capital Requirement or Size
Capital Size (GHS) Male Female Total
Up to 10,000 80 (59%) 55 (41%) 135 (34%) 10,001 – 20,000 20 (39%) 30 (61%) 50 (13%) 20,001 – 30,000 21 (30%) 52 (70%) 73 (18%) 30,001 – 40,000 16 (21%) 62 (79%) 78 (20%) 40,001 - 50,000 12 (46%) 14 (54%) 26 (7%) >50,000 27 (73%) 11 (27%) 38 (10%)
Source: Field Data (2018)
The results on the SME sector capital size or requirement showed that most SMEs operators required a capital size or investment value of GHS10,000 (i.e. approximately $2,000 using 2018 average exchange rate) whiles GHS40,000 (i.e. $8000 using 2018 average exchange rate) been the least capital required. Determining the mean capital size requirement of the sector, it revealed that the average capital requirement for investment in the SME sector in the Tamale Metropolis was GHS25,000 (i.e. $5,000 using 2018 average exchange rate). This implied that starting an SME business in the Tamale metropolis does not require huge capital. That is at most, a capital size of GHS25,000 could be used to start an SME business in the Tamale Metropolis. However, this depends on the nature or type of the business or investment. For instance, the manufacturing and processing industry is capital intensive and would therefore require a substantial amount of capital than that of the service and agriculture sectors. These results are vital to guide financial institutions in their credit management in the SME sector. That is in their plan of credit for the SME sector, the average capital size to considered in their credit portfolios should be GHS25,000 (i.e. $5,000). 4.2 Results on Research Objectives
The research analysed data on the knowledge and application level of the IATs by SME operators in the Tamale Metropolis and the factors that influence the operators’ choice of the IATs to appraise their investments. 4.2.1 SME Operators Knowledge Level in Investment Appraisal Techniques
This section discussed the results on the first objective of the research which sought to assess the SME operators’ knowledge level in the basic IATs. The results were presented in Table 4.2.1 It can The results disclosed that, the most known IAT among the SME operators was IRR with 210 (representing 30%) responses by the operators and followed by ROCE 140 (20%), NPV 86 (12%), and PBP 59 (8%). The PI recorded the least frequency of responses by the SME operators representing 14 (2%). 188 (27%) responses also indicated of haven no knowledge at all in any of the IATs. Table 4.2.1: SME operators Knowledge in Investment Appraisal Techniques
IATs PBP ROCE NPV IRR PI No Knowledge
Male 36(61%) 22(16%) 46(53%) 61(29%) 11(79%) 110(47%) Female 23(39%) 118(84%) 40(47%) 149(71%) 3(21%) 78(53%) Total 59(8%) 140(20%) 86(12%) 210(30%) 14(2%) 188(27%)
Source: Field Data (2018)
The significant number of responses (27%) indicated to have no knowledge at all in the various IATs could have been the reason why some researches asserted that operators in the SME sector do not have adequate knowledge in investment appraisals hence the cause of the rampant failure of investments in the sector. However, if this is compared with the general knowledge level of operators in IATs as presented in Table 4.2.2, it clearly revealed that 509 (representing 73%) of the responses by the operators indicated that they had knowledge in IATs in general while 188 (representing 27%) indicated to have no knowledge in any of the basic IATs. With this it could be concluded that there is positive or appreciable knowledge level of the IATs by SME operators. Table 4.2.2: SME operators Response Frequency on their Knowledge in the basic IATs
IATS Knowledgeable in IATs Not Knowledgeable in IATs
(i.e gut feeling and No appraisal knowledge)
Total
Total responses 509(73%) 188(27%) 697(100%)
Source: Field Data (2018)
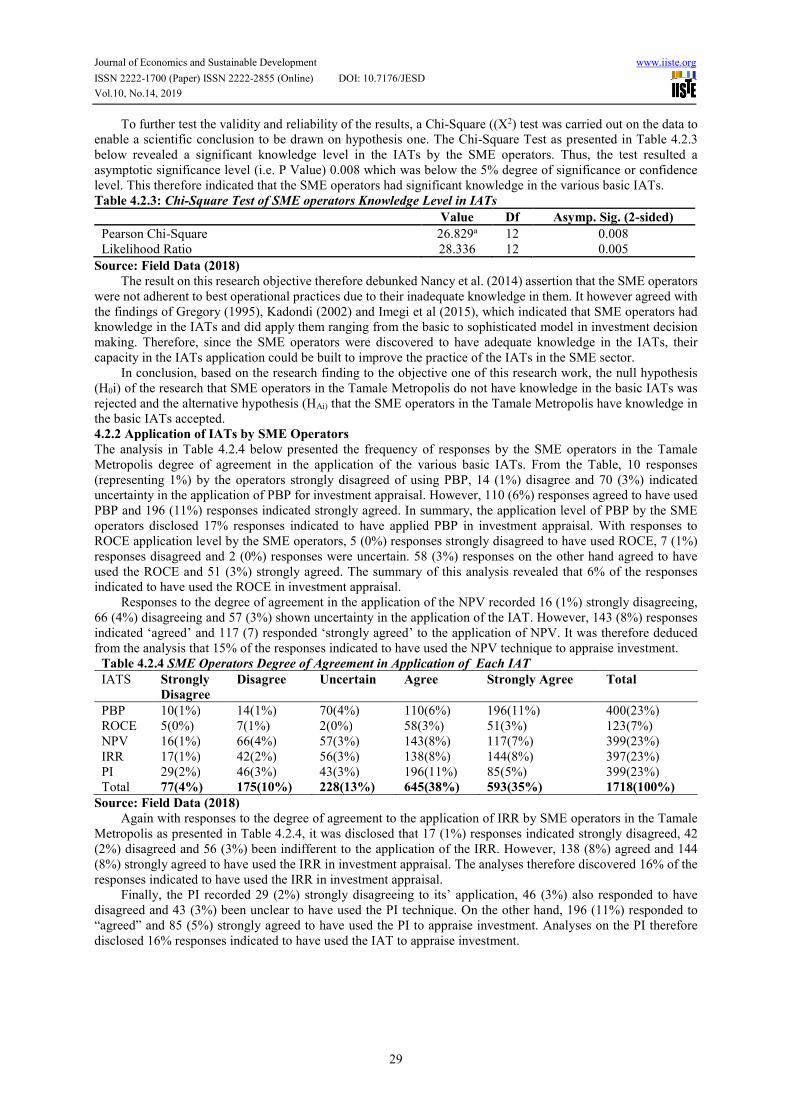
Journal of Economics and Sustainable Development www.iiste.org
ISSN 2222-1700 (Paper) ISSN 2222-2855 (Online) DOI: 10.7176/JESD
Vol.10, No.14, 2019
29
To further test the validity and reliability of the results, a Chi-Square ((X2) test was carried out on the data to enable a scientific conclusion to be drawn on hypothesis one. The Chi-Square Test as presented in Table 4.2.3 below revealed a significant knowledge level in the IATs by the SME operators. Thus, the test resulted a asymptotic significance level (i.e. P Value) 0.008 which was below the 5% degree of significance or confidence level. This therefore indicated that the SME operators had significant knowledge in the various basic IATs. Table 4.2.3: Chi-Square Test of SME operators Knowledge Level in IATs
Value Df Asymp. Sig. (2-sided)
Pearson Chi-Square 26.829a 12 0.008 Likelihood Ratio 28.336 12 0.005
Source: Field Data (2018)
The result on this research objective therefore debunked Nancy et al. (2014) assertion that the SME operators were not adherent to best operational practices due to their inadequate knowledge in them. It however agreed with the findings of Gregory (1995), Kadondi (2002) and Imegi et al (2015), which indicated that SME operators had knowledge in the IATs and did apply them ranging from the basic to sophisticated model in investment decision making. Therefore, since the SME operators were discovered to have adequate knowledge in the IATs, their capacity in the IATs application could be built to improve the practice of the IATs in the SME sector.
In conclusion, based on the research finding to the objective one of this research work, the null hypothesis (H0i) of the research that SME operators in the Tamale Metropolis do not have knowledge in the basic IATs was rejected and the alternative hypothesis (HAi) that the SME operators in the Tamale Metropolis have knowledge in the basic IATs accepted. 4.2.2 Application of IATs by SME Operators
The analysis in Table 4.2.4 below presented the frequency of responses by the SME operators in the Tamale Metropolis degree of agreement in the application of the various basic IATs. From the Table, 10 responses (representing 1%) by the operators strongly disagreed of using PBP, 14 (1%) disagree and 70 (3%) indicated uncertainty in the application of PBP for investment appraisal. However, 110 (6%) responses agreed to have used PBP and 196 (11%) responses indicated strongly agreed. In summary, the application level of PBP by the SME operators disclosed 17% responses indicated to have applied PBP in investment appraisal. With responses to ROCE application level by the SME operators, 5 (0%) responses strongly disagreed to have used ROCE, 7 (1%) responses disagreed and 2 (0%) responses were uncertain. 58 (3%) responses on the other hand agreed to have used the ROCE and 51 (3%) strongly agreed. The summary of this analysis revealed that 6% of the responses indicated to have used the ROCE in investment appraisal.
Responses to the degree of agreement in the application of the NPV recorded 16 (1%) strongly disagreeing, 66 (4%) disagreeing and 57 (3%) shown uncertainty in the application of the IAT. However, 143 (8%) responses indicated ‘agreed’ and 117 (7) responded ‘strongly agreed’ to the application of NPV. It was therefore deduced from the analysis that 15% of the responses indicated to have used the NPV technique to appraise investment.
Table 4.2.4 SME Operators Degree of Agreement in Application of Each IAT
IATS Strongly
Disagree
Disagree Uncertain Agree Strongly Agree Total
PBP 10(1%) 14(1%) 70(4%) 110(6%) 196(11%) 400(23%) ROCE 5(0%) 7(1%) 2(0%) 58(3%) 51(3%) 123(7%) NPV 16(1%) 66(4%) 57(3%) 143(8%) 117(7%) 399(23%) IRR 17(1%) 42(2%) 56(3%) 138(8%) 144(8%) 397(23%) PI 29(2%) 46(3%) 43(3%) 196(11%) 85(5%) 399(23%) Total 77(4%) 175(10%) 228(13%) 645(38%) 593(35%) 1718(100%)
Source: Field Data (2018)
Again with responses to the degree of agreement to the application of IRR by SME operators in the Tamale Metropolis as presented in Table 4.2.4, it was disclosed that 17 (1%) responses indicated strongly disagreed, 42 (2%) disagreed and 56 (3%) been indifferent to the application of the IRR. However, 138 (8%) agreed and 144 (8%) strongly agreed to have used the IRR in investment appraisal. The analyses therefore discovered 16% of the responses indicated to have used the IRR in investment appraisal.
Finally, the PI recorded 29 (2%) strongly disagreeing to its’ application, 46 (3%) also responded to have disagreed and 43 (3%) been unclear to have used the PI technique. On the other hand, 196 (11%) responded to “agreed” and 85 (5%) strongly agreed to have used the PI to appraise investment. Analyses on the PI therefore disclosed 16% responses indicated to have used the IAT to appraise investment.

Journal of Economics and Sustainable Development www.iiste.org
ISSN 2222-1700 (Paper) ISSN 2222-2855 (Online) DOI: 10.7176/JESD
Vol.10, No.14, 2019
30
Table 4.2.5: IATs Degree of Application by SMEs Operators
IATS IATs Not
Applied
IATs
Applied
Total
Total Frequency of Responses to the degree of agreement of IAT Application by SME operators
480(27%) 1238(73%) 1718(100%)
Source: Field Data (2018)
Table 4.2.5 summarised the degree of agreement in the application of the IATs presented in Table 4.2.4 into ‘IATs not applied’ and ‘IATs applied’. The summarised analyses in Table 4.2.5 aimed to give a clearer empirical results on the degree of IATs application by SME operators. That is whether they applied IATs in general or not. In the summary, ‘strongly disagree’, ‘disagree’ and ‘neutral’ were combined to represent ‘IATs not Applied’ whiles ‘agree’ and ‘strongly agreed’ summarised into ‘IATs Applied’.
With the summarised result, it was revealed that a significant number of responses representing 73% indicated to have used at least one of the IATs whereas 27% responded not to have applied any of the IATs.
A further test on the validity of the results presented in Table 4.2.5 was made with the use of the Chi-Square (X2) Test model. Results on the Chi-Square (X2) Test were presented in Table 4.2.6 below. Table 4.2.6: Chi-Square Test of each IATs Application Level by SME Operators
IATs Pearson Chi-Square Likelihood Ratio
Value Df P-Value Value Df P-Value
PBP 23.470a 8 0.003 27.346 8 0.001 ROCE 15.813a 8 0.045 10.22 8 0.25 NPV 8.866a 8 0.354 8.724 8 0.366 IRR 20.403a 8 0.009 18.736 8 0.016 PI 25.568a 8 0.001 22.824 8 0.004
Source: Field Data (2018)
With the Chi-Square (X2) test of the individual IATs in Table 4.2.6 above, it was affirmed that there was a significant level of application of the PBP with P-value of 0.003, ROCE with P-value of 0.045, IRR with P-value of 0.009 and PI with a P-value of 0.001 by the SME operators. The NPV application was however insignificant with a P-value of 0.354. The insignificant level of the NPV application by the SME operators seemed to have confirmed the assertion of Tagliavini (2001) that sophisticated IATs are not user friendly to the SME operators.
Table 4.2.7 presented the Chi-Square Tests of the IATs application in general. The test revealed that there was a strong significant level of application of the IATs in general with a P-Value of 0.000 by the SME operators in the Tamale Metropolis. Table 4.2.7: Chi-Square Tests of IATs Application by SMEs Operators
Model Likelihood Ratio Tests
Chi-Square Df P-Value
Intercept Only Application of IATs 219.100 78 .000
Source: Field Data (2018)
The research results therefore debunked the assertions of researches such as Abereijo et al (2005), Harris (2003) and among others that operators in the sector do not use the IAT to appraise investments and therefore a cause of the rampant failures of investments in the sector.
It however supported the research results of Kadondi (2002), Bell et al (2004), Munyao (2010) and Imegi et al (2015) that irrespective of the business type or size, both corporate and enterprise business operators do used the various IATs ranging from basic to sophisticate models to appraise investments.
With this research finding, the research therefore rejected the null hypothesis (H0ii) that SME operators in the Tamale Metropolis do not apply the basic IATs and accepted the alternative hypothesis (HAii) that SME operators in the Tamale Metropolis apply the basic IATs to appraise investments.
In the conceptual framework of the research constructed in the literature review, it was presumed that SME operator’s knowledge in the IATs will influence the application of the IATs by the SME operator and the decision as to which IAT to apply in investment appraisal by the SME operator was influenced by the SME operator’s gender, educational level, risk behaviour as well as the investment size, industry type and policy requirements. Table 4.2.8 therefore tested the correlation between the SME operators’ knowledge level in the IATs and the application of the IATs by the SME operators. Table 4.2.8: Correlation between Knowledge and Application of IATs by SMEs Operators
SME operators Knowledge Level in IAT
SME operators Application of IATs -0.30567
Source: Field Data (2018)
The test on the relation between the SME operators’ knowledge level in the IATs and the application of the

Journal of Economics and Sustainable Development www.iiste.org
ISSN 2222-1700 (Paper) ISSN 2222-2855 (Online) DOI: 10.7176/JESD
Vol.10, No.14, 2019
31
IATs revealed a negative correlation of 0.30567 which meant that there was a negative relationship between knowledge in IATs and the IATs application by the SME operators. Thus SME operator’s knowledge in an IAT had insignificant influence on the IAT application by the SME operator and therefore ones’ knowledge in the IATs did not necessarily meant that the IAT would be used to appraise investment. The result therefore annulled the conceptual framework stipulation that knowledge in the IATs influences the application of the IATs by the SME operator.
Therefore, if there was no correlation between the SME operators’ knowledge in the IATs and the IATs application, then what might have influenced the application of the IATs as discovered in Table 4.2.8? 4.2.3 Factors that Influence the Choice of IATs by SME Operators
Existing research works have attributed factors such as education, investment value, investment type, knowledge and simplicity of IATs, the investor’s risk constraint, investment objective and policy requirement among others to be the determinants of IATs choice (Levy et al, 2005). This section of the research however examined if gender, formal educational level and risk behaviour of investor, investment size and policy requirement have any significant influence on the choice of IATs by SME operators in the Tamale Metropolis. Table 4.2.9 below presented a chi-squared test results on the significance level of influence that these factors had on the choice of the IATs by the SME operators. Table 4.2.9: Chi-Square Test on Factors that Influence the Choice of IATs by SMEs Operators
Factors of IAT Choice (independent Variables)- X Chi-Square Significance level(P-value)
Gender 28.637 0.000 Education 50.239 0.001 Risk Tolerance 40.550 0.000 Investment Size 46.413 0.028 Policy requirement/Regulation 4.854 0.563
Source: Field Data (2018)
The results revealed that the SME operators gender with P-value of 0.00, formal educational level with P-value of 0.001 and risk behaviour with a P-value of 0.00 as well as the investment size with P-value of 0.028 had significant level of influence on the choice of the various basic IATs used by the SME operators whiles policy or regulatory requirement had a P-value of 0.563 indicated an insignificant influence on the choice of IATs by the SME operators. The insignificance level of influence of the policy or regulatory requirement on IATs choice could be attributed to the informality and weak regulatory state of the SME sector.
Therefore, with the results presented in Table 4.2.9, the research rejected the null hypothesis (H0iii) that the investors’ gender, education and risk behaviour as well as the investment size do not influence the choice of IATs by the SME operators and accepted the alternative hypothesis (HAiii) that the investors’ gender, education and risk behaviour as well as the investment size influence the choice of the IATs by the SME operators.
It however accepted the null hypothesis (H0iii) that legal or regulatory requirement does not influence the choice of the IATs by the SME operators and rejected the alternative hypothesis (HAiii) that legal or regulatory requirement influences the choice of the IATs by the SME operators in the Tamale Metropolis. SUMMARY, CONCLUSION AND RECOMMENDATION
The debate as to whether SME operators have knowledge in IATs, apply IATs in appraising their investments and the factors that influence the choice of IATs continues to receive research attention. This research work however added literature to this research problem. This chapter of the research presented a concise summary of the research, conclusions that were reasonable drawn from the findings and relevant recommendations for both policy makers and the academia. 5.1 Summary
The research was conducted to assess the application of investment appraisal techniques by SME operators in the Tamae Metropolis. Three research objectives were assessed. The first objective was to determine SME operators’ knowledge level in IATs, the second was to determine the application of IATs by the SME operators and the third objective was to determine the factors that influence the choice of IATs by the SME operators. Simple random sampling technic was used to collect data from 400 respondents with a structured questionnaire. The demographics of the research found that the female SME operators dominated the sector. The sector was also saturated with operators with primary educational level. Among the three industries categorised by the Ghana Statistical Services to have comprised the SME sector, the service SME industry was found to be dominating in patronage. Investors in the SME sector were also found to be more risk loving. Lastly, it was also disclosed that the average investment size or capital requirement for investment in the SME sector was with GHc25,000 (i.e. $5,000).
The main findings of the research objectives were that SMEs operators in the Tamale Metropolis had significant knowledge in the various basic IATs (i.e. PBP, ROCE, NPV, IRR and PI). It was also found that application of the IATs was significant among the SME operators except NPV which application was found to be

Journal of Economics and Sustainable Development www.iiste.org
ISSN 2222-1700 (Paper) ISSN 2222-2855 (Online) DOI: 10.7176/JESD
Vol.10, No.14, 2019
32
insignificant. Although the operators demonstrated evidence of applying the concepts of the IATs in their investments appraisals, they did not use the theoretical formulae of the various IATs in their calculations but do so in their own way of understanding which still reflects the concepts of the IATs. Ironically, the SME operators’ knowledge level in the IATs was found to have insignificant influence on the IATs application which contrasted this research conceptual framework. Lastly, although there are many factors that could influence the choice of IATs application as found in other research works, this research found that the investor’s gender, formal educational background, risk behaviour and the size of the investment had significant influence on the type of IAT the SME operators used to appraise investment whereas policy or regulatory requirements had insignificant influence on their choice of an IAT to appraise investment.
5.2 Conclusions
The findings of this research work to the research problem were that SME operators had significant knowledge in the IATs. The SME operators also applied the IATs to appraise their investments and the factors that influenced their choice of an IAT to appraise their investments were found to be the investor’s gender, educational background and risk behaviour as well as the investment size and industry type. Legal or regulatory requirement was found to has insignificant influence on IATs choice. The research findings therefore depicted that the SME sector operators had the necessary basic foundation to be regulated to enable them adhere to best operational practices in investment. 5.3 Recommendations
In view of the research findings, the research recommended the following for policy direction and the academia: 5.3.1 Recommendations for Policies Development and Implementation
1. The discovery that the SME operators had significant knowledge in investment appraisal and did apply them in investment appraisals implied that the SME sector operations could be regularised to improve on best practices since they have the basic knowledge best practices in business. Therefore, stakeholders, such as the Ministry of Trade and Industry and the National Board for Small Scale Industries need to develop customised policies to regulated the SMEs operations to enable them improve in best operational practices. This will enable the sector to contribute more to economic transformation as asserted by ILO (2009).
2. Stakeholders especially the financial institutions should inculcate investment appraisal trainings in their ‘business clients’ capacity building models to keep SME operators updated with modern best practices in investment and to appraise their investments to guide their investment decision making. This will enable SME operators to avoid the risk of investing in unprofitable investment assets and thereby minimising the rate of investment failures in the SME sector.
3. Financial institutions, such as banks and lending institutions should also require evidence of investment appraisal by SMEs operators before any decision to give credit or financial assistance is taken. This will help whip up the interest of SME operators to appraise their investment with the IATs or to seek for professional services. The enforcement of the application of the IATs by SME operators will minimise the sector’s investment failures thereby reducing credit defaults of the SMEs operators to the banks or financial institutions.
4. The results highlighted the relevance of the SME operators’ gender, educational background, risk tolerance as well as size of investment and industry type to be influencing factors in the choice IATs. It is therefore recommended to financial institutions and investment advisers to pay particular attention to these factors in their advisory services in the application of the IATs.
5.3.2 Recommendations for Academia and Further Studies
1. Financial engineers should be thinking of developing a customised investment appraisal models for the appraisal of investment assets in the SME sector. This will enable operators understand and appraise investment effectively.
2. A research can be carried out on this research problem in other parts of Ghana (ie the southern sector) with different investment environment characteristics to test the generalisation of this research finding.
3. Research work can also be carried out on the impact of IATs application on SME sector investment success in the Tamale Metropolis.
REFERENCES
Abor, J. and Quartey, P. (2010). Issues in SME development in Ghana and South Africa. International Research
Journal of Finance and Economics, 39, 218–28. Adeniyi, A. A., Omisakin, O. A., Egwaikhide, F. and Oyinlola, A. (2012). Foreign direct investment: Economic
growth and financial sector development in small open developing economies. Economic Analysis & Policy,

Journal of Economics and Sustainable Development www.iiste.org
ISSN 2222-1700 (Paper) ISSN 2222-2855 (Online) DOI: 10.7176/JESD
Vol.10, No.14, 2019
33
Vol. 42, No. 1. Adeniyi, A. A. (2004). An Insight into management accounting. Lagos: Value Analysis Consult. Agyei-Mensah, B. K. (2011). Financial management practices of small firms in Ghana: An Empirical Study.
African Journal of Business Management, 5(10), 3781-3793. Alkaraan, F. and Northcott, D. (2006). Strategic Capital Investment Decision–Making: A Role for Emergent
Analysis Tools? A Study of Practice in large UK Manufacturing Companies, British Accounting Review, 38 (2), 149–173.
Allen, N. B. and Gregory, F. U. (1998). The economics of small business finance: The roles of private equity and debt markets in the financial growth cycle. Journal of Banking & Finance, 22(1998) 613-673.
Aryeetey, E. (2001). Priority research issues relating to regulation and competition in Ghana: Centre on Regulation
and Competition Working Paper Series, University of Manchester, Manchester. Aryeetey, E., Baah-Nuakoh, A. T., Duggleby, H. H., and Steel, W.F (1994). Supply and demand for finance of
small scale enterprises in Ghana. Discussion Paper No. 251, World Bank, Washington, DC. Aryeetey, E. (1998). Informal finance for private sector development in Africa. Economic Research Papers No.
41. Avinash K. D., Robert K. D., Robert S. P., and Robert P. (1994). Investment under uncertainty. New Jersey:
Princeton University Press. Ayyagari, M., Beck, T. and Demirgüç-Kunt, A. (2003). Small and medium enterprises across the globe: A New
Database. Vol. 3127. Ayyagari, M., Demirgüç-Kunt, A. and Maksimovic, V. (2011). Small vs. young firms across the world:
Contribution to employment, job creation and growth. Policy Research Working Paper 5631. The World Bank Development Research Group.
Bank Negara Malaysia. (2003). A comprehensive framework for the development of small and medium enterprises in Malaysia.
Bolton, J. E. (1971). “Report of the committee of inquiry on small firms”, HMSO, London. Burton G. M. (2003). The efficient market hypothesis and its critics. Journal of Economic Perspectives, Volume
17, No1, 59 – 82. Carsamer, E. (2012). Promoting entrepreneurial development among SMEs through financial management in
Ghana. International Journal of Economic Perspectives; Vol. 6, 188-197. Constantinides, G., Harris, M. and Stulz, R. (Eds). 2003. Hand-book of the economics of finance. Amsterdam:
North-Holland. Christian, S. (2017). The challenges of industry 4.0 for small and medium-sized enterprises. Friedrich Ebert
Stiftung. Denzil, W. and Antony, H. (2007). Corporate finance principles and practice. Essex CM20 2JE, England: Pearson
Education Ltd. Dixon, R. Bhandari, R.K. (1997). Derivatives, risk and regulation: chaos or confidence? International Journal of
Bank Marketing, Vol. 15 Issue: 3, 91-98. Economist Intelligence Unit (2010). SMEs in Japan: A new growth driver? A Report from Economist Intelligence
Unit.
Fatima, H., Glenn, Col. and Andrew, H. (2012). A guide to financial management for SMEs. Department for
Business Innovation and Skills (BIS). ICAEW, ACCA and Ernst and Young. Fuseini I., Yaro J., Yiran G. (2017). City profile: Tamale, Ghana Cities. 60. 64-74. 10.1016/j.cities.2016.07.010. Gelb, A.; Mengistae, T.; Ramachandran, V., and Shah, M. K. (2008), To Formalize or Not to Formalize?
Comparisons of Microenterprise Data from Southern and East Africa, Center for Global Development Working Paper No. 175.
Ghana Statistical Services (2015). Integrated business establishment survey (IBES): National Employment Report. Accra.
Ghatak, S. (2010). Micro, small and medium enterprises (MSMEs) in India: An appraisal. Journal of technology
management and innovation 6.1: 66-76. Gilbert, E. (2005). Capital budgeting: A case study analysis of the role of formal evaluation techniques in the
decision making process. University of Cape Town, 19, 19-36. Guerrero, R. (2007). The case for real options made simple. The Journal of Applied Corporate Finance, Spring
2007. Haim, L. & Thiery, P. (2005). Investments. Essex CM20 2JE, England: Pear Education Ltd, Edinburg Gate,
Harlow. Haka, G., Gordon, M. & Pinches, D. (1985). The accounting review. 60, 651-669. Harris, L. (2003). Trading and exchanges: market microstructure for practitioners. Oxford: Oxford University
Press. Henshaw, E. M. and Smith, A. C. (2000). Financial management. Cincinati, Ohio: South Western Publishing

Journal of Economics and Sustainable Development www.iiste.org
ISSN 2222-1700 (Paper) ISSN 2222-2855 (Online) DOI: 10.7176/JESD
Vol.10, No.14, 2019
34
Company. Hoesli, M., and Macgregor, B. (2000). Property Investment. London: Routledge. Imegi, John, C., Nwokoye, G. A. (2015). The effectiveness of capital budgeting techniques in evaluating projects’
profitability. African Research Review. Vol. 9(2), No. 37, 1994-9057. International Federation of Accountant (2012). Project and investment appraisal for sustainable value creation.
Exposure Drafts, Consultation Paper. International Labour Organization and World Trade Organization (2009). Globalization and informal jobs in
developing countries. International Institute for Labour Studies (ILO) & Economic Research and Statistics Division (WTO), Geneva. WTO ISBN: 978-92-870-3691-9 ILO ISBN: 978-92-2-122719-9.
Irène, K. (2016). The strategies of supply chain risk management: A synthesis and classification. International
Journal of Logistics Research and Applications, 19, 6, (604). Isaac, O. A. and Abimbola, O. F. (2005). Innovative approach to SME financing in Nigeria: A Review of Small
and Medium Industries Equity Investment Scheme (SMIEIS). J. Soc. Sci., 11(3):219-227. Jim, B., Dave, C., and Stephen, Y. (2004). Small firm internationalization and business strategy: An exploratory
study of ‘Knowledge-Intensive’ and ‘Traditional’ Manufacturing firms in the UK. Kadondi, E.A (2002). A survey of capital budgeting techniques used by companies listed at the NSE, Unpublished
MBA project, University of Nairobi. Kayanula, D. and Quartey, P. (2000). “The policy environment for promoting small and medium-sized enterprises
in Ghana and Malawi”. Finance and Development Research Programme, Working Paper Series, Paper No 15, IDPM, University of Manchester.
Khakasa, E. (2009). Evaluating information technology investments: A survey of Kenyan commercial banks, Unpublished MBA project, Strathmore University, Kenya.
Klammer, T. (1973). The Association of capital budgeting techniques with firm Performance. The Accounting
Review, 48, 2, 353-364. Lamido, L.M. (2002). Cash flow projections in investment analysis. International Journal of Business
Administration; 27(3): 271-183. Laura, H., and Jone, L. P. (2015). Managing the unknowable: The effectiveness of early stage investor gut feel in
entrepreneurial investment decisions. Administrative Science Quarterly, 60(4). ISSN0001-8392. Mamo, A. (2014). The use and usefulness of investment appraisal techniques in non-financial services: Maltese
listed companies. University of Malta, Msida MSD 2080, Malta. Modigliani, F. and Miller, M. (1958). The cost of capital, corporation finance and the theory of investment. The
American Economic Review, Vol.48, 261–297. Mohd, A. A., Harizal, O., and Hoe, C. H. (2010). Financial management practices: An in-depth study among the
CEOs of small and medium enterprises (SMEs). International Review of Business Research Papers, 6(6), 13-35.
Mooi, S. and Mustapha, M. (2001). Firm performance and degree of sophistication of capital budgeting practice: Some Malaysian evidence, Proceedings of the Asia Pacific Management Conference, 279-290.
Moore J., and Reichert, A. (1989). A multivariate study of firm performance and the use of modern analytical tools and financial techniques, Interfaces, 19, 3.
Munyao, A. (2010). The relationship between capital budgeting techniques and financial performance of companies listed at the NSE. MBA Project, University of Nairobi.
Nadia Saghi-Zedek (2016). Product diversification and bank performance: does ownership structure matter? Journal of Banking and Finance, Elsevier, Vl. 71, 154-167.
Nancy B. et al (2014). Informal economy and the World Bank. Policy Research Working Paper 6888. Ndanyenbah, T. Y (2017). Evolution, collapse and financial sustainability of MFIs and their beneficiaries. Journal
of Economics and Sustainable Development, IISTE, Vl. 8, No. 13, 123-133. Norton, R. and Jesse, D. (2016). Investment: A history. Ministry of Defence Investment Appraisal and Evaluation.
JSP 507 Pt. 2, V6.0. Nyamekye, M., Kaboré, N., et al (2009). “Organizing informal sector workers in West Africa: focus on women
workers, trade union strategies: case studies from Ghana, Sierra Leone, Senegal and Burkina Faso” Accra, Ghana Trades Union Congress.
OECD (2017). Enhancing the contributions of SMEs in a global and digitalised economy: Meeting of the OECD council at Ministerial Level. Paris, 7-8 June 2017.
OECD (2009a), Top barriers and drivers to SME internationalisation, Report by the OECD working paper on SMEs and entrepreneurship.
Olawale, F. (2017). An investigation into the financial management practices of new microenterprises in South Africa. Journal of Social Sciences, Volume 33, 179-188.
Olawale, O., Olumuyiwa, F. and George, H. (2010). An investigation into the impact of investment appraisal techniques on the profitability of manufacturing firms in the Nelson Mandela Bay Metropolitan Area, South

Journal of Economics and Sustainable Development www.iiste.org
ISSN 2222-1700 (Paper) ISSN 2222-2855 (Online) DOI: 10.7176/JESD
Vol.10, No.14, 2019
35
Africa, African Journal of Business Management, 4(7), 1274-1280. Owusu, A., Oppong, A., Agyeiwaa, D., and Abruquah, L. (2015). Reducing loan default rate among microfinance
institutions (MFIs) in Ghana through innovative product design, delivery and efficient loan management. International Journal of Economics, Commerce and Management, Vol. III, Issue 3.
Pablo, T. (2012). The number that killed US: A story of modern banking, flawed mathematics and a big financial crisis.
Pandey, I. M. (2010). Financial management. New Delhi: Vikas Publishing House PVT Ltd. Paul, C. and Alan, G. (1995). Investment appraisal in service industries: a field study analysis of the U.K. hotels
sector. Research Volume. P. 33-57. Paul, G. (2013). Monte Carlo Methods in financial engineering. New York, Columbia University. Peterson, P.P. and Fabozzi, F.J. (2002), Capital budgeting: Theory and practice. New York, Wiley & Sons. Pham, N. L. (2013). Effective working capital management in small and medium enterprises in Vietnam. Dublin
Business School. MBA Finance Thesis. Quartey, P. (2015). Issues in SME development in Ghana and South Africa. International Research Journal of
Finance and Economics. 39. 218-228. Rene, M. S. (2004). Should we fear derivatives? Journal of Economic Perspectives. Volume 18, No. 3, 173–192. Renee T. B., Ying, C., et al. (2016). Efficiency of flexible budgetary institutions. Working Paper 22457. Richard, G.P. M. (2001). Growth and performance of manufacturing SMEs: The influence of financial
management characteristics. International Small Business Journal, 19(3), 10–28. Richard, G.P. M. (1998). Stage models of SME growth reconsidered, Small Enterprise Research, 6:2, 20-35. Robert, P. M. (2004). Warren Buffett wealth: principles and practical methods used by the world's greatest investor.
John Wiley and Sons. p. 26. ISBN 978-0-471-46511-9. Rose, J.K. and Romanus, L. D. (2016). The relationship between financial goals of SMES and investment decisions.
Journal of Business Studies. Vol. 7, No. 4 ISSN 2152-1034. Sadler-Smith, E. and Erella, S. (2004). The intuitive executive: Understanding and applying ‘gut feel’ in decision
making. Academy of Management Executive, Vol. 18, No.4. Sangster, A. (1993). Capital investment appraisal techniques: A survey of current usage. Journal of Business
Finance Account., 20(3): 307-331. SME Corporation Malaysia (2013). Media release: New definition for SMEs to facilitate transition to a high
income economy. SME Corporation Malaysia (2011). Financial guide for SMEs. Kuala Lumpur: SME Corporation Malaysia. Steel, W. and Snodgrass, D. (2008). Raising Productivity and Reducing Risks of Household Enterprises”:
Diagnostic Methodology Framework, World Bank. Tagliavini, M., Ravarini, A. and Antonelli, A. (2001). An evaluation model for electronic commerce activities
within SMEs. Information Technology and Management 2: 211. Titman, S., John W. C., and Xie, F. K. (2010). Access to equity markets, corporate investments and stock returns:
international evidence. SSRN Electronic Journal. 10.2139/ssrn.1571648. Watson, D. and Head, A. (2007), Corporate Finance– Principles and Practices, 4th ed., FT Prentice Hall, UK. Wesley, P., and Marcelo, M. (2009). Behavioral economics and the economics of Keynes. The Journal of Socio-
Economics 38, 891–900. Welkazi, T. O. and Shapiro, B. C. (2000). The discounted cash flow techniques in project analysis. Journal of
Accounting and Finance; 21 (2): 263-297. Yanzaki, C. J. (2002). The time value of money and investment appraisal. Psychological Review, 33 (1): 69-76. Yao, L., Smid, P. & Hermes, N. (2006). Capital budgeting practices: A comparative study of the Netherlands and
China, Unpublished Master Business, University of Groningen.
APPENDIX 1– DATA ANALYSIS SUMMARIES
Hypothesis 1
Chi-square test
Case Processing Summary
Cases
Valid Missing Total
N Percent N Percent N Percent
SMEs Operators * Knowledge of IATS
400 100.0% 0 .0% 400 100.0%

Journal of Economics and Sustainable Development www.iiste.org
ISSN 2222-1700 (Paper) ISSN 2222-2855 (Online) DOI: 10.7176/JESD
Vol.10, No.14, 2019
36
SMEs Operators * Knowledge of IATS Cross-tabulation
Count
Knowledge of IATS
Total
PBP ROCE NPV IRR PI Gut feeling NO
Knowledge
Business type
Service 35 57 19 102 6 58 38 315
Agric 7 8 6 6 2 23 4 56
Industry 5 1 2 9 1 7 4 29
Total 47 66 27 117 9 88 46 400
Chi-Square Tests
Value Df
Asymp. Sig. (2-sided)
Pearson Chi-Square 26.829a 12 .008
Likelihood Ratio 28.336 12 .005
Linear-by-Linear Association 1.344 1 .246
N of Valid Cases 400
7 cells (33.3%) have expected count less than 5. The minimum expected count is .65.
Hypothesis 2
Chi-square tests
Chi-square; SME/PBP
SMEs Operators Application of PBP Crosstabulation
Count
PBP
Total Strongly
Disagree Disagree Uncertain Agree Strongly Agree
Business type Service 10 10 66 77 152 315
Agric 0 2 3 18 33 56
Industry 0 2 1 15 11 29
Total 10 14 70 110 196 400
Chi-Square Tests
Value df
Asymp. Sig. (2-sided)
Pearson Chi-Square 23.470a 8 .003
Likelihood Ratio 27.346 8 .001
Linear-by-Linear Association
2.476 1 .116
N of Valid Cases 400
a. 4 cells (26.7%) have expected count less than 5. The minimum expected count is .73.

Journal of Economics and Sustainable Development www.iiste.org
ISSN 2222-1700 (Paper) ISSN 2222-2855 (Online) DOI: 10.7176/JESD
Vol.10, No.14, 2019
37
Chi-square; SME/ROCE
SMEs Operators Application of ROCE Cross-tabulation
Count
ROCE
Total Strongly
Disagree Disagree Uncertain Agree Strongly Agree
Business type Service 5 4 2 56 46 113
Agric 0 1 0 1 3 5
Industry 0 2 0 1 2 5
Total 5 7 2 58 51 123
Chi-Square Tests
Value df
Asymp. Sig. (2-sided)
Pearson Chi-Square 15.813a 8 .045
Likelihood Ratio 10.220 8 .250
Linear-by-Linear Association
1.269 1 .260
N of Valid Cases 123
a. 12 cells (80.0%) have expected count less than 5. The minimum expected count is .08.
Chi-square; SME/NPV
SMEs Operators Application of NPV Crosstabulation
Count
NPV
Total Strongly
Disagree Disagree Uncertain Agree Strongly Agree
Business type Service 12 45 49 114 94 314
Agric 2 15 4 21 14 56
Industry 2 6 4 8 9 29
Total 16 66 57 143 117 399
Chi-Square Tests
Value df
Asymp. Sig. (2-sided)
Pearson Chi-Square 8.866a 8 .354
Likelihood Ratio 8.724 8 .366
Linear-by-Linear Association
1.641 1 .200
N of Valid Cases 399
a. 4 cells (26.7%) have expected count less than 5. The minimum expected count is 1.16.

Journal of Economics and Sustainable Development www.iiste.org
ISSN 2222-1700 (Paper) ISSN 2222-2855 (Online) DOI: 10.7176/JESD
Vol.10, No.14, 2019
38
Chi-square; SME/IRR
SMEs Operators Application of IRR Crosstabulation
Count
IRR
Total Strongly
Disagree Disagree Uncertain Agree Strongly Agree
Business type Service 10 28 47 107 120 312
Agric 6 11 8 15 16 56
Industry 1 3 1 16 8 29
Total 17 42 56 138 144 397
Chi-Square Tests
Value df
Asymp. Sig. (2-sided)
Pearson Chi-Square 20.403a 8 .009
Likelihood Ratio 18.736 8 .016
Linear-by-Linear Association
2.794 1 .095
N of Valid Cases 397
a. 4 cells (26.7%) have expected count less than 5. The minimum expected count is 1.24.
Chi-square; SME/PI
SMEs Operators Application of PI Crosstabulation
Count
PI
Total Strongly
Disagree Disagree Uncertain Agree Strongly Agree
Business type Service 18 40 32 167 57 314
Agric 9 4 9 19 15 56
Industry 2 2 2 10 13 29
Total 29 46 43 196 85 399
Chi-Square Tests
Value df
Asymp. Sig. (2-sided)
Pearson Chi-Square 25.568a 8 .001
Likelihood Ratio 22.824 8 .004
Linear-by-Linear Association
.800 1 .371
N of Valid Cases 399
a. 4 cells (26.7%) have expected count less than 5. The minimum expected count is 2.11.

Journal of Economics and Sustainable Development www.iiste.org
ISSN 2222-1700 (Paper) ISSN 2222-2855 (Online) DOI: 10.7176/JESD
Vol.10, No.14, 2019
39
Hypothesis 3
Nominal Regression
Case Processing Summary
N Marginal Percentage
Knowledge of IATS PBP 47 11.8%
ROCE 66 16.6%
NPV 27 6.8%
IRR 116 29.1%
PI 9 2.3%
Gut feeling 87 21.9%
NO 46 11.6%
Gender of respondent Male 177 44.5%
Female 221 55.5%
Educational level of respondents
Primary 102 25.6%
JHS 65 16.3%
SHS 96 24.1%
Tertiary 69 17.3%
No education 66 16.6%
Investor risk behaviour Risk averse 63 15.8%
Risk loving 211 53.0%
Risk Neutral 124 31.2%
Investment size 10,000 133 33.4%
10,000-20,000 50 12.6%
20,001-30,000 73 18.3%
30,001-40,000 78 19.6%
40,001-50,000 26 6.5%
above 50,000 38 9.5%
Regulation Yes 184 46.2%
No 214 53.8%
Valid 398 100.0%
Missing 2
Total 400
Subpopulation 144a
a. The dependent variable has only one value observed in 72 (50.0%) subpopulations.
Model Fitting Information
Model
Model Fitting Criteria Likelihood Ratio Tests
-2 Log Likelihood Chi-Square df Sig.
Intercept Only 1.029E3
Final 809.826 219.100 78 .000
Pseudo R-Square
Cox and Snell .423
Nagelkerke .436
McFadden .156

Journal of Economics and Sustainable Development www.iiste.org
ISSN 2222-1700 (Paper) ISSN 2222-2855 (Online) DOI: 10.7176/JESD
Vol.10, No.14, 2019
40
Likelihood Ratio Tests
Effect
Model Fitting Criteria Likelihood Ratio Tests
-2 Log Likelihood of Reduced Model Chi-Square df Sig.
Intercept 8.098E2a .000 0 .
Gender 838.462 28.637 6 .000
Education 860.065 50.239 24 .001
Risk 850.376 40.550 12 .000
Investment 856.239 46.413 30 .028
Regulation 814.679 4.854 6 .563
The chi-square statistic is the difference in -2 log-likelihoods between the final model and a reduced model. The reduced model is formed by omitting an effect from the final model. The null hypothesis is that all parameters of that effect are 0.
a. This reduced model is equivalent to the final model because omitting the effect does not increase the degrees of freedom.

Journal of Economics and Sustainable Development www.iiste.org
ISSN 2222-1700 (Paper) ISSN 2222-2855 (Online) DOI: 10.7176/JESD
Vol.10, No.14, 2019
41
Parameter Estimates
Knowledge of IATSa B Std. Error Wald df Sig. Exp(B)
95% Confidence Interval for Exp(B)
Lower Bound
Upper Bound
ROCE Intercept .008 1.420 .000 1 .996
[Gender=0] -1.514 .529 8.185 1 .004 .220 .078 .621
[Gender=1] 0b . . 0 . . . .
[Education=0] -1.626 .846 3.696 1 .055 .197 .037 1.032
[Education=1] -1.699 .950 3.202 1 .074 .183 .028 1.176
[Education=2] -1.644 .947 3.018 1 .082 .193 .030 1.235
[Education=3] -2.760 1.031 7.164 1 .007 .063 .008 .478
[Education=4] 0b . . 0 . . . .
[Risk=0] -.421 .850 .245 1 .620 .656 .124 3.475
[Risk=1] .485 .518 .875 1 .350 1.624 .588 4.484
[Risk=2] 0b . . 0 . . . .
[Investment=0] 1.985 1.167 2.892 1 .089 7.276 .739 71.652
[Investment=1] 2.421 1.214 3.973 1 .046 11.253 1.041 121.624
[Investment=2] 2.957 1.214 5.937 1 .015 19.243 1.783 207.619
[Investment=3] 1.649 1.201 1.886 1 .170 5.203 .494 54.780
[Investment=4] 3.058 1.392 4.827 1 .028 21.286 1.391 325.780
[Investment=5] 0b . . 0 . . . .
[Regulation=0] -.089 .519 .029 1 .864 .915 .331 2.532
[Regulation=1] 0b . . 0 . . . .
NPV Intercept -20.949 1.454 207.481 1 .000
[Gender=0] .114 .546 .044 1 .835 1.121 .384 3.269
[Gender=1] 0b . . 0 . . . .
[Education=0] -1.632 1.056 2.390 1 .122 .195 .025 1.548
[Education=1] -20.959 6430.971 .000 1 .997 7.901E-10 .000 .c
[Education=2] -1.133 1.094 1.072 1 .300 .322 .038 2.750
[Education=3] -1.878 1.145 2.692 1 .101 .153 .016 1.441
[Education=4] 0b . . 0 . . . .
[Risk=0] 1.290 .769 2.811 1 .094 3.632 .804 16.399
[Risk=1] .983 .634 2.405 1 .121 2.673 .772 9.260
[Risk=2] 0b . . 0 . . . .
[Investment=0] 21.293 1.054 408.468 1 .000 1.768E9 2.243E8 1.394E10
[Investment=1] 20.884 1.180 313.158 1 .000 1.174E9 1.162E8 1.187E10
[Investment=2] 20.557 1.206 290.721 1 .000 8.467E8 7.971E7 8.995E9
[Investment=3] 20.346 1.150 313.119 1 .000 6.860E8 7.205E7 6.533E9
[Investment=4] 21.473 .000 . 1 . 2.116E9 2.116E9 2.116E9
[Investment=5] 0b . . 0 . . . .
[Regulation=0] .945 .606 2.427 1 .119 2.572 .784 8.444
[Regulation=1] 0b . . 0 . . . .

Journal of Economics and Sustainable Development www.iiste.org
ISSN 2222-1700 (Paper) ISSN 2222-2855 (Online) DOI: 10.7176/JESD
Vol.10, No.14, 2019
42
IRR Intercept 1.171 .993 1.391 1 .238
[Gender=0] -.429 .402 1.136 1 .287 .651 .296 1.433
[Gender=1] 0b . . 0 . . . .
[Education=0] -2.134 .811 6.925 1 .009 .118 .024 .580
[Education=1] -2.097 .892 5.525 1 .019 .123 .021 .706
[Education=2] -2.152 .858 6.289 1 .012 .116 .022 .625
[Education=3] -2.540 .885 8.240 1 .004 .079 .014 .447
[Education=4] 0b . . 0 . . . .
[Risk=0] .467 .606 .595 1 .441 1.596 .486 5.235
[Risk=1] .685 .445 2.368 1 .124 1.983 .829 4.744
[Risk=2] 0b . . 0 . . . .
[Investment=0] 1.581 .618 6.555 1 .010 4.861 1.449 16.308
[Investment=1] 1.212 .723 2.813 1 .094 3.360 .815 13.853
[Investment=2] 1.675 .726 5.322 1 .021 5.339 1.287 22.153
[Investment=3] 1.154 .688 2.813 1 .093 3.170 .823 12.202
[Investment=4] 1.515 .984 2.368 1 .124 4.548 .661 31.301
[Investment=5] 0b . . 0 . . . .
[Regulation=0] .326 .429 .577 1 .448 1.385 .598 3.209
[Regulation=1] 0b . . 0 . . . .
PI Intercept -21.142 9234.135 .000 1 .998
[Gender=0] 1.180 .950 1.542 1 .214 3.254 .505 20.954
[Gender=1] 0b . . 0 . . . .
[Education=0] -20.402 8362.585 .000 1 .998 1.379E-9 .000 .c
[Education=1] -20.193 9452.131 .000 1 .998 1.700E-9 .000 .c
[Education=2] -.990 1.497 .437 1 .509 .372 .020 6.987
[Education=3] -.525 1.508 .121 1 .728 .592 .031 11.372
[Education=4] 0b . . 0 . . . .
[Risk=0] -18.181 7529.964 .000 1 .998 1.271E-8 .000 .c
[Risk=1] .246 .818 .091 1 .763 1.279 .257 6.353
[Risk=2] 0b . . 0 . . . .
[Investment=0] 21.108 9234.135 .000 1 .998 1.469E9 .000 .c
[Investment=1] 20.351 9234.135 .000 1 .998 6.888E8 .000 .c
[Investment=2] 20.169 9234.135 .000 1 .998 5.746E8 .000 .c
[Investment=3] 20.160 9234.135 .000 1 .998 5.691E8 .000 .c
[Investment=4] 1.860 .000 . 1 . 6.426 6.426 6.426
[Investment=5] 0b . . 0 . . . .
[Regulation=0] -.300 .819 .134 1 .714 .741 .149 3.688
[Regulation=1] 0b . . 0 . . . .
Gut feeling
Intercept .542 1.014 .286 1 .593
[Gender=0] .694 .414 2.804 1 .094 2.001 .888 4.509
[Gender=1] 0b . . 0 . . . .
[Education=0] -1.789 .887 4.070 1 .044 .167 .029 .950
[Education=1] -1.018 .939 1.174 1 .279 .361 .057 2.278
[Education=2] -1.380 .899 2.354 1 .125 .252 .043 1.467

Journal of Economics and Sustainable Development www.iiste.org
ISSN 2222-1700 (Paper) ISSN 2222-2855 (Online) DOI: 10.7176/JESD
Vol.10, No.14, 2019
43
[Education=3] -1.304 .911 2.052 1 .152 .271 .046 1.616
[Education=4] 0b . . 0 . . . .
[Risk=0] .430 .572 .565 1 .452 1.537 .501 4.721
[Risk=1] -.211 .449 .222 1 .638 .809 .336 1.950
[Risk=2] 0b . . 0 . . . .
[Investment=0] 1.488 .577 6.643 1 .010 4.427 1.428 13.723
[Investment=1] .645 .719 .804 1 .370 1.906 .465 7.804
[Investment=2] .741 .767 .935 1 .333 2.099 .467 9.428
[Investment=3] .631 .699 .816 1 .366 1.880 .478 7.400
[Investment=4] 1.683 .944 3.178 1 .075 5.382 .846 34.239
[Investment=5] 0b . . 0 . . . .
[Regulation=0] .089 .430 .043 1 .836 1.093 .470 2.539
[Regulation=1] 0b . . 0 . . . .
NO Intercept .886 1.157 .586 1 .444
[Gender=0] .050 .465 .012 1 .914 1.051 .423 2.615
[Gender=1] 0b . . 0 . . . .
[Education=0] -1.504 1.048 2.060 1 .151 .222 .029 1.733
[Education=1] -.322 1.080 .089 1 .765 .725 .087 6.016
[Education=2] -.931 1.043 .796 1 .372 .394 .051 3.046
[Education=3] -.754 1.052 .514 1 .474 .470 .060 3.701
[Education=4] 0b . . 0 . . . .
[Risk=0] .365 .607 .361 1 .548 1.440 .438 4.734
[Risk=1] -1.569 .561 7.823 1 .005 .208 .069 .625
[Risk=2] 0b . . 0 . . . .
[Investment=0] .680 .637 1.141 1 .285 1.975 .567 6.879
[Investment=1] -.455 .891 .261 1 .610 .635 .111 3.636
[Investment=2] 1.105 .826 1.790 1 .181 3.019 .598 15.239
[Investment=3] .177 .801 .049 1 .825 1.194 .248 5.741
[Investment=4] .421 1.165 .131 1 .717 1.524 .155 14.939
[Investment=5] 0b . . 0 . . . .
[Regulation=0] -.093 .484 .037 1 .848 .912 .353 2.354
[Regulation=1] 0b . . 0 . . . .
a. The reference category is: PBP.
b. This parameter is set to zero because it is redundant.
c. Floating point overflow occurred while computing this statistic. Its value is therefore set to system missing.
Correlation between Knowledge and Application of IATs by SMEs Operators
IATs Knowldeg Level
IATs Application -0.30567