application of high-resolution acoustic · pdf fileapplication of high-resolution acoustic...
TRANSCRIPT
APPLICATION OF HIGH-RESOLUTION ACOUSTIC IMAGING FOR ADHESIVE BOND EVALUATION E. Yu. Maeva, I. A. Severina, F. M. Severin, and R. Gr. Maev
Industrial Research Chair In Applied Solid State Physics and Material Characterization, University of Windsor, Canada Abstract: The quality of adhesive bond joints is characterized using acoustic methods and discussed in this paper. Acoustical images of basic types of defects in models and real industrial samples are represented. The material variety includes metal (steel, aluminium alloys, magnesium) bonded with epoxy-based structural adhesive. Three-dimensional data were obtained using an acoustic scanning microscope in the frequency range of 10-250 MHz. Additional digital signal processing was applied to reduce interfering reflections inside the jointed structure. Classification of defects is given according to their detectability. The advantages and main limitations of the acoustical imaging method are discussed. The acoustical data are proved by comparing them with destructive testing results. The discussed results assigned for quantitative estimation of quality of the adhesive joint to create requirements for development of specialized ultrasonic equipment. Introduction: Adhesive bonding has been used for many years for construction of aircraft and in the automotive industry. The utilization of adhesive bond joints in automotive and aerospace assemblies is increasing as the selection of materials used to build these assemblies broadens. The use of adhesive bonding in combination with traditional joints (spot welds and rivets) gives significant cost-effective advantages, especially in automotive production. Some of the advantages of using adhesives include the following: uniform distribution of bond stress, ability to join dissimilar substrates and fill gaps, high bond strength, and higher fatigue resistance than mechanically fastened structures, corrosion protection, and invisible bonding. The necessity for quality assessment of the joints, preferably non-destructive techniques, increases with development of adhesive bonding technology [1]. Due to industry’s increasing use of adhesive technology as an alternative to mechanical fastening, non-destructive characterization of the adhesive joints has received attention in the past decades. NDE of the interfacial region of the adhesive joint has significant practical importance as by indirection indicates adhesion strength and can reveal appearance of the defects on the interface during the production process and after environmental influence. A number of methods are used for evaluation of the microstructure of the adhesive joints as well: visual inspection; light microscopy, electron transmission and scanning microscopy; X-rays, and IR-radiometry, based on the recording variations in heat absorption or emission. The method of pulse-echo scanning acoustical microscopy is still the most reliable for non-destructive examination of the quality of adhesive joints. Using of frequencies of 3.5 – 100 MHz gives a resolution of up to 20 µm with the affordable depth of sound penetration in most of materials. Visualization of the results in the form of B- and C-scans provides direct information about the nature, structure and spatial distribution of the defects. The problem discussed in this paper regards the ultrasonic evaluation of the adhesive defects in the thin metal sheets joined using a layer of epoxy-based adhesive. Results and Discussion: Specimens for the experiments consist of two steel sheets with a thickness of 0.8-2 mm, joined by a 0.3 mm layer of the industrial structural epoxy adhesive. Images have been obtained on the Sonix HS-1000 and Tessonics AM-1103 acoustical microscopes. Both microscopes are able to produce three dimensional data with the capability for following data processing (Fig.1.).

Fig. 1. Three-dimensional acoustical data. Conventional ultrasound instruments employing the reflection of pulsed acoustic wave gives an A-scan in the form of damping series of the oscillations (Fig. 2). The pulse travels through the material which is under investigation and then the amplitude and position of the pulse are analyzed. The first and second pulses (signals 1 and 2) represent reflections from upper and lower surfaces of the metal sheet. The operational frequency should be high enough for the separation of these signals, and we found that the optimal frequency range for metal sheets with thickness of 0.8 – 2.0 mm is 10 – 50 MHz. Mapping of the second pulse’s amplitude (C-scan) gives us an image of the interface conditions, voids and disbonding areas. This imaging method is the most sensitive to the changes in acoustic parameters of the adhesive layer.
Fig. 2. The A-scan obtained on metal-epoxy-metal adhesive bonding for good quality adhesive (a) and aged adhesive (b). Focal point tuned to first interface. Pulses 1, 2 and 3 are reflected from corresponding interfaces; reflection from interface 4 is practically undetectable Evaluation of the adhesive bond joints using acoustic imaging method provides information about microstructure of the specimen with respect to defect’s size, location and classification. Significant variations in the adhesive’s parameters (curing state, density) can also be detected but more efficiently in the transmission mode. Quality of the bulk adhesive can also be evaluated by appearance of the small signals between reflections from 1st and 2nd interfaces which indicates appearance of microvoids or cracks. There is no strong correlation between adhesion strength and the presence of some defects both on interface and in bulk adhesive. Presence of the defects is more likely indicate insufficient joint manufacturing than the possible joint failure [2]. However, many structural joint defects have a negative influence on the integrity of the joint and decrease the strength of the assembly. The following factors may also have an influence on the adhesion strength: adhesive thickness, joint type and geometry, composition of the adhesive, and substrate surface preparation. There are 3 main types of adhesion defects: complete absence of the adhesive (voids, porosity), poor adhesion and poor cohesive strength [2].
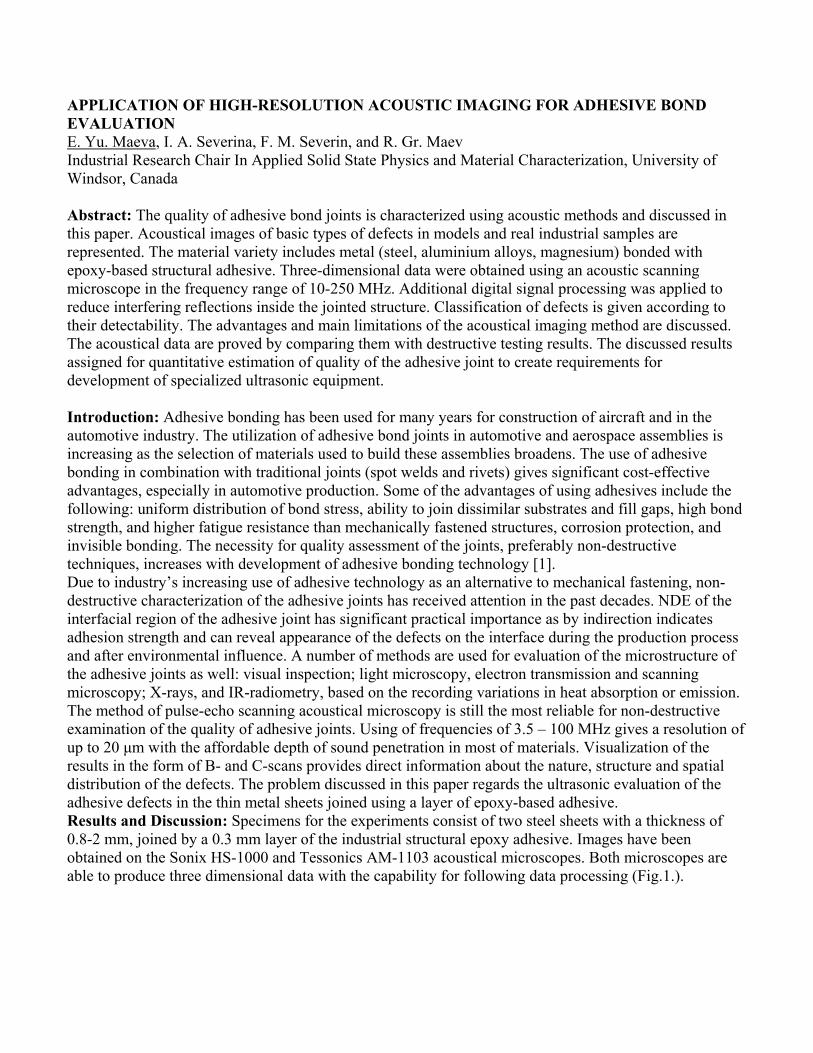
Absence of the adhesion is the easiest type of defect to detect with the acoustic method as there is considerable difference in the reflection coefficient for metal/air and metal/adhesion interfaces. Adhesion voids appear when adhesive is absent between two metal sheets (Fig. 3a). It can be identified in the image of metal/adhesive interface as a brighter area compared with adhesion presence. The main reason of adhesion absence is the surface roughness and improper surface preparation, which leads to air being trapped in the interface. Insufficient amount of the material can also cause this problem. Cracks on the interface weaken the adhesive strength and are usually caused by stress being applied (Fig. 3b). Porosity inside the adhesive layer is more efficiently detectable by focusing and mapping the lower adhesive/metal interface (Fig.3c). In this case, all pores appear as darker spots in the image as ultrasound totally is reflected from the pores, which are above the inspected interface.
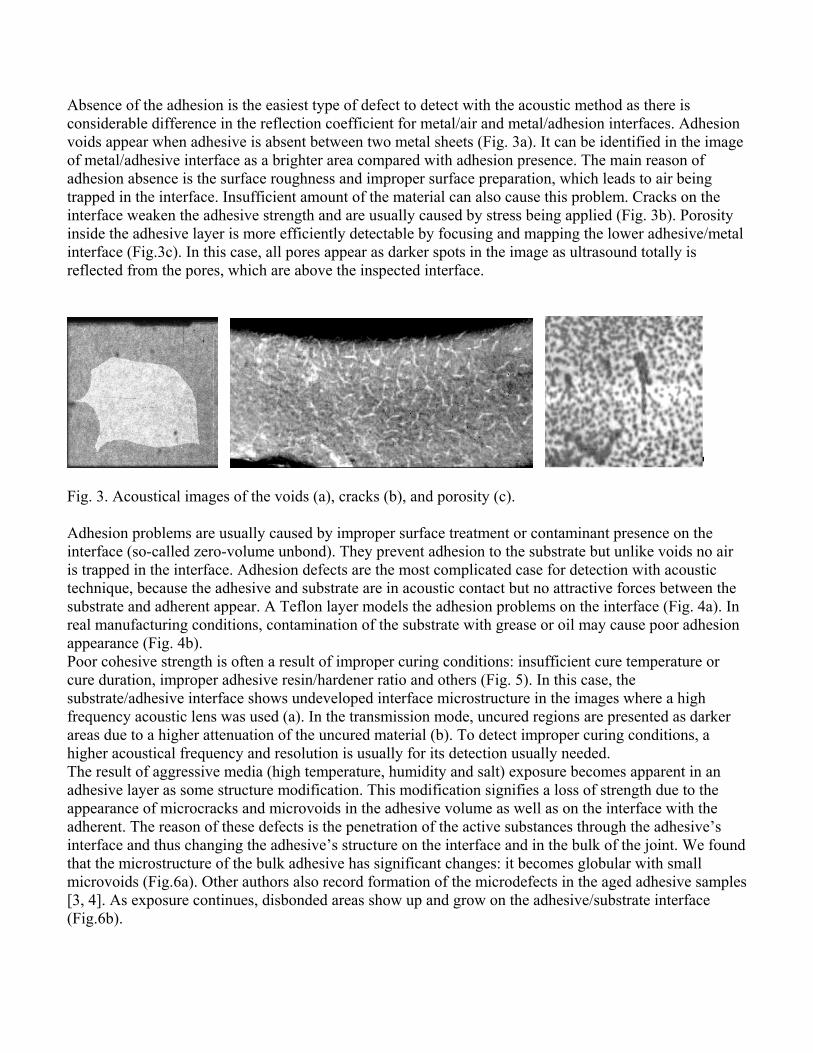
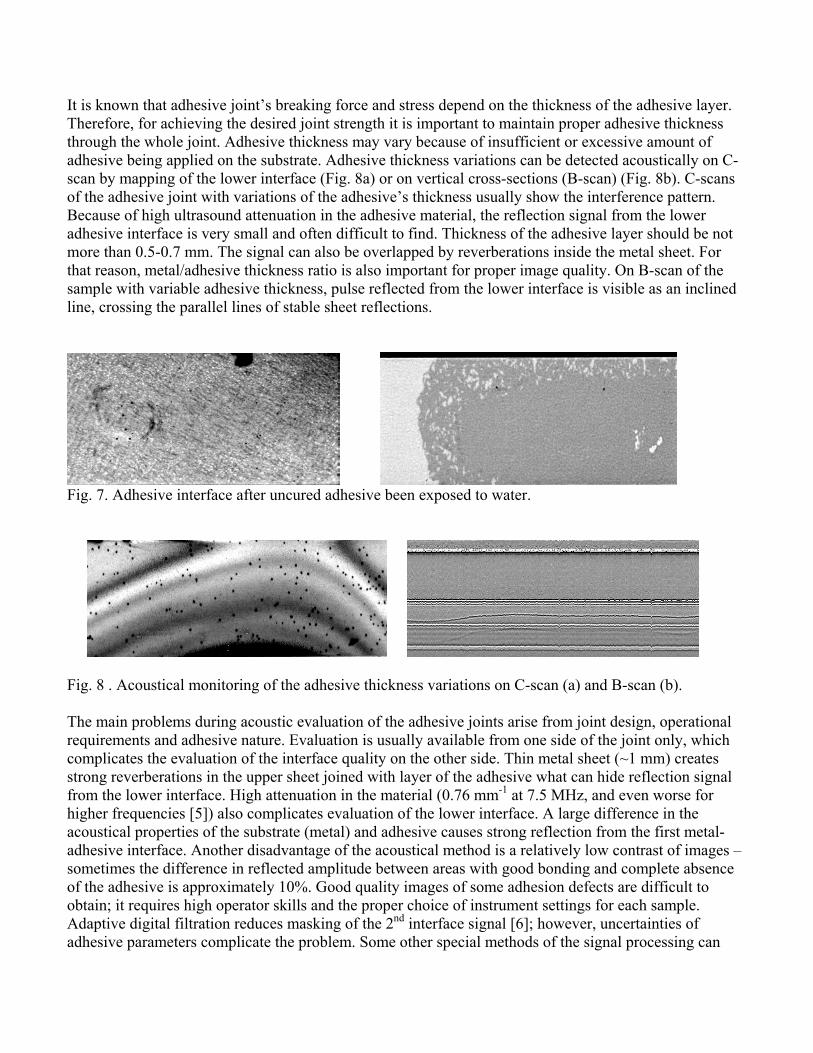
Fig. 3. Acoustical images of the voids (a), cracks (b), and porosity (c). Adhesion problems are usually caused by improper surface treatment or contaminant presence on the interface (so-called zero-volume unbond). They prevent adhesion to the substrate but unlike voids no air is trapped in the interface. Adhesion defects are the most complicated case for detection with acoustic technique, because the adhesive and substrate are in acoustic contact but no attractive forces between the substrate and adherent appear. A Teflon layer models the adhesion problems on the interface (Fig. 4a). In real manufacturing conditions, contamination of the substrate with grease or oil may cause poor adhesion appearance (Fig. 4b). Poor cohesive strength is often a result of improper curing conditions: insufficient cure temperature or cure duration, improper adhesive resin/hardener ratio and others (Fig. 5). In this case, the substrate/adhesive interface shows undeveloped interface microstructure in the images where a high frequency acoustic lens was used (a). In the transmission mode, uncured regions are presented as darker areas due to a higher attenuation of the uncured material (b). To detect improper curing conditions, a higher acoustical frequency and resolution is usually for its detection usually needed. The result of aggressive media (high temperature, humidity and salt) exposure becomes apparent in an adhesive layer as some structure modification. This modification signifies a loss of strength due to the appearance of microcracks and microvoids in the adhesive volume as well as on the interface with the adherent. The reason of these defects is the penetration of the active substances through the adhesive’s interface and thus changing the adhesive’s structure on the interface and in the bulk of the joint. We found that the microstructure of the bulk adhesive has significant changes: it becomes globular with small microvoids (Fig.6a). Other authors also record formation of the microdefects in the aged adhesive samples [3, 4]. As exposure continues, disbonded areas show up and grow on the adhesive/substrate interface (Fig.6b).
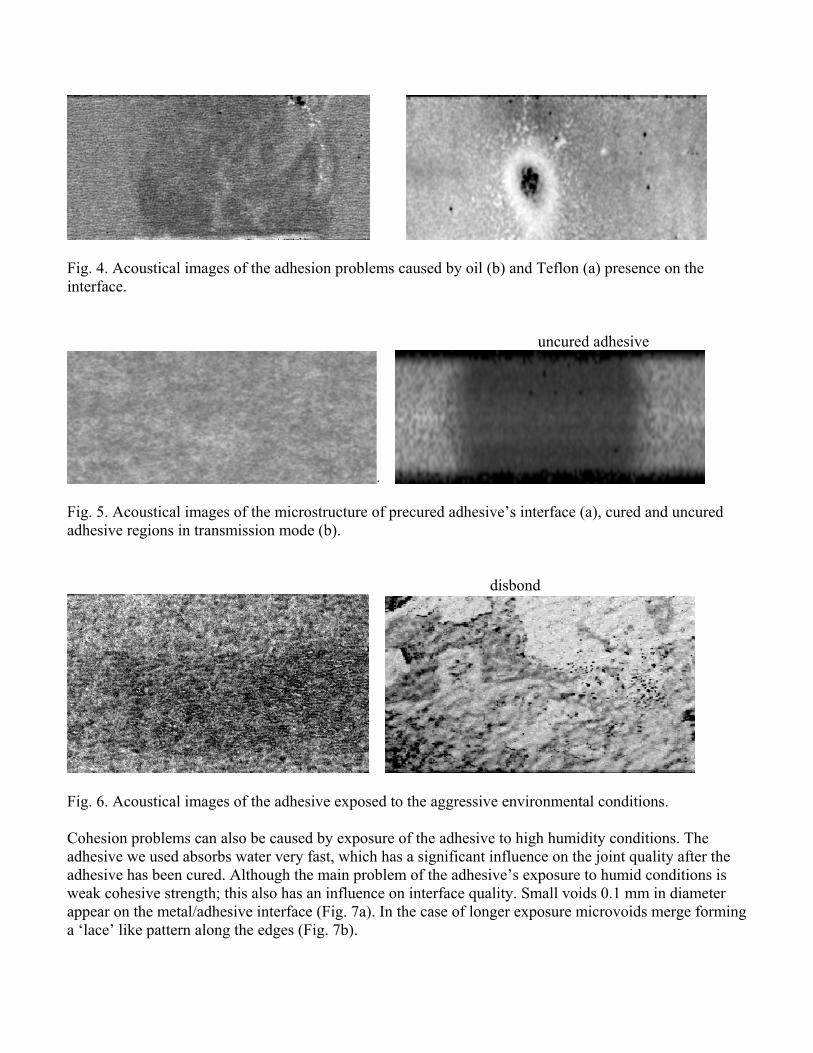
Fig. 4. Acoustical images of the adhesion problems caused by oil (b) and Teflon (a) presence on the interface. uncured adhesive
Fig. 5. Acoustical images of the microstructure of precured adhesive’s interface (a), cured and uncured adhesive regions in transmission mode (b). disbond
Fig. 6. Acoustical images of the adhesive exposed to the aggressive environmental conditions. Cohesion problems can also be caused by exposure of the adhesive to high humidity conditions. The adhesive we used absorbs water very fast, which has a significant influence on the joint quality after the adhesive has been cured. Although the main problem of the adhesive’s exposure to humid conditions is weak cohesive strength; this also has an influence on interface quality. Small voids 0.1 mm in diameter appear on the metal/adhesive interface (Fig. 7a). In the case of longer exposure microvoids merge forming a ‘lace’ like pattern along the edges (Fig. 7b).
It is known that adhesive joint’s breaking force and stress depend on the thickness of the adhesive layer. Therefore, for achieving the desired joint strength it is important to maintain proper adhesive thickness through the whole joint. Adhesive thickness may vary because of insufficient or excessive amount of adhesive being applied on the substrate. Adhesive thickness variations can be detected acoustically on C-scan by mapping of the lower interface (Fig. 8a) or on vertical cross-sections (B-scan) (Fig. 8b). C-scans of the adhesive joint with variations of the adhesive’s thickness usually show the interference pattern. Because of high ultrasound attenuation in the adhesive material, the reflection signal from the lower adhesive interface is very small and often difficult to find. Thickness of the adhesive layer should be not more than 0.5-0.7 mm. The signal can also be overlapped by reverberations inside the metal sheet. For that reason, metal/adhesive thickness ratio is also important for proper image quality. On B-scan of the sample with variable adhesive thickness, pulse reflected from the lower interface is visible as an inclined line, crossing the parallel lines of stable sheet reflections.
Fig. 7. Adhesive interface after uncured adhesive been exposed to water.
Fig. 8 . Acoustical monitoring of the adhesive thickness variations on C-scan (a) and B-scan (b). The main problems during acoustic evaluation of the adhesive joints arise from joint design, operational requirements and adhesive nature. Evaluation is usually available from one side of the joint only, which complicates the evaluation of the interface quality on the other side. Thin metal sheet (~1 mm) creates strong reverberations in the upper sheet joined with layer of the adhesive what can hide reflection signal from the lower interface. High attenuation in the material (0.76 mm-1 at 7.5 MHz, and even worse for higher frequencies [5]) also complicates evaluation of the lower interface. A large difference in the acoustical properties of the substrate (metal) and adhesive causes strong reflection from the first metal-adhesive interface. Another disadvantage of the acoustical method is a relatively low contrast of images – sometimes the difference in reflected amplitude between areas with good bonding and complete absence of the adhesive is approximately 10%. Good quality images of some adhesion defects are difficult to obtain; it requires high operator skills and the proper choice of instrument settings for each sample. Adaptive digital filtration reduces masking of the 2nd interface signal [6]; however, uncertainties of adhesive parameters complicate the problem. Some other special methods of the signal processing can

acquire more information from A-scans and, therefore, significantly improve quality of the acoustical image. Resonance or cross-correlation methods achieve higher contrast in the acoustical images, which makes defects in the adhesive joints more detectable. This improves performance of the ultrasonic imaging method and gives more reliable basis for the evaluation of the industrial adhesive bond joints. Results of the destructive tests strongly confirm ultrasonic evaluation of the adhesive bond joints. Comparison of the images in Fig. 3a and 9a (adhesion void), 4a and 9b (adhesion problem due to Teflon), 6 and 9c (cohesion problem due to the aged adhesive) shows that acoustical images are in good correlation with the destructive test results. Study of the adhesive’s microstructure also shows a correspondence between high resolution acoustical images and results of the destructive test. In the precured stage (Fig.5a and 10a), adhesive has not developed its network structure yet and still remains in a glassy state, which is presented in the acoustical image. There is conformity between images with porosity inside the adhesive (Fig. 3c and 10b). Pore size measured by both methods is 0.2 mm. void Teflon applied cohesive failure
Fig. 9. Destructive test results. a-adhesive void, b-adhesion detects caused by Teflon layer applied on the substrate, c-cohesion failure due to adhesive’s exposure to the aggressive environment
Fig. 10. Images of the adhesive’s microstructure. Destructive test. a- precured adhesive, b-porosity inside the adhesive. Conclusions: The problem of adhesive bond joint evaluation poses a number of interesting challenges. We applied the acoustic method with pulse-echo and transmission modes for evaluating adhesive joints. Pulse-echo imaging appears to be capable of distinguishing most defects under the best of conditions but sometimes suffers from poor sensitivity. For thin metal sheets, the time domain picture is sometimes complicated by interference between different echoes. Use of the spectral approaches simplifies this analysis greatly, and can be easily incorporated into the inspection process. Acoustical images are in good correlation with the destructive test results.

References: 1.Hagemaier, D.J. “Adhesive-bonded Joints”, in: ASM Handbook Nondestructive Evaluation and Quality Control, 9th edition, USA, 1996, 17, pp 610-640. 2. R.D. Adams, B. W. Drinwater, Nondestructive testing of adhesively-bonded joints, NDT&E Int.(1997), 30, pp. 93-98. 3. A. K. Moudi, A. N. Sinclair, J. K. Spelt, Res. Nondestr. Eval. (1999), 11, pp. 81-95 4. K. Vine, P. Cawley, A. J. Kinloch, NDT&E Int. (2002), 35, pp. 241-253 5.Maev, R.G., Levin, V.M., J. IEEE Trans. Ultrasonic, Ferroelectrics and Frequency control,.44, N 6, 1224-1231. (1997). 6. Challis, R.E., Freemantle, R.G., Wilkinson, G.P. and White, J.D.H., Ultrasonics 34, 315-319 (1996).