application of deep learning to detection and survival
TRANSCRIPT

Application of Deep Learning to Detection andSurvival Prediction of COVID-19 Patients Based on
Lung X-Ray Images
Barry B. [email protected]
Michal [email protected]
Bhavik [email protected]
Category— Healthcare
Abstract
In this contribution we discuss the application of deep learning methods to study 2D X-Rayimages of COVID-19 patients. In particular, we employ a convolutional neural network(CNN) to classify X-ray images into three classes: normal, viral pneumonia and COVID-19.For X-Rays classified as COVID-19 we perform manual and automatic temporal progressionanalysis. For the manual analysis we display a series of X-Ray scans containing the mostsimilar feature embedding under the cosine similarity. Furthermore, by studying a seriesof images of a given patient with a sequence model (long-short term memory RNN), weinvestigate the survival rate. Various experiments are reported along with comparison ofmodel performance.
1 Problem Description
The COVID-19 pandemic has had an unprecedented impact on the humanity. We intend to contribute to theglobal data-driven modelling effort and support classification of X-Ray images of COVID-19 patients as well asstudy their survival. We envisage to approach our problem in two stages with growing model complexity. Theinput, in the first stage, are X-Ray images of COVID-19 patients as well as patients with other lung diseasesalong with healthy individuals. For the purpose of this study we consider two-dimensional images (2D). Theoutput of the first stage is a binary model implemented with a CNN, which outputs a probability on whethera patient has COVID-19. The second stage requires the input of time-series data, namely the progression ofCOVID-19 in the X-Rays. Then, given the patient has the disease, we will output the survival rate.
1.1 Related work
Currently, existing data sets are analyzed with deep learning methods (especially image detection and classi-fication). Given the global climate, detection is a huge part of novel work being carried out. Usually this isdone with CNNs on X-Ray images (see [1], [2], [3], [4], [5]), which is generally the path that we will follow.Another approach involves deep learning decision-tree classifiers (cf. [6]). In the field of survival rate prediction,we identified several relevant pieces of research work on COVID-19, e.g., [7], [8]. Wang et al. used a CNNto discover tumor shape and predict survival in patients with lung cancer [9]. Deep NNs were also used forsurvival prediction in brain tumors [10]. DeepSurv [11] uses a Cox proportional hazard deep neural network torecommend a personalized treatment. The novelty of our work is use of CNN and LSTM to survival prediction.
2 Dataset
Data gathering was a challenge as a lot of data is being collected right now, albeit not necessarily cleaned. Wealso had an issue in terms of time evolution of the X-Ray scans, where there is not a lot of open data sets trackingthe progression of the disease. Particularly, in comparison with healthy patients which is desired for us to train
CS230: Deep Learning, Fall 2020, Stanford University, CA. (LateX template borrowed from NIPS 2017.)
the sequential part of our model. Some articles, such as [1], even generate their own images given the lack ofrobust data sets. Data is often conflated with pneumonia data sets, so our goal is to detect COVID-19 in caseswhere the pneumonia is not as pronounced.
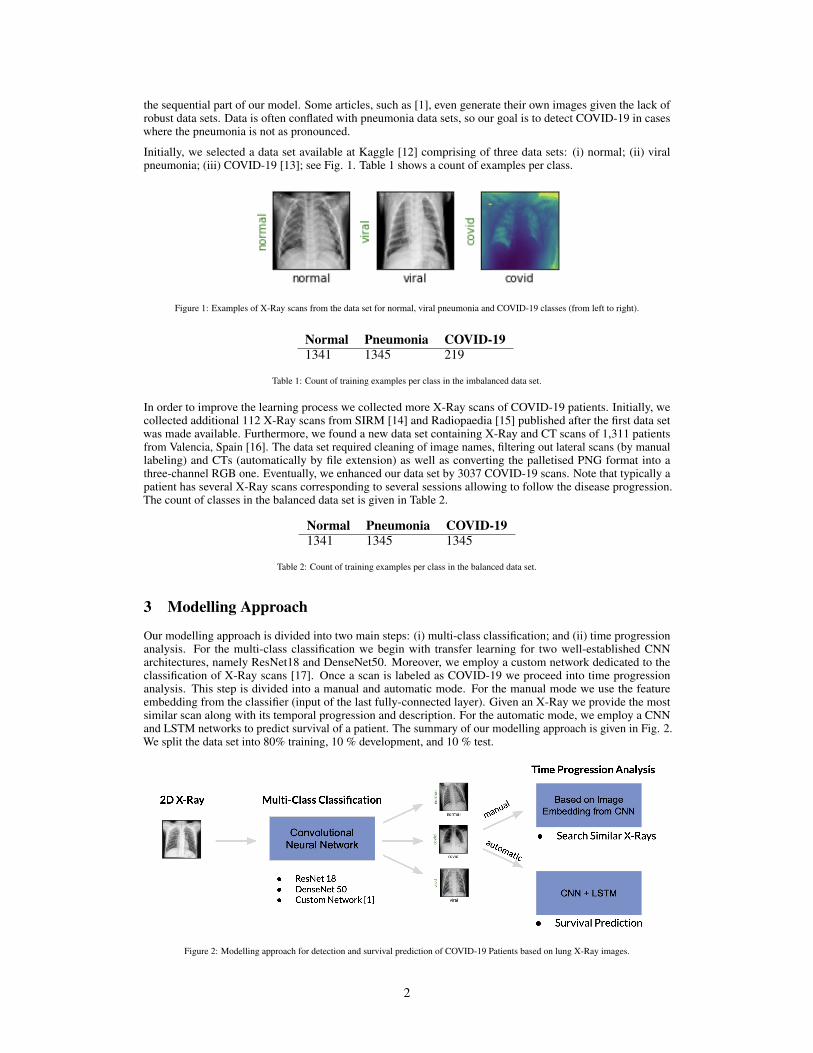
Initially, we selected a data set available at Kaggle [12] comprising of three data sets: (i) normal; (ii) viralpneumonia; (iii) COVID-19 [13]; see Fig. 1. Table 1 shows a count of examples per class.
Figure 1: Examples of X-Ray scans from the data set for normal, viral pneumonia and COVID-19 classes (from left to right).
Normal Pneumonia COVID-191341 1345 219
Table 1: Count of training examples per class in the imbalanced data set.
In order to improve the learning process we collected more X-Ray scans of COVID-19 patients. Initially, wecollected additional 112 X-Ray scans from SIRM [14] and Radiopaedia [15] published after the first data setwas made available. Furthermore, we found a new data set containing X-Ray and CT scans of 1,311 patientsfrom Valencia, Spain [16]. The data set required cleaning of image names, filtering out lateral scans (by manuallabeling) and CTs (automatically by file extension) as well as converting the palletised PNG format into athree-channel RGB one. Eventually, we enhanced our data set by 3037 COVID-19 scans. Note that typically apatient has several X-Ray scans corresponding to several sessions allowing to follow the disease progression.The count of classes in the balanced data set is given in Table 2.
Normal Pneumonia COVID-191341 1345 1345
Table 2: Count of training examples per class in the balanced data set.
3 Modelling Approach
Our modelling approach is divided into two main steps: (i) multi-class classification; and (ii) time progressionanalysis. For the multi-class classification we begin with transfer learning for two well-established CNNarchitectures, namely ResNet18 and DenseNet50. Moreover, we employ a custom network dedicated to theclassification of X-Ray scans [17]. Once a scan is labeled as COVID-19 we proceed into time progressionanalysis. This step is divided into a manual and automatic mode. For the manual mode we use the featureembedding from the classifier (input of the last fully-connected layer). Given an X-Ray we provide the mostsimilar scan along with its temporal progression and description. For the automatic mode, we employ a CNNand LSTM networks to predict survival of a patient. The summary of our modelling approach is given in Fig. 2.We split the data set into 80% training, 10 % development, and 10 % test.
Figure 2: Modelling approach for detection and survival prediction of COVID-19 Patients based on lung X-Ray images.
2

3.1 Multi-Class Classification
We chose the pytorch library to train a multi-class classifier. The classifier labels normal X-Ray scans and twoclasses of scans indicating a viral disease (either pneumonia or COVID-19). We decided to follow a similar pathas reported in literature by performing transfer learning on a pre-trained CNN (ResNet and DenseNet). The newapproach was to re-implement a custom model used in another study of X-Ray scans [17]. For the classicalCNN models, we performed the hyperparameter tuning and studied the impact of these changes on the modelperformance.
3.1.1 ResNet Architecture
We carried out first experiments with the ResNet-18 architecture used for image classification tasks. The modelhad pre-trained parameters on the ImageNet dataset. We modified the output, fully connected layer in order toclassify images into three classes (normal, COVID-19, pneumonia). We used an ADAM optimization techniquewith a learning rate of 3*10−5 and a binary cross-entropy loss. Experiments for the imbalanced data set arereported in Appendix B.
With the balanced data set, we began with a tuning of the batch size. After observing the loss evolution forseveral batch sizes (6, 12, 18, 24), we concluded that the fastest training and lowest loss after 20 epochs wasachieved for a batch of 24 images; see Fig 3.
Figure 3: Learning curve for Resnet18 model with the balanced dataset and the batch size of 24 images.
N V CN 121 14 0V 2 133 0C 0 0 135
Table 3: Confusion matrix for Resnet18model with the balanced data set andthe batch size of 24 images.
In this case an early stopping strategy could reduce the over-fitting of the model. From Table 3 we note that themodel did not commit any error on the test set for COVID-19 examples; in the paper we follow a conventionthat columns denote predicted labels and the rows contain the true labels. Therefore, we decided to take thisclassifier as a reference one for the manual time progression analysis.
3.1.2 DenseNet Architecture
We performed several experiments with the DenseNet-121 architecture used for image classification tasks. Inthe first experiment, we used the pre-trained parameters and we froze all the weights in all the layers exceptfor the last layer composed of a custom trainable classifier consisting of a ReLu, adaptive avg pool2d and aflatten followed by a softmax classifier layer. After training for 20 epochs, the model was able to predict all threeclasses: Normal, Viral, and Covid. Please refer to Appendix C for the detailed results.
3.1.3 Custom Architecture
We now leverage the structure utilized in [18] in order to build a CNN for classifying the lung x-rays. Thisstructure feeds the data through a number of simple convolutional blocks. The two main parameters we ended upcontrolling in this facet of the problem were the number of blocks to use as well as the learning rate. We first findthat adding one more block on top of original architecture (which used 5) allowed us to increase the training devaccuracy by about 10%. Past this, we start to see a split where we begin to overfit on the training data. Moreover,after finding a feasible lower and upper bound for the learning rate, we did an iterative search over possiblevalues and found that a learning rate of α = 3 ∗ 10−5 gives us pretty good convergence. We see that using thesehyperparameters, we gain a training accuracy of 99.69% and a dev accuracy of 93.58%. Note that still, there is adegree of overfitting in our model, despite that we’ve tried to control this. Similarly to the issues experienced inSection 3.1.1, we see from inspecting the curve that early stopping might help us aleviate this problem.
3

Figure 4: Learning curve for custom architecture with the balanceddata set.
N V CN 119 16 0V 6 128 1C 0 3 132
Confusion Matrix for Custom Model
3.2 Time Progression Analysis
Once an X-Ray is classified as a COVID-19 class, we perform time progression analysis. The goal of the analysisis to predict the progression of the disease based on the actual scan. We approach this task with a manual andautomatic methods.
3.2.1 X-Ray Search with Image Embedding
Based on the ResNet18 model with the best performance we perform a forward propagation for each of theCOVID-19 scans and extract embedding as an input vector of the last fully connected layer. The input vector iscomposed of 512 elements. Given an input image we return a list of n most similar image sets with respect tothe cosine similarity S(u, v) = uT v/||u|| ∗ ||v||, where u and v are X-ray embeddings. The image set consistsof a series of images of a given patient taken over time. This allows to manually compare the images and inferabout the progression of the disease. Furthermore, we display a radiologist annotation for each X-ray scanningsession. Naturally, this method is only suited for experienced radiologists and medical doctors.
3.2.2 Survival Analysis with Sequence Model
We proposed a time-distributed CNN-LSTM architecture as shown in Figure 5, which incorporates the temporalrelationship between different X-Ray images from the same patient, as a patient can take many scans sequentiallyover time during their hospital stay to monitor changes of the disease.
LSTM
LSTM
LSTM
LSTM
Sig
moid
Layer
Time:
Surv
ival Pr
edic
tion
Figure 5: Proposed CNN-LSTM Architecture
This proposed architecture is able to evaluate the Covid-19 evolution by learning the temporal correlations ofimages provided as input. We demonstrate that this model can integrate imaging scans at multiple timepointsto predict chances of survival. One CNN is defined at each timepoint input, which learns the spatial featuresof the image. The output of the pre-trained CNN network is then fed into an LSTM which is used to learn thetemporal relationship across the series of images. The final sigmoid layer allows for a binary classification output(dead/survived). In our implementation of the CNN part of our architecture, we used a pre-trained DenseNet121model and applied a 2D adaptive average pooling followed by a FC-1024 layer. An LSTM is then applied bydefining 64 hidden units followed by a sigmoid layer to perform binary classification. We used an ADAMoptimization technique with a learning rate of 0.01 and a binary cross-entropy loss. The momentum value wasset to 0.5. Figure 6 shows the confusion matrix of our survival prediction results.
4

(a) Confusion matrix of CNN-LSTM model with normalization (b) Confusion matrix of CNN-LSTM model without normalization
Figure 6: Confusion Matrix for Survival Model
Two time series of a Covid-19 patient with a survival probability of 0.9330 using the raw X-ray images areshown in Figure 7 (a-b). As one can notice, over time the state of the patient improved (lungs are not coveredwith inflammation) and lungs are more visible; this is confirmed by indication of our model. Figure 7 (c-e)shows three activation maps for different time periods for subject s03113 with a predicted survival probability of0.8438 calculated by the sigmoid function. Note highlight of the model activation overlayed over the scan.
(a) first (b) second (c) day 1 (d) day 5 (e) day 8
Figure 7: (a-b) COVID-19 pneumonia - timeline for Subject sub-S03213 with survival probability of 0.9330; (c-e) COVID-19 pneumonia -timeline for Subject sub-S03113 with survival probability of 0.8438
4 Conclusion
Through this project, we have utilized a robust and principled workflow in order to create a system that is ableto (1) discern cases of COVID-19, and (2) generate a survival prediction. For the multi-class classificationwe employed both transfer learning (ResNet, DenseNet) as well as a custom architecture suited to X-Rayclassification. For each model we performed hyperparameter tuning in order to reduce overfit while maintaininghigh accuracy. In both the setting where we create a custom model and utilize a pre-trained model with slightmodifications, we were able to achieve a high (>90%) accuracy rate on all classes in the test set. However, theone caveat is that we see a reasonable degree of variance, since again in both cases, we have a training accuracyof close to 100%. One of the modelling challenges was an imbalanced dataset (low number of COVID-19cases). In that respect, incorporation of an additional dataset allowed to obtain meaningful results while variousstrategies for handling class imbalance were not as effective.
For X-Ray scans labeled as COVID-19 we performed time progression analysis. X-ray embedding allowed forsearch of similar COVID-19 cases in an annotated database. Survival prediction model combined CNN andLSTM and provided good accuracy in predicting the disease progression.
Future work will focus on applying different CNN models (DenseNet201, VGG16, VGG19, Inception-v3, etc.)on our proposed CNN-LSTM architecture. We can also incorporate demographic, clinical, and laboratory datato predict mortality and the need for ventilator support.
5

Acknowledgment
Firstly we would like to thank Shahab Mousavi for overlooking the project as well as other CS230 TAs for helpat various stages. Initial work was carried out with free GPU instances delivered by Google Colab. The trainingof classification and survival prediction models on the balanced dataset was possible due to credits provided byAmazon AWS.
References[1] Zebin T and Rezvy S. Covid-19 detection and disease progression visualization: Deep learning on chest.
Appl Intell, 2020.
[2] Shervin Minaee, Rahele Kafieh, Milan Sonka, Shakib Yazdani, and Ghazaleh Jamalipour Soufi. Deep-covid: Predicting covid-19 from chest x-ray images using deep transfer learning. Medical Image Analysis,65:101794, 2020.
[3] Cohen J, Dao L, and Roth K et al. Predicting covid-19 pneumonia severity on chest x-ray with deeplearning. Cureus, 2020.
[4] Harsh Panwar, P.K. Gupta, Mohammad Khubeb Siddiqui, Ruben Morales-Menendez, Prakhar Bhardwaj,and Vaishnavi Singh. A deep learning and grad-cam based color visualization approach for fast detectionof covid-19 cases using chest x-ray and ct-scan images. Chaos, Solitons & Fractals, 140:110190, 2020.
[5] Butt C., Gill J., Chun D., and Babu B. A. Deep learning system to screen coronavirus disease 2019pneumonia. Applied Intelligence, 2020.
[6] Seung Hoon Yoo, Hui Geng, Tin Lok Chiu, Siu Ki Yu, Dae Chul Cho, Jin Heo, Min Sung Choi, Il HyunChoi, Cong Cung Van, Nguen Viet Nhung, Byung Jun Min, and Ho Lee. Deep learning-based decision-treeclassifier for covid-19 diagnosis from chest x-ray imaging. Frontiers in Medicine, 7:427, 2020.
[7] J. P. et al Cohen. “predicting covid-19 pneumonia severity on chest x-ray with deep learning”. Cureus,2020.
[8] Alfonso Emilio Gerevini, Roberto Maroldi, Matteo Olivato, Luca Putelli, and Ivan Serina. Prognosisprediction in covid-19 patients from lab tests and x-ray data through randomized decision trees, 2020.
[9] Wang S., Chen A., and Yang L. et al. Comprehensive analysis of lung cancer pathology images to discovertumor shape and boundary features that predict survival outcome. Scientific Reports, 2018.
[10] Po-Yu Kao, Thuyen Ngo, Angela Zhang, Jefferson W. Chen, and B. S. Manjunath. Brain tumor segmen-tation and tractographic feature extraction from structural mr images for overall survival prediction. InAlessandro Crimi, Spyridon Bakas, Hugo Kuijf, Farahani Keyvan, Mauricio Reyes, and Theo van Walsum,editors, Brainlesion: Glioma, Multiple Sclerosis, Stroke and Traumatic Brain Injuries, pages 128–141,Cham, 2019. Springer International Publishing.
[11] Katzman Jared L. et al. Deepsurv: personalized treatment recommender system using a cox proportionalhazards deep neural network. BMC medical research methodolog, 2018.
[12] COVID-19 Radiography Database, https://www.kaggle.com/tawsifurrahman/covid19-radiography-database.
[13] Cohen J.P., Morrison P., and Dao L. Covid-19 image data collection, 2020.
[14] SIRM COVID-19 Database, https://www.sirm.org/category/senza-categoria/covid-19/.
[15] Radiopaedia covid-19, https://radiopaedia.org/articles/covid-19-4.
[16] Maria de la Iglesia Vayá, Jose Manuel Saborit, Joaquim Angel Montell, Antonio Pertusa, Aurelia Bustos,Miguel Cazorla, Joaquin Galant, Xavier Barber, Domingo Orozco-Beltrán, Francisco García-García,Marisa Caparrós, Germán González, and Jose María Salinas. Bimcv covid-19+: a large annotated datasetof rx and ct images from covid-19 patients, 2020.
[17] F. Pasa, V. Golkov, and F. et al Pfeiffer. Efficient deep network architectures for fast chest x-ray tuberculosisscreening and visualization. Sci Rep, 2019.
[18] F. Pasa et al. Efficient deep network architectures for fast chest x-ray tuberculosis screening and visualiza-tion. Scientific Reports, 2019.
6

[19] Data Preparation Notebook, https://github.com/michalmac89/cs230finalproject/blob/dropout/Pytorch_COVID_19_Data_Preparation.ipynb.
[20] Covid-19 detection x-ray, https://www.coursera.org/projects/covid-19-detection-x-ray.
[21] Model Training Notebook, https://github.com/michalmac89/cs230finalproject/blob/dropout/Pytorch_COVID_19_ResNet18_Dropout.ipynb.
[22] Post-Processing Notebook, https://github.com/michalmac89/cs230finalproject/blob/dropout/Post_Processing_ResNet_18_Dropout.ipynb.
[23] Transfer Learning DenseNet121 Notebook, https://github.com/michalmac89/cs230finalproject/blob/main/DenseNet_Transfer_Learning.ipynb.
[24] Imbalanced Dataset Sampler Resnet18 Notebook, https://github.com/michalmac89/cs230finalproject/blob/main/Pytorch_COVID_19_ResNet18_Model_With_under_and_over_sampling.ipynb.
A Workflow
Our primary goal was to establish a workflow to query the data set, set-up and train model as well as compareand evaluate results. Since the data set is relatively small we decided to carry out all the steps in a JupyterNotebook in Google Colab. This choice also enabled collaborative work.
We queried the data set from Kaggle to Google Colab space with the Kaggle Python API. After unpacking wemoved the files to Google drive in order to preserve them between session. In addition, we split the data set intotraining, development, and test sets. To this end we created a notebook reported in [19].
Model training includes creating a data loader along with appropriate transformations and defining a trainingloop. We used cross-entropy loss and Adam optimizer for batch gradient descent.
Algorithm 1: Training loopResult: Write here the resultinitialization;for each epoch do
for each batch in the training set docalculate forward propagation;calculate cross-entropy loss;calculate backward propagation;update parameters;
endcompute and store a training loss for current epoch compute and store an accuracy for the training set
for each batch in the dev set docalculate forward propagation;calculate cross-entropy loss;
endcompute and store a dev loss for current epoch compute and store an accuracy for the dev set
end
Once the training is completed, we run forward propagation on the tests set to evaluate final performance of themodel. Each model has been evaluated on the following metrics: accuracy and confusion matrix evaluated fortraining and dev sets. The workflow is an extension of a case study presented in course [20].
B ResNet Experiments
The model was trained for 20 epochs with a batch of 6 images. For the reference model and imbalanced dataset, we obtained 100 % and 96.6 % accuracy for the training and test sets, respectively. The difference inthe accuracy indicates overfitting of the model. In fact, the model perfectly classified all training examples.Therefore, we added dropout in the final fully-connected layer and studied the model accuracy. Two cases wereconsidered (80 % and 50 % probability of keeping weights in the model). 80 % dropout reduced the accuracyfor both training (97.1 %) and development sets (97.8 %), thus, reducing model over fitting. Further increaseof dropout probability to 50 % significantly deteriorated model performance: 83.1 % for training and 93.3 %for development sets. We note that due to a relatively large complexity of the model and a rather small data set(subject to class imbalance), the model tends to overfit the training examples. This translates into a difficulty in
7

fine tuning the model. The notebook used for ResNet-18 studies is available at [21] and the post-processingnotebook is stored in [22].
C DenseNet Experiments
Table from the first, second and third experiments (confusion matrix and the precision/recall/f1-score metrics)
N V CN 124 10 1V 15 120 0C 0 0 135
(a) First experiment
N V CN 124 10 1V 15 120 0C 0 0 135
(b) Second experiment
N V CN 131 4 0V 2 133 0C 0 2 133
(c) Third experiment
Table 4: Confusion Matrix for the three experiments; N stands for Normal class, C stands for COVID-19 class, and V stands for ViralPneumonia Class.
All models were trained with a mini-batch size of 6 and for 20 epochs trying out different layers to freeze. Inthe first experiment we froze all the layers except the last layer. In the second experiment we froze just the firstlayer. We saw no difference between the first two experiments. In the last experiment we didn’t freeze any ofthe layers. They more or less perform about the same. The notebook that implements the transfer learning of apre-trained DenseNet is available at [23].
precision recall f1-score support
Normal 0.892086 0.918519 0.905109 135.000000Viral 0.923077 0.888889 0.905660 135.000000Covid 0.992647 1.000000 0.996310 135.000000accuracy 0.935802 0.935802 0.935802 0.935802macro avg 0.935937 0.935802 0.935693 405.000000weighted avg 0.935937 0.935802 0.935693 405.000000
Table 5: Metrics for the first experiment
precision recall f1-score support
Normal 0.892086 0.918519 0.905109 135.000000Viral 0.923077 0.888889 0.905660 135.000000Covid 0.992647 1.000000 0.996310 135.000000accuracy 0.935802 0.935802 0.935802 0.935802macro avg 0.935937 0.935802 0.935693 405.000000weighted avg 0.935937 0.935802 0.935693 405.000000
Table 6: Metrics for the second experiment
D Strategies for Handling Imbalanced Classes
The COVID-19 examples are under-represented in the dataset. Therefore, in the first attempt we decided to reduceto 300 the number of examples for normal and viral pneumonia classes. Afterwards, we utilized a combinationof minority class over-sampling and majority class under-sampling to compensate for the imbalanced trainingdataset. It consisted of removing samples from the majority class (under-sampling) and/or adding more examplesfrom the minority class (over-sampling).
With the imbalanced dataset sampler and after training for 90 epochs:
8

precision recall f1-score support
Normal 0.984962 0.970370 0.977612 135.000000Viral 0.956835 0.985185 0.970803 135.000000Covid 1.000000 0.985185 0.992537 135.000000accuracy 0.980247 0.980247 0.980247 0.980247macro avg 0.980599 0.980247 0.980317 405.000000weighted avg 0.980599 0.980247 0.980317 405.000000
Table 7: Metrics for the third experiment
Without the imbalanced data set sampler and after training for 90 epochs:
Note that there are significant improvements for the Covid class when applying both under-sampling andover-sampling strategies to deal with class imbalanced while the accuracy of the other classes were not impactedthat much, i.e., the accuracy of the Covid class increased from 93.3% to 96.7% using the imbalanced datasetsampler. Take a look at the following notebook [24] that implements this random sampler for an imbalanceddataset.
E Survival Analysis
Figure 8 displays the accuracy and loss curves of our proposed CNN-LSTM model over 125 epochs.
9

Figure 8: Accuracy/Loss of the CNN-LSTM model to predict survival with a Densenet121 pre-trained CNN
10