application of cze and hplc on glucosamine
TRANSCRIPT
8/8/2019 Application of CZE and HPLC on Glucosamine
http://slidepdf.com/reader/full/application-of-cze-and-hplc-on-glucosamine 1/12
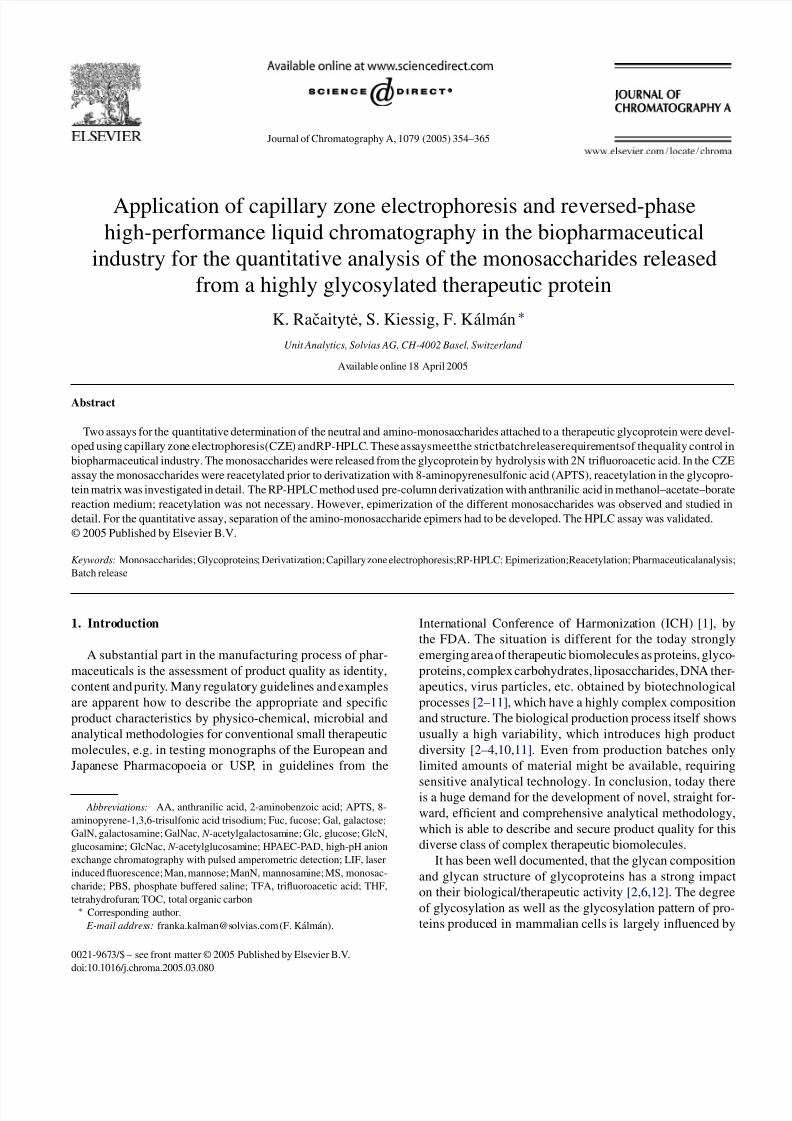
Journal of Chromatography A, 1079 (2005) 354–365
Application of capillary zone electrophoresis and reversed-phasehigh-performance liquid chromatography in the biopharmaceutical
industry for the quantitative analysis of the monosaccharides releasedfrom a highly glycosylated therapeutic protein
K. Racaityte, S. Kiessig, F. Kalman ∗
Unit Analytics, Solvias AG, CH-4002 Basel, Switzerland
Available online 18 April 2005
Abstract
Two assays for the quantitative determination of the neutral and amino-monosaccharides attached to a therapeutic glycoprotein were devel-
oped using capillary zone electrophoresis(CZE) andRP-HPLC. These assaysmeetthe strictbatchreleaserequirementsof thequality control in
biopharmaceutical industry. The monosaccharides were released from the glycoprotein by hydrolysis with 2N trifluoroacetic acid. In the CZE
assay the monosaccharides were reacetylated prior to derivatization with 8-aminopyrenesulfonic acid (APTS), reacetylation in the glycopro-
tein matrix was investigated in detail. The RP-HPLC method used pre-column derivatization with anthranilic acid in methanol–acetate–borate
reaction medium; reacetylation was not necessary. However, epimerization of the different monosaccharides was observed and studied in
detail. For the quantitative assay, separation of the amino-monosaccharide epimers had to be developed. The HPLC assay was validated.
© 2005 Published by Elsevier B.V.
Keywords: Monosaccharides; Glycoproteins; Derivatization; Capillary zone electrophoresis;RP-HPLC; Epimerization;Reacetylation; Pharmaceuticalanalysis;
Batch release
1. Introduction
A substantial part in the manufacturing process of phar-
maceuticals is the assessment of product quality as identity,
content and purity. Many regulatory guidelines and examples
are apparent how to describe the appropriate and specific
product characteristics by physico-chemical, microbial and
analytical methodologies for conventional small therapeutic
molecules, e.g. in testing monographs of the European and
Japanese Pharmacopoeia or USP, in guidelines from the
Abbreviations: AA, anthranilic acid, 2-aminobenzoic acid; APTS, 8-
aminopyrene-1,3,6-trisulfonic acid trisodium; Fuc, fucose; Gal, galactose;
GalN, galactosamine; GalNac, N -acetylgalactosamine; Glc, glucose; GlcN,
glucosamine; GlcNac, N -acetylglucosamine; HPAEC-PAD, high-pH anion
exchange chromatography with pulsed amperometric detection; LIF, laser
induced fluorescence; Man, mannose; ManN, mannosamine; MS, monosac-
charide; PBS, phosphate buffered saline; TFA, trifluoroacetic acid; THF,
tetrahydrofuran; TOC, total organic carbon∗ Corresponding author.
E-mail address: [email protected] (F. Kalman).
International Conference of Harmonization (ICH) [1], by
the FDA. The situation is different for the today strongly
emerging area of therapeutic biomolecules as proteins, glyco-
proteins, complex carbohydrates, liposaccharides, DNA ther-
apeutics, virus particles, etc. obtained by biotechnological
processes [2–11], which have a highly complex composition
and structure. The biological production process itself shows
usually a high variability, which introduces high product
diversity [2–4,10,11]. Even from production batches only
limited amounts of material might be available, requiring
sensitive analytical technology. In conclusion, today thereis a huge demand for the development of novel, straight for-
ward, efficient and comprehensive analytical methodology,
which is able to describe and secure product quality for this
diverse class of complex therapeutic biomolecules.
It has been well documented, that the glycan composition
and glycan structure of glycoproteins has a strong impact
on their biological/therapeutic activity [2,6,12]. The degree
of glycosylation as well as the glycosylation pattern of pro-
teins produced in mammalian cells is largely influenced by
0021-9673/$ – see front matter © 2005 Published by Elsevier B.V.
doi:10.1016/j.chroma.2005.03.080

8/8/2019 Application of CZE and HPLC on Glucosamine
http://slidepdf.com/reader/full/application-of-cze-and-hplc-on-glucosamine 2/12
K. Raˇ caityte et al. / J. Chromatogr. A 1079 (2005) 354–365 355
the actual cell line as well as cell culture conditions used
for production [13]. A sensitive measure for the consistency
of glycoprotein drug substances/preparations with respect to
their glycosylation is given by the determination of the molar
ratio of individual monosaccharides with respect to protein.
Typically the neutral monosaccharides galactose, man-
nose and fucose and the amino-monosaccharides N -acetylglucosamine and N -acetylgalactosamine are found and
have to be determined in mammalian glycoproteins. There
are no methods available for direct quantitative determina-
tion of complex carbohydrates attached to the protein back-
bone [14]. That means, the carbohydrate moiety needs to be
cleaved from the glycoprotein and subsequently hydrolyzed
completely in order to obtain the monosaccharide building
blocks. Decomposition of the released monosaccharides dur-
ing thecleavage hasto be avoided,since that would adulterate
their quantitation. Acidic hydrolysis using 2N trifluoroacetic
acid for several hours at about 100 ◦C is the most common
hydrolysis procedure [14–19].
Traditionally, both chromatography [12,16,20,21] andelectrophoresis [22] areemployedfor theanalysis of carbohy-
drates. Sensitive detection of monosaccharides is hampered
by the absence of effective chromophores or fluorophores.
Detection without derivatization by measurement of the re-
fractive index or absorption in the UV region at 190–210nm
is restricted to the mol to nmol range, respectively [23].
Quantitative composition analysis of oligosaccharides has
relied in the past to a large extent on GC separation and
flame ionisation detection of trimethylsilyl or alditol acetate
monosaccharide derivatives. GC has good sensitivity, but
derivatization chemistry is tedious and it results usually
in very complex separation patterns due to stereochemicalisomeric reaction products of the monosaccharides [14,24].
One of the most widely used method for sensitive (<1 nmol),
quantitative analysis of monosaccharides employs high-pH
anion exchange chromatography with pulsed amperometric
detection (HPAEC-PAD) [14,19,25,26]. It gives high reso-
lution of all common monosaccharides in less than 30 min
[14] and has the advantage of not requiring pre-column
derivatization of monosaccharides [26]. However, due to the
high pH of the eluent it needs special equipment, what is
not commonly available in pharmaceutical quality control
laboratories. Alternatively, sensitive, no derivatization
requiring, fast (<20 min) carbohydrate analysis by CZE was
developed using high alkaline pH (>12) electrolytes to ionize
the carbohydrates. Using 2,6-pyridine-dicarboxylic acid as
indirect UV agent for Glc a 70 mol limit of detection was
obtained [27]. Amino acids and peptides from glycoprotein
hydrolysate do not interfere with the detection of carbo-
hydrates as reported for HPAEC-PAD [25]. However, CZE
separation at such high pH makes the baseline noisy and to
our experience the CZE system unstable.
Today, sensitive (<1 nmol) methods using RP-HPLC with
fluorescence detection or capillary electrophoresis with LIF
detection are available for the quantitative determination of
monosaccharides (see for HPLC reviews [12,16], for CE re-
view [22]). These methods are based on precolumn deriva-
tization of the monosaccharides by introducing fluorescence
tags. This approach allows the analysis of glycoproteins in
g/ml protein concentration range, a typical concentration
for pharmaceutical glycoprotein drug products. Among the
various methods described for derivatization [28] reductive
amination that introduces an aromatic amine to the alde-hyde group of the carbohydrate is a widely applied pro-
cedure [18,29–36]. A broad set of labels for carbohydrate
laser-induced fluorescence (LIF) detection, the most sen-
sitive detection mode in CE, have been described, e.g. 2-
aminopyridine [37,38], aminobenzoic acids [15,39], phenyl-
methylpyrazolone [29–31], 8-aminonapthalene-sulfonic acid
[32–35], 8-aminopyrenesulfonic acid (APTS) [18,36,40], 7-
amino-4-methylcoumarin [41] and 2-aminoacridone [42,43].
Among them APTS labellingis themost commonapproachin
CE [22]. Detectionlimitsas low as about 1 pmol formonosac-
charide standards can be estimated from the literature
[18,40]. APTS provides charges to the uncharged monosac-
charides what is advantageous for their analysis by CZE[22,40].
RP-HPLC is the most widely used separation technique
in today’s pharmaceutical industry [44]. Common fluores-
cent tags used for labelling of the monosaccharides prior to
RP-HPLC analysis are: anthranilic acid (AA), 2-aminobe-
nzamide, 2-aminopyridine [12,16], phenyl isothiocyanate
[12], 9-fluorenylmethoxycarbonylhydrazine, 7-amino-4-me-
thylcoumarin, 7-amino-1,3-naphthalene-disulphonate [12].
Among the RP-HPLC methods, separation and detection
based on AA is reported to provide the highest sensitivity.
Detection limits about 5 pmol for hexose standards can be es-
timated [12,16]. The main advantage of AA is its suitabilityfor the quantitative determination of both amino- and neu-
tral monosaccharides without re- N -acetylation of the amino-
hexoses. Labelling with all other fluorescent tags requires,
that the hexosamines have to be N -acetylated prior to their
fluorescence labelling [16,18].
The present study describes the development of a sen-
sitive quantitative assay for determination of the neutral
monosaccharides (galactose, mannose and fucose) and the
amino-monosaccharides (glucosamine and galactosamine)
attached to a highly glycosylated therapeutic glycoprotein
for batch release in the biopharmaceutical industry. The use-
fulness of the CZE method with APTS-labelling [18,40]
and RP-HPLC method with AA derivatization [12,16] is
discussed, validation results of the RP-HPLC assay are
presented.
2. Experimental
2.1. Reagents and samples
2.1.1. Monosaccharides
D(+)-GlcN·HCl (>99%), D(+)-GalN·HCl (≥99%),
D(+)-Gal (
≥99.5%), D(+)-Glc (
≥99.5%), D(+)-Man
8/8/2019 Application of CZE and HPLC on Glucosamine
http://slidepdf.com/reader/full/application-of-cze-and-hplc-on-glucosamine 3/12
356 K. Raˇ caityte et al. / J. Chromatogr. A 1079 (2005) 354–365
(≥99.5%), D(+)-Fuc (>99%), GlcNac (>99%), GalNac
(>98%) were supplied by Fluka (Buchs, Switzerland).
D-ManN·HCl (>99%) was supplied by Sigma (Buchs,
Switzerland).
2.1.2. Capillary electrophoresis
High purity APTS was obtained from Beckman Coulter(Palo Alto, CA, USA). Sodium cyanoborohydrate solution
(1 mol/l) in THFwas provided by Aldrich (Cat. No.29,681-3,
Buchs, Switzerland). Citric acid,boric acid,sodium hydrogen
carbonate, 50% NaOH solution, 0.1 mol/l HCl and acetic an-
hydride were obtained in analytical reagent grade from Fluka
(Buchs, Switzerland). Water (≥18.0M cm, TOC <20 ppb)
was taken from a Milli-Q system (Millipore, Bedford, MA,
USA).
CZEseparation buffers were prepared as follows:240 mM
borate buffer pH 9.0: 1.48 g boric acid were dissolved in
approximately 80 ml water. The pH of the obtained solution
was adjusted to 9.0 using 50% sodium hydroxide solution.
The obtained solution was then transferred completelyinto a 100 ml volumetric flask and adjusted to 100 ml with
water. 120 mM borate buffer pH 10.2: 0.74 g boric acid
were dissolved in approximately 80 ml water. The pH of the
solution obtained was adjusted to 10.2 using 50% NaOH
solution. The solution obtained was transferred completely
into a 100 ml volumetric flask and adjusted to 100 ml
with water.
2.1.3. RP-HPLC
AA (≥98%), sodium acetate anhydrous (≥99%), sodium
cyanoborohydride (≥95%), 1-aminobutane (≥99.0%), boric
acid (≥99.8%) and trifluoroacetic acid (≥99.5%) were pur-chased from Fluka (Buchs, Switzerland). Methanol (LC
grade), THF (LC grade), phosphoric acid (85%) and acetic
acid (glacial) were supplied by Merck, Darmstadt, Germany.
Water (≥18.0 M cm, TOC <20 ppb) was taken from a Milli-
Q system (Millipore).
2.1.4. Glycoprotein
The glycoprotein under investigation had a concentra-
tion of approximately 1 mg/ml and was dissolved in PBS
(137 mM sodium chloride, 2.7 mM potassium chloride,
8.1 mM disodium hydrogen phosphate, 1.5 mM potassium
dihdydrogen phosphate). Protein concentration was deter-
mined prior to analysis by measuring absorption at 280 nm
and calculating content by using its specific absorption
coefficient.
2.2. Sample preparation
2.2.1. Sample preparation for CZE
2.2.1.1. Standard solutions. Sample preparation was per-
formed as described by Chen et al. [18] in an adapted manner.
Six single stock solutions of GalN, ManN, GlcN, Man, Glc,
Fucand Gal containing 5 mmol/l of the appropriate monosac-
charide in PBS were prepared. The stock solutions were di-
luted 1:10 using PBS. By mixing the appropriate volumes
of the diluted stock solutions three different monosaccharide
standard solutions 1–3 were obtained: CZE -standard solu-
tion 1: GalN (1.5 nmol), GlcN (15 nmol), Man (18 nmol),
Glc (8 nmol), Fuc (2 nmol), Gal (18 nmol) per vial. CZE -
standard solution 2: GalN (2.5 nmol), GlcN (35 nmol), Man
(12 nmol), Glc (8 nmol), Fuc (4 nmol), Gal (10 nmol) per vial.CZE -standard solution 3: GalN (0.5 nmol), GlcN (25 nmol),
Man (6 nmol), Glc (8 nmol), Fuc (6 nmol), Gal (26 nmol) per
vial. The monosaccharide CZE-standard solutions 1–3 were
mixed with TFA. The final concentration of TFA in each
solution was 2N. In a next step the monosaccharide CZE-
standard solutions 1–3 containing 2N TFA were heated for
5hat100 ◦C. Aliquots of the “hydrolyzed” standard solutions
were prepared containing 1/10 of the original volume each.
The aliquots were placed in fresh 500l tubes and evap-
orated to dryness using a vacuum centrifuge concentrator.
If not used immediately the dried samples were stored at
−18 ◦C.
2.2.1.2. Protein samples. Approximately 40g of the gly-
coprotein were placed in a screw top vial completed with
8 nmol Glc and hydrolyzed in 2N TFA for 5 h at 100◦C.
Aliquots of the hydrolyzed protein sample were prepared
containing 1/10 of the original volume each. Each aliquot
of the hydrolyzed protein sample was placed in fresh 500 l
tube and evaporated to dryness using a vacuum centrifuge
concentrator. If not used immediately the dried samples were
stored at −18 ◦C.
2.2.1.3. Reacetylation. The aliquots of the “hydrolyzed”CZE-standard solutions 1–3 as well as the aliquots of the
hydrolyzed protein samples were subject to derivatization
with or without reacetylation. If reacetylation was applied,
the samples were reconstituted in the 500l tube with 5l
of 25 mM sodium hydrogen carbonate, pH 9.5. In the fol-
lowing 2l acetic anhydride were added and the sample was
vortexed. Afterwards the samples were incubated at room
temperature for 30 min. Finally they were concentrated to
dryness using a vacuum centrifuge concentrator.
2.2.1.4. Derivatization. Fifty milligrams of APTS were
completely dissolved in 48l citric acid aqueous solution
(1 mol/l). The solution obtained was mixed in equal parts
with 1 mol/l sodium cyanoborohydrate solution in THF. This
mixture (derivatization reagent) was prepared immediately
before use. To the dried aliquots of the standards or pro-
tein samples either after or without reacetylation 5l of the
derivatization reagent were added. The mixture was vortexed
and incubated for 90 min at 55 ◦C in a water bath. The deriva-
tization reaction was stopped by the addition of 200l water.
Aliquots of the derivatized samples were stored at −18 ◦C.
For CZE analysis the samples were diluted 10fold with dis-
tilled water prior to analysis.
8/8/2019 Application of CZE and HPLC on Glucosamine
http://slidepdf.com/reader/full/application-of-cze-and-hplc-on-glucosamine 4/12
K. Raˇ caityte et al. / J. Chromatogr. A 1079 (2005) 354–365 357
2.2.2. Sample preparation for HPLC
Hydrolysis and derivatization were carried out as de-
scribed by Anumula [12,15].
2.2.2.1. Standard solutions. Stock solutions were prepared
as described in Section 2.2.1. By mixing the appropriate
volumes of stock solutions three HPLC-standard solutionswere obtained: HPLC -standard solution 1: GlcN (12.5 nmol),
GalN (0.625 nmol), Gal (7.5 nmol), Man (5.0 nmol) and
Fuc (1.25 nmol) per vial. HPLC -standard solution 2:
GlcN (25.0 nmol), GalN (1.25 nmol), Gal (15.0 nmol),
Man (10.0 nmol) and Fuc (3.75 nmol) per vial. HPLC -
standard solution 3: GlcN (37.5 nmol), GalN (2.5 nmol),
Gal (22.5nmol), Man (15.0 nmol) and Fuc (6.25 nmol) per
vial. Additionally two standard solutions with Glc as inter-
nal standard were prepared in PBS: HPLC -standard solu-
tion A: GlcN (22.5 nmol), GalN (15 nmol), Gal (22.5nmol),
Man (22.5 nmol), Fuc (15.0 nmol) and Glc (22.5 nmol) per
vial. HPLC -standard solution B: GlcN (28.0 nmol), GalN
(1.6 nmol), Gal(22.8 nmol),Man (14.0 nmol), Fuc(5.6 nmol)and Glc (10.5 nmol) per vial. All HPLC-standard solutions
were mixed with TFA (20% final TFA concentration) and
heated for 5 h at 100 ◦C. Afterwards they were dried in a
vacuum centrifuge evaporator without heat. The dried sam-
ples were reconstituted in 100l of 1% (w/v) sodium ac-
etate solution and derivatized with AA reagent as described
below.
2.2.2.2. Protein samples. Thirty to eighty micrograms of
glycoprotein were hydrolyzed in 20% trifluoroacetic acid
for 5h at 100 ◦C. In the following they were dried in a
vacuum centrifuge evaporator without heat. The dried sam-ples were reconstituted in 100l of 1% (w/v) sodium ac-
etate solution and derivatized with AA reagent as described
below.
2.2.2.3. Derivatization. A methanol–acetate–borate solu-
tion was prepared by dissolving 2.4 g sodium acetate and 2 g
boric acid in 100 ml methanol. AA reagent was prepared by
dissolving 30 mg AA and 20 mg sodium cyanoborohydride
in 1 ml of the methanol–acetate–borate solution. The recon-
stituted carbohydrate samples were mixed with 100l AA
reagent and heated for 1 h at 80 ◦C. Thereafter, the samples
were cooled to ambient temperature and diluted to 1 ml with
HPLC eluentA. In order to remove particlesfrom thesolution
and to protect the system in particular the column from con-
tamination and blockage, after dilution with eluent A sample
solutions were filtrated through a Cetrifugal Ultrafree®–MC
0.45m (Millipore) filter unit.
2.3. CZE analysis
CZE analysis was performed on a PACE 5010 or a PA 800
from Beckman Coulter (Palo Alto, CA, USA) equipped with
a LIF detector and Argon ion laser (excitation at 488 nm).
The fluorescence emission at 520 nm (band pass filter) was
collected. Fused silica capillaries (Polymicro, Phoenix, AZ,
USA), internal diameter 30m, total length 27 cm (20 cm
effective length to the detector) in case of the P/ACE 5010 or
31 cm (21 cm effective length to the detector) in case of the
PA 800 were used, separation buffer: 240 mM borate buffer
pH 9.5 or 120 mM borate buffer pH 10.2. A field strength
of 741 V/cm resulting in a current of 35A or 925 V/cm re-sulting in a current of 53 A with normal polarity (anode
at autosampler end) was applied, respectively. The capillary
temperaturewas 20 ◦C. Samples were kept in theautosampler
at 5 ◦C, hydrodynamic injection using a pressure of 3.45 kPa
(0.5 p.s.i.) for 5 s was used. A new capillary was constituted
by flushing it in sequence with 0.1 N HCl (5 min), water
(5 min), 1 M NaOH (10 min), water (5 min) and separation
buffer (10 min), applying a pressure of 138 kPa (20 p.s.i.).
Between the runs the capillary was flushed with separation
buffer for 5 min.
2.4. HPLC analysis
All LC separations were performed on a liquid chro-
matograph 1100 Series (Agilent Technologies, Waldbronn,
Germany) equipped with an integrated degasser, a quater-
nary pump, an autosampler, a cooling device and a fluo-
rescence detector. For detection the following wavelengths
were used: excitation 230 nm, emission 425 nm. Control of
the HPLC system and data evaluation was performed with an
Agilent ChemStation, version A.09.03 (Agilent Technolo-
gies, Waldbronn, Germany). The separation was carried out
at a temperature of 25 ◦C and the samples were stored in
the autosampler at 4 ◦C. Separation system I : C18 reversed
phase column: YMC-Pack ODS-A 150 mm × 4.6 mm I.D.,particle size 5m, pore size 12 nm (YMC Separation Tech-
nologies, YMC Europe, Schermbeck, Germany). Precolumn:
Phenomenex C18, 4mm × 3 mm I.D. (Phenomenex, Aschaf-
fenburg, Germany). Mobile phase: Eluent A contained 0.3%
1-aminobutane, 0.5% phosphoric acid and 1% THF in wa-
ter, eluent B consisted of equal parts of solvent A and ace-
tonitrile [15]. The following gradient program was used:
0–35 min 6% B isocratic, 35–55 min linear gradient 6–12%
B, 55–65 min 100% B isocratic. Re-equilibration of the col-
umn was performed with 100% A for 20 min. The flow
rate was 0.85 ml/min. Separation system II: C18 reversed-
phase column: Hypersil BDS150 mm×
4.6 mm,particle size
3m (Thermo Hypersil, Kleinostheim, Germany). Precol-
umn: Phenomenex C18, 4 m m × 3 mm ID (Phenomenex).
Mobile phase: sodium acetate–methanol; eluent A contained
50 mM sodium acetate buffer pH 4.1 in water, eluent B con-
tained 20% eluent A in methanol. The following gradient
program was used: 0–35 min 3% B isocratic, 35–80 min lin-
ear gradient 3–8% B, 80–85 min linear gradient 8–9% B,
85–90min 9% B isocratic, 90–95 min 100% B linear gradi-
ent. In order to ensure the reproducibility from run to run,
the column was washed then with 100% B for 20 min and
re-equilibrated with 3% B for 24 min. The flow rate was
0.7 ml/min.
8/8/2019 Application of CZE and HPLC on Glucosamine
http://slidepdf.com/reader/full/application-of-cze-and-hplc-on-glucosamine 5/12
358 K. Raˇ caityte et al. / J. Chromatogr. A 1079 (2005) 354–365
3. Results and discussion
3.1. Application of APTS-labelling and CZE for the
quantitative determination of monosaccharides released
from a highly glycosylated glycoprotein drug substance
Sample preparation and CZE were performed accordingto Chen et al. [18] in an adapted manner (see Section 2). Two
different CZE systems were tested, one used 240 mM borate
pH 9.0, the other 120 mM borate pH 10.2. Both separation
systems showed similar, reproducible performance for
the monosaccharide standards. Peak shape and number of
theoretical plates of the monosaccharides were better for the
240 mM system. The advantage of the 120 mM system was,
that ManNac was baseline separated from the other amino-
monosaccharides and APTS-labelling impurity peaks, not
relevant for the present assay development. Visualization of
the monosaccharides was performed after APTS labelling
by LIF detection, optimization of labelling conditions was
reported in detail in several publications [17,18,45]. A highyield of APTS-labeled carbohydrate standards was obtained
in a robust and reproducible manner. In the following the
monosaccharide standards were subjected to hydrolysis
prior to labelling with APTS. During acidic hydrolysis
N -acetylated-amino-monosaccharides are deacetylated
and the reactivity of the amino-monosaccharides with
APTS is strongly reduced [18], decreasing drastically their
detection sensitivity. Reacetylation of the sample with acetic
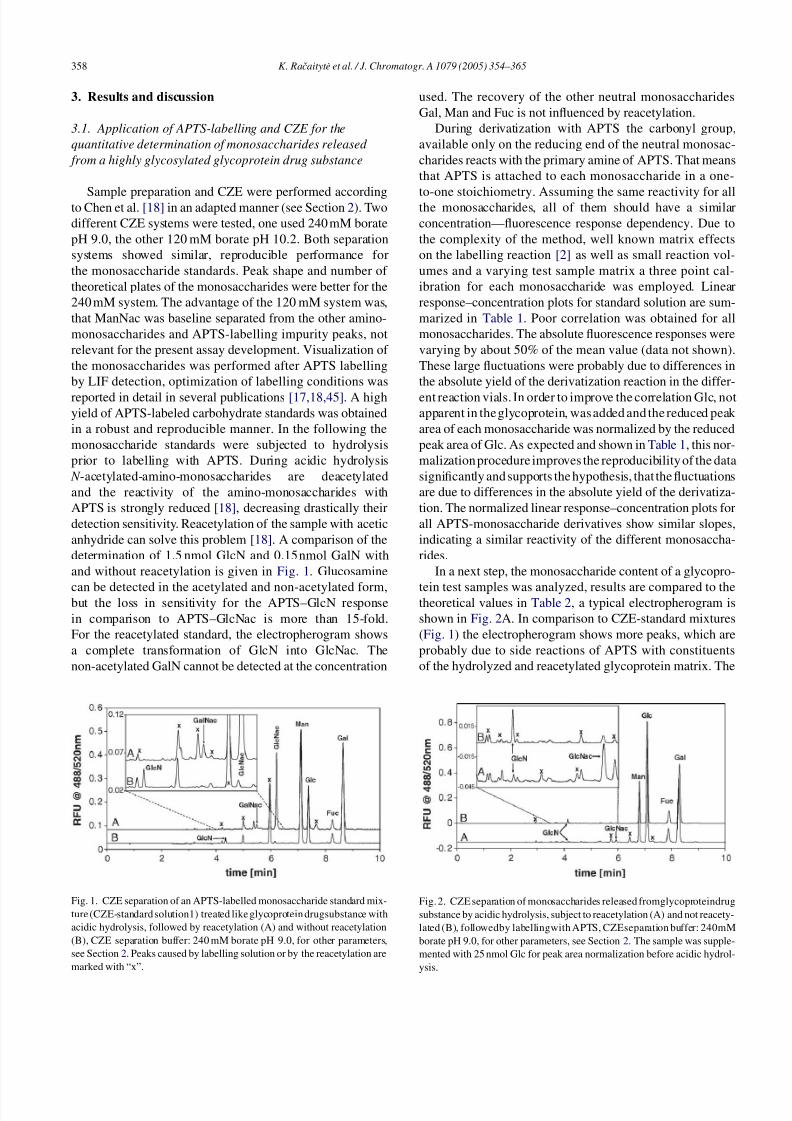
anhydride can solve this problem [18]. A comparison of the
determination of 1.5 nmol GlcN and 0.15nmol GalN with
and without reacetylation is given in Fig. 1. Glucosamine
can be detected in the acetylated and non-acetylated form,but the loss in sensitivity for the APTS–GlcN response
in comparison to APTS–GlcNac is more than 15-fold.
For the reacetylated standard, the electropherogram shows
a complete transformation of GlcN into GlcNac. The
non-acetylated GalN cannot be detected at the concentration
Fig. 1. CZE separation of an APTS-labelled monosaccharide standard mix-
ture (CZE-standard solution1) treated like glycoprotein drugsubstance with
acidic hydrolysis, followed by reacetylation (A) and without reacetylation
(B), CZE separation buffer: 240 mM borate pH 9.0, for other parameters,
see Section 2. Peaks caused by labelling solution or by the reacetylation are
marked with “x”.
used. The recovery of the other neutral monosaccharides
Gal, Man and Fuc is not influenced by reacetylation.
During derivatization with APTS the carbonyl group,
available only on the reducing end of the neutral monosac-
charides reacts with the primary amine of APTS. That means
that APTS is attached to each monosaccharide in a one-
to-one stoichiometry. Assuming the same reactivity for allthe monosaccharides, all of them should have a similar
concentration—fluorescence response dependency. Due to
the complexity of the method, well known matrix effects
on the labelling reaction [2] as well as small reaction vol-
umes and a varying test sample matrix a three point cal-
ibration for each monosaccharide was employed. Linear
response–concentration plots for standard solution are sum-
marized in Table 1. Poor correlation was obtained for all
monosaccharides. The absolute fluorescence responses were
varying by about 50% of the mean value (data not shown).
These large fluctuations were probably due to differences in
the absolute yield of the derivatization reaction in the differ-
ent reaction vials. In order to improve the correlation Glc, notapparent in the glycoprotein, was added and the reduced peak
area of each monosaccharide was normalized by the reduced
peak area of Glc. As expected and shown in Table 1, this nor-
malization procedure improves the reproducibility of the data
significantly and supports the hypothesis, that the fluctuations
are due to differences in the absolute yield of the derivatiza-
tion. The normalized linear response–concentration plots for
all APTS-monosaccharide derivatives show similar slopes,
indicating a similar reactivity of the different monosaccha-
rides.
In a next step, the monosaccharide content of a glycopro-
tein test samples was analyzed, results are compared to thetheoretical values in Table 2, a typical electropherogram is
shown in Fig. 2A. In comparison to CZE-standard mixtures
(Fig. 1) the electropherogram shows more peaks, which are
probably due to side reactions of APTS with constituents
of the hydrolyzed and reacetylated glycoprotein matrix. The
Fig. 2. CZE separation of monosaccharides released fromglycoproteindrug
substance by acidic hydrolysis, subject to reacetylation (A) and not reacety-
lated (B), followedby labellingwith APTS, CZEseparation buffer: 240mM
borate pH 9.0, for other parameters, see Section 2. The sample was supple-
mented with 25 nmol Glc for peak area normalization before acidic hydrol-
ysis.
8/8/2019 Application of CZE and HPLC on Glucosamine
http://slidepdf.com/reader/full/application-of-cze-and-hplc-on-glucosamine 6/12
K. Raˇ caityte et al. / J. Chromatogr. A 1079 (2005) 354–365 359
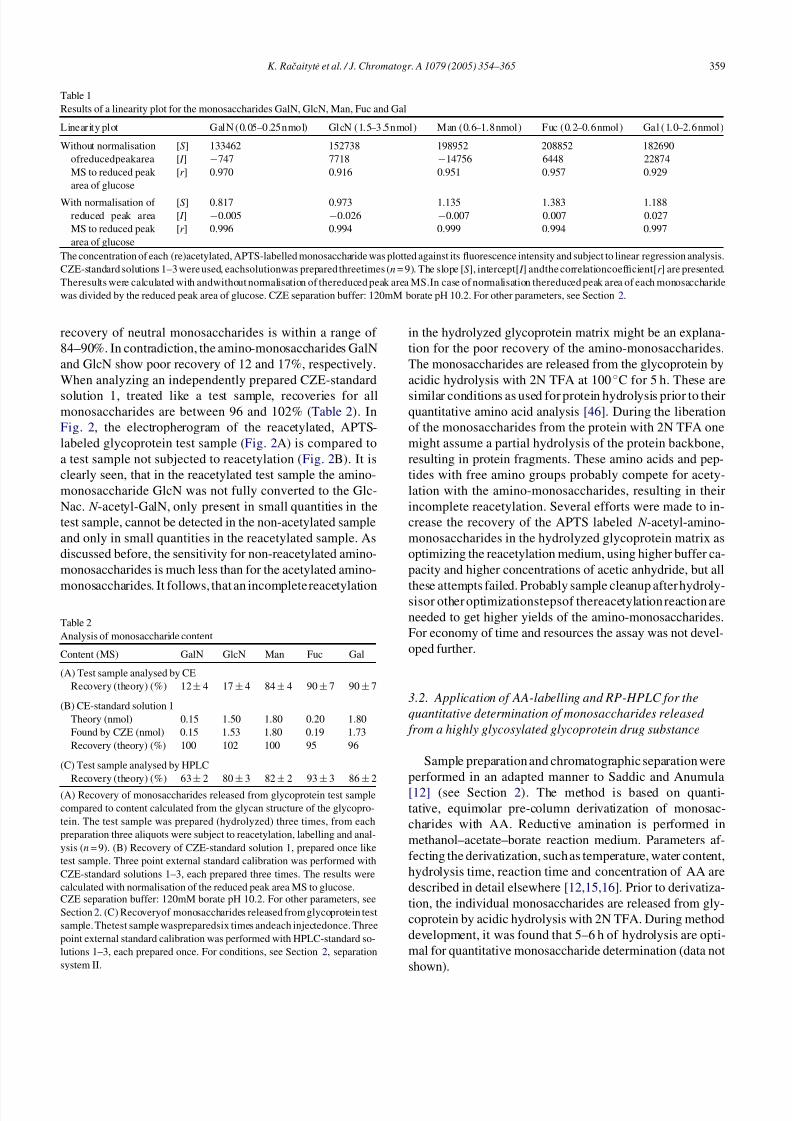
Table 1
Results of a linearity plot for the monosaccharides GalN, GlcN, Man, Fuc and Gal
Linearity plot GalN (0.05–0.25nmol) GlcN (1.5–3.5nmol) Man (0.6–1.8nmol) Fuc (0.2–0.6nmol) Gal (1.0–2.6nmol)
Without normalisation
ofreducedpeakarea
MS to reduced peak
area of glucose
[S] 133462 152738 198952 208852 182690
[ I ] −747 7718 −14756 6448 22874
[r ] 0.970 0.916 0.951 0.957 0.929
With normalisation of
reduced peak area
MS to reduced peak
area of glucose
[S] 0.817 0.973 1.135 1.383 1.188
[ I ] −0.005 −0.026 −0.007 0.007 0.027
[r ] 0.996 0.994 0.999 0.994 0.997
The concentration of each (re)acetylated, APTS-labelled monosaccharide was plotted against its fluorescence intensity and subject to linear regression analysis.
CZE-standard solutions 1–3 were used, eachsolutionwas prepared threetimes (n = 9). The slope [S], intercept[ I ] andthe correlationcoefficient[r ] are presented.
Theresults were calculated with andwithout normalisation of thereduced peak area MS.In case of normalisation thereduced peak area of each monosaccharide
was divided by the reduced peak area of glucose. CZE separation buffer: 120mM borate pH 10.2. For other parameters, see Section 2.
recovery of neutral monosaccharides is within a range of
84–90%. In contradiction, the amino-monosaccharides GalN
and GlcN show poor recovery of 12 and 17%, respectively.
When analyzing an independently prepared CZE-standard
solution 1, treated like a test sample, recoveries for allmonosaccharides are between 96 and 102% (Table 2). In
Fig. 2, the electropherogram of the reacetylated, APTS-
labeled glycoprotein test sample (Fig. 2A) is compared to
a test sample not subjected to reacetylation (Fig. 2B). It is
clearly seen, that in the reacetylated test sample the amino-
monosaccharide GlcN was not fully converted to the Glc-
Nac. N -acetyl-GalN, only present in small quantities in the
test sample, cannot be detected in the non-acetylated sample
and only in small quantities in the reacetylated sample. As
discussed before, the sensitivity for non-reacetylated amino-
monosaccharides is much less than for the acetylated amino-
monosaccharides. It follows, that an incomplete reacetylation
Table 2
Analysis of monosaccharide content
Content (MS) GalN GlcN Man Fuc Gal
(A) Test sample analysed by CE
Recovery (theory) (%) 12± 4 17 ± 4 84 ± 4 90 ± 7 90 ± 7
(B) CE-standard solution 1
Theory (nmol) 0.15 1.50 1.80 0.20 1.80
Found by CZE (nmol) 0.15 1.53 1.80 0.19 1.73
Recovery (theory) (%) 100 102 100 95 96
(C) Test sample analysed by HPLC
Recovery (theory) (%) 63±
2 80±
3 82±
2 93±
3 86±
2
(A) Recovery of monosaccharides released from glycoprotein test sample
compared to content calculated from the glycan structure of the glycopro-
tein. The test sample was prepared (hydrolyzed) three times, from each
preparation three aliquots were subject to reacetylation, labelling and anal-
ysis (n = 9). (B) Recovery of CZE-standard solution 1, prepared once like
test sample. Three point external standard calibration was performed with
CZE-standard solutions 1–3, each prepared three times. The results were
calculated with normalisation of the reduced peak area MS to glucose.CZE separation buffer: 120mM borate pH 10.2. For other parameters, see
Section 2. (C) Recoveryof monosaccharides released from glycoprotein test
sample. Thetest sample waspreparedsix times andeach injectedonce. Three
point external standard calibration was performed with HPLC-standard so-
lutions 1–3, each prepared once. For conditions, see Section 2, separation
system II.
in the hydrolyzed glycoprotein matrix might be an explana-
tion for the poor recovery of the amino-monosaccharides.
The monosaccharides are released from the glycoprotein by
acidic hydrolysis with 2N TFA at 100 ◦C for 5 h. These are
similar conditions as used for protein hydrolysis prior to theirquantitative amino acid analysis [46]. During the liberation
of the monosaccharides from the protein with 2N TFA one
might assume a partial hydrolysis of the protein backbone,
resulting in protein fragments. These amino acids and pep-
tides with free amino groups probably compete for acety-
lation with the amino-monosaccharides, resulting in their
incomplete reacetylation. Several efforts were made to in-
crease the recovery of the APTS labeled N -acetyl-amino-
monosaccharides in the hydrolyzed glycoprotein matrix as
optimizing the reacetylation medium, using higher buffer ca-
pacity and higher concentrations of acetic anhydride, but all
these attempts failed. Probably sample cleanup after hydroly-sisor other optimizationstepsof thereacetylation reaction are
needed to get higher yields of the amino-monosaccharides.
For economy of time and resources the assay was not devel-
oped further.
3.2. Application of AA-labelling and RP-HPLC for the
quantitative determination of monosaccharides released
from a highly glycosylated glycoprotein drug substance
Sample preparation and chromatographic separation were
performed in an adapted manner to Saddic and Anumula
[12] (see Section 2). The method is based on quanti-
tative, equimolar pre-column derivatization of monosac-
charides with AA. Reductive amination is performed in
methanol–acetate–borate reaction medium. Parameters af-
fecting the derivatization, such as temperature, water content,
hydrolysis time, reaction time and concentration of AA are
described in detail elsewhere [12,15,16]. Prior to derivatiza-
tion, the individual monosaccharides are released from gly-
coprotein by acidic hydrolysis with 2N TFA. During method
development, it was found that 5–6 h of hydrolysis are opti-
mal for quantitative monosaccharide determination (data not
shown).
8/8/2019 Application of CZE and HPLC on Glucosamine
http://slidepdf.com/reader/full/application-of-cze-and-hplc-on-glucosamine 7/12
360 K. Raˇ caityte et al. / J. Chromatogr. A 1079 (2005) 354–365
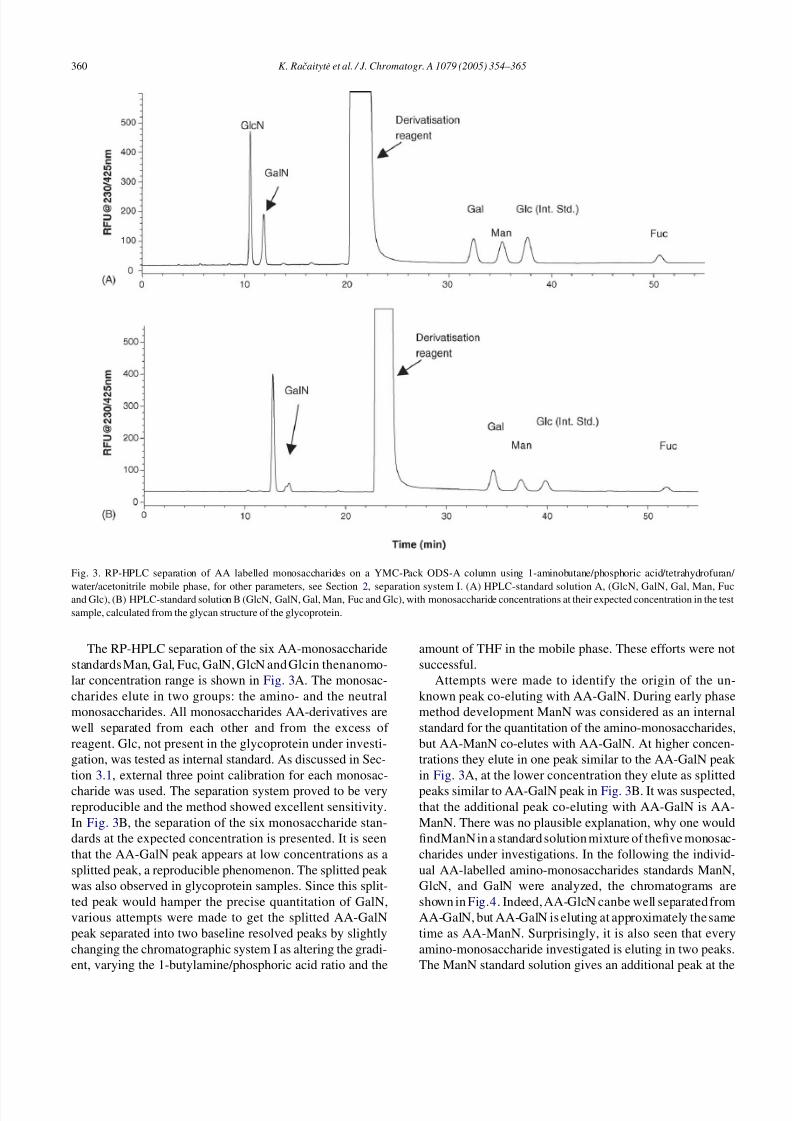
Fig. 3. RP-HPLC separation of AA labelled monosaccharides on a YMC-Pack ODS-A column using 1-aminobutane/phosphoric acid/tetrahydrofuran/
water/acetonitrile mobile phase, for other parameters, see Section 2, separation system I. (A) HPLC-standard solution A, (GlcN, GalN, Gal, Man, Fucand Glc), (B) HPLC-standard solution B (GlcN, GalN, Gal, Man, Fuc and Glc), with monosaccharide concentrations at their expected concentration in the test
sample, calculated from the glycan structure of the glycoprotein.
The RP-HPLC separation of the six AA-monosaccharide
standards Man, Gal, Fuc, GalN, GlcN and Glcin thenanomo-
lar concentration range is shown in Fig. 3A. The monosac-
charides elute in two groups: the amino- and the neutral
monosaccharides. All monosaccharides AA-derivatives are
well separated from each other and from the excess of
reagent. Glc, not present in the glycoprotein under investi-
gation, was tested as internal standard. As discussed in Sec-
tion 3.1, external three point calibration for each monosac-
charide was used. The separation system proved to be veryreproducible and the method showed excellent sensitivity.
In Fig. 3B, the separation of the six monosaccharide stan-
dards at the expected concentration is presented. It is seen
that the AA-GalN peak appears at low concentrations as a
splitted peak, a reproducible phenomenon. The splitted peak
was also observed in glycoprotein samples. Since this split-
ted peak would hamper the precise quantitation of GalN,
various attempts were made to get the splitted AA-GalN
peak separated into two baseline resolved peaks by slightly
changing the chromatographic system I as altering the gradi-
ent, varying the 1-butylamine/phosphoric acid ratio and the
amount of THF in the mobile phase. These efforts were not
successful.
Attempts were made to identify the origin of the un-
known peak co-eluting with AA-GalN. During early phase
method development ManN was considered as an internal
standard for the quantitation of the amino-monosaccharides,
but AA-ManN co-elutes with AA-GalN. At higher concen-
trations they elute in one peak similar to the AA-GalN peak
in Fig. 3A, at the lower concentration they elute as splitted
peaks similar to AA-GalN peak in Fig. 3B. It was suspected,that the additional peak co-eluting with AA-GalN is AA-
ManN. There was no plausible explanation, why one would
findManN in a standard solution mixture of thefive monosac-
charides under investigations. In the following the individ-
ual AA-labelled amino-monosaccharides standards ManN,
GlcN, and GalN were analyzed, the chromatograms are
shown in Fig.4. Indeed, AA-GlcN canbe well separated from
AA-GalN, but AA-GalN is eluting at approximately the same
time as AA-ManN. Surprisingly, it is also seen that every
amino-monosaccharide investigated is eluting in two peaks.
The ManN standard solution gives an additional peak at the
8/8/2019 Application of CZE and HPLC on Glucosamine
http://slidepdf.com/reader/full/application-of-cze-and-hplc-on-glucosamine 8/12
K. Raˇ caityte et al. / J. Chromatogr. A 1079 (2005) 354–365 361
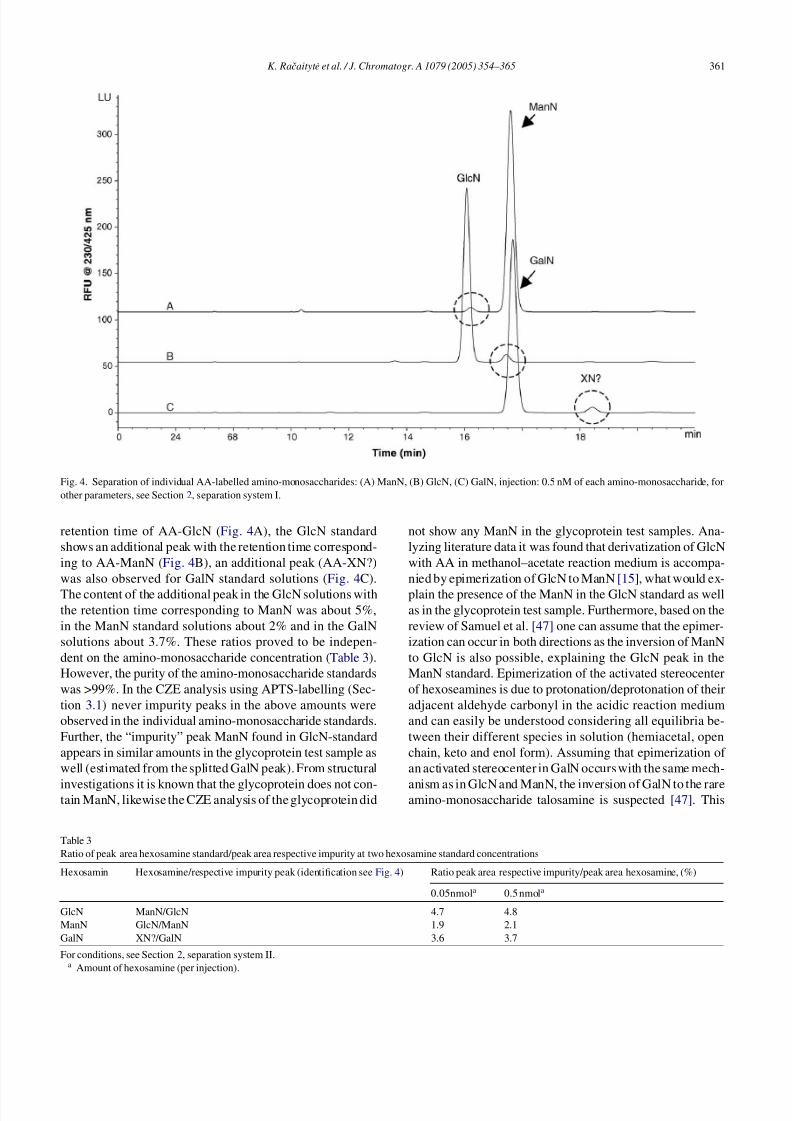
Fig. 4. Separation of individual AA-labelled amino-monosaccharides: (A) ManN, (B) GlcN, (C) GalN, injection: 0.5 nM of each amino-monosaccharide, for
other parameters, see Section 2, separation system I.
retention time of AA-GlcN (Fig. 4A), the GlcN standard
shows an additional peak with the retention time correspond-
ing to AA-ManN (Fig. 4B), an additional peak (AA-XN?)
was also observed for GalN standard solutions (Fig. 4C).
The content of the additional peak in the GlcN solutions withthe retention time corresponding to ManN was about 5%,
in the ManN standard solutions about 2% and in the GalN
solutions about 3.7%. These ratios proved to be indepen-
dent on the amino-monosaccharide concentration (Table 3).
However, the purity of the amino-monosaccharide standards
was >99%. In the CZE analysis using APTS-labelling (Sec-
tion 3.1) never impurity peaks in the above amounts were
observed in the individual amino-monosaccharide standards.
Further, the “impurity” peak ManN found in GlcN-standard
appears in similar amounts in the glycoprotein test sample as
well (estimated from the splitted GalN peak). From structural
investigations it is known that the glycoprotein does not con-tain ManN, likewise the CZE analysis of the glycoprotein did
not show any ManN in the glycoprotein test samples. Ana-
lyzing literature data it was found that derivatization of GlcN
with AA in methanol–acetate reaction medium is accompa-
nied by epimerization of GlcN to ManN [15], what would ex-
plain the presence of the ManN in the GlcN standard as wellas in the glycoprotein test sample. Furthermore, based on the
review of Samuel et al. [47] one can assume that the epimer-
ization can occur in both directions as the inversion of ManN
to GlcN is also possible, explaining the GlcN peak in the
ManN standard. Epimerization of the activated stereocenter
of hexoseamines is due to protonation/deprotonation of their
adjacent aldehyde carbonyl in the acidic reaction medium
and can easily be understood considering all equilibria be-
tween their different species in solution (hemiacetal, open
chain, keto and enol form). Assuming that epimerization of
an activated stereocenter in GalN occurs with the same mech-
anism as in GlcN and ManN, the inversion of GalN to the rareamino-monosaccharide talosamine is suspected [47]. This
Table 3
Ratio of peak area hexosamine standard/peak area respective impurity at two hexosamine standard concentrations
Hexosamin Hexosamine/respective impurity peak (identification see Fig. 4) Ratio peak area respective impurity/peak area hexosamine, (%)
0.05nmola 0.5 nmola
GlcN ManN/GlcN 4.7 4.8
ManN GlcN/ManN 1.9 2.1
GalN XN?/GalN 3.6 3.7
For conditions, see Section 2, separation system II.a Amount of hexosamine (per injection).
8/8/2019 Application of CZE and HPLC on Glucosamine
http://slidepdf.com/reader/full/application-of-cze-and-hplc-on-glucosamine 9/12
362 K. Raˇ caityte et al. / J. Chromatogr. A 1079 (2005) 354–365
hypothesis was not proven, since talosamine is not commer-
cially available. Only literature for its synthesis via a novel
dihydroxylation reaction was found [48]. As mentioned be-
fore, the ratios of AA-XN?/AA-GalN, AA-ManN/AA-GlcN
and AA-GlcN/AA-ManN are constant at given derivatization
conditions and independent on the hexosamine concentra-
tion (Table 3). It follows, that the epimerization itself doesnot disturb the quantitation of the individual monosaccha-
rides by external calibration. Since GalN is one of the amino-
monosaccharides to be determined in the glycoprotein, and
AA-GalN is co-elutingwith the AA-GlcN epimer AA-ManN,
the separation needed to be optimized in order to assure pre-
cise quantitation of GalN.
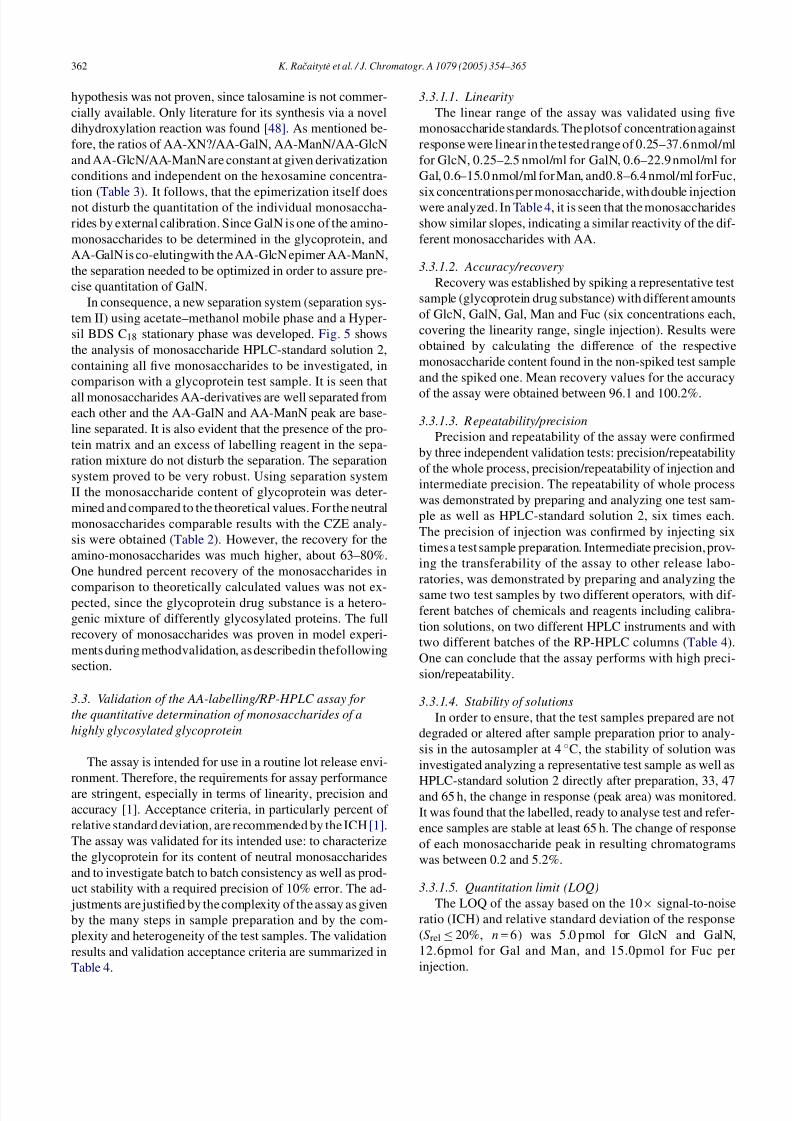
In consequence, a new separation system (separation sys-
tem II) using acetate–methanol mobile phase and a Hyper-
sil BDS C18 stationary phase was developed. Fig. 5 shows
the analysis of monosaccharide HPLC-standard solution 2,
containing all five monosaccharides to be investigated, in
comparison with a glycoprotein test sample. It is seen that
all monosaccharides AA-derivatives are well separated fromeach other and the AA-GalN and AA-ManN peak are base-
line separated. It is also evident that the presence of the pro-
tein matrix and an excess of labelling reagent in the sepa-
ration mixture do not disturb the separation. The separation
system proved to be very robust. Using separation system
II the monosaccharide content of glycoprotein was deter-
mined and compared to the theoretical values. For the neutral
monosaccharides comparable results with the CZE analy-
sis were obtained (Table 2). However, the recovery for the
amino-monosaccharides was much higher, about 63–80%.
One hundred percent recovery of the monosaccharides in
comparison to theoretically calculated values was not ex-pected, since the glycoprotein drug substance is a hetero-
genic mixture of differently glycosylated proteins. The full
recovery of monosaccharides was proven in model experi-
ments during methodvalidation, as describedin thefollowing
section.
3.3. Validation of the AA-labelling/RP-HPLC assay for
the quantitative determination of monosaccharides of a
highly glycosylated glycoprotein
The assay is intended for use in a routine lot release envi-
ronment. Therefore, the requirements for assay performance
are stringent, especially in terms of linearity, precision and
accuracy [1]. Acceptance criteria, in particularly percent of
relative standard deviation, are recommended by the ICH [1].
The assay was validated for its intended use: to characterize
the glycoprotein for its content of neutral monosaccharides
and to investigate batch to batch consistency as well as prod-
uct stability with a required precision of 10% error. The ad-
justments are justified by the complexity of the assay as given
by the many steps in sample preparation and by the com-
plexity and heterogeneity of the test samples. The validation
results and validation acceptance criteria are summarized in
Table 4.
3.3.1.1. Linearity
The linear range of the assay was validated using five
monosaccharide standards. The plotsof concentration against
response were linear in the tested range of 0.25–37.6 nmol/ml
for GlcN, 0.25–2.5 nmol/ml for GalN, 0.6–22.9 nmol/ml for
Gal, 0.6–15.0 nmol/ml for Man, and0.8–6.4 nmol/ml forFuc,
six concentrations per monosaccharide, with double injectionwere analyzed. In Table 4, it is seen that the monosaccharides
show similar slopes, indicating a similar reactivity of the dif-
ferent monosaccharides with AA.
3.3.1.2. Accuracy/recovery
Recovery was established by spiking a representative test
sample (glycoprotein drug substance) with different amounts
of GlcN, GalN, Gal, Man and Fuc (six concentrations each,
covering the linearity range, single injection). Results were
obtained by calculating the difference of the respective
monosaccharide content found in the non-spiked test sample
and the spiked one. Mean recovery values for the accuracy
of the assay were obtained between 96.1 and 100.2%.
3.3.1.3. Repeatability/precision
Precision and repeatability of the assay were confirmed
by three independent validation tests: precision/repeatability
of the whole process, precision/repeatability of injection and
intermediate precision. The repeatability of whole process
was demonstrated by preparing and analyzing one test sam-
ple as well as HPLC-standard solution 2, six times each.
The precision of injection was confirmed by injecting six
times a test sample preparation. Intermediate precision, prov-
ing the transferability of the assay to other release labo-
ratories, was demonstrated by preparing and analyzing the
same two test samples by two different operators, with dif-
ferent batches of chemicals and reagents including calibra-
tion solutions, on two different HPLC instruments and with
two different batches of the RP-HPLC columns (Table 4).
One can conclude that the assay performs with high preci-
sion/repeatability.
3.3.1.4. Stability of solutions
In order to ensure, that the test samples prepared are not
degraded or altered after sample preparation prior to analy-
sis in the autosampler at 4 ◦C, the stability of solution was
investigated analyzing a representative test sample as well as
HPLC-standard solution 2 directly after preparation, 33, 47and 65 h, the change in response (peak area) was monitored.
It was found that the labelled, ready to analyse test and refer-
ence samples are stable at least 65 h. The change of response
of each monosaccharide peak in resulting chromatograms
was between 0.2 and 5.2%.
3.3.1.5. Quantitation limit (LOQ)
The LOQ of the assay based on the 10× signal-to-noise
ratio (ICH) and relative standard deviation of the response
(Srel ≤ 20%, n = 6) was 5.0 pmol for GlcN and GalN,
12.6pmol for Gal and Man, and 15.0pmol for Fuc per
injection.

8/8/2019 Application of CZE and HPLC on Glucosamine
http://slidepdf.com/reader/full/application-of-cze-and-hplc-on-glucosamine 10/12
K. Raˇ caityte et al. / J. Chromatogr. A 1079 (2005) 354–365 363
Fig. 5. RP-HPLC separation of AA-labelled monosaccharides on a Hypersil® BDS C18 column using 50 mM sodium acetate pH 4.1/methanol mobile phase,
for other parameters, see Section 2, separation system II. (A) glycoprotein test sample; (B) HPLC-standard solution 2 (GlcN, GalN, Gal, Man, Fuc); (C)
PBS-buffer.
8/8/2019 Application of CZE and HPLC on Glucosamine
http://slidepdf.com/reader/full/application-of-cze-and-hplc-on-glucosamine 11/12
364 K. Raˇ caityte et al. / J. Chromatogr. A 1079 (2005) 354–365
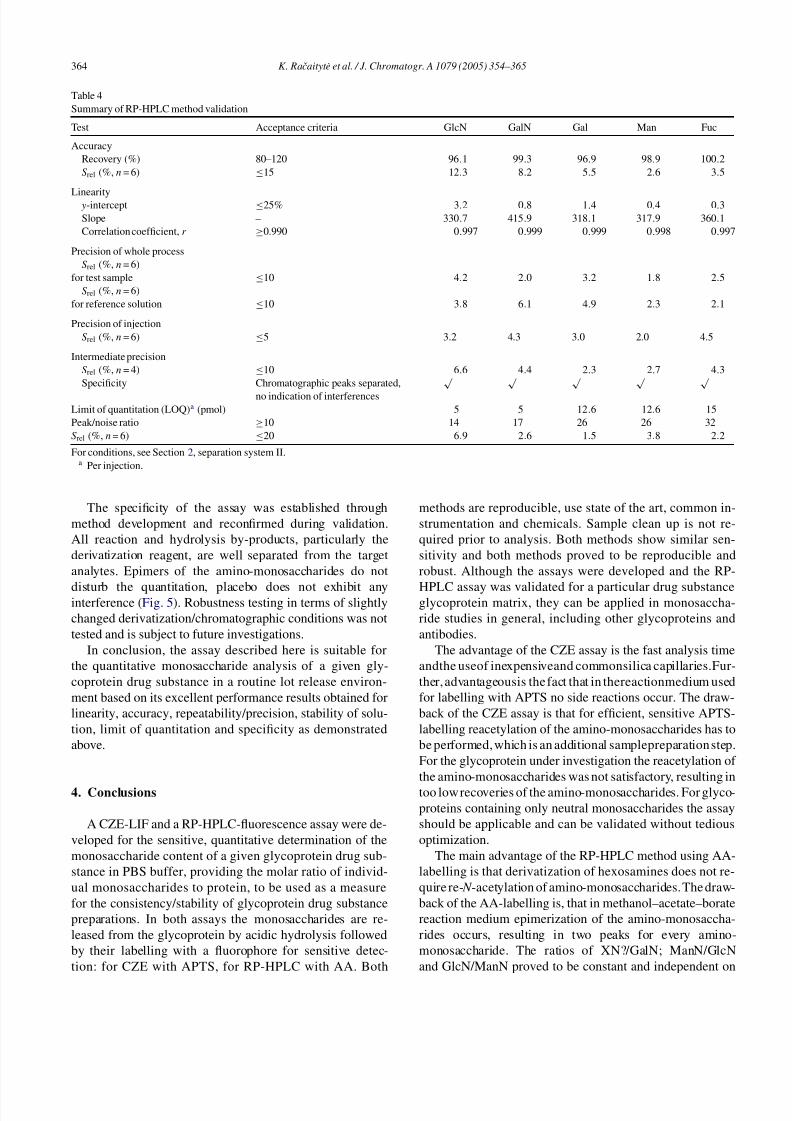
Table 4
Summary of RP-HPLC method validation
Test Acceptance criteria GlcN GalN Gal Man Fuc
Accuracy
Recovery (%) 80–120 96.1 99.3 96.9 98.9 100.2
Srel (%, n = 6) ≤15 12.3 8.2 5.5 2.6 3.5
Linearity y-intercept ≤25% 3.2 0.8 1.4 0.4 0.3
Slope – 330.7 415.9 318.1 317.9 360.1
Correlation coefficient, r ≥0.990 0.997 0.999 0.999 0.998 0.997
Precision of whole process
Srel (%, n = 6)
for test sample ≤10 4.2 2.0 3.2 1.8 2.5
Srel (%, n = 6)
for reference solution ≤10 3.8 6.1 4.9 2.3 2.1
Precision of injection
Srel (%, n = 6) ≤5 3.2 4.3 3.0 2.0 4.5
Intermediate precision
Srel (%, n = 4) ≤10 6.6 4.4 2.3 2.7 4.3
Specificity Chromatographic peaks separated,
no indication of interferences
√ √ √ √ √
Limit of quantitation (LOQ)a (pmol) 5 5 12.6 12.6 15
Peak/noise ratio ≥10 14 17 26 26 32
Srel (%, n = 6) ≤20 6.9 2.6 1.5 3.8 2.2
For conditions, see Section 2, separation system II.a Per injection.
The specificity of the assay was established through
method development and reconfirmed during validation.
All reaction and hydrolysis by-products, particularly the
derivatization reagent, are well separated from the target
analytes. Epimers of the amino-monosaccharides do not
disturb the quantitation, placebo does not exhibit anyinterference (Fig. 5). Robustness testing in terms of slightly
changed derivatization/chromatographic conditions was not
tested and is subject to future investigations.
In conclusion, the assay described here is suitable for
the quantitative monosaccharide analysis of a given gly-
coprotein drug substance in a routine lot release environ-
ment based on its excellent performance results obtained for
linearity, accuracy, repeatability/precision, stability of solu-
tion, limit of quantitation and specificity as demonstrated
above.
4. Conclusions
A CZE-LIF and a RP-HPLC-fluorescence assay were de-
veloped for the sensitive, quantitative determination of the
monosaccharide content of a given glycoprotein drug sub-
stance in PBS buffer, providing the molar ratio of individ-
ual monosaccharides to protein, to be used as a measure
for the consistency/stability of glycoprotein drug substance
preparations. In both assays the monosaccharides are re-
leased from the glycoprotein by acidic hydrolysis followed
by their labelling with a fluorophore for sensitive detec-
tion: for CZE with APTS, for RP-HPLC with AA. Both
methods are reproducible, use state of the art, common in-
strumentation and chemicals. Sample clean up is not re-
quired prior to analysis. Both methods show similar sen-
sitivity and both methods proved to be reproducible and
robust. Although the assays were developed and the RP-
HPLC assay was validated for a particular drug substanceglycoprotein matrix, they can be applied in monosaccha-
ride studies in general, including other glycoproteins and
antibodies.
The advantage of the CZE assay is the fast analysis time
andthe useof inexpensiveand commonsilica capillaries.Fur-
ther, advantageousis the fact that in thereactionmedium used
for labelling with APTS no side reactions occur. The draw-
back of the CZE assay is that for efficient, sensitive APTS-
labelling reacetylation of the amino-monosaccharides has to
be performed, which is an additional samplepreparation step.
For the glycoprotein under investigation the reacetylation of
the amino-monosaccharides was not satisfactory, resulting in
too low recoveries of the amino-monosaccharides. For glyco-
proteins containing only neutral monosaccharides the assay
should be applicable and can be validated without tedious
optimization.
The main advantage of the RP-HPLC method using AA-
labelling is that derivatization of hexosamines does not re-
quire re- N -acetylation of amino-monosaccharides. The draw-
back of the AA-labelling is, that in methanol–acetate–borate
reaction medium epimerization of the amino-monosaccha-
rides occurs, resulting in two peaks for every amino-
monosaccharide. The ratios of XN?/GalN; ManN/GlcN
and GlcN/ManN proved to be constant and independent on
8/8/2019 Application of CZE and HPLC on Glucosamine
http://slidepdf.com/reader/full/application-of-cze-and-hplc-on-glucosamine 12/12
K. Raˇ caityte et al. / J. Chromatogr. A 1079 (2005) 354–365 365
the hexosamine concentration. In the developed chromato-
graphic system the epimers of the amino-monosaccharides
are well separated from the target analytes and do not disturb
the quantitation of the amino-monosaccharides.
References
[1] International Conference on Harmonization, Guideline on the vali-
dation of analytical procedures: methodology, Fed. Reg. 62 (1997)
27464.
[2] J.R. Ramussen, M. Bergh, S. Hirani, Patent WO8907641 (1989).
[3] G. Hunt, W. Nashabeh, Anal. Chem. 71 (1999) 2390.
[4] S. Ma, W. Nashabeh, Anal. Chem. 71 (1999) 5185.
[5] K. Kanazawa, K. Ashida, M. Itoh, H. Nagai, H. Sasaki, M. Fukuda,
Biol. Pharm. Bull. 22 (4) (1999) 339.
[6] T. Toyoda, T. Itai, T. Arakawa, K.H. Aoki, H. Yamaguchi, J.
Biochem. 128 (2000) 731.
[7] N.E. Robinson, A.B. Robinson, PNAS 98 (22) (2001) 12409.
[8] N. Viseux, X. Hronowski, J. Delaney, B. Domon, Anal. Chem. 73
(2001) 4755.
[9] S. Elliott, T. Lorenzini, S. Asher, K. Aoki, J. Egrie, Nature Biotech-
nol. 21 (2003) 414.
[10] A. Braun, R. Gassman, K. Kraus, G. Lorenzi, u. Weigel, Pharm.
Acta Helv. 71 (1996) 447.
[11] V.E. Bichsel, V. Curcio, R. Gassman, H. Otto, Pharm. Acta Helv.
71 (1996) 439.
[12] G.N. Saddic, M.B. Ebert, S.T. Dhume, K.R. Anumula, Methods Mol.
Biol. 194 (2002) 23.
[13] T. Patel, R. Parekh, B. Moellering, C. Prior, Biochem. J. 285 (1992)
839.
[14] P. Hermentin, in: F. Lottspeich, H. Zorbas (Eds.), Bioanalytik, Spek-
trum Verlag, Heidelberg, Berlin, 1998, pp. 485–536.
[15] K.R. Anumula, Anal. Biochem. 220 (1994) 275.
[16] K.R. Anumula, Anal. Biochem. 283 (2000) 17.
[17] A. Guttman, J. Chromatogr. A 763 (1997) 271.
[18] F.A. Chen, T.S. Dobashi, R.A. Evangelista, Glycobiology 8 (1998)
1045.
[19] S. Kim, S. Kim II, K.-S. Ha, S.-H. Leem, Exp. Molec. Med. 32
(2000) 141.
[20] S.C. Churms, J. Chromatogr. 500 (1990) 555.
[21] M.F. Chaplin, J.F. Kennedy (Eds.), Carbohydrate Analysis: A Prac-
tical Approach, IRL Press, Oxford, 1986, pp. 43–51.
[22] C. Chiesa, R.A. O’Neil, C.G. Horvath, P.J. Oefner, in: P.G. Righetti
(Ed.), Capillary Electrophoresis in Analytical Biotechnology, CRC
Press, Boca Raton, FL, 1996.
[23] S. Hase, J. Chromatogr. Lib. 55 (1995) 555.
[24] A. Fox, S.L. Morgan, J. Gilbert, in: C.J. Biermann, G.D. McGinnis
(Eds.), Analysis of Carbohydrates by GLC and MS, CRC Press,
Boca Raton, FL, 1989.
[25] M.R. Hardy, R.R. Townsend, Y.C. Lee, Anal. Biochem. 170 (1988)
54.
[26] R.R. Townsend, A. Manzi, R.K. Merkle, M.F. Rhode, M. Spellman,
A. Smith, S.A. Carr, ABRF News 8 (1997) 14.
[27] T. Soga, D. Heiger, Anal. Biochem. 261 (1998) 73.
[28] F.N. Lamari, R. Kuhn, N.K. Karamanos, J. Chromatogr. B 793
(2003) 15.
[29] S. Honda, T. Ueno, K. Kakehi, J. Chromatogr. 608 (1992)
289.
[30] S. Honda, S. Suzuki, A. Nitta, S. Iwase, K. Kakehi, Methods, Com-
pan. Methods Enzymol. 4 (1992) 233.
[31] S. Suzuki, R. Tanaka, K. Takada, N. Inoue, Y. Yashima, A. Honda,
S. Honda, J. Chromatogr. A 910 (2001) 319.
[32] P. Jackson, Biochem. J. 270 (1990) 705.
[33] C. Chiesa, C.G. Horvath, J. Chromatogr. 645 (1993) 337.
[34] C. Chiesa, R.A. O’Neil, Electrophoresis 15 (1994) 1132.[35] M. Larsson, R. Sundberg, S. Folestad, J. Chromatogr. A 934 (2001)
75.
[36] F.A. Chen, R.A. Evangelista, Anal. Biochem. 230 (1995) 273.
[37] S. Hase, S. Hara, Y. Matsushima, J. Biochem. 85 (1979) 217.
[38] D.K. Toomre, A. Varki, Glycobiology 4 (1994) 653.
[39] H. Schweiger, P. Oefner, C. Huber, E. Gill, G. Bonn, Electrophoresis
15 (1994) 941.
[40] R.A. Evangelista, M.-S. Liu, F.A. Chen, Anal. Chem. 67 (1995)
2239.
[41] C. Prakash, I.K. Vijah, Anal. Biochem. 128 (1983) 41.
[42] P. Jackson, Anal. Biochem. 216 (1994) 243.
[43] G.B. Harland, G. Okafo, P. Matejtschuk, I.C. Sellick, G.E. Chapman,
P. Camilleri, Electrophoresis 17 (1996) 406.
[44] Cs. Horvath, W. Melander, I. Molnar, J. Chromatogr. 125 (1) (1976)
129.[45] A. Guttman, F.A. Chen, R.A. Evangelista, N. Cooke, Anal. Biochem.
233 (1996) 234.
[46] M. Fountoulakis, H.-W. Lahm, J. Chromatogr. A 826 (1998)
109.
[47] J. Samuel, M.E. Tanner, Nat. Prod. Rep. 19 (2002) 261.
[48] T.J. Donohue, K. Blades, M. Helliwell, Chem. Abstr. 131 (1999)
299623a.