application of csm-ceres-maize for evaluation of planting ... · performance under rain-fed...
TRANSCRIPT

Application of CSM-CERES-Maize for
evaluation of planting date under rain-
fed conditions in the Northern Guinea
Savanna agro-ecology of Nigeria
K.O.OLUWASEMIRE and S.O. OYATOKUN
Agronomy Department, University of Ibadan, Nigeria.

Introduction
AGRICULTURE IS AN INDUSTRY THAT IS MORE DEPENDENT ON WEATHER THAN OTHER SYSTEMS FOR HARNESSING BIOLOGICAL RESOURCES SUCH AS CROP, LIVESTOCK, FORESTRY AND FISHING
CLIMATE HAS A MAJOR IMPACT ON SOILS, VEGETATION, WATER RESOURCES AND LAND USE
ISSUES REGARDING POPULATION INCREASE, DEGRADATION OF NATURAL RESOURCES AND SUSTAINABLE DEVELOPMENT CALLS FOR GREATER EFFORTS TO DESIGN FUTURE STRATEGIES OF LAND USE BASED ON SOUND UNDERSTANDING OF THE RELATIONSHIP BETWEEN CLIMATE AND AGRICULTURE
THEREFORE, IMPROVED ADAPTATION OF FOOD PRODUCTION, PARTICULARLY TO CURRENT CLIMATE VARIABILITY AND OBSERVED CLIMATE CHANGE HOLD THE KEY TO IMPROVING FOOD SECURITY FOR THE GLOBAL POPULATION.

The high level of reliance of climate sensitive activities in
agriculture such as rain-fed cultivation, limited economic
and institutional capacity to cope with and adapt to climatic
variability tend to make the Nigerian agricultural
environment particularly vulnerable to climate change.
Planting opportunities are limited by the amount and
timing of rainfall, the decision on when to plant would affect
the choice of crop cultivar and yield expectation.
Rainfall in West Africa and particularly in Nigeria is
strongly dependent on the southwest monsoon flow, which
has the unique characteristics of high seasonal, monthly and
daily variability in its moisture content and vertical depth
(Omotosho et al., 2000).

Introduction (Cont’d)
NIGERIA HAS FOUR AGRO ECOLOGICAL ZONES WITH SIXTEEN PRIMARY
CROPPING SYSTEMS IN THIRTEEN HIGH PRODUCTION STATES
SAHEL AND SUDAN
Sorghum & Millet and Sorghum or Millet
& cowpea are the primary cropping
systems in the high production states of
Kano, Katsina, and Zamfara.
GUINEA SAVANNA
Sorghum & Groundnut or Cowpea, Maize
(only) and Groundnut (only) are the primary
cropping systems in the high production
states of Niger, Kaduna, and Plateau.
DERIVED SAVANNA
Maize (only), Maize & Yam, Cowpea or Sweet
Potato and Groundnut (only) are the primary
cropping systems in the high production
states of Oyo, Nasarawa, Kogi, Benue, and
Taraba.
HUMID FOREST
Plantain (only) and Maize & Yam, Sweet
Potato or Cassava are the primary cropping
systems in the high production states of
Cross River, Ondo, and Edo

Introduction (Cont’d)
NIGERIA NATIONAL PRODUCTION IS 9-10 MILLION TONS, GROWN ON OVER 5 MILLION HECTARES ACROSS THE ENTIRE COUNTRY
Maize Production Zones Production Statistics for Top Food Crops in Nigeria
• Maize is grown in all states, however it’s only the key crop in a
few states
• Plays larger role in Guinea Savanna & Derived Savanna zones
• Where maize is important, it is often mono-cropped and
farmers are commercially oriented
• Less than 10% maize is irrigated

The objective of this study is to evaluate the
effects of planting dates and variability on maize
performance under rain-fed conditions in Zaria
area (northern Guinea savanna, Nigeria, and
to assess CERES-Maize model performance
by comparing the measured and simulated
maize phenology for improved growth,
development and yields
as well as forecasting grain yield of maize
production system

Materials and Methods
2.1 Site Description The data from a field study conducted during the 2006 rainy season at
the experimental farm of the Institute for Agricultural Research (IAR), Ahmadu Bello University (ABU), Samaru-Zaria, Nigeria (11° 09’N, 07° 38’ E;
695 m above sea level) were considered.
Weather data were recorded by an Automatic Weather Station-AWS
(Minimet, Eijkelkamp, The Netherlands) about 20m from the experimental
field.
Data provided on measured variables include air temperature, relative
humidity, wind speed and direction, net radiation and rainfall. These data
were averaged and stored at two hours interval. The mean annual rainfall
is 1016 220 mm (1928-2002) with a coefficient of variability of 18 percent
(Oluwasemire and Alabi, 2004). The rainy season starts by mid May and
ends before mid October. Mean monthly temperature varies within 22-36°C with a maximum and minimum of 38°C and 13°C, respectively.
The soil temperature and moisture regimes are Isohyperthermic and
Typic Tropustic (Uyovbisere et al., 1984).

Experimental Procedures The predicted onset window (dates) of growing season for Zaria from
NIMET range from 13th – 23rd May 2006 at a probability level of 70%.
Four planting dates were adopted viz: planting date within one week
before the predicted window, (PD1); planting date early within the
predicted window, (PD2); planting date late within the window, (PD3) and
planting date within the week after the window, (PD4). These
corresponded to May 12, 2006 (PD1), May 16, 2006 (PD2), May 22, 2006
(PD3) and May 27, 2006 (PD4).
The experiment was laid out as a Randomized Complete Block Design,
with planting date as the treatment and replicated 4 times. 2 seeds of
maize were planted per hole and later thinned ten days after emergence to
one plant per stand. The maize variety was SAMMAZ 14 (Obatanpa)
Fertilizer application rates were 60kg N, 30 kg P and 30 kg K ha-1; applied
12 days after planting when soil was moist enough from rain water. The
fertilizer used was N.P.K 15:15:15 fertilizer brand.
Thirty five days after planting, the maize was top dressed with urea (46%
N) at the rate of 60 kg N ha-1. The plant spacing was 75cm x 25cm.

Plant Sampling and Measurements Records of crop emergence and daily records of weather parameters
(maximum air temperature, minimum air temperature, relative
humidity, wind speed and rainfall) were collected close to the
experimental site.
Records of date of planting, date of emergence (>50%), date of
thinning, plant population after thinning were recorded. Destructive
plant sampling commenced from emergence and was subsequently
carried out at two week intervals. Plant stands from plot areas outside
the designated final harvest area were sampled, oven-dried and
weighed to obtain their dry matter.
Whole plant leaves were also detached and measured for leaf area.
Yield and yield parameters recorded included days to first bud
appearance, first flower appearance, 50% tasseling, 50% silking, 50%
flowering, 50% cob filling and physiological maturity.
Others included date of harvest, Plant stand per plot, number of leaves
on stem, number of grains per maize cob, grain weight per plot at
harvest and haulm/stover weight per plot at harvest.

Evaluation of the model The CSM-CERES-Maize model was calibrated with the data
obtained from the field experiment for the treatment that consisted
of four planting dates of SAMMAZ 14 (Obatanpa) maize variety.
The cultivar coefficients were determined sequentially, starting
with phenological parameters followed by the grain filling
parameters and finally total biomass and grain yield (Hunt and
Boote, 1998).
The experimental data collected were used for model evaluation.
As part of the calibration and evaluation process the simulated data
for physiological maturity date, leaf area index, dry shoot weight,
grain yield and harvest index were compared with the observed
values.

Statistical analysis of model data and maize yield prediction The statistical index used for model calibration and evaluation is the root
mean square error (RMSE) method (Wallach and Goffinet, 1987). A simple way of
expressing error is to express root mean square error as percentage of means of
observation often referred to as normalized RMSE (n-RMSE)
The simulation is considered excellent with a PE less than 10 %, good if
greater than 10% and less than 20%, fair if greater than 20% and less than 30%,
and poor if greater than 30% (Jamieson et al., 1991).
The equations are as written below:
RMSE = √ [ ∑ (Pi-Oi)2/n] (1)
PE = RMSE / Ō x 100 (2)
Where RMSE = Root mean square error, Pi = predicted value, Oi = observed
value, Ō = mean of observed value, n = number of replicates/locations, ∑ =
Summation sign and √ = Square root sign.
Maize yield forecasts were computed using 15 years (2007-2022) daily weather
data generated from MarkSimTM GCM-DSSAT weather file generator using the
Representative Concentration Pathway - RCP 2.6 (RCP 3PD) climate change
scenario and used to predict maize performance over 2007-2022 period. The RCP
2.6 was developed by the IMAGE modeling team of the PBL Netherlands
Environmental Assessment Agency.

Results and Discussion
Profile
depth
SMH SLL DUL SSAT RGF SSKS SBD Clay Silt Sand Textura
l Class
pH TOC TN Avail
P
0 -18 AP1 0.133 0.257 0.357 0.9 2.92 1.63 150 440 410 L 5.7 0.60 0.11 -99
18 -33 AP2 0.169 0.291 0.361 0.5 5.47 1.71 210 440 370 L 5.5 0.24 0.17 -99
33 – 57 BT1 0.214 0.334 0.363 0.2 0.97 1.64 310 380 310 CL 5.6 0.26 0.06 -99
57 - 84 BT2 0.196 0.318 0.366 0.1 1.87 1.50 430 320 250 C 5.8 0.17 0.4 -99
84 – 112 BT3 0.178 0.298 0.357 0.1 9.82 1.41 430 320 250 C 5.9 0.17 0.4 -99
112 – 141 BT4 0.152 0.277 0.367 0.0 3.00 1.45 390 360 250 CL 5.5 0.13 0.2 -99
141 - 180 BT5 0.240 0.358 0.373 0.0 3.25 1.45 390 360 250 CL 5.6 0.13 0.2 -99
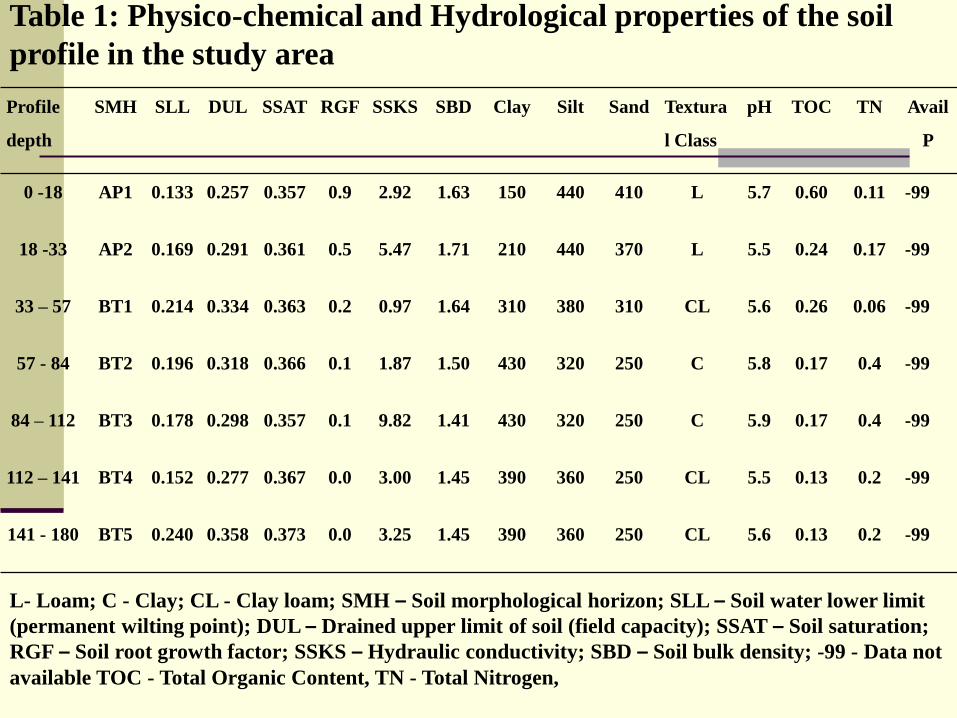
Table 1: Physico-chemical and Hydrological properties of the soil
profile in the study area
L- Loam; C - Clay; CL - Clay loam; SMH – Soil morphological horizon; SLL – Soil water lower limit
(permanent wilting point); DUL – Drained upper limit of soil (field capacity); SSAT – Soil saturation;
RGF – Soil root growth factor; SSKS – Hydraulic conductivity; SBD – Soil bulk density; -99 - Data not
available TOC - Total Organic Content, TN - Total Nitrogen,
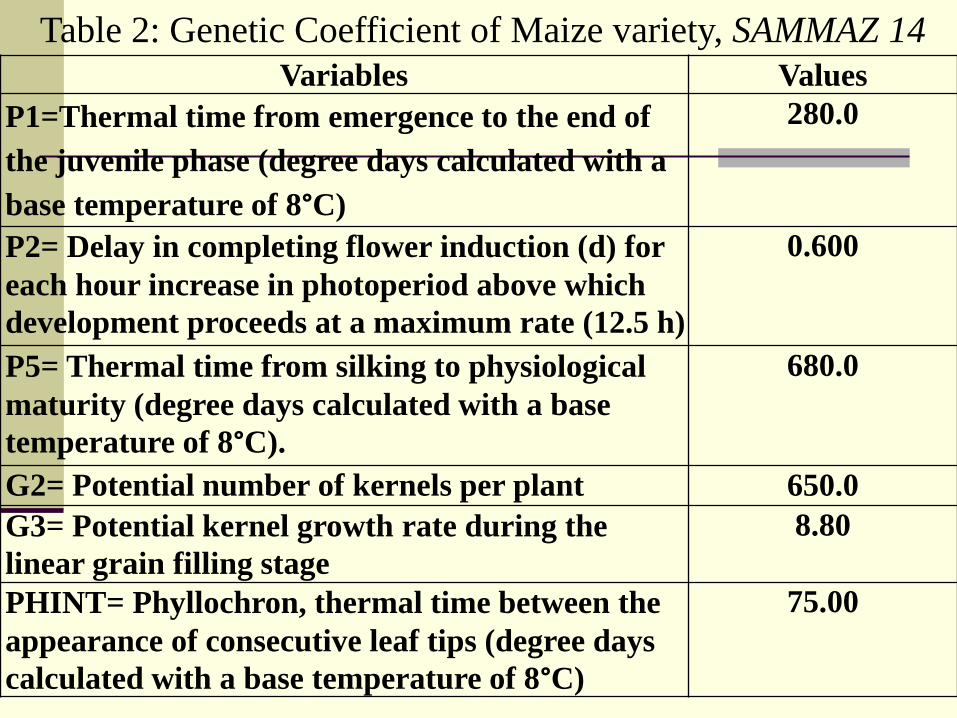
Variables Values
P1=Thermal time from emergence to the end of
the juvenile phase (degree days calculated with a
base temperature of 8°C)
280.0
P2= Delay in completing flower induction (d) for
each hour increase in photoperiod above which
development proceeds at a maximum rate (12.5 h)
0.600
P5= Thermal time from silking to physiological
maturity (degree days calculated with a base
temperature of 8°C).
680.0
G2= Potential number of kernels per plant 650.0
G3= Potential kernel growth rate during the
linear grain filling stage 8.80
PHINT= Phyllochron, thermal time between the
appearance of consecutive leaf tips (degree days
calculated with a base temperature of 8°C)
75.00
Table 2: Genetic Coefficient of Maize variety, SAMMAZ 14

Variable Simulated Measured % error (PE)
1st Planting Date
Physiological maturity day (dap) 98 96 2.08
Yield at harvest maturity (kg [dm] 4018 4134 2.81
Tops weight at maturity (kg [dm]/ha 8787 8289 6.01
Leaf area index, maximum 1.53 1.54 0.65
Harvest index at maturity 0.46 0.43 6.98
2nd Planting Date
Physiological maturity day (dap) 96 97 1.03
Yield at harvest maturity (kg [dm] 4076 4187 2.65
Tops weight at maturity (kg [dm]/ha 9069 9178 1.19
Leaf area index, maximum 1.52 1.51 0.66
Harvest index at maturity 0.45 0.42 7.14
3rd Planting Date
Physiological maturity day (dap) 99 98 1.02
Yield at harvest maturity (kg [dm] 4032 4084 1.27
Tops weight at maturity (kg [dm]/ha 8902 8949 0.53
Leaf area index, maximum 1.54 1.52 1.32
Table 3. Main growth and development variables at
different planting dates

Variable Simulated Measured % error (PE)
4th Planting Date
Physiological maturity day (dap) 100 100 0.0
Yield at harvest maturity (kg [dm] 3981 4047 1.63
Tops weight at maturity (kg [dm]/ha 8906 9013 1.19
Leaf area index, maximum 1.59 1.57 1.27
Harvest index at maturity 0.45 0.42 7.14
Table 3 contd.: Main growth and development variables at different
planting dates

0
0.2
0.4
0.6
0.8
1
1.2
1.4
1.6
1.8L
eaf
are
a i
nd
ex
Predicted year
12-May
16-May
22-May
27-May
Fig. 1. Trend of predicted maize maximum leaf area over
years as influenced by planting date

0
2000
4000
6000
8000
10000
12000S
ho
ot
weig
ht
(kg
/ha)
Predicted year
12-May
16-May
22-May
27-May
Fig. 2. Trend of predicted maize shoot dry weight over the
years as influenced by planting date
85
90
95
100
105
110
115
120
Days t
o p
hysio
log
ical
matu
rity
Predicted year
12-May
16-May
22-May
27-May
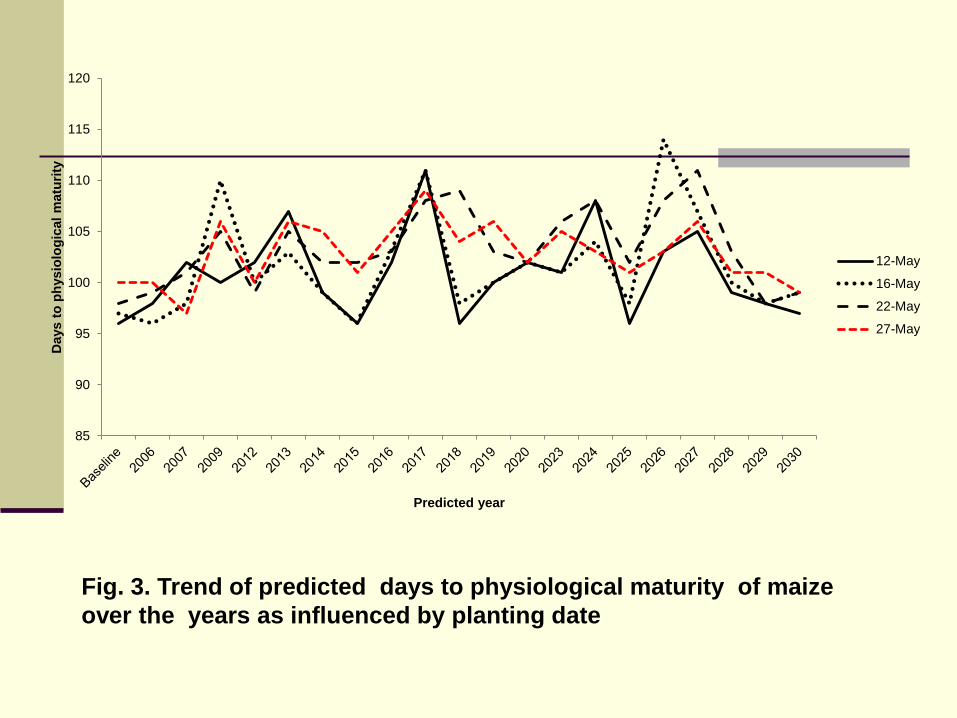
Fig. 3. Trend of predicted days to physiological maturity of maize
over the years as influenced by planting date

0
1000
2000
3000
4000
5000
6000
Gra
in y
ield
(kg
/ha)
Predicted year
12-May
16-May
22-May
27-May
Fig. 4. Trend of predicted maize yield over the years as influenced by
planting date

0
0.1
0.2
0.3
0.4
0.5
0.6
0.7
Harv
est
ind
ex
Predicted year
12-May
16-May
22-May
27-May

CONCLUSIONS The CSM-CERES-Maize model was able to accurately simulate phenology
and yield of SAMMAZ grown during the rainy season in a northern Guinea
savanna agroecological environment in Nigeria. In general, total biomass
and LAI were also reasonably well simulated.
For both rainfed maize production, average grain yield decreased with
later planting dates.
This study also showed that the CSM-CERES-Maize model can be a
promising tool for yield forecasting for rain-fed maize varieties grown in
the Nigerian Guinea savanna within predicted planting windows.
This information is considered to be timely and useful for decision
makers, farmers, climate-smart agriculture with veritable platform for
precision agricultural practitioners and weather index insurance
providers.
Further research is needed to apply this methodology to different
locations in order to be able to make practical decisions with respect to
grain stock management. Additional model calibration and evaluation
might also be needed for other varieties of high value rain-fed crops
varieties used by farmers.

Acknowledgements
The Commission for Agricultural Meteorology
(CAgM), World Meteorological Organization (WMO)
and the Korea Meteorological Administration
(KMA) are highly appreciated for this inaugural
workshop and for the invitation and sponsorship
in respect of my participation.
The Nigerian Meteorological Agency (NIMET) for
providing information and opportunity to
participate in this workshop.
Thank you all for listening.