application of complexity science - confex of complexity science neil cantle, ... introduction to...
TRANSCRIPT

Risk Architecture: Application of Complexity Science
Neil Cantle, Principal, [email protected]
Risk Architecture, Washington, DC, April18, 2012 2
Table of Contents
Background
The nature of risk
The sciences of complexity
Risk Appetite
Emerging Risk

Risk Architecture, Washington, DC, April18, 2012 3
BACKGROUND
Unravelling the complexities of risk
Risk Architecture, Washington, DC, April18, 2012 4
Why is studying risk so difficult?
Joining inputs to outputs is hardEffects are highly non-linearEverything is highly interconnectedHeuristics seem to become outdated quickly
Typical tools not really ideal– Reductionist– Linear– Single characteristic– Statistical
Risk Architecture, Washington, DC, April18, 2012 5
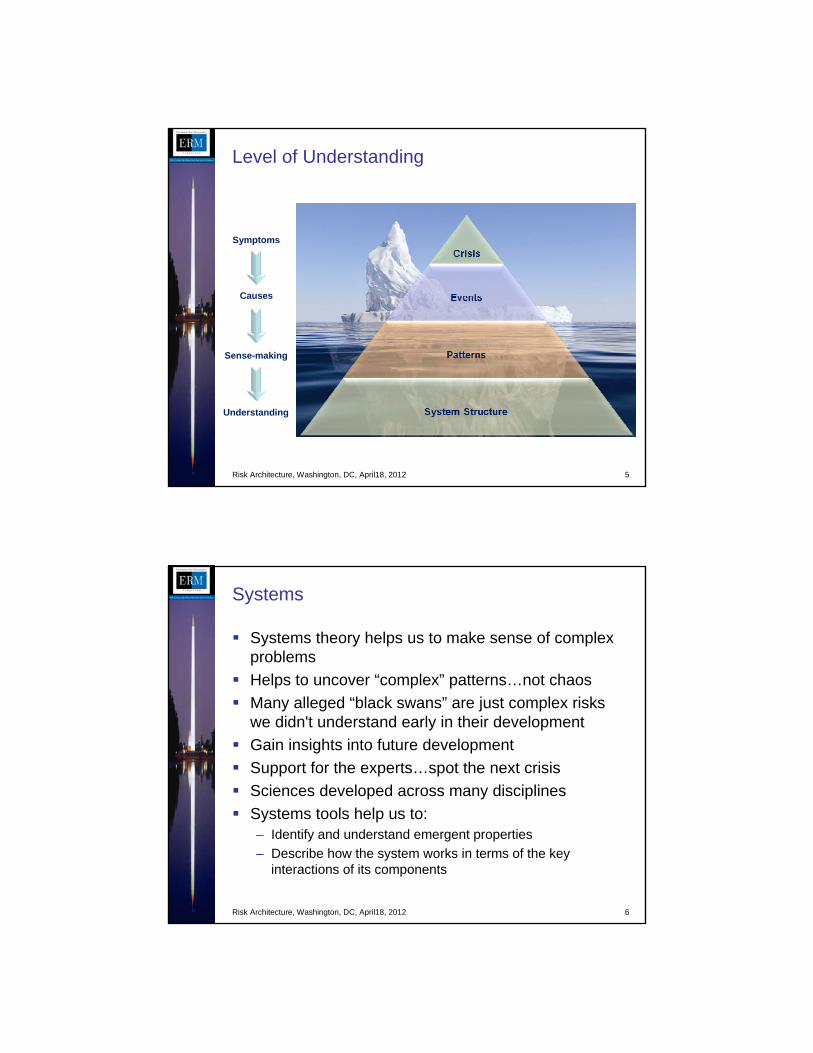
Level of Understanding
Symptoms
Causes
Sense-making
Understanding
Risk Architecture, Washington, DC, April18, 2012 6
Systems
Systems theory helps us to make sense of complex problemsHelps to uncover “complex” patterns…not chaosMany alleged “black swans” are just complex risks we didn't understand early in their developmentGain insights into future developmentSupport for the experts…spot the next crisisSciences developed across many disciplinesSystems tools help us to:– Identify and understand emergent properties– Describe how the system works in terms of the key
interactions of its components

Risk Architecture, Washington, DC, April18, 2012 7
Introduction to Systems
A set of components interconnected for a purpose
Input
Output
Risk Architecture, Washington, DC, April18, 2012 8
Complex System – Feedback, subsystems, etc.
Input
Output
Input
Output
Introduction to Systems
Risk Architecture, Washington, DC, April18, 2012 9
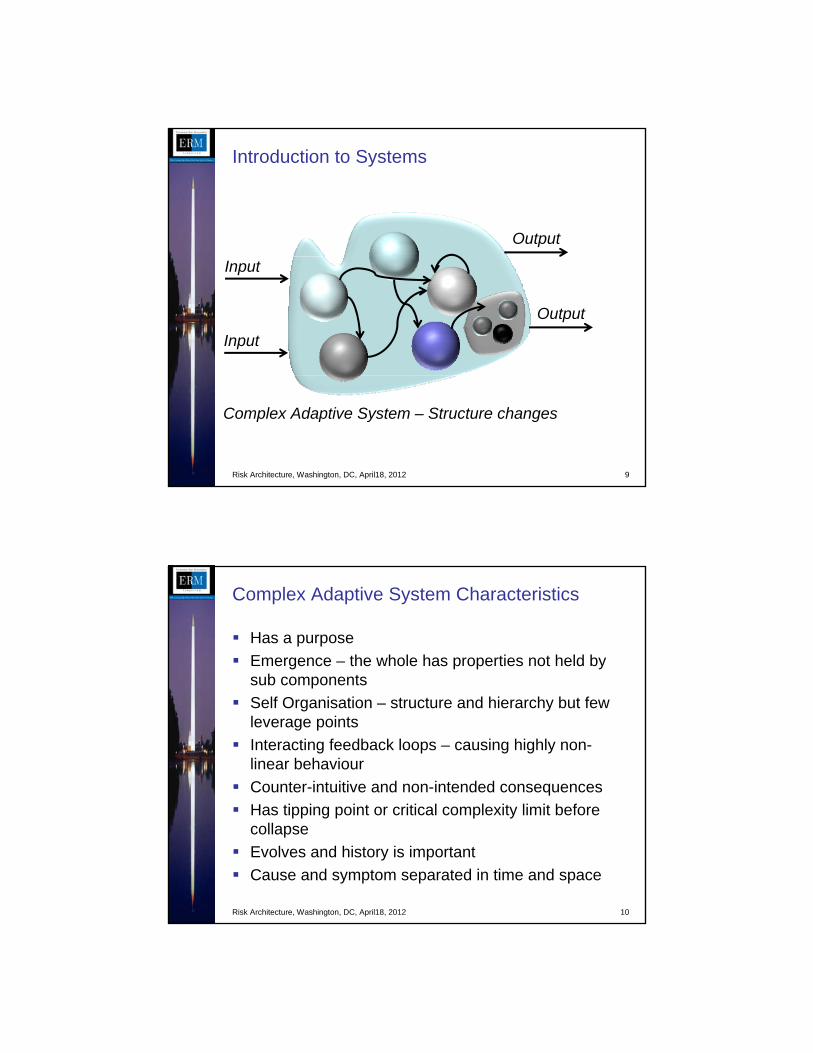
Introduction to Systems
Complex Adaptive System – Structure changes
Input
Output
Input
Output
Risk Architecture, Washington, DC, April18, 2012 10
Complex Adaptive System Characteristics
Has a purposeEmergence – the whole has properties not held by sub components Self Organisation – structure and hierarchy but few leverage pointsInteracting feedback loops – causing highly non-linear behaviourCounter-intuitive and non-intended consequencesHas tipping point or critical complexity limit before collapseEvolves and history is importantCause and symptom separated in time and space

Risk Architecture, Washington, DC, April18, 2012 11
Complexity from simple rules
Source: http://en.wikipedia.org/wiki/Double_pendulum
Equations of motion (where L denotes the Lagrangian, KE-PE)
Centres of mass:
Risk Architecture, Washington, DC, April18, 2012 12
RISK APPETITE
Linking inputs and outputs

Risk Architecture, Washington, DC, April18, 2012 13
Risk Appetite
Uncertainty = absence of precise and complete knowledge leading to consensus of future stateRisk = state of uncertainty for a participant where some of the possibilities involve an undesirable outcome (e.g. loss)Risk Appetite = “our comfort and preference for accepting a series of interconnected uncertainties related to achieving our strategic goals”Risk Limits = operational restrictions intended to maintain performance within risk appetite
Risk Architecture, Washington, DC, April18, 2012 14
Risk Appetite
Three main components:
Also need to specify which sources of uncertainty are un/acceptable (risk preferences)Need to understand how various factors cause variation in the outcome
Planned range of outcomes
Minimum acceptable outcomeReturn
period

Risk Architecture, Washington, DC, April18, 2012 15
The Risk Appetite Problem
Need to constrain multiple inputs...
...producing multiple outputs to be kept within appetite
...which flow through multiple complex adaptive interactions...
It is essentially a large, complex multi-objective optimisation and control challenge
Risk Architecture, Washington, DC, April18, 2012 16
Risk Appetite
Looked for a solution which can...– Cope with non-linear dependencies– Adapt and learn– Be communicated effectively to a wide range of
stakeholders– Suit a wide range of firms

Risk Architecture, Washington, DC, April18, 2012 17
Risk Appetite Process
Agree business goals for which uncertainty mattersDescribe how much uncertainty you are comfortable withIdentify the possible sources of uncertaintyDescribe how that system worksEstablish limits which maintain performance within desired range of uncertaintyCycle of measuring risk capacity and resource utilisation against appetite
Risk Architecture, Washington, DC, April18, 2012 18
Joining Top And Bottom
Use a combination of cognitive and data-driven methodsLeverage expert knowledge (using cognitive mapping)Technique can be easily embedded within ORSA/planning processResulting model remains in the language/style of the contributorsExplicitly links to Internal Model for Solvency II

Risk Architecture, Washington, DC, April18, 2012 19
Understanding The SystemKey Nodes
Key Drivers
Gaps
Rapidly elicit highly detailed description of risk profile and implicit dynamics
Risk Architecture, Washington, DC, April18, 2012 20
Sources of risk
Model links risk characteristics and indicators
Implemented in AgenaRisk™

Risk Architecture, Washington, DC, April18, 2012 21
Setting Appetite
Use propagation properties of Bayesian Networks
Setting an outcome here...
...tells us what the states ought to be here
Risk Architecture, Washington, DC, April18, 2012 22
Propagating evidence
Setting desired appetite level translates into information about underlying limitsE.g. Counterparty credit...

Risk Architecture, Washington, DC, April18, 2012 23
Monitoring
Use propagation properties of Bayesian Networks
...gives us an estimate of risk level here
Entering observed values here...
Risk Architecture, Washington, DC, April18, 2012 24
Monitoring risk levels
Entering actual indicator values gives information about risk levels versus appetite

Risk Architecture, Washington, DC, April18, 2012 25
Risk Appetite
Proposed approach:– Embraces systems thinking approach– Is scalable from small/simple to large/complex– Can apply to any type of firm– Reacts naturally to emerging information– Provides a basis for setting AND monitoring limits– Can make use of expert knowledge until data available– Retains a form of use and interest to business people– Translates “risk” into business terms
Risk Architecture, Washington, DC, April18, 2012 26
Digression – Operational Risk
Hard to engage business in discussions about loss curves...
...Bayesian Networks provide a basis for retaining the business input

Risk Architecture, Washington, DC, April18, 2012 27
EMERGING RISK
Seeing the wood for the trees
Risk Architecture, Washington, DC, April18, 2012 28
Emerging Risk
Simple risks are easy(ish) to spot earlyComplex risks more difficult– Visible factors may not yet be obviously linked to risk
outcomes– Adaptation makes it hard to adjust monitoring to maintain
focus
Information
metrics
Cognitive techniques
Evolutionary techniques

Risk Architecture, Washington, DC, April18, 2012 29
Emerging Risk
Risk registers typically force the assignment of a label to each entryBut the entries are often not that simpleBy using a more granular labeling approach it is still possible to aggregate the informationTechnique from biology permits analysis of:– Which entries are “like” each other– Understanding of how risk scenario characteristics evolve– Clues about potential future scenarios
Risk Architecture, Washington, DC, April18, 2012 30
An overview of Evolutionary Risk Approach
Enterprise risk as an evolutionary processHow can we model the risk evolution process What insight can evolution of risks provide– A rigorous classification system with relationships– A guide to emerging, dynamic and systemic risks– A unique organizational risk lineage

Risk Architecture, Washington, DC, April18, 2012 31
Overview of Cladistics and Phylogeny
This methodology identifies small groups of highly related risks which share a common ancestorThe evolutionary history of each of these groups can then be accurately tracedThen their relation to other groups investigatedBy understanding the phylogeny of the risks we can:– Determine where evolution is most prolific – Detail path dependency and co-evolution of risk– Identify the most active characteristics to manage– Create focused scenarios for emerging risk modelling
Risk Architecture, Washington, DC, April18, 2012 32
Cladistic approach
ScenarioCharacteristics
1 2 3 4 5 6
A N N N N N NB Y Y N N N YC Y N Y Y Y YD Y N Y N Y N
Most parsimonious solution
Risk Architecture, Washington, DC, April18, 2012 33
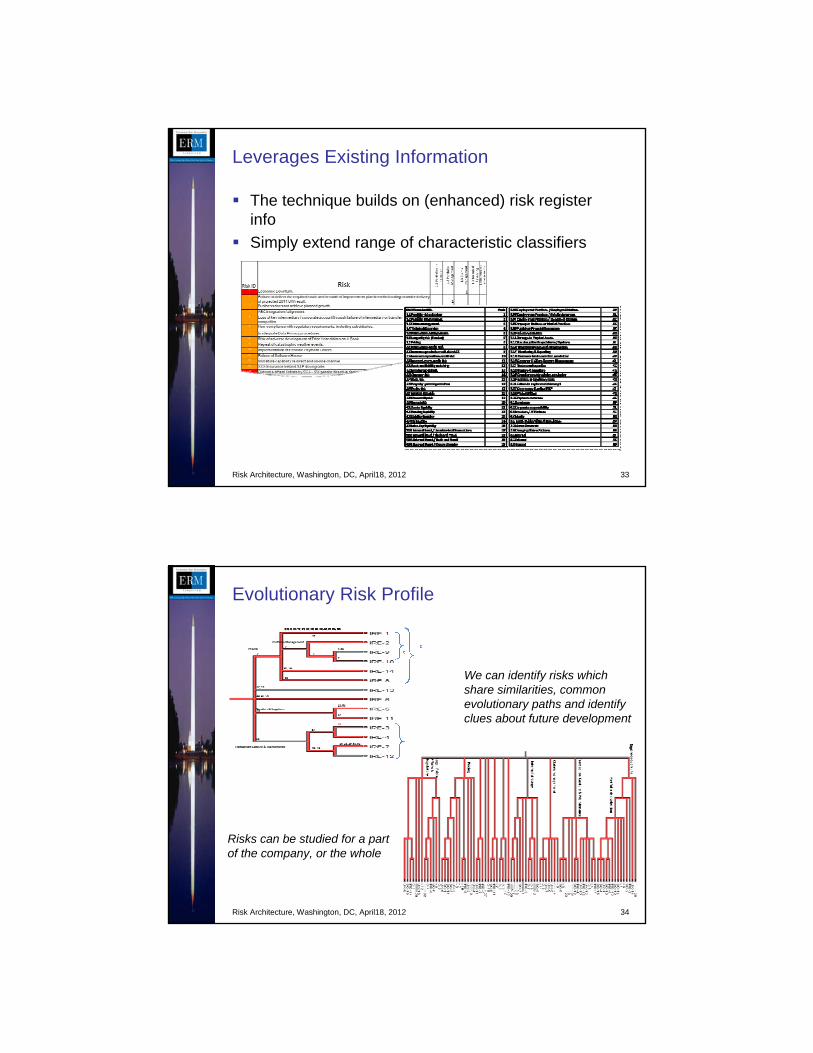
Leverages Existing Information
The technique builds on (enhanced) risk register infoSimply extend range of characteristic classifiers
Risk Architecture, Washington, DC, April18, 2012 34
Evolutionary Risk Profile
We can identify risks which share similarities, common evolutionary paths and identify clues about future development
Risks can be studied for a part of the company, or the whole

Risk Architecture, Washington, DC, April18, 2012 35
Risk Profile
BU 1
BU 2
BU 3BU 4
BU 5
Risk Architecture, Washington, DC, April18, 2012 36
Interpreting Evolutionary Properties
Look at tree shape– areas of cascading bifurcation are likely areas for more
evolution and therefore emerging risks
Identify branches that have the most characters/adaptation– They are more likely to adapt again
Find characters that evolve most frequently– Is there a character or pattern that is responsible?
Are any risks/branches losing characters, ask why?– Risks should generally increase in complexity
Are there any characters gained in sequence/coevolution? – Understand this pattern as a possible clue to new risks

Risk Architecture, Washington, DC, April18, 2012 37
Summary
Systems approach helps to study the complexity before making simplificationsHelps to triangulate multiple insights (data, experts, etc.)Helps to incorporate adaptation and non-linearityThink of companies as a collection of people not machinesFocus on outcomes not just the “how”